Assessment of benthic ecosystem functioning through trophic web
15
ORIGINAL ARTICLE Assessment of benthic ecosystem functioning through trophic web modelling: the example of the eastern basin of the English Channel and the Southern Bight of the North Sea Cle ´ ment Garcia 1,2,3 , Pierre Chardy 4 , Jean-Marie Dewarumez 1,2,3 & Jean-Claude Dauvin 5 1 Universite ´ de Lille Nord de France, Lille, France 2 Universite ´ Lille1, LOG, Wimereux, France 3 CNRS, UMR8187, Wimereux, France 4 Station Marine d’Arcachon, Universite ´ de Bordeaux1, UMR 5805 EPOC-OASU, Arcachon, France 5 Universite ´ de Caen Basse Normandie, Laboratoire Morphodynamique Continentale et Co ˆ tie ` re, UMR CNRS 6143 M2C, Caen, France Keywords English Channel; functional unit; North Sea; soft-bottom communities; trophic web. Correspondence Cle ´ ment Garcia, centre for Environment, Fisheries and Aquaculture Science, Lowestoft Laboratory, Pakefield Road, Lowestoft, Suffolk, NR33 OHT, UK. E-mail: [email protected] Accepted: 15 December 2010 doi:10.1111/j.1439-0485.2011.00428.x Abstract Benthic organisms appear to be accurate proxies for assessing coastal ecosystem structures and changes due to climatic and anthropogenic stresses. Functional studies of benthic systems are relatively recent, mainly because of the difficul- ties in obtaining the basic parameters for each benthic compartment (i.e. detri- tus, bacteria, meiofauna and macrofauna). Our study focuses on the eastern basin of the English Channel and the Southern Bight of the North Sea. Trophic web modelling was used to assess the functioning of the three main benthic community assemblages. To test and assess the relative importance of factors assumed to influence trophic structure (geographical environment and sedi- mentary particle size distribution), the study area was subdivided into divisions defined a priori according to the two main structural factors of community dis- tribution; geographic distribution and sedimentary patterns. Then, a steady state trophic model utilising the inverse method was applied to a diagram composed of eight compartments, including detritus, bacteria, meiofauna, mac- robenthos and fish. For each compartment, six physiological parameters were assessed, based on our own data, empirical relationships and literature data. This method allowed estimation of the flux of matter and energy within and between the units of the benthic system and assessment of the amount of tro- phic energy stored in these units (available mostly to fish). Our results showed that suspension-feeders control most of the matter transfer through the macro- benthic food-web, except in the fine sand community, where deposit-feeders play a dominant role. The results also showed that, whatever the geographic area, trophic structure is strongly linked to the sedimentary conditions. As ben- thic communities are connected through hydrodynamics, a model of the entire eastern basin of the English Channel would appear to be acceptable. However, the main sediment types must be taken into account when establishing rela- tionships between the functional units. Marine Ecology. ISSN 0173-9565 72 Marine Ecology 32 (Suppl. 1) (2011) 72–86 ª 2011 Blackwell Verlag GmbH
Transcript of Assessment of benthic ecosystem functioning through trophic web

ORIGINAL ARTICLE
Assessment of benthic ecosystem functioning throughtrophic web modelling: the example of the eastern basinof the English Channel and the Southern Bight of the NorthSeaClement Garcia1,2,3, Pierre Chardy4, Jean-Marie Dewarumez1,2,3 & Jean-Claude Dauvin5
1 Universite de Lille Nord de France, Lille, France
2 Universite Lille1, LOG, Wimereux, France
3 CNRS, UMR8187, Wimereux, France
4 Station Marine d’Arcachon, Universite de Bordeaux1, UMR 5805 EPOC-OASU, Arcachon, France
5 Universite de Caen Basse Normandie, Laboratoire Morphodynamique Continentale et Cotiere, UMR CNRS 6143 M2C, Caen, France
Keywords
English Channel; functional unit; North Sea;
soft-bottom communities; trophic web.
Correspondence
Clement Garcia, centre for Environment,
Fisheries and Aquaculture Science, Lowestoft
Laboratory, Pakefield Road, Lowestoft,
Suffolk, NR33 OHT, UK.
E-mail: [email protected]
Accepted: 15 December 2010
doi:10.1111/j.1439-0485.2011.00428.x
Abstract
Benthic organisms appear to be accurate proxies for assessing coastal ecosystem
structures and changes due to climatic and anthropogenic stresses. Functional
studies of benthic systems are relatively recent, mainly because of the difficul-
ties in obtaining the basic parameters for each benthic compartment (i.e. detri-
tus, bacteria, meiofauna and macrofauna). Our study focuses on the eastern
basin of the English Channel and the Southern Bight of the North Sea. Trophic
web modelling was used to assess the functioning of the three main benthic
community assemblages. To test and assess the relative importance of factors
assumed to influence trophic structure (geographical environment and sedi-
mentary particle size distribution), the study area was subdivided into divisions
defined a priori according to the two main structural factors of community dis-
tribution; geographic distribution and sedimentary patterns. Then, a steady
state trophic model utilising the inverse method was applied to a diagram
composed of eight compartments, including detritus, bacteria, meiofauna, mac-
robenthos and fish. For each compartment, six physiological parameters were
assessed, based on our own data, empirical relationships and literature data.
This method allowed estimation of the flux of matter and energy within and
between the units of the benthic system and assessment of the amount of tro-
phic energy stored in these units (available mostly to fish). Our results showed
that suspension-feeders control most of the matter transfer through the macro-
benthic food-web, except in the fine sand community, where deposit-feeders
play a dominant role. The results also showed that, whatever the geographic
area, trophic structure is strongly linked to the sedimentary conditions. As ben-
thic communities are connected through hydrodynamics, a model of the entire
eastern basin of the English Channel would appear to be acceptable. However,
the main sediment types must be taken into account when establishing rela-
tionships between the functional units.
Marine Ecology. ISSN 0173-9565
72 Marine Ecology 32 (Suppl. 1) (2011) 72–86 ª 2011 Blackwell Verlag GmbH

Introduction
Ecosystem functioning has become one of the main fields
of interest in marine ecology (see Hooper et al. 2005 for a
review). According to Christensen et al. (1996), ecosystem
functioning includes three main phenomena: ecosystem
properties (i.e. the different functional compartments of an
ecosystem and the rates of the processes that link the com-
partments together), ecosystem goods (i.e. the direct mar-
ket values of an ecosystem) and ecosystem services (i.e. the
direct or indirect benefits that ecosystems provide to
humans). Marine benthic communities were initially
assessed using qualitative methods that identify the taxo-
nomic composition of the community. Although such
methods highlight environmental stress (Bilyard 1987) such
as resistance to anthropogenic disturbances (Pearson &
Rosenberg 1978), it is quite difficult to obtain information
about the functioning of the ecosystem from these methods
(Warwick et al. 2002). However, other methods based on
quantitative examination have been developed to better
investigate the function of benthic invertebrates in the
ecosystem. These new tools include work on mesocosms
(Solan et al. 2003), biological traits analysis (Bremner et al.
2006) or trophic web modelling (Chardy & Dauvin 1992).
The trophic web modelling tool appears to be essential for
synthesising data, developing theories and discriminating
between alternative competing explanations of how
ecosystems function (Underwood 1990, 1996). Among the
different trophic web models already developed, steady-
state ⁄ dynamic-process models provide the most explicit
representation of trophic interaction (Whipple et al. 2000),
particularly the steady-state inverse model (Chardy 1987;
Vezina & Platt 1988; Vezina 1989).
The benthic communities in the eastern English Chan-
nel have been widely studied using both qualitative
descriptive methods (Dauvin 1997a) and quantitative
analyses (Kaiser et al. 1998; Ellien et al. 2000; Newell
et al. 2001). However, few studies have addressed trophic
relationships in this area, with those that have, focusing
on local scales only (the Bay of Somme, Rybarczyk et al.
2003, and the Bay of Seine, Rybarczyk & Elkaim 2003). In
this context, there is a need for large-scale assessment of
energy flow and trophic structure of the system, which
can be well approximated using trophic web modelling.
The main objective of this study was to test whether the
trophic structure of benthic communities, through the rela-
tionships among benthic invertebrates, depends mainly on
geography or on sediment type. Both of these factors are
considered to have a strong correlation with hydrodynamic
patterns, which influence the organisation of the benthic
communities in the area (Dauvin 1997a). We utilised the
inverse model simulation technique for this purpose, which
estimates carbon flows through the benthic ecosystem; this
was done using the quantitative dataset for a large spatial
area in the eastern basin of the English Channel.
Material and methods
Study site
The area studied is the eastern basin of the English Chan-
nel and the southern part of the North Sea, called the
Southern Bight. This epicontinental sea is a shallow water
zone (maximum 50 m) that is subjected to a variety of
hydrodynamic forces. The tidal range in the area is high,
reaching about 9 m on the French coast of the Bay of
Somme (Salomon & Breton 1991). The tidal current
velocities are highly variable, usually being stronger near
the French coast than the English coast (Salomon & Bre-
ton 1991). The water generally moves from the English
Channel to the North Sea, although a long period of
strong easterly winds can reverse this trend (Salomon &
Breton 1991). These patterns are also modified by coastal
geography and the presence of three estuaries (the Seine
estuary, the Somme estuary and the Scheldt-Rhine-Meuse
estuary complex). Local hydrodynamics creates particular
structures, such as the gyres that retain the water masses
in a restricted zone near the Barfleur Cape in the north-
western part of the Bay of Seine and the Isle of Wright.
The particle size of the sediment is strongly correlated
with the hydrodynamics described above, with a sedimen-
tary gradient (Fig. 1) ranging from coarse sediments in
the middle of the Dover Strait to fine sediments in the
area’s bays and estuaries (Larsonneur et al. 1982). This
differential sedimentation leads to a bio-sedimentary gra-
dient from pebbles and gravel to fine sand in the places
where five main communities have been identified previ-
ously (Cabioch & Glacon 1975, 1977; Cabioch et al.
1978): (i) the pebble and gravel community with sessile
epifauna and Ophiothrix fragilis (Echinodermata); (ii) the
coarse sand community with Branchiostoma lanceolatum
(Cephalochordata); (iii) the fine-to-medium clean sand
community with Ophelia borealis (Polychaeta); (iv) the
muddy fine sand community with Abra alba (Mollusca);
and (v) the ‘muddy heterogeneous’ community with a
mix of species from the pebble and gravel community,
the coarse sand community and the muddy fine sand
community. Additionally, the offshore English Channel is
mainly composed of coarse sand to pebble substrates,
whereas the fine sand is confined to bays and the littoral
fringe.
Sampling strategy
Macrofaunal material was collected between 2006 and
2008 in an area ranging from the eastern basin of the
Garcia, Chardy, Dewarumez & Dauvin Assessment of benthic ecosystem functioning
Marine Ecology 32 (Suppl. 1) (2011) 72–86 ª 2011 Blackwell Verlag GmbH 73

English Channel to the southern bight of the North Sea
(from 0� longitude to the Franco-Belgian border). The
main objective was to update the benthic invertebrate
knowledge 30 years after the first extensive benthic sam-
pling in the English Channel (during the RCP Manche
survey, Cabioch & Glacon 1975, 1977; Cabioch et al.
1978). The secondary objective was to supply the first
quantitative description of the benthic communities over
the entire area, to allow assessment of the trophic struc-
ture of the benthic communities and aid the complex
planning and decision-making required for managing
anthropogenic pressure in this dynamic area (Martin
et al. 2009).
Quantitative samples were taken with a 0.25-m2
Hamon grab (two samples for the macrobenthic fauna
and one sample for sediment). As our focus was on the
macrobenthic component of the total benthic biomass,
samples were sieved through a 2-mm mesh (which allows
more than 95% of macrobenthic biomass to be retained,
see Ghertsos 2002). The samples were then sorted, and
the organisms were identified to species level where feasi-
ble. Biomass was determined with the ash-free-dry-mass
method to reduce the variation within and between spe-
cies due to gut content (van der Meer et al. 2005).
To extend and improve the spatial resolution of the
study area, two other quantitative databases were also
included in this study. The first one covers the entire Bay
of Seine (see Ghertsos 2002 and Dauvin & Ruellet 2008
for details). The second covers the French coast from the
Pointe d’Ailly to the Belgium border (see Desroy et al.
2003 for details). Thus, a total of 403 quantitatively sam-
pled sites from the Bay of Seine to the Southern Bight
were available for trophic web analysis (Fig. 1). All mac-
rofaunal ⁄ sediment material was gathered and processed
using the same basic methods.
Modelling strategy
Many trophic web models have been applied to very large
spatial areas, such as the North Sea (Mackinson & Daska-
lov 2007), the Irish Sea (Lees & Mackinson 2007) and the
Baltic Sea (Harvey et al. 2003). To test whether such a
large-scale model would be appropriate for the eastern
basin of the English Channel, we examined trophic struc-
ture at different spatial scales. To accomplish this, an a
priori division of the area was made based on the two
main factors assumed to influence the benthic communi-
ties and their organisation (taking into account that the
sediment factor is influenced by hydrodynamics which, in
turn, is influenced by the geographic factor). The area
was split into three geographic divisions (Bay of Seine,
Dover Strait and North Sea) and three main sediment
divisions following the dominant sediment types in the
area (i.e. gravel and pebbles, coarse sand and fine sand)
5°W 4° 3° 2° 1° 0 1°E
51°N
50°
49°
0 50 100 Km
PebblesGravelsMedium sandGravely sand
Muddy fine sand
English Channel
U.K.
France
BS
DS
NS
Gravel and PebblesCoarse sandFine sand
Fig. 1. Distribution of superficial sediment in
the English Channel (from Larsonneur et al.
1982). Representation of the six geographic
and sediment divisions of the eastern part of
the English Channel and the Southern Bight
of the North Sea. NS, North Sea; DS, Dover
Strait; BS, Bay of Seine.
Assessment of benthic ecosystem functioning Garcia, Chardy, Dewarumez & Dauvin
74 Marine Ecology 32 (Suppl. 1) (2011) 72–86 ª 2011 Blackwell Verlag GmbH

(Fig. 1). Following Kroncke et al. (2004) and Kroncke
(2006), the expression ‘geography’ here refers to all envi-
ronmental variables acting over a spatial area (e.g. hydro-
dynamism, freshwater inputs, food supply and quality).
Simulations were then run for the three geographic divi-
sions and the three sediment divisions, and the outputs
from these simulations were compared. Simulations were
also run for each sediment type within the three geo-
graphic divisions. Thus, there were three sub-divisions for
each division, except for the Bay of Seine, which lacks
fine sand communities, resulting in a total of eight sub-
divisions in the study area.
Model formulation and principles
Trophic web structure was assessed using a trophic
inverse model originally introduced by Vezina & Platt
(1988) for the pelagic food-web of the English Channel
and the Celtic Sea, which since then has been used by a
number of authors in various marine ecosystems (Chardy
et al. 1993a,b; Niquil et al. 2001; Leguerrier et al. 2003).
The inverse method-based steady state model is a diag-
nostic method that, although it does not incorporate a
temporal dimension, can provide a comprehensive
description of the general trophic structure of an ecosys-
tem. Our model is composed of eight biotic and abiotic
compartments and is used to estimate the carbon flows
resulting from secondary benthic production (Chardy &
Dauvin 1992). The information required for direct esti-
mation of most of the flows in such a food-web model is
either not available or is very difficult to obtain. Thus, it
seems more appropriate to use the flow balance principle,
as the inputs are equal to the sum of the outputs and the
rate of the biomass standing stock is under steady-state
conditions (Vezina & Platt 1988).
This kind of inverse problem can be encountered in all
research fields where the number of observations is less
than the number of parameters that need to be known in
order to describe the system (Vezina & Platt 1988). To
solve this kind of inverse problem, Tarantola & Valette
(1982) have proposed three fundamental conditions:
• Having a given state of information about the values
of the observed parameters.
• Having information about the unknown parameters
(we assume that an a priori decision is made about
the unknown parameter values associated with an
interval of confidence).
• Having the necessary information about the theoreti-
cal relationships between known data and unknown
parameters.
In trophic web studies, the known data are estimations
of the biomass standing stock in each benthic compart-
ment (i.e. the biomass values of each compartment); the
unknown parameters are the physiological parameters
(e.g. ingestion rate, egestion rate). These parameter values
are taken from data reported in the literature and ⁄ or
from empirical relationships. From these data, a mean
value is calculated for each parameter, and the model
allows this value to move between an upper and a lower
bound, which are determined by the confidence interval
of the mean. The relationships linking these bounds are
mainly the trophic preferences. This method yields the
annual average of the carbon flows connecting the differ-
ent functional compartments.
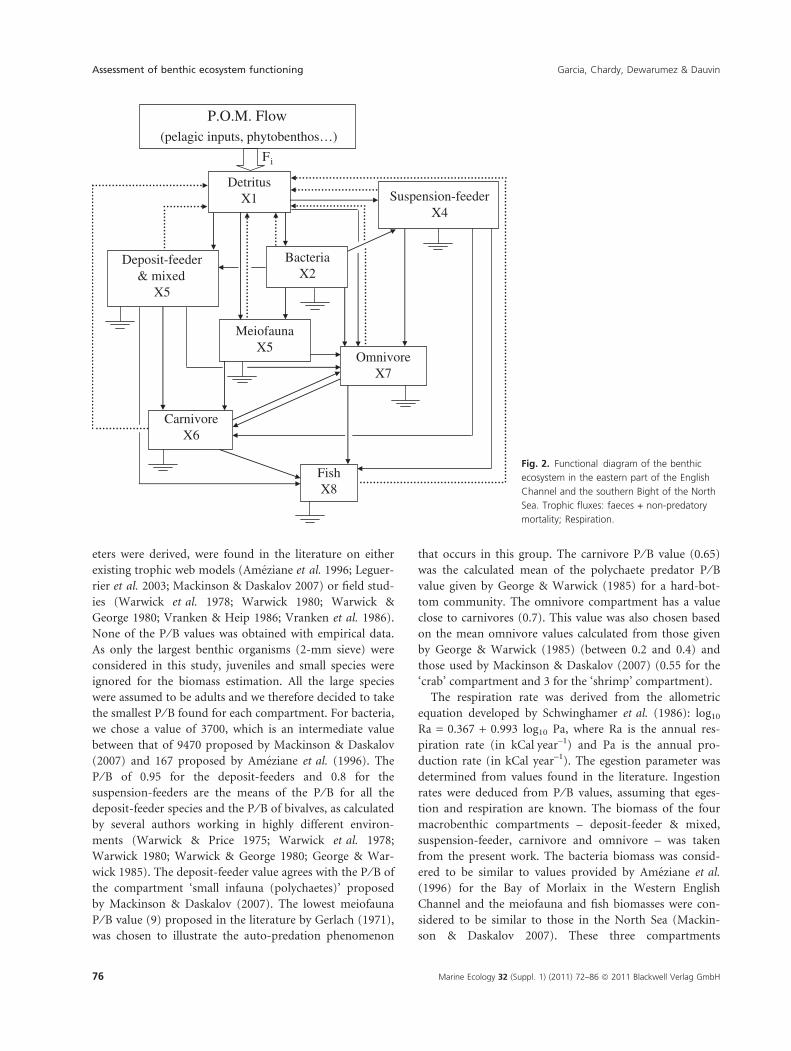
The functional diagram (Fig. 2) of the benthic com-
partment needs to be simple enough to fit the different
benthic communities but also accurate enough to express
the knowledge about the benthic compartments in the
eastern basin of the English Channel and the Southern
Bight of the North Sea. We define the functional com-
partments based on the available knowledge about the
trophic compartment and on the size of the benthic
organism (this criterion is mainly used to divide the ben-
thic organisms between macrofauna and meiofauna com-
partments). This is a steady-state model, an annual
average representation of biomasses and flows. Temporal
biomass variations are not considered (dX ⁄ dt) = 0. The
steady-state hypothesis is expressed by the general equa-
tion:
dXi
dt¼X
Fji�X
Fip ¼ 0
whereP
Fji, sum of the flows going from ‘j’ to ‘i’ (sum
of the inputs, consumption of ‘i’);P
Fip, sum of the
flows going from ‘i’ to the other compartment ‘p’ and to
the general outputs of the system (sum of outputs: predi-
tory mortality, non-preditory mortality, egestion and
respiration).
At the scale of compartments, the steady-state is
expressed by the balance of the processes:
dXi
dt¼Xm
j¼1
ðIi: Xi: Cji: ð1� EiÞÞ � ðMiþ RiÞXi
�Xn
p¼1
ðIp: Xp: CipÞ ¼ 0
where: j = 1…m, is m number of prey available for ‘i’;
p = 1…n, is n number of predators of ‘i’; Ii is annual
ingestion rate of ‘i’; Xi is the biomass of the compartment
‘i’; Cji is the feeding preference of the compartment ‘i’
for the resource ‘j’; Ei is the annual egestion rate of ‘i’;
Mi is the annual non-predatory mortality rate of ‘i’; and
Ri is the annual respiration rate of ‘i’.
The annual production ⁄ biomass (P ⁄ B) ratios for all
seven compartments, from which the physiological param-
Garcia, Chardy, Dewarumez & Dauvin Assessment of benthic ecosystem functioning
Marine Ecology 32 (Suppl. 1) (2011) 72–86 ª 2011 Blackwell Verlag GmbH 75
eters were derived, were found in the literature on either
existing trophic web models (Ameziane et al. 1996; Leguer-
rier et al. 2003; Mackinson & Daskalov 2007) or field stud-
ies (Warwick et al. 1978; Warwick 1980; Warwick &
George 1980; Vranken & Heip 1986; Vranken et al. 1986).
None of the P ⁄ B values was obtained with empirical data.
As only the largest benthic organisms (2-mm sieve) were
considered in this study, juveniles and small species were
ignored for the biomass estimation. All the large species
were assumed to be adults and we therefore decided to take
the smallest P ⁄ B found for each compartment. For bacteria,
we chose a value of 3700, which is an intermediate value
between that of 9470 proposed by Mackinson & Daskalov
(2007) and 167 proposed by Ameziane et al. (1996). The
P ⁄ B of 0.95 for the deposit-feeders and 0.8 for the
suspension-feeders are the means of the P ⁄ B for all the
deposit-feeder species and the P ⁄ B of bivalves, as calculated
by several authors working in highly different environ-
ments (Warwick & Price 1975; Warwick et al. 1978;
Warwick 1980; Warwick & George 1980; George & War-
wick 1985). The deposit-feeder value agrees with the P ⁄ B of
the compartment ‘small infauna (polychaetes)’ proposed
by Mackinson & Daskalov (2007). The lowest meiofauna
P ⁄ B value (9) proposed in the literature by Gerlach (1971),
was chosen to illustrate the auto-predation phenomenon
that occurs in this group. The carnivore P ⁄ B value (0.65)
was the calculated mean of the polychaete predator P ⁄ Bvalue given by George & Warwick (1985) for a hard-bot-
tom community. The omnivore compartment has a value
close to carnivores (0.7). This value was also chosen based
on the mean omnivore values calculated from those given
by George & Warwick (1985) (between 0.2 and 0.4) and
those used by Mackinson & Daskalov (2007) (0.55 for the
‘crab’ compartment and 3 for the ‘shrimp’ compartment).
The respiration rate was derived from the allometric
equation developed by Schwinghamer et al. (1986): log10
Ra = 0.367 + 0.993 log10 Pa, where Ra is the annual res-
piration rate (in kCalÆyear–1) and Pa is the annual pro-
duction rate (in kCal year–1). The egestion parameter was
determined from values found in the literature. Ingestion
rates were deduced from P ⁄ B values, assuming that eges-
tion and respiration are known. The biomass of the four
macrobenthic compartments – deposit-feeder & mixed,
suspension-feeder, carnivore and omnivore – was taken
from the present work. The bacteria biomass was consid-
ered to be similar to values provided by Ameziane et al.
(1996) for the Bay of Morlaix in the Western English
Channel and the meiofauna and fish biomasses were con-
sidered to be similar to those in the North Sea (Mackin-
son & Daskalov 2007). These three compartments
P.O.M. Flow(pelagic inputs, phytobenthos…)
CarnivoreX6
Fi
MeiofaunaX5
BacteriaX2
Deposit-feeder & mixed
X5
Suspension-feederX4
OmnivoreX7
FishX8
DetritusX1
Fig. 2. Functional diagram of the benthic
ecosystem in the eastern part of the English
Channel and the southern Bight of the North
Sea. Trophic fluxes: faeces + non-predatory
mortality; Respiration.
Assessment of benthic ecosystem functioning Garcia, Chardy, Dewarumez & Dauvin
76 Marine Ecology 32 (Suppl. 1) (2011) 72–86 ª 2011 Blackwell Verlag GmbH

Tab
le1.
Mai
nch
arac
terist
ics
of
the
funct
ional
com
par
tmen
tsof
the
diffe
rent
div
isio
ns
and
sub-d
ivis
ions
inth
eea
ster
npar
tof
the
Englis
hC
han
nel
and
the
South
ern
Big
ht
of
the
Nort
hSe
aan
d
valu
esof
bio
tic
rate
suse
din
the
sim
ula
tions.
BP
⁄BI
RM
EB
P⁄B
IR
ME
BP
⁄BI
RM
E
NS
B0.1
73700
1100
0.0
73
0.2
4–
DS
0.1
73700
1100
0.0
80.2
4–
BS
0.1
73700
1100
0.0
80.2
4–
DF&
M0.0
86
0.9
534.7
0.1
90.2
0.7
0.0
51
0.9
534.5
0.1
13
0.2
0.7
30.0
40.9
536
0.0
89
0.2
0.6
5
S0.1
54
0.8
93
0.2
98
0.2
0.5
0.5
85
0.9
41.2
0.2
0.5
0.2
30.8
45
0.4
40
0.2
0.4
7
Me
0.0
83
920.4
1.3
00
0.2
0.4
50.0
83
918.4
1.2
0.2
0.4
50.0
83
918
1.0
50.2
0.5
C0.0
76
0.6
34.5
0.1
15
0.1
0.1
50.0
35
0.6
54
0.0
53
0.1
0.1
50.1
05
0.6
51.9
0.1
59
0.1
0.2
O0.0
63
0.7
40.1
03
0.1
0.1
60.0
40.7
3.1
0.0
66
0.1
0.1
50.0
50.7
40.0
82
0.1
0.1
7
F0.1
50.3
70.1
05
0.1
0.1
0.1
50.3
70.1
05
0.1
0.1
0.1
50.3
70.1
05
0.1
0.0
9
GP
B0.1
73700
1100
0.0
75
0.2
5–
Cs
0.1
73700
1000
0.0
73
0.2
3–
Fs0.1
73700
1300
0.0
72
0.2
5–
DF&
M0.0
18
0.9
550
0.0
40.2
0.6
0.0
54
0.9
533
0.1
20
0.2
0.7
20.0
80.9
544
0.1
77
0.2
0.8
1
S0.2
48
0.8
50.4
80
0.2
0.5
0.6
26
0.8
51.4
50.2
0.5
30.5
26
0.9
41.0
71
0.2
0.5
Me
0.0
83
920.4
1.1
50.2
0.4
0.0
83
810.4
10.2
0.4
50.0
83
810.4
1.7
13
02
0.4
5
C0.0
34
0.6
43
0.0
52
0.1
0.1
50.0
18
0.6
53
0.0
28
0.1
0.1
80.0
36
0.6
43
1.3
0.1
0.1
7
O0.0
36
0.7
2.6
0.0
59
0.1
0.1
40.0
40.7
30.0
66
0.1
0.1
80.0
36
0.7
2.5
0.0
55
0.1
0.1
8
F0.1
50.3
60.1
05
0.1
0.0
90.1
50.3
60.1
05
0.1
0.3
0.1
50.3
0.1
05
0.1
0.1
0.1
NSG
PB
0.1
73800
1000
0.0
80.2
5–
NSC
s0.1
74000
1100
0.0
75
0.2
5–
NSF
s0.1
73600
1100
0.0
80.2
6–
DF&
M0.1
04
0.9
535
0.2
30
0.2
0.8
50.0
50.9
535.2
0.1
11
0.2
0.7
0.0
45
0.9
537
0.1
0.2
0.6
5
S0.0
28
0.7
87
0.0
53
0.2
0.2
0.4
60.9
4.1
0.9
0.2
0.5
0.1
54
0.8
60.2
86
0.2
0.4
Me
0.0
83
815
1.1
50
0.2
0.4
70.0
83
819.4
1.2
0.2
0.4
50.0
83
817.5
1.5
0.2
0.4
C0.0
47
0.6
52
0.0
72
0.1
0.1
80.0
46
0.6
54.5
0.0
70.1
0.1
90.2
11
0.6
51.5
0.3
18
0.1
0.2
O0.0
60.7
20.0
98
0.1
0.1
80.0
46
0.7
6.8
0.0
75
0.1
0.1
90.0
62
0.7
5.1
0.1
02
0.1
0.1
7
F0.1
50.3
30.1
05
0.1
0.0
70.1
50.3
7.8
0.1
05
0.1
0.1
50.1
50.3
7.8
0.1
05
0.1
0.1
6
DSG
PB
0.1
74000
1100
0.0
80.3
–D
SCs
0.1
73700
1100
0.0
75
0.2
5–
DSF
s0.1
73800
1100
0.0
75
0.2
5–
DF&
M0.0
29
0.9
540
0.0
65
0.2
0.5
80.0
53
0.9
534.6
0.1
18
0.2
0.7
0.1
32
0.9
533.7
0.2
91
0.2
0.9
S0.3
27
0.8
35
0.6
04
0.2
0.5
20.8
68
0.9
24.3
1.8
13
0.2
0.4
0.7
19
0.9
41.5
50
0.2
0.9
Me
0.0
83
917.4
1.7
13
0.2
0.4
30.0
83
820.4
1.2
0.2
0.4
50.0
83
919.4
1.2
0.2
0.4
7
C0.0
33
0.6
54
0.0
50.1
0.1
50.0
28
0.6
35
5.5
0.0
42
0.1
0.1
90.0
22
0.6
57
0.0
34
0.1
0.1
5
O0.0
32
0.7
3.5
0.0
53
0.1
0.1
60.0
50.6
84.4
0.0
82
0.1
0.1
90.0
56
0.7
3.7
0.0
92
0.1
0.1
5
F0.1
50.3
50.1
05
0.1
0.1
20.1
50.3
80.1
05
0.1
0.1
60.1
50.3
7.5
0.1
05
0.1
0.1
BSG
PB
0.1
73700
1100
0.0
70.2
5–
BSC
s0.1
73700
1100
0.0
70.2
5–
Tot
0.1
73700
1100
0.0
65
0.3
–
DF&
M0.0
14
0.9
550
0.0
31
0.2
0.5
0.0
33
0.9
537
0.0
74
0.2
0.7
0.4
10.9
734
0.9
10
0.2
0.9
2
S0.1
62
0.8
5.7
0.3
01
0.2
0.3
50.1
78
0.8
26
0.3
30
0.2
0.4
4.0
40.7
7.4
6.2
50.2
0.3
9
Me
0.0
83
920
1.1
00
0.2
0.4
40.0
83
920.4
1.1
0.2
0.6
0.0
83
920
1.1
0.2
0.4
C0.0
13
0.6
59
0.0
20.1
0.1
60.0
98
0.6
52.4
0.1
49
0.1
0.2
0.3
20.6
91.6
0.5
01
0.1
0.2
1
O0.0
41
0.7
60.0
67
0.1
0.1
60.0
76
0.7
4.5
0.1
24
0.1
0.2
0.4
0.7
41.8
0.6
70
0.1
0.2
1
F0.1
50.3
70.1
05
0.1
0.1
0.1
50.3
70.1
05
0.1
0.3
0.1
50.3
70.1
05
0.1
0.2
4
B=
annual
mea
nbio
mas
sin
gC
Æm)
2Æy
ear)
1;
P⁄B
=tu
rn-o
ver
rate
inye
ar)
1;
I=
inges
tion
inye
ar)
1;
R=
resp
irat
ion
per
year
;M
=non
pre
dat
ory
mort
ality
per
year
;E
=eg
estion;
NS
=N
ort
hSe
a;
DS
=D
ove
rSt
rait;
BS
=Bay
of
Sein
e;G
P=
gra
velan
dpeb
ble
sse
dim
ent;
Cs
=C
oar
sesa
nd
sedim
ent;
Fs=
Fine
sand
sedim
ent;
Tot
=To
talar
ea;
B=
ben
thic
Bac
teria;
DF&
M=
Dep
osi
t-Fe
eder
and
Mix
ed;
S=
Susp
ensi
on-F
eeder
;M
e=
Mei
ofa
una;
C=
Car
niv
ore
;O
=O
mniv
ore
;F
=Fi
sh.
Garcia, Chardy, Dewarumez & Dauvin Assessment of benthic ecosystem functioning
Marine Ecology 32 (Suppl. 1) (2011) 72–86 ª 2011 Blackwell Verlag GmbH 77

(bacteria, meiofauna and fish) had the same biomass in
each of the models applied for each division and sub-
division of our study area. The physiological parameters
are presented in Table 1.
Diet preference values were determined according to
three different sources of information. Diet data were
preferentially taken from experimental studies of gut con-
tents for particular species (e.g. Fauchald & Jumars 1979;
Langdon & Newell 1990) or groups of species (Lopez
et al. 1989). Data from stable isotope studies were also
used, where available (e.g. Le Loc’h & Hily 2005; Carlier
et al. 2007). Finally, some remaining missing data were
also taken from previous published trophic web models
(e.g. Chardy & Dauvin 1992; Ameziane et al. 1996;
Leguerrier et al. 2003).
To assess and compare the functioning of each sector
of the eastern basin of the English Channel and the
Southern Bight of the North Sea, simulations were based
on the same initial mean values for ingestion, egestion,
P ⁄ B, non-predatory mortality and initial matter input.
However, the model was allowed to select each parame-
ter’s value within the confidence interval of the mean for
each simulation. The values of biomass and respiration
were fixed for each simulation (i.e. the model was not
allowed to change them). The simulation outputs for each
division and sub-division were the average annual carbon
flows per square metre that link all functional compart-
ments.
Compartment status
We sub-divided the benthic ecosystem into eight com-
partments defined by feeding mode and size. The general
structure of the diagram (Fig. 2) uses the main compo-
nents previously proposed by Chardy et al. (1993a,b), to
which we added the omnivore and the demersal fish
compartments. Omnivores have been separated from car-
nivores because, as scavengers that recycle organic matter,
they have a different function in the ecosystem. The fish
compartment was added to ‘close’ the benthic trophic
web.
• Fi. The initial flow. This is the necessary amount of
organic matter for the whole ecosystem to function.
It translates as the net sedimentation of pelagic detri-
tus (dead phytoplankton cells, faeces) that can be
used by benthic organisms.
• X1. Detritus. This is an inactive compartment. It
appears to be a cross-road from which the carbon is
passed to higher levels, receiving matter from outside
the system (Fi) as well as from inside the trophic
web itself (i.e. egestion, non-predation mortality).
• X2. Bacteria. Benthic bacteria are associated with
particles of detritus.
• X3. Deposit-feeders and Mixed. This group includes
strict deposit-feeders that feed only or predominantly
on detritus at the sediment layer, but also organisms
that are able to feed as either deposit-feeders or sus-
pension feeders. No distinction has been made
between sub-surface and surface deposit-feeders, as
they all feed on detritus and bacteria.
• X4. Suspension-feeders. This group is mainly com-
posed of filter-feeding bivalves that feed in the
water–sediment interface. They feed more on fresh
matter than the deposit-feeder group does (e.g. phy-
toplankton, microphytobenthos, fresh detritus). They
can also feed on bacteria bound to particles. Langdon
& Newell (1990) have estimated that the bacteria
could represent 3.5 and 25.8% of carbon needs in
oysters and mussels, respectively. As phytoplankton is
not represented in our model, the trophic preference
of suspension-feeders was integrated by including a
preference for benthic bacteria and a lesser egestion.
• X5. Meiofauna. Nematodes are often the most abun-
dant organisms in the permanent meiofauna (Boaden
2005). Most of the meiofaunal organisms feed on
detritus and bacteria, but some of them are also car-
nivores, including cannibalism.
• X6. Carnivores. This group is composed of predators
and carnivores. They only feed on living or almost
living organisms; motile nemertean and polychaete
predators are the most representative organisms in
this group.
• X7. Omnivores. This group consists of species that
have an opportunistic feeding mode. These species
will always prefer to feed on fresh material, but they
can also feed as scavengers on dead bodies and detri-
tus. This group is mainly composed of decapods and
some gastropods.
• X8. Fish. The only vertebrate compartment of this
trophic web, this group is composed of carnivorous
demersal fish that feed on every macrobenthic com-
partment in the model.
Results
The sum of the average biomass values of benthic inverte-
brates in the whole study area is 5.253 gCÆm)2, composed
mostly of suspension-feeders (77%), then deposit-feeders
and mixed (8%), with omnivores and carnivores having
similar proportions (7.5 and 6%, respectively) and meio-
fauna having the smallest proportion (1.5%).
To assess the trophic structure of each division and sub-
division of our study area, the first step was to identify the
preferred trophic pathway (i.e. the main compartments
through which most of the carbon will transit). The fish
compartment (X8) is always the most important predator
Assessment of benthic ecosystem functioning Garcia, Chardy, Dewarumez & Dauvin
78 Marine Ecology 32 (Suppl. 1) (2011) 72–86 ª 2011 Blackwell Verlag GmbH

in each of the macrobenthic compartments. To obtain a
more accurate picture of the carbon flow through the
macrobenthic compartments, we did not take the fish
compartment into account when determining the trophic
pathways; fish were only considered as the top predators,
which came into play following one of the two last macro-
benthic compartments (i.e. carnivore and omnivore).
The preferential trophic pathway for the whole study
area begins in the detritus compartment. Most of the car-
bon in this first compartment is absorbed by the bacteria
in the second compartment (87.1% of the uptake); the
suspension-feeders feed mainly on bacteria (72.4%). The
main predators of the suspension-feeder compartment are
the fish (59.4%), although the main benthic invertebrate’s
predators are the omnivores (21.8%). Thus, the total area
was considered to have a ‘suspension-feeder ⁄ omnivore’
trophic pathway (Fig. 3A).
Comparison of the divisions
The sum of the average biomass values of benthic inverte-
brates from each trophic compartment in the different
divisions of our study area reached values of 0.462, 0.794
and 0.508 gCÆm)2 for the three geographical divisions
(North Sea, the Dover Strait and the Bay of Seine, respec-
tively) and 0.419, 0.917 and 0.761 gCÆm)2 for the three
main sediment divisions (gravel and pebbles, coarse sand
and fine sand, respectively).
In the geographic divisions, suspension-feeders were
always dominant in terms of biomass proportions, rang-
ing from 33.3% in the North Sea to 73.7% in the Dover
Strait. This pattern was also observed in the sediment
divisions, where the biomass proportions of the suspen-
sion-feeders were always between 59.2% in the gravel and
pebbles and 69.1% in the fine sand. The highest biomass
proportion for the deposit-feeders and mixed was found
in the North Sea geographic division, with 18.6%, and in
the fine sand sediment division, with 10.9%. Carnivores
and omnivores have quite similar proportions in the
Dover Strait (4.4 and 5%, respectively) and in the North
Sea (16.5 and 13.6%, respectively), but the carnivores
clearly dominate (20.6%) the omnivores (9.8%) in the
Bay of Seine. However, all the sediment divisions have
quite similar proportions for these two compartments
(8.1% for the carnivores and 8.6% for the omnivores in
CarnivoreX6
MeiofaunaX5
BacteriaX2
Deposit-feeder & mixed
X3
Suspension-feederX4
OmnivoreX7
FishX8
DetritusX1
P.O.M. flowA
B
C
9.758
12.840
198.877
149.069
1.431
12.075
18.15712.249
4.178
0.0740.0740.358
0.127
0.147
0.180
0.149
0.406
0.125
0.1480.076
0.291
0.406
0.149
0.128
R 0.362
R 33.123
R 17.300
R 0.192
R 0.110
R 0.650
R 0.005
0.129
0.286
0.8 0.183
52.741
CarnivoreX6
MeiofaunaX5
BacteriaX2
Deposit-feeder & mixed
X3
Suspension-feederX4
OmnivoreX7
FishX8
DetritusX1
P.O.M. flow
0.702
0.512
199.659
151.723
1.350
0.508
0.7620.659
0.301
0.0110.0110.338
0.031
0.023
0.043
0.023
0.424
0.081
0.0210.017
0.076
0.462
0.023
0.031
R 0.001
R 46.809
R 0.094
R 0.001
R 0.001
R 0.768
R 0.005
0.02
0.095
0.81 0.017
48.679
CarnivoreX6
MeiofaunaX5
BacteriaX2
Deposit-feeder & mixed
X3
Suspension-feederX4
OmnivoreX7
FishX8
DetritusX1
P.O.M. flow
2.444
2.959
237.117
183.291
0.835
0.858
1.2471.145
1.047
0.0110.0110.209
0.032
0.021
0.045
0.022
0.451
0.083
0.020.018
0.066
0.449
0.22
0.032
R 0.013
R 51.702
R 0.497
R 0.001
R 0.001
R 0.461
R 0.005
0.023
0.1
0.474 0.02
53.680
Fig. 3. Results from the simulation of annual carbon flows
(gCÆm)2Æy)1) showing a representation of (A) TP1, the trophic path-
way in the total area; (B) TP2, the trophic pathway in the Coarse sand
division; and (C) TP3, the trophic pathway in the Fine sand division.
Trophic fluxes: faeces + non-predatory mortality; main pathway in the
carbon transfer between a prey compartment and all of its predator
compartments; R, respiration.
Garcia, Chardy, Dewarumez & Dauvin Assessment of benthic ecosystem functioning
Marine Ecology 32 (Suppl. 1) (2011) 72–86 ª 2011 Blackwell Verlag GmbH 79

the gravel and pebbles, 1.9 and 4.4% in the coarse sand
and 4.7 and 4.7% in the fine sand).
Like the trophic pathway for the whole study area, the
Bay of Seine had a ‘suspension-feeder ⁄ omnivore’ path-
way. However, the Dover Strait and the North Sea sites
had a different type of trophic pathway, with both of
them having a ‘suspension-feeder ⁄ carnivore’ pathway.
Each of the sediment divisions had a different type of
trophic pathway (Table 2a). The gravel and pebbles divi-
sion had the same ‘suspension-feeder ⁄ carnivore’ trophic
pathway as the whole study area, the Dover Strait and the
North Sea, denoted in this paper as TP1. The coarse sand
division had the same ‘suspension-feeder ⁄ omni-
vore’(Fig. 3B) trophic pathway as the Bay of Seine,
denoted TP2. Finally, the fine sand division had the path-
way that differed the most, mainly because the principal
primary consumers switch from being suspension-feeders
to being deposit-feeders and mixed. This switch gives this
division a ‘deposit-feeder and mixed ⁄ carnivore’ (Fig. 3C)
trophic pathway, denoted TP3.
Comparison of the sub-divisions
This pattern of suspension-feeder biomass dominance was
observed in almost all the sub-divisions, except in the
gravel and pebbles sub-division of the North Sea, where
deposit-feeders and mixed dominate with 32.2%. The
deposit-feeder and mixed biomass in one sediment type
for one geographic area has a similar value in the same
sediment type for the other two areas, 13.2% (Bay of
Seine), 13% (Dover Strait) and 13.9% (North Sea) in fine
sand, and 7.1% (Bay of Seine), 4.9% (Dover Strait) and
7.3% (North Sea) in coarse sand. The exception is for the
gravel and pebbles, where the deposit-feeder and mixed
biomass in North Sea is much higher (32.2%) than in the
Dover Strait and the Bay of Seine (5.2 and 4.5%, respec-
tively). However, the carnivore and omnivore compart-
ments don’t seem to follow a particular pattern, except
for the three North Sea sub-divisions, where the biomass
proportions in both compartments are systematically
higher than in the other five sub-divisions.
The dominant trophic pathway for all eight sub-divi-
sions is one of the three previously identified trophic
pathways for the divisions. The trophic pathway identified
for the geographic sub-divisions of the gravel and pebbles
sediment type changes from one area to another. In the
Bay of Seine, the trophic pathway is TP2, which is the
same pathway as the whole Bay of Seine; in the Dover
Strait, the trophic pathway is TP1, which is the same
pathway as the whole Dover Strait; and in the North Sea,
the trophic pathway is TP3, which is the same pathway as
the whole fine sand (Table 2b).
The trophic pathways in the geographic sub-divisions
of coarse sand sediment and fine sand sediment are much
more stable. The geographic sub-divisions of the coarse
sand follow the TP2 pathway, whatever the geographic
site considered; in other words, the trophic pathway is
the same for the entire coarse sand division. Similarly, the
trophic pathways in all the geographic sub-divisions of
the fine sand sediment are the same – TP3 – which is also
the trophic pathway for the entire fine sand division
(Table 2b).
Discussion
Food-web studies and trophic network analysis provide
powerful tools for identifying the global functional prop-
erties of benthic communities (Chardy et al. 1993a,b).
New techniques for describing and quantifying the flows
of organic matter between compartments have been
developed at the same time as numerical methods such as
trophic models. One of these numerical methods for flow
network assessment in trophic web is the trophic inverse
model used in this study. This model is based on an
underlying inverse method (Chardy 1987), which states
that the sum of inputs is equal to the sum of outputs
(Vezina & Platt 1988).
Since this model arrived in the late 1980s (Vezina &
Platt 1988; Vezina 1989; Chardy et al. 1993a,b) it has
been widely used in many different environments and
biotic compartments, such as the French coast of Brittany
in the Western English Channel (Chardy 1987; Chardy &
Dauvin 1992; Chardy et al. 1993a,b; Ameziane et al.
1996), the intertidal mudflat on the French Atlantic coast
(Leguerrier et al. 2003, 2004), Arcachon Bay (Blanchet
2004), the Baltic Sea (Harvey et al. 2003), the coast of
Norway (Salvanes et al. 1992), the Mediterranean (Coll
Table 2. (a) Compartments for each of the three preferential trophic
pathways identified. (b) Preferential trophic pathway for each division
and sub-division of the Eastern English Channel and the Southern
Bight of the North Sea.
(a) N� preferential trophic pathway
TP1 Detritus-Bacteria-Suspension-feeder-Omnivore-
Fish
TP2 Detritus-Bacteria-Suspension-feeder-Carnivore-
Fish
TP3 Detritus-Bacteria-Deposit-feeder and Mixed-Car-
nivore-Fish
(b) sediment\site Bay of Seine Dover Strait North Sea whole
gravel and pebbles TP1 TP2 TP3 TP2
coarse sand TP1 TP1 TP1 TP1
fine sand – TP3 TP3 TP3
whole TP1 TP2 TP2 TP1
Assessment of benthic ecosystem functioning Garcia, Chardy, Dewarumez & Dauvin
80 Marine Ecology 32 (Suppl. 1) (2011) 72–86 ª 2011 Blackwell Verlag GmbH

et al. 2006), lagoons on the coast of the Pacific Ocean
(Niquil et al. 2001) and the coast of the USA (Eldridge &
Jackson 1993; Breed et al. 2004).
Inverse methods (i.e. ones in which the values of the
unknown parameters are deduced from a set of observa-
tions and a system model) (Tarantola & Valette 1982)
seem to be totally appropriate for food-web research, as
researchers in this field face the fundamental limitation
that the number of independent observations of physio-
logical rates that can be made is far less than the number
of parameters needed to describe the whole system (Vez-
ina & Platt 1988). The main limitation of these methods
is that they all assume the system is mass-balanced, which
permits only a static representation of the food-web for a
particular temporal scale (Pasquaud et al. 2007). In this
study, we chose an annual representation of the food-
web, mainly because field surveys were conducted over
2½ years in different seasons, making it impossible to
take the effect of recruitment into account.
The ecological credibility of such inverse methods
depends on the functional unit, which needs to be homoge-
neous in terms of the trophic types, physiological rates and
life cycles of its component parts (Chardy et al. 1993a,b).
Whatever the precision level reached, determining the
boundaries of the functional unit is based on varied crite-
ria, which are always somewhat arbitrary (Warwick & Rad-
ford 1989). An alternative approach would be to base the
models on the individual criteria, which would lead to an
increase in the number of unknown parameters. It is thus
necessary to accept that the food-web must be aggregated
in functional units, which are inevitably heterogeneous
(Chardy et al. 1993a,d).
Further field studies are necessary to investigate
whether a compartment can be described more accurately.
For example, the deposit-feeders and mixed compartment
seems to be the most active in the fine sand community;
sub-dividing this compartment into sub-surface deposit-
feeder, surface deposit-feeder sensus stricto and half
deposit-feeder ⁄ half suspension-feeder would provide more
information on the trophic structure. There is also a need
for more information about the meiofauna compartment,
which is the least well known compartment in benthic
trophic web studies. However, even if more detailed and
numerous compartments would increase the accuracy of
our knowledge about the trophic system, the difficulties
of finding physiological parameters would multiply with
the increase in the numbers of the compartments.
Benthic community structure is the result of the
complex integration of many different factors, including
abiotic, biotic and anthropogenic factors (Dauvin 1993,
1997b). Among these factors, hydrodynamics seems to be
the most important factor in the organization of the
benthic invertebrates in a megatidal sea such as the Eng-
lish Channel. Thanks to a large tidal range, the hydrog-
raphical influence of large rivers and the morphology of
the Eastern English Channel coast, hydrodynamics in the
Channel vary greatly and have a complex pattern (Salo-
mon & Breton 1991). These hydrodynamics lead to differ-
ential particle-size sedimentation, with a gradient ranging
from pebbles and gravel to fine sand (Larsonneur et al.
1982).
Depending on the sediment type, different benthic spe-
cies are able to settle and to undergo a successful meta-
morphosis (Gray 1974). Previous authors have identified
five main bio-sedimentary structures, which have been
studied since the late 1970s (see Dauvin 1997a). For this
study, we chose three sediment divisions; coarse sediment
– gravel and pebbles; intermediate sediment – coarse
sand; and fine sediment – fine sand. These sediment divi-
sions were associated with three geographic divisions; the
Bay of Seine, the Dover Strait and the North Sea (Fig. 1).
This first quantitative approach at such a large spatial
scale as the Eastern English Channel allowed us to com-
pare the trophic structure in the various sediment and
geographic divisions through trophic web modelling.
However, inverse methods are based on the parsimony
principle (Vezina & Platt 1988). Thus, many flows can be
underestimated or overestimated (Leguerrier et al. 2003).
We used similar input parameters to ensure an identical
estimation error, so that comparisons of the divisions and
sub-divisions would remain possible. We also tested each
of the model outputs by randomly selecting different val-
ues of particular organic matter (P.O.M.). flow entering
the system inside a confidence interval. We then
compared the different outputs of each division and sub-
division, to make sure that they were consistent.
Moreover, sensitivity analyses showed that outputs from
inverse methods were robust (Marquis et al. 2007). Using
the preferred trophic pathway identified for each division
(Table 2a), we found only slight differences among geo-
graphic divisions; the trophic pathways in the Dover
Strait and the North Sea were similar and were them-
selves similar to the preferred pathway for whole area
(TP1) (Table 2b). Only the Bay of Seine was found to be
different (TP2).
However, the trophic pathways in the sediment divi-
sions were very different from each other (Table 2b). For
example, in the gravel and pebbles and coarse sand sedi-
ment divisions, the suspension-feeders were dominant. Of
the 10 suspension-feeder species that contribute most to
the biomass, five species were observed in both of the
communities. The presence of these five species could be
seen as enhancing the efficiency of the suspension-feeder
compartment in terms of trophic web matter transfer. In
the higher levels of the trophic web of these divisions, the
switch from carnivore in the gravel and pebbles sediment
Garcia, Chardy, Dewarumez & Dauvin Assessment of benthic ecosystem functioning
Marine Ecology 32 (Suppl. 1) (2011) 72–86 ª 2011 Blackwell Verlag GmbH 81

division to omnivore in the coarse sand sediment is more
difficult to explain. This could be because the omnivores
in coarse sand have a more regular biomass distribution
among the 10 species that dominate the biomass
(Table 3).
The trophic pathway also switches from suspension-fee-
der dominance to deposit-feeder and mixed dominance
between coarse sand and fine sand, despite the fact that
both these divisions have quite similar species. This
switch can be explained by the increase in biomass of one
deposit-feeder species, the sea urchin Echinocardium cord-
atum, associated with the decrease in biomass of the
dominant suspension-feeder species, Ensis directus, which
has its biomass value divided by four in the fine sand sed-
iment division. Finally, the switch between carnivore
dominance in fine sand to omnivore dominance in coarse
sand, seems to be due mostly to the absence of a signifi-
cant decrease in the large omnivorous cnidarian Urticina
felina and molluscs Buccinum undatum and Nassarius
reticulatus, which contribute most to the biomass of
the coarse sand sediment division.
In his trophic model of the benthic trophic web in
Arcachon Bay, Blanchet (2004) found the same deposit-
feeder dominance in a similar fine sediment type, but
with a large difference in the mean deposit-feeder
biomass (0.08 gCÆm)2 in our study compared with
0.52 gCÆm)2 in Arcachon Bay), probably due to the
presence of the seagrass Zostera noltii. Unfortunately, fur-
ther comparisons of our results with those of adjacent
marine areas are quite difficult to carry out. The models
of Mackinson & Daskalov (2007) for the North Sea, and
Lees & Mackinson (2007) for the Irish Sea, mainly deal
with fisheries management. In addition, these authors did
not investigate trophic structure at the benthic level and
the functional compartments utilised were very different.
In the Marennes-Olerons, Leguerrier et al. (2003) sought
to highlight the differences between the carbon flows of
cultivated oysters and those of non-cultivated benthos,
and the models made for the Western English Channel
(Chardy & Dauvin 1992; Ameziane et al. 1996) were used
mainly to investigate benthic–pelagic relationships, and
used different compartments.
Table 3. Ten main contributive species to the mean biomass of sediment divisions for each trophic compartment.
deposit-feeder and mixed B suspension-feeder B carnivore B omnivore B
GP Arcopagia crassa 3.725 Laevicardium crassum 6.316 Psammechinus miliaris 0.145 Buccinum undatum 1.881
Cirriformia tentaculata 1.250 Glycymeris glycymeris 5.963 Cerebratulus spp. 0.136 Necora puber 1.394
Chaetopterus variopedatus 0.443 Lutraria spp. 5.093 Pelogenia arenosa 0.077 Sagartia troglodytes 1.263
Golfingia (Golfingia) elongata 0.273 Mytilus edulis 3.926 Asterias rubens 0.059 Urticina felina 0.837
Upogebia deltaura 0.271 Ophiothrix fragilis 3.129 Glycinde nordmanni 0.045 Atelecyclus rotundatus 0.635
Echinocardium cordatum 0.195 Paphia rhomboides 2.611 Tubulanus polymorphus 0.011 Nassarius reticulatus 0.325
Callianassa tyrrhena 0.191 Aequipecten opercularis 2.286 Lepidonotus squamatus 0.008 Ophiura ophiura 0.229
Euclymene lumbricoides 0.179 Mya arenaria 2.080 Notophyllum foliosum 0.007 Liocarcinus depurator 0.173
Golfingia (Golfingia) margaritacea 0.159 Crepidula fornicata 2.052 Harmothoe impar 0.006 Ophiura spp. 0.135
Cs Echinocardium cordatum 6.848 Ensis directus 42.358 Marphysa sanguinea 1.037 Buccinum undatum 2.153
Arcopagia crassa 6.197 Laevicardium crassum 20.484 Nephtys caeca 0.660 Urticina felina 1.025
Amphitrite johnstoni 4.110 Spisula solida 3.116 Pelogenia arenosa 0.352 Nassarius reticulatus 1.019
Cirriformia tentaculata 1.250 Solecurtus scopula 2.912 Nephtys assimilis 0.339 Sagartia troglodytes 0.753
Tellina fabula 1.014 Glycymeris glycymeris 2.580 Lumbrineris latreilli 0.283 Liocarcinus holsatus 0.634
Callianassa tyrrhena 0.703 Ensis arcuatus 2.306 Nephtys hombergii 0.245 Diogenes pugilator 0.584
Tellina tenuis 0.673 Mya arenaria 2.080 Sigalion mathildae 0.193 Nassarius reticulatus 0.533
Callianassa tyrrhena 0.703 Aequipecten opercularis 1.793 Lumbrineris fragilis 0.188 Ophiura ophiura 0.515
Echiurus echiurus 0.395 Ophiothrix fragilis 1.622 Nephtys longosetosa 0.174 Cereus pedunculatus 0.464
Callianassa subterranea 0.382 Solen marginatus 1.493 Gattyana cirrhosa 0.114 Atelecyclus rotundatus 0.346
Fs Echinocardium cordatum 12.955 Ensis directus 11.750 Nemertina 1.017 Nassarius reticulatus 0.986
Cirriformia tentaculata 1.250 Spisula solida 4.446 Nephtys hombergii 0.400 Diogenes pugilator 0.642
Corbula gibba 0.675 Acanthocardia
(Rudicardium) tuberculata
3.897 Sthenelais boa 0.353 Sagartia troglodytes 0.573
Tellina fabula 0.352 Venerupis senegalensis 2.225 Lumbrineris fragilis 0.322 Ophiura ophiura 0.456
Owenia fusiformis 0.284 Mya arenaria 2.080 Nephtys assimilis 0.318 Pagurus bernhardus 0.263
Tellina tenuis 0.262 Donax vittatus 1.927 Nephtys caeca 0.288 Thia scutellata 0.151
Macoma balthica 0.248 Ensis arcuatus 1.921 Sigalion mathildae 0.266 Liocarcinus holsatus 0.145
Callianassa subterranea 0.244 Lutraria angustior 1.827 Nephtys longosetosa 0.107 Trivia monacha 0.074
Acrocnida brachiata 0.179 Spisula elliptica 1.245 Cerebratulus spp. 0.094 Liocarcinus marmoreus 0.065
Upogebia deltaura 0.174 Lutraria lutraria 1.168 Nephtys cirrosa 0.068 Liocarcinus depurator 0.054
B = mean annual biomass of the species in gÆm)2Æyear)1 (ash-free dry weight); GP = Gravel and pebbles; Cs = Coarse sand; Fs = Fine sand.
Assessment of benthic ecosystem functioning Garcia, Chardy, Dewarumez & Dauvin
82 Marine Ecology 32 (Suppl. 1) (2011) 72–86 ª 2011 Blackwell Verlag GmbH

Comparison among sub-divisions tends to show that
the importance of the geographic factor is low. In fact,
for the geographic coarse sand and the fine sand sub-divi-
sions, no matter what geographic location is considered,
the trophic structure always follows the trophic pathway
of the sediment type to which it belongs (Table 2b).
However, no clear pattern appeared for the gravel and
pebbles sediment. This lack of a clear pattern can be
explained by the sampling method; all the sites were sam-
pled with the quantitative Hamon grab sampling gear
which reaches its functional limits in pebbles and stony
bottoms. Thus, it appears that the gravel and pebbles sed-
iment was under-sampled. In addition, among the three
sediment types, gravel and pebbles appear to be the least
accurate in terms of representing benthic organisation
and functioning, which could explain the lack of a clear
pattern observed in this division. It is unclear even for
the coarse sand and fine sand sediment types whether the
observed features are natural or directly dependent on the
sampling strategy. In their study of the effects of sampling
effort on food-web structure, Martinez et al. (1999)
showed that major trophic web properties like food chain
length appear to be robust to variation in sampling reso-
lution. However, further investigations are required to
confirm this conclusion, particularly assessment of the
other bio-sedimentary communities of the Eastern English
Channel and the Southern North Sea (i.e. muddy-fine
sand and mud). The use of a 2-mm sieve is appropriate
for sampling large-sized species, but can underestimate
small species, including some deposit-feeders and mixed.
However, more than 95% of macrobenthic biomass is
retained on 2-mm sieve mesh (Ghertsos 2002) and the
predominantly pebbles to coarse sand communities of the
Eastern English Channel are dominated by large-sized
suspension-feeder species (Dauvin & Ruellet 2008), so this
bias is mainly restricted to the less common fine sedi-
ments.
According to Vezina & Platt (1988), the inverse meth-
ods provide a strong foundation for an effective compara-
tive analysis of food-web dynamics. This study allowed us
to determine that there is variation in trophic organisa-
tion in the Eastern English Channel and the Southern
North Sea, depending on the scale of observation. In this
respect, the sediment division (thus the bio-sedimentary
division) appears to be the most important factor con-
trolling benthic ecosystem functioning in the area, with
the possible exception of the Bay of Seine due to its very
particular features (i.e. an enclosed bay in close proximity
to a river). The trophic organisation of the overall area is
an integration of the specific properties of each individual
functional unit. Thus, views of the trophic structure of
the system can differ depending on the scales and factors
considered. Further investigations are needed to identify
and determine the spatial limits of the individual func-
tional units, as well as their intrinsic properties.
Limitations and Perspectives
A model is a conceptual representation of a particular
ecosystem, which has the primary advantage of gathering
and summarising the current knowledge of ecosystem
functioning (Barnsley 2007). This study shows that
inverse models are extremely useful for investigating the
trophic structure of benthic ecosystems. Our trophic
inverse model allowed us to determine the specific condi-
tions under which the detritic compartment is utilised
and to identify which flows are the most important for
overall functioning of the system. The comparisons of the
different sediment and geographic divisions were also use-
ful for understanding the variations in ecosystem func-
tions, for identifying general information about benthic
functioning, and thus for providing a basis for compari-
son with other benthic ecosystems.
However, using this kind of model is only possible when
quantitative data are available, which leads to the main
problem with a study such as ours; as far as the benthic
compartment is concerned, inverse models can only be
used for sediment types in which a quantitative sampling
gear can operate. Pebbles and stony sediment are excluded,
unless SCUBA divers are employed, which involves much
more work compared with the soft-bottom communities.
Another inconvenience of inverse models is that they
require access to many physiological parameters that are
hard to obtain. One solution to overcome this difficulty
is to derive all necessary physiological parameters (e.g.
respiration, ingestion) from the P ⁄ B value for each com-
partment. The P ⁄ B values for many species and ⁄ or com-
partments are widely available in the literature, but they
vary greatly depending on the authors. This variation can
be explained by the different methods used for the assess-
ment, but also by the intrinsic properties of P ⁄ B. The
annual P ⁄ B of a cohort usually decreases with age; it fol-
lows that populations dominated by older year classes will
have a lower P ⁄ B than those composed of younger indi-
viduals (Warwick 1980). Another solution would be the
coupling of this kind of work with other modelling meth-
ods such as the model of size spectra developed by Jen-
nings et al. (2002) for the benthic system. This method
assumes that organisms with higher body mass feed at
higher trophic levels, meaning that it requires fewer
parameters to assess the main energy flow through the
food-web.
To the problem of variation in this well known
compartment, it is necessary to add the problem of the
compartments about which little is known – the black
boxes such as benthic bacteria or meiofauna. As few studies
Garcia, Chardy, Dewarumez & Dauvin Assessment of benthic ecosystem functioning
Marine Ecology 32 (Suppl. 1) (2011) 72–86 ª 2011 Blackwell Verlag GmbH 83

of these compartments are available, it is extremely difficult
to gather the necessary parameters which, by virtue of their
lack of attention, are plagued by incertitude.
Another problem is that macrobenthic communities
are well known for having large fluctuations in biomass
and abundance from year to year, mainly due to preda-
tion on larvae in the plankton (Thorson 1946) or newly
settled juveniles. In addition, high adult mortality can
also occur (Warwick 1980). For these reasons, the trophic
representation for 1 year may not be valid the following
year. This is particularly evident in populations that are
dominated by species with long-lived planktonic larvae,
which are considered to have highly unstable dynamics
(Thorson 1946).
Our study has shown that, as far as the benthic com-
partment is concerned, a large-scale spatial model seems
to be acceptable for our study area, as the benthic com-
munities are all influenced by hydrodynamics. Nonethe-
less, as benthic trophic functioning is variable and
strongly dependent on sediment type, this model would
have to take into account at least the three main sediment
types (i.e. gravel and pebbles, coarse sand and fine sand).
Acknowledgements
The authors wish to thank Dr Aurelie Foveau, Aurore
Savina, Emilie Houillez and Amelie Charnoz for their help
in the sorting and identification of the species, Eric Lecu-
yer, Dr Nicolas Desroy, Dr Nicolas Spilmont and the offi-
cers and crew of the RV Cotes de la Manche for their effort
at sea, Lisa Spencer and Dr Julie Bremner for correcting
the English syntax and grammar, and two anonymous ref-
erees for their helpful suggestions and comments. This
work was carried out with financial contribution of the
European Union’s Interreg IIIa scheme (European Regio-
nal Development Funds) CHARM 2 project coordinated
by A. Carpentier, Ifremer, Boulogne-sur-mer.
References
Ameziane N., Chardy P., Dauvin J.-C. (1996) Modelling carbon
flows in soft-bottom communities from the bay of Morlaix,
western English Channel. In: Eleftheriou A.d. (Ed.), Biology
and Ecology of Shallow Coastal Waters, 28 EMBS Symposium.
Olsen & Olsen, Fredenstourg, Denmark: 215–224.
Barnsley M.J. (2007) Environmental Modeling: A Practical Intro-
duction. Taylor & Francis Group, Boca Raton, FL: 406 pp.
Bilyard G.R. (1987) The value of benthic infauna in marine
pollution monitoring studies. Marine Pollution Bulletin, 18,
581–585.
Blanchet H. (2004) Structure et fonctionnement des
peuplements benthiques du Bassin d’Arcachon. Ph.D. thesis,
Universite de Bordeaux1, Bordeaux: 331 pp.
Boaden P.J.S. (2005) Irish intertidal meiofauna: a modicum of
progress. In: Wilson J.G. (Ed.), The Intertidal Ecosystem: The
Value of Ireland’s Shores. Royal Irish Academy, Dublin:
81–99.
Breed G.A., Jackson G.A., Richardson T.L. (2004) Sedimenta-
tion, carbon export and food web structure in the Missis-
sippi River plume described by inverse analysis. Marine
Ecology Progress Series, 278, 35–51.
Bremner J., Rogers S.I., Frid C.L.J. (2006) Methods for describ-
ing ecological functioning of marine benthic assemblages
using biological traits analysis (BTA). Ecological Indicators,
6, 609–622.
Cabioch L., Glacon R. (1975) Distribution des peuplements
benthiques en Manche orientale, de la baie de Somme au
Pas-de-Calais. Comptes Rendus de l’Academie des Sciences
(Paris), 280, 491–494.
Cabioch L., Glacon R. (1977) Distribution des peuplements
benthiques en Manche orientale du cap d’Antifer a la baie
de Somme. Comptes Rendus de l’Academie des Sciences
(Paris), 285, 209–212.
Cabioch L., Gentil F., Glacon R., Retieres C. (1978) Le bassin
oriental de la Manche, modele de distribution de peuple-
ments benthiques dans une mer a fortes marees. Journal de
Recherche Oceanographique, 3, 249–254.
Carlier A., Riera P., Amouroux J.-M., Bodiou J.-Y., Gremare
A. (2007) Benthic trophic network in the Bay of Banyuls-
sur-Mer (northwest Mediterranean, France): an assessment
based on stable carbon and nitrogen isotopes analysis.
Estuarine, Coastal and Shelf Science, 72, 1–15.
Chardy P. (1987) Modele de simulation du systeme benthique
des sediments grossiers du golfe normand-breton (Manche).
Oceanologica Acta, 10, 421–434.
Chardy P., Dauvin J.-C. (1992) Carbon flows in a subtidal
fine sand community from the western English Channel:
a simulation analysis. Marine Ecology Progress Series, 81,
147–161.
Chardy P., Dauvin J.-C., Lasserre P. (1993a) Biodiver-
sity and functional units in a coastal benthic food
web. Workshop Biodiversity, Point-a-Pitre, Guadeloupe:
1–8.
Chardy P., Gros P., Mercier H., Monbet Y. (1993b) Benthic
carbon budget for the Bay of Saint Brieuc (Western Chan-
nel). Application of the inverse method. Oceanologica Acta,
16, 687–694.
Christensen N.L., Bartuska A.M., Brown J.H., Carpenter
S.R., D’Antonio C., Francis R., Franklin J.F., MacMahon
J.A., Noss R.F., Parsons D.J., Peterson C.H., Turner
M.G., Woodmansee R.G. (1996) The report of the
Ecological Society of America Committee on the Scien-
tific Basis for Ecosystem Management. Ecological Applica-
tion, 6, 665–691.
Coll M., Palomera I., Tudela S., Sarda F. (2006) Trophic flows,
ecosystem structure and fishing impacts in the South
Catalan Sea, Northwestern Mediterranean. Journal of Marine
Systems, 59, 63–96.
Assessment of benthic ecosystem functioning Garcia, Chardy, Dewarumez & Dauvin
84 Marine Ecology 32 (Suppl. 1) (2011) 72–86 ª 2011 Blackwell Verlag GmbH

Dauvin J.C. (1993) Le benthos: temoin des variations de l’envi-
ronnement. Oceanis, 19, 25–53.
Dauvin J.C. (1997a) Les biocenoses marines et littorales francais-
es des cotes Atlantique, Manche et Mer du Nord, syntheses,
menaces et perspectives. MNHN, Paris: 359 pp.
Dauvin J.C. (1997b) Evolution a long terme des peuplements
de sediments fins sablo-vaseux de la Manche et de la mer
deu Nord. Oceanis, 23, 113–144.
Dauvin J.-C., Ruellet T. (2008) Macrozoobenthic biomass in
the Bay of Seine (eastern English Channel). Journal of Sea
Research, 59, 320–326.
Desroy N., Warembourg C., Dewarumez J.-M., Dauvin J.-C.
(2003) Macrobenthic resources of the shallow soft-bottom
sediments in the eastern English Channel and southern
North Sea. ICES Journal of Marine Science, 60, 120–131.
Eldridge P.M., Jackson G.A. (1993) Benthic trophic dynamics
in California coastal basin and continental slope communi-
ties inferred using inverse analysis. Marine Ecology Progress
Series, 99, 115–135.
Ellien C., Thiebaut E., Barnay A.-S., Dauvin J.-C., Gentil F.,
Salomon J.-C. (2000) The influence of variability in larval
dispersal on the dynamics of a marine metapopulation in
the eastern Channel. Oceanologica Acta, 23, 423–442.
Fauchald K., Jumars P.A. (1979) The diet of worms: a study of
polychaete feeding guilds. Oceanography and Marine Biology
an Annual Review, 17, 193–284.
George C.L., Warwick R.M. (1985) Annual macrofauna pro-
duction in a hard-bottom reef community. Journal of the
Marine Biological Association of the United Kingdom, 65,
713–735.
Gerlach S.A. (1971) On the importance of marine meiofauna
for benthos communities. Oecologia, 6, 176–190.
Ghertsos K. (2002) Structure spatio-temporelle des peuple-
ments macrobenthiques de la baie de Seine a plusieurs
echelles d’observation. Ph.D. thesis, Universite des Sciences
et Technologies de Lille: 181 pp.
Gray J.S. (1974) Animal-sediment relationship. Oceanography
and Marine Biology: An Annual Review, 12, 223–261.
Harvey C.J., Cox S.P., Essington E., Hansson S., Kitchell J.F.
(2003) An ecosystem model of food web and fisheries inter-
actions in the Baltic Sea. ICES Journal of Marine Science, 60,
939–950.
Hooper D.U., Chapin F.S., Ewel J.J., Hector A., Inchausti P.,
Lavorel S., Lawton J.H., Lodge D.M., Loreau M., Naeem S.,
Schmid B., Setala H., Symstad A.J., Vandermeer J., Wardle
D.A. (2005) Effects of biodiversity on ecosystem functioning:
a consensus of current knowledge. Ecological Monographs,
75, 3–35.
Jennings S., Pinnegar J.K., Polunin N.V.C., Warr K.J. (2002)
Linking size-based and trophic analyses of benthic commu-
nity structure. Marine Ecology Progress Series, 226, 77–85.
Kaiser M.J., Armstrong P.J., Dare P.J., Flatt R.P. (1998) Ben-
thic communiies associated with heavily fished scallop
ground in the English Channel. Journal of the Marine Biolog-
ical Association of the United Kingdom, 78, 1045–1059.
Kroncke I. (2006) Structure and function of macrofaunal com-
munities influenced by hydrodynamically controlled food
availability in the Wadden Sea, the open North Sea and the
dees-sea. Senckenbergiana maritima, 36, 1–18.
Kroncke I., Stoeck T., Wieking G., Palojaervi A. (2004) Rela-
tionship between structure and function of microbial and
macrofaunal communities in different areas of the North
Sea. Marine Ecology Progress Series, 282, 13–31.
Langdon C.J., Newell R.I.E. (1990) Comparative utilization of
detritus and bacteria as food sources by two bivalve suspen-
sion-feeders, the oyster Crassostrea virginica and the mussel,
Geukensia demissa. Marine Ecology Progress Series, 58, 299–
310.
Larsonneur C., Bouysse P., Auffret J.P. (1982) The superficial
sediments of the English Channel and its Western
Approaches. Sedimentology, 29, 851–864.
Le Loc’h F., Hily C. (2005) Stable carbon and nitrogen isotope
analysis of Nephrops norvegicus ⁄ Merluccius merluccius fishing
grounds in the Bay of Biscay (NE Atlantic). Canadian Jour-
nal of Fisheries and Aquatic Sciences, 62, 123–132.
Lees K., Mackinson S. (2007) An Ecopath model of the Irish
Sea: ecosystems properties and sensitivity analysis. Science
Series Technical Report. Cefas, Lowestoft: 49 pp.
Leguerrier D., Niquil N., Boileau N., Rzeznik J., Sauriau P.-G.,
Le Moine O., Bacher C. (2003) Numerical analysis of the
food web of an intertidal mudflat ecosystem on the Atlantic
coast of France. Marine Ecology Progress Series, 246, 17–37.
Leguerrier D., Niquil N., Petiau A., Bodoy A. (2004) Modeling
the impact of oyster culture on a mudflat food web in
Marennes-Oleron Bay (France). Marine Ecology Progress
Series, 273, 147–162.
Lopez G., Taghon G.L., Levinton J. (1989) Ecology of Marine
Deposit Feeders. Springer-Verlag, New York.
Mackinson S., Daskalov G. (2007) An ecosystem model of the
North Sea to support an ecosystem approach to fisheries
management: description and parameterisation. Science
Series Technical Report. Cefas, Lowestoft: 142 pp.
Marquis E., Niquil N., Delmas D., Hartmann H.J., Bonnet D.,
Carlotti F., Herbland A., Labry C., Sautour B., Laborde P.,
Dupuy C. (2007) Planktonic food web dynamics related to
phytoplankton bloom development on the continental shelf
of the Bay of Biscay, French coast. Estuarine Coastal and
Shelf Science, 73, 223–225.
Martin C.S., Carpentier A., Vaz S., Coppin F., Curet L., Dauvin
J.-C., Delavenne J., Dewarumez J.-M., Dupuis L., Engelhard
G., Ernande B., Foveau A., Garcia C., Gardel L., Harrop S.,
Just R., Koubbi P., Lauria V., Meaden G.J., Morin J., Ota Y.,
Rostiaux E., Smith R., Spilmont N., Verin Y., Villanueva C.,
Warembourg C. (2009) The Channel habitat atlas for marine
resource management (CHARM): an aid for planning and
decision-making in an area under strong anthropogenic pres-
sure. Aquatic Living Resources, 22, 499–508.
Martinez N.D., Hawkins B.A., Dawah H.A., Feifarek B.P.
(1999) Effects of sampling effort on characterization of
food-web structure. Ecology, 80, 1044–1055.
Garcia, Chardy, Dewarumez & Dauvin Assessment of benthic ecosystem functioning
Marine Ecology 32 (Suppl. 1) (2011) 72–86 ª 2011 Blackwell Verlag GmbH 85

van der Meer J., Heip C.H., Herman P.M.J., Moens T., van
Oevelen D. (2005) Measuring the flow of energy and matter
in marine benthic animal population. In: Eleftheriou A.,
McIntyre A. (Eds), Methods for the Study of Marine Benthos.
Blackwell Science, Oxford: 326–407.
Newell R.C., Seiderer L.J., Robinson J.E. (2001) Animal: sedi-
ment relationships in coastal deposits of the eastern English
Channel. Journal of the Marine Biological Association of the
United Kingdom, 81, 1–9.
Niquil N., Pouvreau S., Sakka A., Legendre L., Addessi L., Le
Borgne R., Charpy L., Delesalle B. (2001) Trophic web
and carrying capacity in a pearl oyster farming lagoon
(Takapoto, French Polynesia). Aquatic Living Resources, 14,
165–174.
Pasquaud S., Lobry J., Elie P. (2007) Facing the necessity of
describing estuarine ecosystems: a review of food web ecol-
ogy study techniques. Hydrobiologia, 588, 159–172.
Pearson T.H., Rosenberg R. (1978) Macrobenthique succession
in relation to organic enrichment and pollution of the
marine environment. Oceanography and Marine Biology: An
Annual Review, 16, 229–311.
Rybarczyk H., Elkaim B. (2003) An analysis of the trophic
network of a macrotidal estuary: the Seine Estuary (Eastern
Channel, Normandy, France). Estuarine, Coastal and Shelf
Science, 58, 775–791.
Rybarczyk H., Elkaim B., Ochs L., Loquet N. (2003) Analysis
of the trophic network of a macrotidal ecosystem: the Bay
of Somme (Eastern Channel). Estuarine, Coastal and Shelf
Science, 58, 405–421.
Salomon J.-C., Breton M. (1991) Courants residuels de maree
dans la Manche. Oceanologica Acta, 11, 47–53.
Salvanes A.G.V., Aksnes D.L., Giske J. (1992) Ecosystem model
for evaluating potential cod production in a west Norwegian
fjord. Marine Ecology Progress Series, 90, 9–22.
Schwinghamer P., Hargrave B., Peer D., Hawkins C.M. (1986)
Partitioning of production and respiration among size
groups of organisms in an intertidal benthic community.
Marine Ecology Progress Series, 31, 131–142.
Solan M., Germano J.D., Rhoads D.C., Smith C., Michaud E.,
Parry D., Wenzhofer F., Kennedy B., Henriques C., Battle
E., Carey D., Iocco L., Valente R., Watson J., Rosenberg R.
(2003) Towards a greater understanding of pattern, scale
and process in marine benthic systems: a picture is worth
than a thousand worms. Journal of Experimental Marine
Biology and Ecology, 285-286, 313–338.
Tarantola A., Valette B. (1982) Generalized nonlinear inverse
problems solved using the least squares criterion. Reviews of
Geophysics and Space Physics, 20, 219–232.
Thorson G. (1946) Reproduction and larval development of
danish marine bottom invertebrates, with special reference
to the planktonic larvae in the sound (Oresund). Meddelelser
Fra Kommissionen for Danmarks fiskeri- Og Havundersogelser,
Serie: Plankton, 4, 1–523.
Underwood A.J. (1990) Experiments in ecology and manage-
ment: thei logics, functions and interpretations. Australian
Journal of Ecology, 15, 365–389.
Underwood A.J. (1996) Detection, interpretation, prediction
and management of environmental disturbances: some roles
for experimental marine ecology. Journal of Experimental
Marine Biology and Ecology, 200, 1–27.
Vezina A.F. (1989) Construction of flow networks using
inverse methods. In: Wulff F., Field J.G., Mann K.H. (Eds),
Network Analysis in Marine Ecology: Methods and Applica-
tions. Springer-Verlag, Berlin: 62–81.
Vezina A.F., Platt T. (1988) Food web dynamics in the ocean.
I. Best-estimates of flow networks using inverse methods.
Marine Ecology Progress Series, 42, 269–287.
Vranken G., Heip C. (1986) The productivity of marine nema-
todes. Ophelia, 26, 429–442.
Vranken G., Herman P.M.J., Vincx M., Heip C. (1986) A re-
evaluation of marine nematode productivity. Hydrobiologia,
135, 193–196.
Warwick R.M. (1980) Population dynamics and secondary
production of benthos. In: Tenore K.R., Coull B.C. (Eds),
Marine Benthic Dynamics. The Belle W. Baruch Library in
Marine Science, Columbia: 1–24.
Warwick R.M., George C.L. (1980) Annual macrofauna
production in an Abra community. In: Collins M.B. (Ed.),
Industrialized Embayments and Their Environmental Prob-
lems. Pergamon, Oxford: 517–538.
Warwick R.M., Price R. (1975) Macrofauna production in an
estuarine mud-flat. Journal of the Marine Biological Associa-
tion of the United Kingdom, 55, 1–8.
Warwick R.M., Radford P.J. (1989) Analysis of the flow network
in an estuarine benthic community. In: Wulff F., Field J.G.,
Mann K.H. (Eds), Network Analysis in Marine Ecology: Meth-
ods and Applications. Springer-Verlag, New York: 220–231.
Warwick R.M., George C.L., Davies J.R. (1978) Annual macro-
fauna production in a Venus community. Estuarine and
Coastal Marine Science, 7, 215–241.
Warwick R.M., Ashman C.M., Brown A.R., Clarke K.R., Dowell
B., Hart B., Lewis R.E., Shillabeer N., Somerfield P.J., Tapp
J.F. (2002) Inter-annual changes in the biodiversity and com-
munity structure of the macrobenthos in Tees Bay and the
Tees estuary, UK, associated with local and regional environ-
mental events. Marine Ecology Progress Series, 234, 1–13.
Whipple S.J., Link J.S., Garrison L.P., Fogarty M.J. (2000)
Models of predation and fishing mortality in aquatic ecosys-
tems. Fish Fisher, 1, 22–40.
Assessment of benthic ecosystem functioning Garcia, Chardy, Dewarumez & Dauvin
86 Marine Ecology 32 (Suppl. 1) (2011) 72–86 ª 2011 Blackwell Verlag GmbH