Assessment of Aspergillus niger biofilm growth kinetics in ...
10
African Journal of Biotechnology Vol. 10(62), pp. 13495-13504, 12 October, 2011 Available online at http://www.academicjournals.org/AJB DOI: 10.5897/AJB10.2672 ISSN 1684–5315 © 2011 Academic Journals Full Length Research Paper Assessment of Aspergillus niger biofilm growth kinetics in minibioreactors by carbon dioxide evolution Gretty K. Villena and Marcel Gutiérrez-Correa* Laboratorio de Micología y Biotecnología, Universidad Nacional Agraria La Molina, Av. La Molina s/n, Lima 12, Perú. Accepted 9 June, 2011 Aspergillus niger ATCC 10864 was grown on bubble minicolumns aerated with pure oxygen either as biofilm or free-mycelium submerged systems. Growth kinetics was followed by estimating biomass from released carbon dioxide using a titration method and mathematical models. Submerged cultures showed increased endogenous respiration rates (0.0298 vs. 0.0004 g biomass/g biomass.h) possibly related to stress condition since this type of growth is not the natural way of life of A. niger. On the other hand, A. niger biofilm growth followed a logistic model having higher maximal specific growth rate than submerged cultures (0.061 vs. 0.045 h -1 ). This may be related to better mass transfer processes due to a channeled mycelial microstructure. Biofilm growth can be easily and reliable assessed by evaluating the CO 2 released during the fermentation in minibioreactors. Key words: Aspergillus niger, biofilm, mathematical modeling, endogenous respiration, Cryo-SEM. INTRODUCTION Aspergillus niger is currently one of the microbial species of main biotechnological importance because it produces about 40 different commercial enzymes with different applications in the food industry, beverages, textiles, agriculture, pulp and paper and others. It is also widely used in the production of organic acids such as citric, gluconic, fumaric and oxalic acids (Ward et al., 2006). Moreover, the knowledge gained in its various fermen- tation processes, is being used in the production of recombinant proteins (Gyamerah et al., 2002; Wang et al., 2003). Additionally, many of its enzymes and citric acid have been deemed GRAS by the FDA, which has enhanced its use for food processing applications (Schuster et al., 2002). Industrial enzymes are mainly produced by submerged fermentation, although, alternatively, solid-state fermen- tation has been used on a smaller scale. In this sense, there are many reports on the analysis and comparison of these two systems in the production of enzymes in the laboratory (Aguilar et al., 2001; Díaz-Godínez et al., 2001; George et al., 1997; Hölker et al., 2004; Maldonado and Strasser de Saad, 1998; Papagianni et al., 1999, *Corresponding author. E-mail: [email protected]. Tel: +51-1-6147800 Ext. 463. 2002; Romero-Gómez et al., 2000; Viniegra-González et al., 2003). Although, solid-state fermentation has advantages related to higher productivity and concentration of enzy- mes, lower catabolic repression, among others, difficulties in the scale-up limit their ability to replace industrially submerged fermentation. However, the role of physiological and genetic properties of microorganisms growing on surfaces could explain the advantages of solid-state fermentation on submerged fermentation (Hölker et al., 2004). In this aspect, a new fermentation category, named surface adhesion fermentation (SAF), was proposed based on the importance of the cell adhesion process in the physiological characteristics and differential gene expression of attached microorganisms, particularly filamentous fungi, which at low free liquid the system behaves as solid-state fermentation and at high free liquid the system will give a biofilm fermentation (Gutiérrez-Correa and Villena, 2003). The latter process may use the infrastructure and operating characteristics of submerged fermentation, as well as opening opportunities for the design of new type of bioreactors (Villena and Gutiérrez-Correa, 2006). The growth of filamentous fungi adhered to surfaces has been commonly regarded as a type of immobi- lization, which is an engineering approach to achieve high cell densities and continuous-flow culture systems.
Transcript of Assessment of Aspergillus niger biofilm growth kinetics in ...
African Journal of Biotechnology Vol. 10(62), pp. 13495-13504, 12 October, 2011 Available online at http://www.academicjournals.org/AJB DOI: 10.5897/AJB10.2672 ISSN 1684–5315 © 2011 Academic Journals
Full Length Research Paper
Assessment of Aspergillus niger biofilm growth kinetics in minibioreactors by carbon dioxide evolution
Gretty K. Villena and Marcel Gutiérrez-Correa*
Laboratorio de Micología y Biotecnología, Universidad Nacional Agraria La Molina, Av. La Molina s/n, Lima 12, Perú.
Accepted 9 June, 2011
Aspergillus niger ATCC 10864 was grown on bubble minicolumns aerated with pure oxygen either as biofilm or free-mycelium submerged systems. Growth kinetics was followed by estimating biomass from released carbon dioxide using a titration method and mathematical models. Submerged cultures showed increased endogenous respiration rates (0.0298 vs. 0.0004 g biomass/g biomass.h) possibly related to stress condition since this type of growth is not the natural way of life of A. niger. On the other hand, A. niger biofilm growth followed a logistic model having higher maximal specific growth rate than submerged cultures (0.061 vs. 0.045 h
-1). This may be related to better mass transfer
processes due to a channeled mycelial microstructure. Biofilm growth can be easily and reliable assessed by evaluating the CO2 released during the fermentation in minibioreactors. Key words: Aspergillus niger, biofilm, mathematical modeling, endogenous respiration, Cryo-SEM.
INTRODUCTION Aspergillus niger is currently one of the microbial species of main biotechnological importance because it produces about 40 different commercial enzymes with different applications in the food industry, beverages, textiles, agriculture, pulp and paper and others. It is also widely used in the production of organic acids such as citric, gluconic, fumaric and oxalic acids (Ward et al., 2006).
Moreover, the knowledge gained in its various fermen-tation processes, is being used in the production of recombinant proteins (Gyamerah et al., 2002; Wang et al., 2003). Additionally, many of its enzymes and citric acid have been deemed GRAS by the FDA, which has enhanced its use for food processing applications (Schuster et al., 2002).
Industrial enzymes are mainly produced by submerged fermentation, although, alternatively, solid-state fermen-tation has been used on a smaller scale. In this sense, there are many reports on the analysis and comparison of these two systems in the production of enzymes in the laboratory (Aguilar et al., 2001; Díaz-Godínez et al., 2001; George et al., 1997; Hölker et al., 2004; Maldonado and Strasser de Saad, 1998; Papagianni et al., 1999,
*Corresponding author. E-mail: [email protected]. Tel: +51-1-6147800 Ext. 463.
2002; Romero-Gómez et al., 2000; Viniegra-González et al., 2003).
Although, solid-state fermentation has advantages related to higher productivity and concentration of enzy-mes, lower catabolic repression, among others, difficulties in the scale-up limit their ability to replace industrially submerged fermentation. However, the role of physiological and genetic properties of microorganisms growing on surfaces could explain the advantages of solid-state fermentation on submerged fermentation (Hölker et al., 2004). In this aspect, a new fermentation category, named surface adhesion fermentation (SAF), was proposed based on the importance of the cell adhesion process in the physiological characteristics and differential gene expression of attached microorganisms, particularly filamentous fungi, which at low free liquid the system behaves as solid-state fermentation and at high free liquid the system will give a biofilm fermentation (Gutiérrez-Correa and Villena, 2003). The latter process may use the infrastructure and operating characteristics of submerged fermentation, as well as opening opportunities for the design of new type of bioreactors (Villena and Gutiérrez-Correa, 2006).
The growth of filamentous fungi adhered to surfaces has been commonly regarded as a type of immobi-lization, which is an engineering approach to achieve high cell densities and continuous-flow culture systems.

13496 Afr. J. Biotechnol. However, this approach does not take into account that cell adhesion is a natural biological process that leads to significant morphological and physiological changes that include the differential expression of genes (Gamarra et al., 2010; Villena and Gutiérrez-Correa, 2007; Villena et al., 2009a, b, 2010). Only recently, filamentous fungi are also being considered capable of biofilm formation as do bacteria and yeasts (Gutiérrez-Correa and Villena, 2003; Harding et al., 2009; Wang and Chen, 2009). In that sense, this type of culture can lead to improved metabolite production systems. Also, different types of bioreactors are beginning to be used for biofilm fermentation by filamentous fungi (Cheng et al., 2010).
The use of small bioreactors during the early stages of biofilm research allows mathematical modeling and the results are more useful in later stages of the production process development (Villena and Gutiérrez-Correa, 2006). Due to the attached growth of biofilms, quantification of biomass in a bioreactor requires non-disruptive techniques that allow time-course experiments. The indirect estimation of growth by CO2 evolution is commonly used in solid-state fermentation (Auria and Revah, 1994) where it is difficult to directly quantify biomass, and is particularly useful for heterogeneous systems (Koutinas et al., 2003). Unlike these systems where the indirect measurement of biomass may not reflect real growth kinetics because indirect measures are difficult to interpret, the use of CO2 as an indicator of growth in both submerged and biofilm cultures where it is possible to directly quantify biomass, is a simpler alternative compared to other noninvasive methods such as image analysis. In this study, a growth kinetics assessment of A. niger biofilms was carried out by using a low cost and reliable method for estimating fungal biomass. MATERIALS AND METHODS Fungal strain and culture medium In this study, A. niger ATCC 10864 was used. The strain was maintained on potato dextrose agar (PDA) slants. For the inoculum, spores were washed from 5-day PDA plates, using 10 mL of 0.1% (v/v) Tween 80 to a final concentration of 1 x 10
6 spores per mL.
The growth medium composition (Duff, 1988) per liter was: KH2PO4, 2 g; CaCl2.2H2O, 0.3 g; MgSO4.7H2O, 0.3 g; urea, 0.3 g; NH2SO4, 1.4 g, Tween 80, 2 ml; FeSO4.7H2O, 5 mg; MnSO4.2H2O, 1.6 mg; ZnSO4.7H2O, 1.4 mg; CoCl2.6H2O, 2 mg; and lactose, 10 g. The initial pH of culture medium was 5.5. Minibioreactors Bubble minicolumns made of 15 x 3 cm glass tubes were used as bioreactors, as previously reported (Villena and Gutiérrez-Correa, 2006). However, each reactor was modified to connect the spout gas tube to a collecting glass vial containing 25 mL of 1.5 N NaOH solution, as shown in Figure 1 (A, C-E). For biofilm cultures, each reactor contained a 3.6 x 1.5 cm piece of polyester cloth attached to a stainless steel spiral frame placed on the central shaft tube. Pure
oxygen at 3.6 L/h was sparged through the liquid culture from a 30-G syringe needle connected to the bottom end of the shaft tube. Minibioreactor cultivation Minibioreactors have become relevant in small-scale experiments, and the bubble minicolumns have shown the same behavior as laboratory reactors, in contrast to shaken flasks. These types of minireactors are particularly useful for systems with moderate oxygen demands (Kumar et al., 2004).
Biofilm and free mycelium cultures were performed in minibioreactors containing 40 mL of growth medium. Each minibioreactor was inoculated with a 3% (v/v) spore suspension (1 x 10
6 spores/mL). For biofilm cultures, each minibioreactor containing
40 mL of sterile distilled water was inoculated as aforementioned and incubated at 175 rpm for 30 min at room temperature. Then, it was washed two times to remove the unbound spores and the wash water was replaced by 40 mL of growth medium to start the fermentation. To avoid foaming, Sigma antifoam 289 was used. The inoculated minibioreactors were connected to the oxygen supply and incubated in a controlled water bath at 28°C (Figure 1B). Four replicates were used for each sampling point.
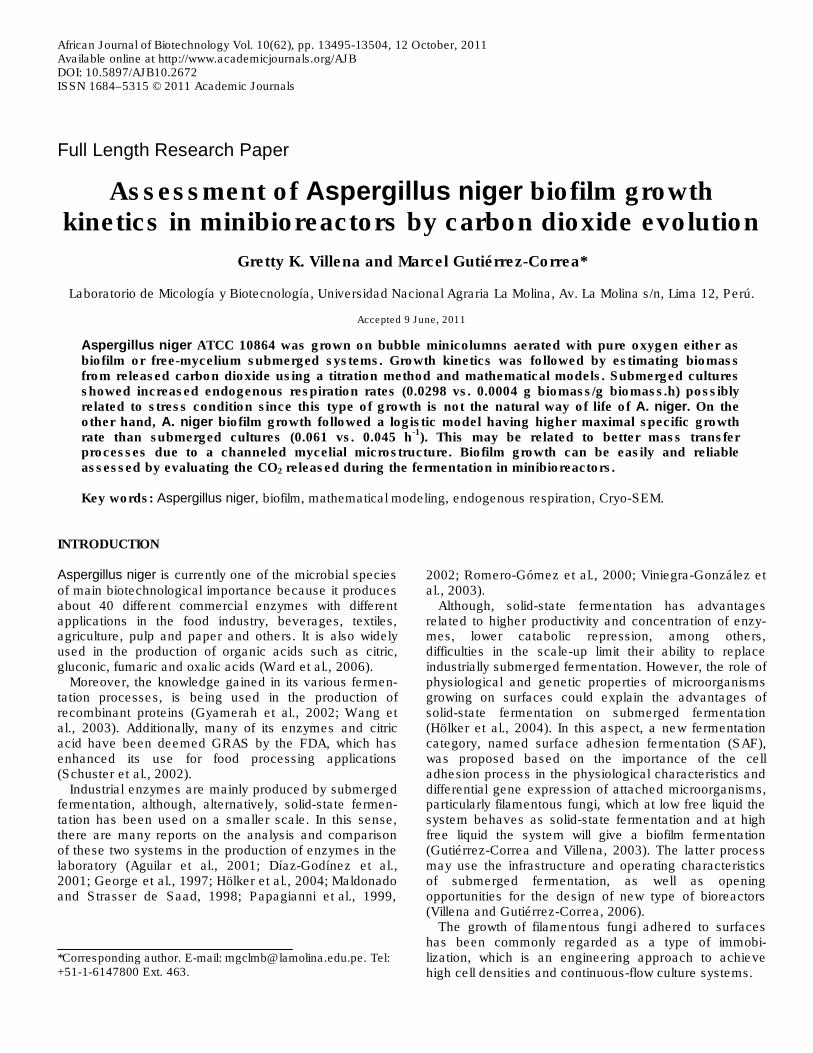
Biomass was measured by determining the dry weight of each sample. For submerged fermentation cultures, the total content of each minibioreactor was vacuum filtered using pre-weighed filter paper (Whatman No. 1), which was then dried at 80°C to constant weight. Biofilm cultures support with biofilms were removed, washed three times and dried at 80°C to constant weight; the remaining detached biomass was filtered in the same way for submerged fermentation cultures. Determination of endogenous respiration Endogenous respiration rate was determined using 72 h growth cultures grown on medium containing 2% glycerol as the sole carbon source. The cultures were washed repeatedly with sterile 100 mM phosphate buffer, pH 6.5, and incubated at 175 rpm for 2 h at 28°C to exhaustion of nutrients in the mycelium. From this, biofilm or mycelium samples were transferred to flasks containing 20 mL 100 mM phosphate buffer, pH 6.5, and incubated without agitation at 28°C for 14 h to determine the amount of CO2 produced as shown in Figure 2. Four replicates were used for each sampling point.
The CO2 produced was quantified as described by Sugama and Okasaki (1979). The CO2 was collected in flasks containing 25 mL of 1.5 N NaOH. For titration, the content of each flask was transferred to a 250 mL flask and 10 mL of 10% BaCl2 solution were added. The mixture was titrated to pH 9 with 1.5 N HCl. The amount of CO2 (mg) was calculated from this titer (a ml) and that (b mL) of an equal volume used by a blank NaOH solution using the following relationship:
CO2 (mg) = (b – a) x Normality x weight equivalent (1)
Cryo-scanning electron microscopy (cryo-SEM)
Either biofilm or mycelium samples were immersed in 10% glycerol for 2 h at 4°C. Then, they were thoroughly washed with 0.05 M phosphate buffer (pH 7.4) and frozen by plunging them into liquid nitrogen. Surface water was removed by sublimation at -65°C for 10 min and specimens were sputter-coated with gold (Villena and Gutiérrez-Correa, 2007). Samples were then examined at -80°C in a LEO 1420 PV variable pressure scanning electron microscope (LEO Electron Microscopy, Cambridge, U.K.).

Villena and Gutiérrez-Correa 13497
Figure 1. Minibioreactor experimental set. Diagram of minibioreactor of bubble column type showing connection to CO2 collector vial (A). Diagram of a battery of minibioreactors (B). Close-up photographs of minibioreactors (C-E).
Mathematical models
Kinetic models contribute to the basic knowledge needed in the design and optimization of fermentation processes. Currently, available models are useful to describe and predict growth, consumption and product formation, among others, allowing the analysis and validation of models in certain conditions. On the other hand, work on a small scale, as a starting point for process optimization, is gaining increased research interest (Schäpper et al., 2009). Small-scale work has the advantage of parallelization, repetition and control of variables at reduced costs. Since microbial growth is associated with the consumption of oxygen and nutrients and the production of heat, water vapor, carbon dioxide or other products, the Pirt model can be successfully used to predict growth from CO2 levels produced during fermentation.
Balance equations were used for biomass and lactose consumption to describe the fermentation process in both systems. Also, a model was obtained to predict fungal growth from accumulated CO2 and its usefulness as an indirect and noninvasive method in predicting growth was evaluated.
Biomass production was estimated as x (g/L) by the logistic equation (Liu et al., 2003; Wachenheim et al., 2003; Weiss and
Ollis, 1980):
−=
m
mx
x
dt
dx1µ (2)
Where, µm is the maximum specific growth rate (h-1
) and xm is the maximal biomass concentration reached when dx/dt = 0 for x > 0. The solution of Equation (2) when x0 is the initial condition at t = 0, is:
tm
m
mex
xx
xtx
µ−
−+
=
0
01
)( (3)
The rate of CO2 production can be described with linear-growth model of Pirt as (Lareo et al., 2006):
13498 Afr. J. Biotechnol.
Figure 2. Diagram (A) and photograph (B) of the device used for measuring endogenous respiration.
xmdt
dx
Ydt
dCOCO
COx2
2/
2 1+= (4)
Replacing Equations (2) and (3) into Equation (4) the following expression is obtained:
+
−
+
+
−
−=−−
1111
11
00
/
2
2
2 tm
m
CO
tmCOx
m
mm ex
x
xm
ex
xYdt
dCO
µµ
µ (5)
Solving Equation (5) as a function of t, Equation (6) is as follows:
+
−
+−
+
−
+=−
−
− tm
tm
m
CO
m
COxtm
COx
m
m
m
m ex
x
ex
x
m
x
xYe
x
xY
xCOtCOµ
µ
µ µ
0
0
0
/
0
/
)0(22
11
ln.1
11
1)( 2
22
(6)
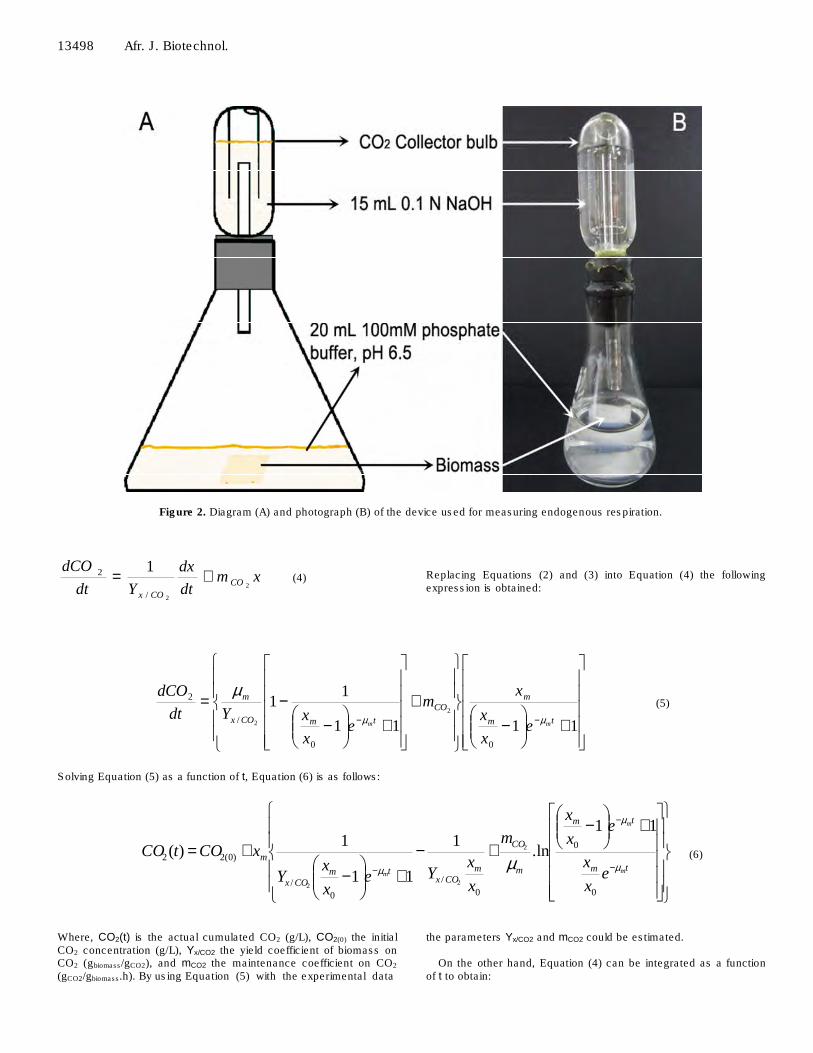
Where, CO2(t) is the actual cumulated CO2 (g/L), CO2(0) the initial CO2 concentration (g/L), Yx/CO2 the yield coefficient of biomass on CO2 (gbiomass/gCO2), and mCO2 the maintenance coefficient on CO2 (gCO2/gbiomass.h). By using Equation (5) with the experimental data
the parameters Yx/CO2 and mCO2 could be estimated.
On the other hand, Equation (4) can be integrated as a function of t to obtain:

Villena and Gutiérrez-Correa 13499
+= ∫
−t
tYm
COx
tYm
dt
dCOeYxetx COxCOCOxCO
0
2
/02/2
2
2/2)((7)
This integral cannot be solved analytically but by numerical methods. The solution of Equation (7) gives:
( )
++= ∑
=+
− n
i
ii
t
i xtytyh
etxi
0
01 )()(2
1)( α
αα
β
(8)
Where,
dt
dCOety
it
i
2)(
= α
β
(9)
2/
1
COxY=α (10)
2COm=β (11)
Therefore, by using Equation (8) it is possible to estimate the values of x(t) from the experimental determination of dCO2/dt knowing the values of Yx/CO2 and mCO2.
The quantification of endogenous respiration is an alternative way to evaluate the provision of energy for maintaining cell viability. The maintenance energy comes from the degradation or oxidation of the biomass when the limiting substrate has been completely consumed. Under these conditions, cell growth is negligible and the balance of biomass can be expressed as:
xkdt
dxe−= (12)
Where, ke is the coefficient of endogenous respiration (gbiomass/gbiomass.h). The second term in this equation can be considered as the rate of cell death. Assuming ke as a constant, Equation (12) can be solved as a function of t:
( )1
1)(
ttk
teextx
−−= (13)
Where, t1 is the time at which the substrate is fully consumed and xt1 is the biomass at time t1. Therefore, the balance equation for CO2 production can be simplified to:
xmdt
dCOCO 2
2 = (14)
Replacing Equation (13) into Equation (14) and solving as function of time:
( )
e
ttk
tCO
e
tCO
k
exm
k
xmtCOtCO
e 1
1212)()( 122
−−
−+=
(15)
By using Equation (15) with the experimental data, ke could be estimated.
Statistical analysis
Data were analyzed by statistical analysis system (Version 8.1) software (SAS Institute, Inc., Cary, NC, USA). Model parameters were estimated using the model OLS procedure with Gauss method of SAS software, which minimizes the experimental and estimated data.
RESULTS A. niger ATCC 10864 grown on bubble minicolumns aerated with pure oxygen either as biofilm or free-mycelium submerged systems. As freely suspended mycelium, A. niger grew producing compact and fluffy pellets. This could be due to higher shear stress attained by oxygen bubbling in minibioreactors. On the other hand, attached growth on the polyester cloth gave a well developed biofilm with neither freely floating mycelium nor sloughing. Morphology of mycelium in submerged and biofilm cultures is depicted in Figure 3. Superficial cryo-SEM views of biofilm mycelium and pellet are clearly different. Biofilm mycelium showed an orderly distribution of hyphae with both surface and inner channeled structure (Figure 3A), while pellet mycelium showed highly intertwined superficial hyphae and a densely packed deep mycelium (Figure 3B).
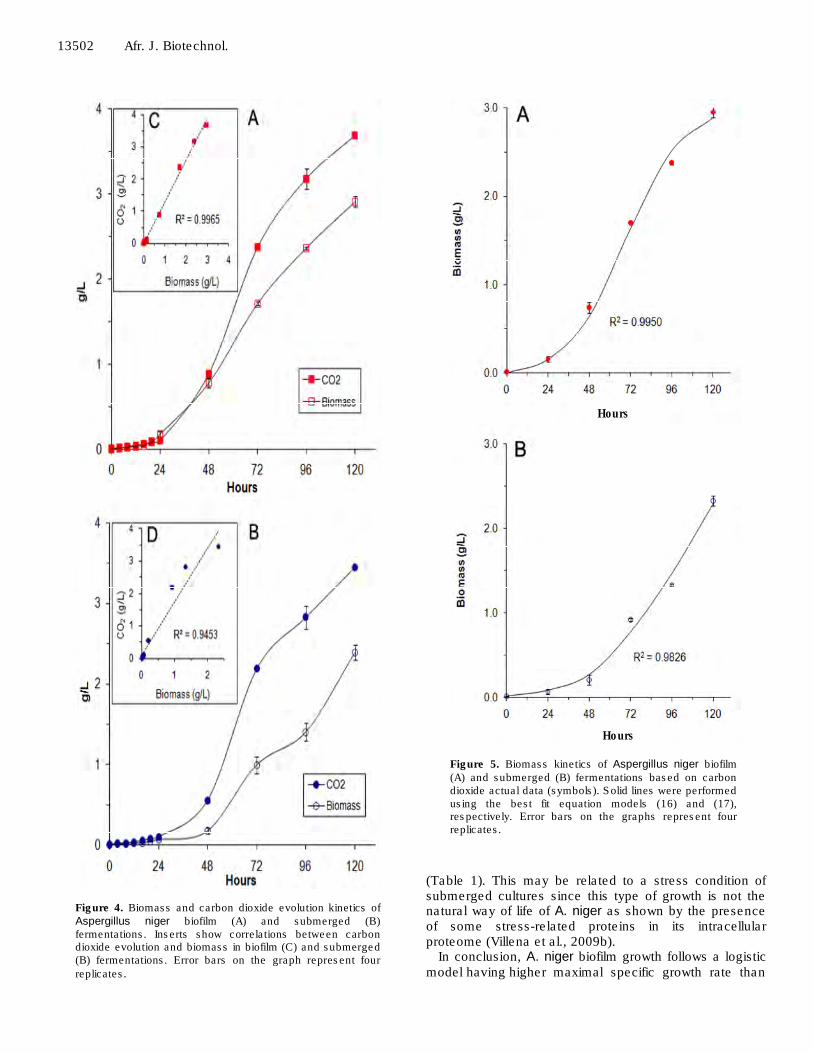
Figure 4 shows the growth kinetics of both biofilm and submerged cultures. In both cases, there was a trend of logistic growth with a longer lag phase for the submerged culture (Figure 4A, B). Model Equation (4) was used to describe the accumulation of CO2, as a product of cellular respiration primarily intended to produce energy for biomass production. The correlation coefficients (R2 > 0.9) confirmed a close relationship between the amounts of CO2 produced and cell growth, especially for biofilm cultures, as shown in Figure 4C and D. In both systems, during the first hours of growth, production of CO2 was coincident with the growth and in biofilm cultures both curves showed the same trend over time (Figure 4A). However, in submerged culture (Figure 4B) at 72 h,

13500 Afr. J. Biotechnol.
Figure 3. Cryo-scanning electron microscope photographs of Aspergillus niger biofilm (A) and pellet from submerged fermentation (B). Bars represent 20 µm.
growth there was an inflection in the growth curve deviating from the production of CO2 curve. This is also reflected in lower coefficients of correlation (R2 = 0.94) compared to that obtained in biofilm cultures.
Figure 5 shows the biomass kinetics adjustment based on the CO2 produced, according to Equation 7, which gave the model Equation (16) for biofilm cultures and Equation (17) for submerged cultures.

Villena and Gutiérrez-Correa 13501 (16) (17) The data fit the model satisfactorily, with correlation coefficients above 0.9. Again, the experimental behavior of biofilms was closest to the predictions of the model (Figure 5A) compared to that obtained in submerged culture (Figure 5B). Parameters estimated with model equations are depicted in Table 1. Values of Yx/CO2 and mCO2 are remarkably different between the two culture systems, showing that in biofilms much CO2 is produced almost directly by cell growth while in submerged culture only a fraction of CO2 comes directly from the growth. Furthermore, the endogenous respiration coefficient was higher in submerged culture. In biofilms, the estimated value showed high variability so it cannot be sure it is different from zero, although, experimental data indicate a minimum value.
DISCUSSION
Fermentation is a very complex process, and it is often very difficult to obtain a complete picture of what is actually going on in a particular fermentation. A model is that which describes relationships between principal state variables and explains quantitatively the behavior of a system. The model can provide useful suggestions for the analysis, design and operation of a fermenter. Mathematical modeling is an essential tool for optimizing bioprocesses. Not only can models guide the design and operation of bioreactors but they can also provide insights into how the various phenomena within the fermentation system combine to control overall process performance (Mitchell et al., 2003). Fermentation models are normally divided into two classes: structured models where intracellular metabolic pathways are considered and unstructured models where the biomass is described by one variable. Structured model seems complicated for normal use. Unstructured models are much easier to use, and have proven to accurately describe much fermentation.
Biofilm fermentation may be an alternative to solid state fermentation since it combines the advantages of the latter system and the use of the submerged fermentation technology (Villena and Gutiérrez-Correa, 2006, 2007; Gamarra et al., 2010). Unfortunately, there are very few
reports on enzyme production by A. niger biofilms because filamentous fungal biofilms are just beginning to be accepted as another type of fermentation systems (Harding et al., 2009). Therefore, both simple and complex kinetic analyses are needed to understand and utilize A. niger biofilms as industrial production systems. To implement a fermentation process based on filamentous fungal biofilms, the determination of biomass concentration throughout fermentation is essential. In order to accomplish this, the problem caused by the attached growth on solid supports should be overcome. Since the use of a direct analytical method such as the dry weight method is impractical, the use of an indirect estimation method is the only alternative. Non disruptive methods like CO2 evolution may be useful to estimate cell growth in biofilm systems by applying a mathematical model that correlates fungal growth with CO2 evolution (Koutinas et al., 2003). However, the estimation of biomass by CO2 requires that the Yx/CO2 and mCO2 values are known, which may vary significantly according to growing conditions (Koutinas et al., 2003).
The estimated values of mCO2 and Yx/CO2 for biofilm cultures are in the range of those reported for other fungal species while those in submerged cultures are significantly lower (Gelmi et al., 2002; Lareo et al., 2006). Low mCO2 and Yx/CO2 values may be associated with oxygen limitation conditions but because the aeration conditions for both systems were the same, differences in oxygen transfer could be related to morphologies developed in each case. As seen in Figure 3, morphologies of biofilm and pellets formed in submerged fermentation are different being biofilms characterized by a channeled structure that allows better mass transfer processes as was previously shown (Villena and Gutiérrez-Correa, 2006, 2007; Villena et al., 2010). Also, assuming that CO2 produced comes mainly from the oxidation of the carbon source (Lareo et al., 2006), and this is not a limiting nutrient, the value of Yx/CO2 for submerged cultures suggests transfer limitations directing the provision of energy for maintenance from endogenous respiration since higher ke values were found in this type of culture (Table 1). Moreover, biofilm cultures attained higher maximal specific growth rates (µm
= 0.061 h-1) than submerged cultures (µm = 0.045 h-1)
+= ∫
−−
dt
dCOeetx
t
tt 2
0
0188.001880.9912.00463.0.)(
+= ∫
−
dt
dCOeetx
t
tt 2
0
0011.00011.0.3388.00338.0.)(
13502 Afr. J. Biotechnol.
Figure 4. Biomass and carbon dioxide evolution kinetics of Aspergillus niger biofilm (A) and submerged (B) fermentations. Inserts show correlations between carbon dioxide evolution and biomass in biofilm (C) and submerged (B) fermentations. Error bars on the graph represent four
replicates.
Hours
Hours
Figure 5. Biomass kinetics of Aspergillus niger biofilm (A) and submerged (B) fermentations based on carbon dioxide actual data (symbols). Solid lines were performed using the best fit equation models (16) and (17), respectively. Error bars on the graphs represent four replicates.
(Table 1). This may be related to a stress condition of submerged cultures since this type of growth is not the natural way of life of A. niger as shown by the presence of some stress-related proteins in its intracellular proteome (Villena et al., 2009b).
In conclusion, A. niger biofilm growth follows a logistic model having higher maximal specific growth rate than

Villena and Gutiérrez-Correa 13503
Table 1. Estimated growth kinetic parameters of Aspergillus niger biofilm and submerged fermentations in minibioreactors according to model equations.
Estimated parameter Biofilm fermentation Submerged fermentation
xo (g/L) 0.045 ± 0.013 0.035 ± 0.016
xm (g/L) 2.99 ± 0.11 3.26 ± 0.64
µmax (h-1
) 0.061 ± 0.005 0.045 ± 0.007
1/YX/CO2 (g/g) 1.009 ± 0.107 2.950 ± 0.922
mCO2 (g CO2/g biomass. h) 0.0198 ± 0.0020 0.0034 ± 0.0026
keCO2 (g biomass/g biomass.h) 0.0004 ± 0.0001 0.0298 ± 0.0068
keCO2 calc
(g biomass/g biomass.h) 0.0279 0.0514
Initial biomass concentration (x0), maximal biomass concentration (xm), maximal specific growth rate (µmax), yield coefficient of biomass based on CO2 (Yx/CO2) and maintenance coefficient on CO2 (mCO2) were estimated by Equation (6). Endogenous respiration coefficient (keCO2) was estimated by Equation (15); keCO2
calc is the endogenous respiration
coefficient calculated from experimental data. The Model OLS procedure with Gauss method of SAS softwarewas used to estimate parameters.
submerged cultures. This may be related to better mass transfer processes due to a channeled mycelial microstructure. Biofilm growth can be easily and reliable assessed by evaluating the CO2 released during the fermentation in bioreactors. The method hereby described may be improved and facilitated by using either an automatic titration system or a dedicated gas chromatographer. ACKNOWLEDGEMENTS This research was supported by grant N0 072-FINCyT-PIN2008 from the National Program of Science and Technology (Peru). The authors wish to thank Dr. Consuelo Arellano (Department of Statistics, North Carolina State University) for her helpful comments on the mathematical models. REFERENCES Aguilar CN, Augur C, Favela-Torres E, Viniegra-González G (2001).
Production of tannase by A. niger Aa-20 in submerged and solid state fermentation: influence of glucose and tannic acid. J. Indust. Microbiol. Biotechnol. 26: 296-302.
Auria R, Revah S (1994). Pressure drop as a method to evaluate mold growth in solid state fermentation. In: Galindo E, Ramirez OT (eds) Advances in Bioprocess Engineering. Kluver Academics Pub. Netherlands, pp. 289-294.
Cheng K-C, Demirci A, Catchmark JM (2010). Advances in biofilm reactors for production of value-added products. Appl. Microbiol. Biotechnol. 87: 445-456.
Díaz-Godínez G, Soriano-Santos J, Augur C, Viniegra-Gonzales G (2001). Exopectinases produced by Aspergillus niger in solid-state and submerged fermentation: a comparative study. J. Indust. Microbiol. Biotechnol. 26: 271-275.
Duff JB (1988). Use of surface-immobilized Trichoderma in batch and fed-batch fermentations. Biotechnol. Bioeng. 31: 345-348.
Gamarra, NN, Villena GK, Gutiérrez-Correa M (2010). Cellulase production by Aspergillus niger in biofilm, solid-state and submerged
fermentations. Appl. Microbiol. Biotechnol. 87: 545-551. Gelmi C, Pérez-Correa R, Agosin E (2002). Modelling Gibberella
fujikuroi growth and GA3 production in solid-sate fermentation.
Process Biochem. 37: 1033-1040. George S, Subramanian TV, Jayaraman K (1997). Comparative study
of protease production in solid substrate fermentation versus submerged fermentation. Bioprocess Eng. 16: 381-382.
Gutiérrez-Correa M, Villena GK (2003). Surface adhesion fermentation: a new fermentation category. Rev. Peru. Biol. 10: 113-124.
Gyamerah M, Merichetti G, Adedayo O, Scharer JM, Moo-Young M (2002). Bioprocessing strategies for improving hen egg-white lysozyme (HEWL) production by recombinant Aspergillus niger
HEWL WT-13 - 16. Appl. Microbiol. Biotechnol. 60: 403-407. Harding MW, Marques LLR, Howard RJ, Olson ME (2009). Can
filamentous fungi form biofilms? Trends Microbiol. 17: 475-480. Hölker U, Höfer M, Lenz J (2004). Biotechnological advantages of
laboratory-scale solid-state fermentation with fungi. Appl. Microbiol. Biotechnol. 64: 175-186.
Koutinas AA, Wang R, Webb C (2003). Estimation of fungal growth in complex, heterogenous culture. Biochem. Eng. J. 14: 93-100.
Kumar S, Wittman C, Heinzle E (2004). Minibioreactors. Biotechnol. Lett. 26: 1-10.
Lareo C, Sposito AF, Bossio AL, Volpe DA (2006). Characterization of growth and sporulation of Mucor bacilliformis in solid state
fermentation on an inert support. Enzyme Microb. Technol. 38: 391-399.
Liu JZ, Weng LP, Zhang QL, Xu H, Ji LN (2003). A mathematical model for gluconic acid fermentation by Aspergillus niger. Biochem. Eng. J. 14: 137-1145.
Maldonado MC, Strasser de Saad AM (1998). Production of pectinesterase and polygalacturonase by Aspergillus niger in submerged and solid state systems. J. Indust. Microbiol. Biotechnol. 20: 34-38.
Mitchell DA, von Meien OF, Krieger N (2003). Recent developments in modeling of solid-state fermentation: heat and mass transfer in bioreactors. Biochem. Eng. J. 13: 137–147.
Papagianni M, Nokes S, Filer K (1999). Production of phytase by Aspergillus niger in submerged and solid-state fermentation. Process Biochem. 35: 397-402.
Papagianni M, Joshi N, Moo-Young M (2002). Comparative studies on extracellular protease secretion and glucoamylase production by free and immobilized Aspergillus niger cultures. J. Indust. Microbiol.
Biotechnol. 29: 259-263. Romero-Gómez SJ, Augur C, Viniegra-Gónzalez G (2000). Invertase
production by Aspergillus niger in submerged and solid-state
fermentation. Biotechnol. Lett. 22: 1255-1258. Schäpper D, Alam MN, Szita N, Eliasson Lantz A, Gernaey KV (2009).
Application of microbioreactors in fermentation process development: a review. Anal. Bioanal. Chem. 395: 679-695.
Schuster E, Dunn-Coleman N, Frisvad JC, van Dijck PWM (2002). On the safety of Aspergillus niger – a review. Appl. Microbiol. Biotechnol. 59: 426-435.

13504 Afr. J. Biotechnol. Sugama S, Okasaki N (1979). Growth estimation of Aspergillus oryzae
cultured on solid media. J. Ferment. Technol. 57: 408-412. Villena GK, Gutierrez-Correa M (2006). Production of cellulase by
Aspergillus niger biofilms developed on polyester cloth. Lett. Appl. Microbiol. 43: 262-268.
Villena GK, Gutiérrez-Correa M (2007). Morphological patterns of Aspergillus niger biofilms and pellets related to lignocellulolytic enzyme productivities. Lett. Appl. Microbiol. 45: 231-237.
Villena GK, Fujikawa T, Tsuyumu S, Gutiérrez-Correa M (2009a). Differential gene expression of some lignocellulolytic enzymes in Aspergillus niger biofilms. Rev. Peru. Biol. 15: 97-102.
Villena GK, Venkatesh L, Yamazaki A, Tsuyumu S, Gutiérrez-Correa M
(2009b). Initial intracellular proteome profile of Aspergillus niger biofilms. Rev. Peru. Biol. 16: 101-108.
Villena GK, Fujikawa T, Tsuyumu S, Gutiérrez-Correa M (2010). Structural analysis of biofilms and pellets of Aspergillus niger by confocal laser scanning microscopy and cryo scanning electron microscopy. Bioresour. Technol. 101: 1920-1926.
Viniegra-González G, Favela-Torres E, Aguilar CN, Rómero-Gomez SJ, Díaz-Godínez G, Augur C (2003). Advantages of fungal enzyme production in solid state over liquid fermentation systems. Biochem. Eng. J. 13: 157-167.
Wachenheim DE, Patterson JA, Ladisch MR (2003). Analysis of logistic
function model: derivation and application specific to batch cultured microorganism. Bioresour. Technol. 86: 157-164.
Wang L, Ridgway D, Gu T, Moo-Young M (2003). Effects of process parameters on heterologous protein production in Aspergillus niger fermentation. J. Chem. Technol. Biotechnol. 78: 1259-1266.
Wang Z-W, Chen S (2009). Potential of biofilm-based biofuel production. Appl. Microbiol. Biotechnol. 83: 1-18.
Ward OP, Qin WM, Dhanjoon J, Ye J, Singh A (2006). Physiology and biotechnology of Aspergillus. Adv. Appl. Microbiol. 58: 1-75.
Weiss RM, Ollis OF (1980). Extracellular microbial polysaccharides. I. Substrate, biomass, and product kinetic equations for batch xanthan gum fermentation. Biotechnol. Bioeng. 22: 859-873.