ASSESSMENT NOTE: FOOD AND NUTRITION - · PDF fileFULL OPTION SCIENCE SYSTEM MAGNETISM AND ......
56
MAGNETISM AND ELECTRICITY 1 FOOD AND NUTRITION ASSESSMENT FOOD AND NUTRITION Grade 6 Version This folio contains a variety of resources that help teachers assess student progress in reaching Grade Level Expectations (GLEs) as outlined in the Essential Academic Learning Requirements (EALRs) for science. These materials have been designed for Washington State teachers using the 2000 edition of FOSS. Look in the Assessment Overview, available at www.smerc.org, for more on how to use these classroom-based assessments. Scoring guides for each of the assessments begin on page 4, using a +//– rubric. + going beyond expectations meeting expectations – below expectations The summative assessment scores more complex items with a 0-4 rubric. 4 going beyond expectations 3 meeting expectations 2 close to expectations 1 below expectations 0 off task, or no response WASHINGTON EDITION ASSESSMENT CONTENTS Investigations 1 - 4 4 End-of-Module Assessment 45 Assessment Blueprint 56 INVESTIGATION DUPLICATION MASTER CHANGES: See page 3 Grade 6 Version NOTE: This edition is the result of collaboration among FOSS staff at Lawrence Hall of Science, the Science and Math Education Resource Center (SMERC) at ESD 112, and many dedicated teachers in Washington State. The Washington Edition was made possible by the generous support of the following organizations: Delta Education; Educational Service District 112; Eisenhower Funding; Hewle�- Packard; Intel; Lawrence Hall of Science at the University of California, Berkeley; Washington State School Districts; and Washington State University, Vancouver.
Transcript of ASSESSMENT NOTE: FOOD AND NUTRITION - · PDF fileFULL OPTION SCIENCE SYSTEM MAGNETISM AND ......
MAGNETISM AND ELECTRICITYFULL OPTION SCIENCE SYSTEM 1FOOD AND NUTRITION
ASSESSMENTFOOD AND NUTRITION
Grade 6 Version
This folio contains a variety of resources that help teachers assess student progress in reaching Grade Level Expectations (GLEs) as outlined in the Essential Academic Learning Requirements (EALRs) for science. These materials have been designed for Washington State teachers using the 2000 edition of FOSS. Look in the Assessment Overview, available at www.smerc.org, for more on how to use these classroom-based assessments.
Scoring guides for each of the assessments begin on page 4, using a +//– rubric. + going beyond expectations meeting expectations – below expectations
The summative assessment scores more complex items with a 0-4 rubric. 4 going beyond expectations 3 meeting expectations 2 close to expectations 1 below expectations 0 off task, or no response
WASHINGTON EDITION
ASSESSMENT CONTENTSInvestigations 1 - 4 4End-of-Module Assessment 45Assessment Blueprint 56
INVESTIGATION DUPLICATION MASTER CHANGES:See page 3
Grade 6 Version
NOTE: This edition is the result of collaboration among FOSS staff at Lawrence Hall of Science, the Science and Math Education Resource Center (SMERC) at ESD 112, and many dedicated teachers in Washington State.
The Washington Edition was made possible by the generous support of the following organizations: Delta Education; Educational Service District 112; Eisenhower Funding; Hewle�-Packard; Intel; Lawrence Hall of Science at the University of California, Berkeley; Washington State School Districts; and Washington State University, Vancouver.

FULL OPTION SCIENCE SYSTEMFULL OPTION SCIENCE SYSTEM2 Grade 6 Version
FULL OPTION SCIENCE SYSTEM MAGNETISM AND ELECTRICITY 3FOOD AND NUTRITION
WASHINGTON EDITION
Grade 6 Version
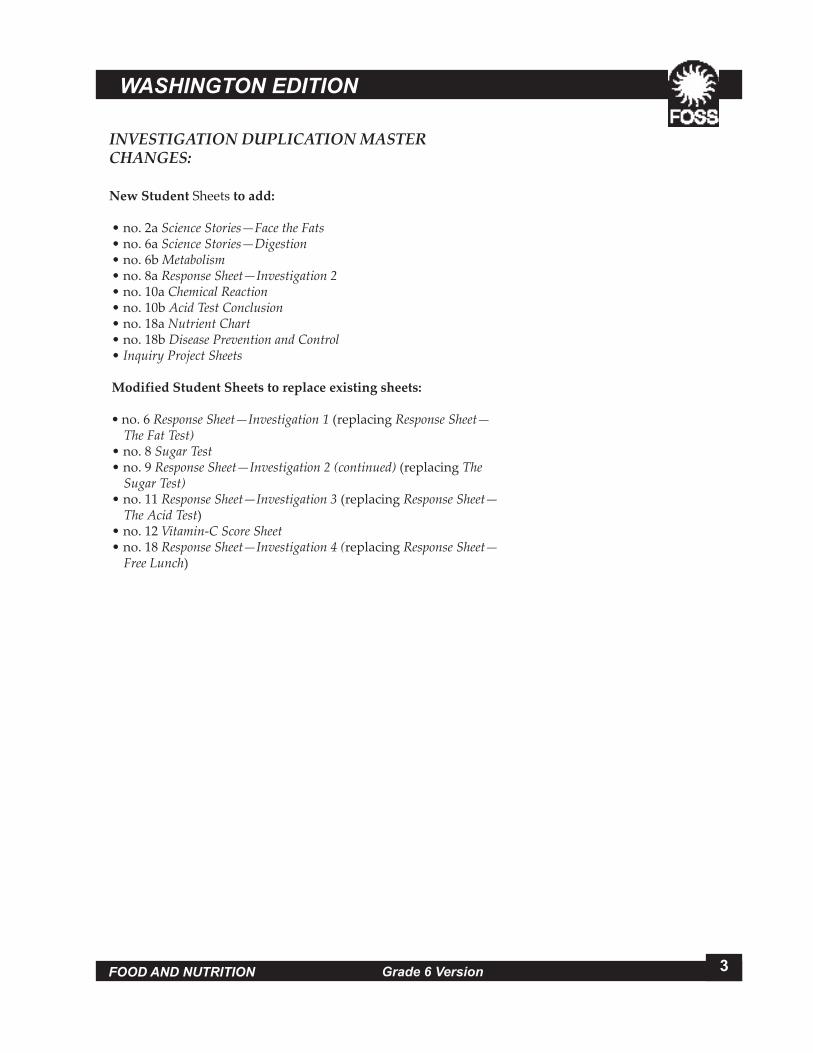
INVESTIGATION DUPLICATION MASTER CHANGES:
New Student Sheets to add:
• no. 2a Science Stories—Face the Fats• no. 6a Science Stories—Digestion• no. 6b Metabolism• no. 8a Response Sheet—Investigation 2• no. 10a Chemical Reaction• no. 10b Acid Test Conclusion• no. 18a Nutrient Chart• no. 18b Disease Prevention and Control• Inquiry Project Sheets
Modified Student Sheets to replace existing sheets:
• no. 6 Response Sheet—Investigation 1 (replacing Response Sheet—The Fat Test)
• no. 8 Sugar Test• no. 9 Response Sheet—Investigation 2 (continued) (replacing The
Sugar Test)• no. 11 Response Sheet—Investigation 3 (replacing Response Sheet—
The Acid Test)• no. 12 Vitamin-C Score Sheet• no. 18 Response Sheet—Investigation 4 (replacing Response Sheet—
Free Lunch)

4 FULL OPTION SCIENCE SYSTEM
INQUIRY INVESTIGATION SUMMARY
PART 1
Grade 6 Version
PART 2
SETTING UP THE FAT TEST
• How can we tell how much fat is in a particular food?
Time: 50–60 minutes
READING THE FAT TEST
• What does the size of the grease spot tell us about the amount of fat in the food?
Time: 45 minutes
Students discuss fats in foods. They conduct a fat search, using brown paper as an indicator.
Students look at the stains on the brown paper to determine which foods contain fat. They lay a grid over the grease spots to measure their size. They compare the relative size of the grease spots to estimate the percentage of fat in each food.
INVESTIGATION 1: THE FAT TEST

5FOOD AND NUTRITION
WASHINGTON EDITION—AT A GLANCECONCEPTS AND PRINCIPLES ASSESSMENT OPPORTUNITIES
Grade 6 Version
New Student Sheet
Science Stories—Face the Fats
Forms of Energy. Forms of Energy. Understand that energy is a property of ma�er, objects, and systems and comes in many forms (i.e., heat [thermal] energy, sound energy, light energy, electrical energy, kinetic energy, potential energy, and chemical energy). (GLE 1.1.4)
Life Processes and the Flow of Ma�er and Energy. Understand how individual organisms, including cells, obtain ma�er and energy for life processes. (GLE 1.3.8)
Examples of questions students might generate for inquiry projects.
• Do cooked hot dogs have less fat than uncooked hot dogs?
• Does temperature affect the outcome of The Fat Test?
• Brown paper can be used to indicate fat content in foods.
• Relative amounts of fat can be determined by controlling variables in the fat test.
• Relative amounts of fat can be determined by controlling variables in the fat test.
• Foods can contain two kinds of fats, saturated (solid at room temperature) or unsaturated (liquid at room temperature).
Modified Student Sheet
Response Sheet—Investigation 1
Explaining. Apply understanding of how to construct a scientific explanation using evidence and inferential logic. (GLE 2.1.3)
Planning and Conducting Safe Investigations. Understand how to plan and conduct scientific investigations. (GLE 2.1.2 )
New Student Sheet
Science Stories—Digestion
Human Body. Understand human life functions and the interconnecting organ systems necessary to maintain human life. (GLE 1.2.8)

FULL OPTION SCIENCE SYSTEMFULL OPTION SCIENCE SYSTEM6 Grade 6 Version FULL OPTION SCIENCE SYSTEM
No. 2a—New Student Sheet
FORMATIVE ASSESSMENT
INVESTIGATION 1: THE FAT TESTPART 1: SETTING UP THE FAT TEST Read “Face the Fats” in the Science Stories and use new student sheet no. 2a called Science Stories—Face the Fats.
New Student Sheet—Science Stories—Face the Fats, Item 1
Forms of Energy. Understand that energy is a property of matter, objects, and systems and comes in many forms (i.e., heat [thermal] energy, sound energy, light energy, electrical energy, kinetic energy, potential energy, and chemical energy). (GLE 1.1.4)
Score If the student...
states that fat stores energy.
– is unable to answer Item 1 correctly.
New Student Sheet—Science Stories—Face the Fats, Items 2 & 3
Life Processes and the Flow of Matter and Energy. Understand that living things need constant energy and matter. (GLE 1.3.8)
Score If the student...
+ states that the energy is used to power activities of the body such as movement and digestion for Item 2, and answers 30% of the daily calorie intake for Item 3.
states that the energy is used to power activities of the body such as movement and digestion in Item 2.
– is unable to answer Item 2 and 3.
GOING FURTHER
If remediation is necessary at this point, student sheet no. 2a can be used to guide classroom discussion.

FULL OPTION SCIENCE SYSTEMFULL OPTION SCIENCE SYSTEM
1. Why does your body store fat?
2. What is the energy from fat used to power?
3. What is a healthy amount of fat the human body needs daily?
Home ConnectionLook for two food labels on some food packaging at home that contains foods similar to those you tested in the classroom. What can you tell about the amount of fat in these foods? Do you want to make any changes to your earlier predictions? Explain why.
FOSS Food and Nutrition Module© The Regents of the University of CaliforniaCan be duplicated for workshop or classroom use.
Investigation 1: The Fat TestNo. 2a—New Student Sheet
WA Edition
SCIENCE STORIES—FACE THE FATSName ________________________________ Date ___________________________________

FULL OPTION SCIENCE SYSTEMFULL OPTION SCIENCE SYSTEM8 Grade 6 Version
FORMATIVE ASSESSMENT
No. 6—Modified Student Sheet
GOING FURTHER Make sure students understand that this is a controlled experiment. All variables must be controlled except for the one you are intentionally changing, in this case the type of food.
INVESTIGATION 1: THE FAT TESTPART 2: READING THE FAT TESTUse modified student sheet no. 6 called Response Sheet—Investigation 1.
RESPONSE SHEET—INVESTIGATION 1, Item a
Explaining. Apply understanding of how to construct a scientific explanation using evidence and inferential logic. (GLE 2.1.3)
Score If the student... + writes that Sam’s conclusion is not reasonable because
the amount of potato chips and corn chips may not be the same (equal mass) and the potato chips had been le� in the bag for a longer time (overnight).
writes that Sam’s conclusion was not reasonable and gives one of the reasons above.
– writes that Sam’s conclusion was reasonable and gives an explanation.
RESPONSE SHEET—INVESTIGATION 1, Items b and c
Planning and Conducting Safe Investigations. Understand how to plan and conduct scientific investigations. (GLE 2.1.2 )
Score If the student...
+ b) explains that to compare the fat in the two types of chips (variable changed) you will need to: use equal mass of each, crunch each on the same size of brown paper and leave them over the same duration of time (variables controlled), and then measure the size of the grease spot obtained for each.
c) states that to know the percentages of fat in the chips, you would need to compare the size of the grease spot for each type of chip with that of the size of the grease spot of an equal mass of food that has 100% fat (such as cooking oil).
b) gives one of the variables changed listed above for b. c) states that the grease spots made by both chips are
compared with grease spots le� by oil without explaining why oil is used and what measurement is used (no mention is made of size or area of the grease spot).
– cannot explain how to compare the fat in the two kinds of chips or how to determine the percentage of fat in the chips.
FULL OPTION SCIENCE SYSTEM MAGNETISM AND ELECTRICITY 9FOOD AND NUTRITION
WASHINGTON EDITION
Grade 6 Version
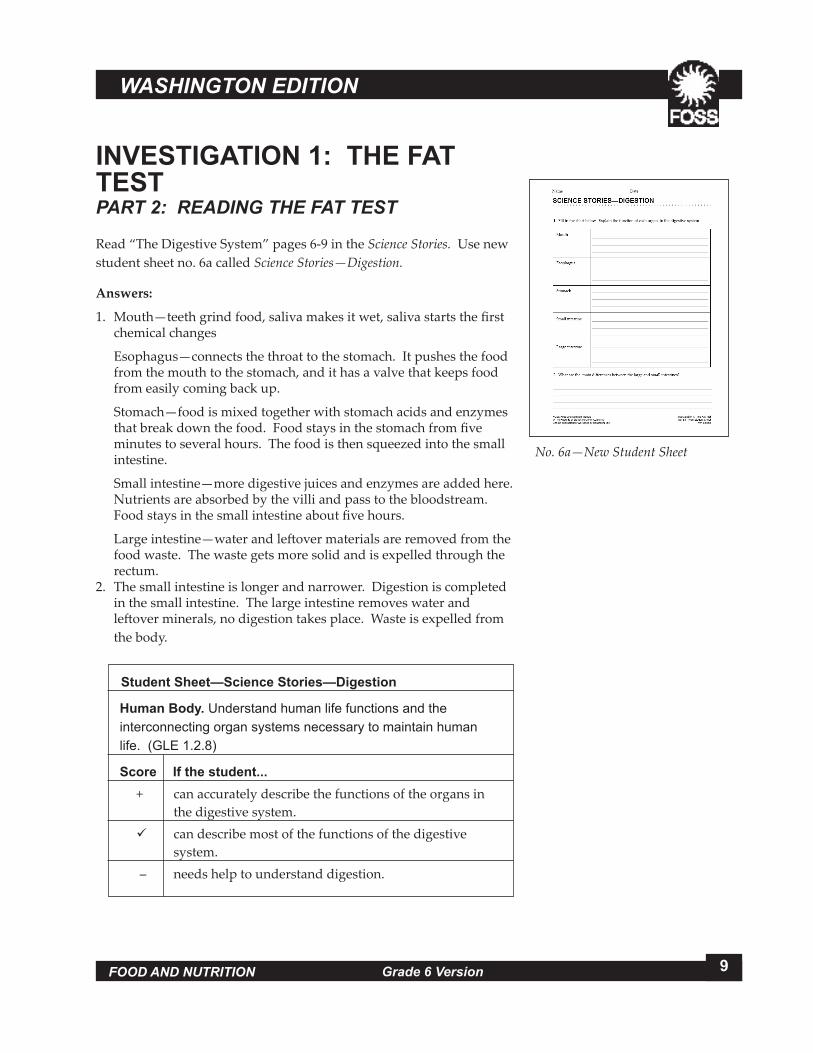
INVESTIGATION 1: THE FAT TESTPART 2: READING THE FAT TEST Read “The Digestive System” pages 6-9 in the Science Stories. Use new student sheet no. 6a called Science Stories—Digestion.
Answers:
1. Mouth—teeth grind food, saliva makes it wet, saliva starts the first chemical changes
Esophagus—connects the throat to the stomach. It pushes the food from the mouth to the stomach, and it has a valve that keeps food from easily coming back up.
Stomach—food is mixed together with stomach acids and enzymes that break down the food. Food stays in the stomach from five minutes to several hours. The food is then squeezed into the small intestine.
Small intestine—more digestive juices and enzymes are added here. Nutrients are absorbed by the villi and pass to the bloodstream. Food stays in the small intestine about five hours.
Large intestine—water and le�over materials are removed from the food waste. The waste gets more solid and is expelled through the rectum.
2. The small intestine is longer and narrower. Digestion is completed in the small intestine. The large intestine removes water and le�over minerals, no digestion takes place. Waste is expelled from the body.
Student Sheet—Science Stories—Digestion
Human Body. Understand human life functions and the interconnecting organ systems necessary to maintain human life. (GLE 1.2.8)
Score If the student... + can accurately describe the functions of the organs in
the digestive system. can describe most of the functions of the digestive
system. – needs help to understand digestion.
No. 6a—New Student Sheet

FULL OPTION SCIENCE SYSTEM
RESPONSE SHEET—INVESTIGATION 1Neha and Sam pack their lunches each day in the same brand of brown paper bags. Neha packs her lunch the night before and includes potato chips. Sam packs his lunch in the morning with corn chips.
One day they noticed they each had grease spots on their bags from the chips. The spot on Neha’s bag was about twice the size of Sam’s spot.
Sam said, “I think this shows that potato chips have more fat in them than corn chips.”
a. Do you think Sam’s conclusion was a reasonable one? Why or why not?
b. What would you do to compare the amount of fat in these two kinds of chips? Be sure to explain which variable(s) should be controlled, and how you will measure the results.
c. If you wanted to know the percentages of fat in the potato and corn chips (and didn’t have the packages to read the percentages), what would you do?
FOSS Food and Nutrition Module© The Regents of the University of CaliforniaCan be duplicated for workshop or classroom use.
Name ________________________________ Date ___________________________________
Investigation 1: The Fat TestNo. 6—Modified Student Sheet
WA Edition

FULL OPTION SCIENCE SYSTEM
1. Fill in the chart below. Explain the function of each organ in the digestive system.
Mouth
Esophagus
Stomach
Small intestine
Large intestine
2. What are the main differences between the large and small intestines?
FOSS Food and Nutrition Module© The Regents of the University of CaliforniaCan be duplicated for workshop or classroom use.
Investigation 1: The Fat TestNo. 6a—New Student Sheet
WA Edition
SCIENCE STORIES—DIGESTIONName ________________________________ Date ___________________________________

12 FULL OPTION SCIENCE SYSTEM
INQUIRY INVESTIGATION SUMMARY
PART 1
Grade 6 Version
PART 2
YEAST AS AN INDICATOR
• How can we test foods to determine how much sugar they contain?
Time: 40–60 minutes
TESTING CEREALS
• Which breakfast cereals contain the most sugar?
Time: 40–60 minutes
TESTING OTHER FOODS
• Which foods contain sugar and how can we determine the relative amount?
Time: 40–60 minutes
Students are introduced to dry yeast as an indicator for sugar in food. The gas produced when yeast metabolizes is used to indicate sugar. Students measure the volume of carbon dioxide produced.
Students test cereals for sugar. They compile their results to rank breakfast cereals by sugar content.
Students use the sugar test to test a wide variety of foods for sugar.
PART 3
INVESTIGATION 2: THE SUGAR TEST

13FOOD AND NUTRITION
WASHINGTON EDITION—AT A GLANCECONCEPTS AND PRINCIPLES ASSESSMENT OPPORTUNITIES
Grade 6 Version
New Student Sheet
Metabolism
Life Processes and the Flow of Ma�er and Energy. Understand how individual organisms, including cells, obtain ma�er and energy for life processes. (GLE 1.3.8)
• Sugar is a simple carbohydrate, which is a nutrient found in foods.
• Yeast can be used to indicate sugar in foods.
• Yeast needs sugar to become active.
• A product of yeast metabolism is carbon dioxide, the same gas produced by most organisms.
• Some foods contain more sugar than others do.
• The more carbon dioxide produced by yeast in a food sample, the more sugar in the sample.
• Apply content introduced in previous parts.
Modified Student Sheet
Response Sheet—Investigation 2
Life Processes and the Flow of Ma�er and Energy. Understand how individual organisms, including cells, obtain ma�er and energy for life processes. (GLE 1.3.8)
Explaining. Apply understanding of how to construct a scientific explanation using evidence and inferential logic. (GLE 2.1.3)
Examples of questions students might generate for inquiry projects.
• Do different kinds of baked goods contain different amounts of sugar?
• Do meats contain sugar?
2
Teacher Observation and Student Sheet
Sugar Test
Planning and Conducting Safe Investigations. Understand how to plan and conduct scientific investigations. (GLE 2.1.2)
Explaining. Apply understanding of how to construct a scientific explanation using evidence and inferential logic. (GLE 2.1.3)

FULL OPTION SCIENCE SYSTEMFULL OPTION SCIENCE SYSTEM14 Grade 6 Version FULL OPTION SCIENCE SYSTEM
FORMATIVE ASSESSMENT
No. 6b—New Student Sheet
INVESTIGATION 2: THE SUGAR TESTPART 1: YEAST AS AN INDICATOR Use new student sheet no. 6b called Metabolism along with students’ notes recorded in their science notebooks of their investigation to help them reflect and recall what actually happened.
Answers: 1. Sugar. The experiment showed that a�er 10 minutes the bag that contained sugar showed substantial amount of gas produced while the one that contained flour had no or li�le gas. 2. Carbon dioxide. 3. Our body cells, just like yeast cells, metabolize glucose to release energy and produce carbon dioxide as a waste product.
Student Sheet—Metabolism
Life Processes and the Flow of Matter and Energy. Understand how individual organisms, including cells, obtain matter and energy for life processes. (GLE 1.3.8)
Score If the student... + understands that sugar is metabolized to release
energy and carbon dioxide is produced as a waste product; and states that our body cells, like yeast, carry out the metabolism of glucose to give the body energy for life processes.
understands that sugar is metabolized but unable to give evidence from the experiment; states that our body is like yeast, because it breaks down food to yield energy and carbon dioxide.
– does not know that sugar is the substance that is metabolized and is unable to explain how the body cells metabolize food to extract energy.
FULL OPTION SCIENCE SYSTEMFULL OPTION SCIENCE SYSTEM
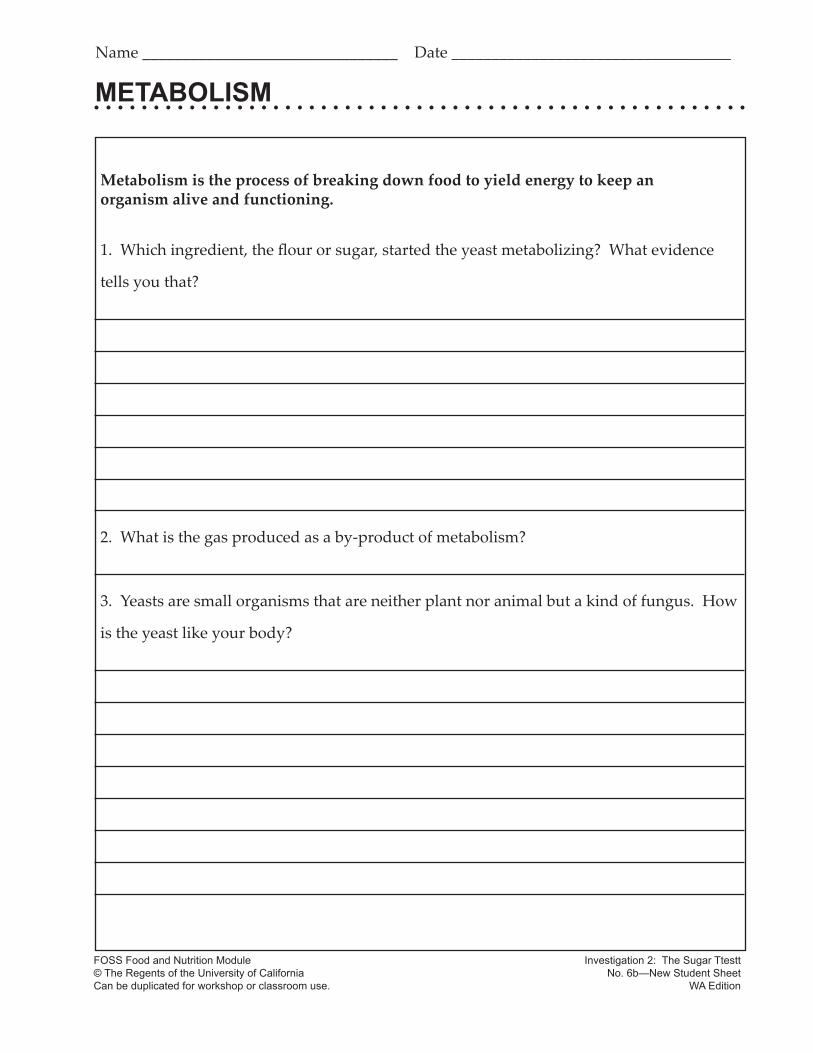
METABOLISM
Metabolism is the process of breaking down food to yield energy to keep an organism alive and functioning.
1. Which ingredient, the flour or sugar, started the yeast metabolizing? What evidence
tells you that?
2. What is the gas produced as a by-product of metabolism?
3. Yeasts are small organisms that are neither plant nor animal but a kind of fungus. How
is the yeast like your body?
Name ________________________________ Date ___________________________________
FOSS Food and Nutrition Module© The Regents of the University of CaliforniaCan be duplicated for workshop or classroom use.
Investigation 2: The Sugar TtesttNo. 6b—New Student Sheet
WA Edition
FULL OPTION SCIENCE SYSTEMFULL OPTION SCIENCE SYSTEM16 Grade 6 Version FULL OPTION SCIENCE SYSTEM
No. 8—Modified Student Shee No. 8a—New Student Sheet No. 9—Modified Student Sheet
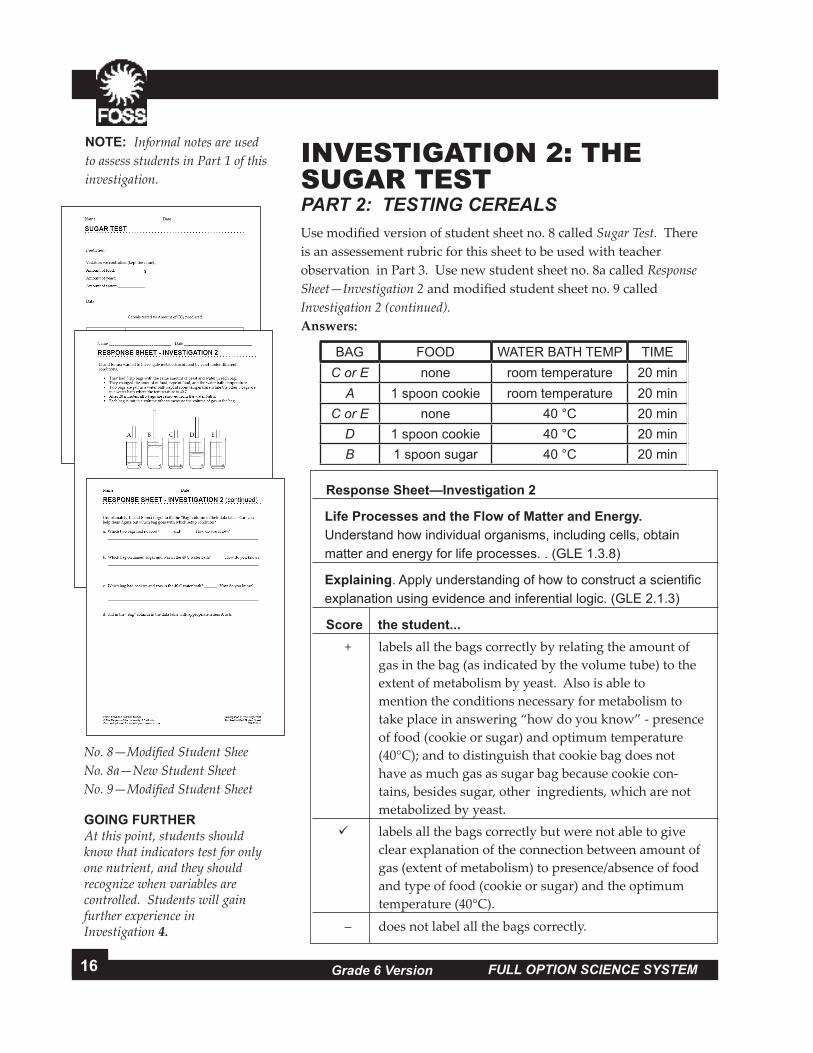
NOTE: Informal notes are used to assess students in Part 1 of this investigation.
INVESTIGATION 2: THE SUGAR TESTPART 2: TESTING CEREALSUse modified version of student sheet no. 8 called Sugar Test. There is an assessement rubric for this sheet to be used with teacher observation in Part 3. Use new student sheet no. 8a called Response Sheet—Investigation 2 and modified student sheet no. 9 called Investigation 2 (continued).Answers:
Response Sheet—Investigation 2
Life Processes and the Flow of Matter and Energy. Understand how individual organisms, including cells, obtain matter and energy for life processes. . (GLE 1.3.8)
Explaining. Apply understanding of how to construct a scientific explanation using evidence and inferential logic. (GLE 2.1.3)
Score the student... + labels all the bags correctly by relating the amount of
gas in the bag (as indicated by the volume tube) to the extent of metabolism by yeast. Also is able to mention the conditions necessary for metabolism to take place in answering “how do you know” - presence of food (cookie or sugar) and optimum temperature (40°C); and to distinguish that cookie bag does not have as much gas as sugar bag because cookie con-tains, besides sugar, other ingredients, which are not metabolized by yeast.
labels all the bags correctly but were not able to give clear explanation of the connection between amount of gas (extent of metabolism) to presence/absence of food and type of food (cookie or sugar) and the optimum temperature (40°C).
– does not label all the bags correctly.
GOING FURTHERAt this point, students should know that indicators test for only one nutrient, and they should recognize when variables are controlled. Students will gain further experience in Investigation 4.
BAG FOOD WATER BATH TEMP TIMEC or E none room temperature 20 min
A 1 spoon cookie room temperature 20 minC or E none 40 °C 20 min
D 1 spoon cookie 40 °C 20 minB 1 spoon sugar 40 °C 20 min
FULL OPTION SCIENCE SYSTEMFULL OPTION SCIENCE SYSTEM
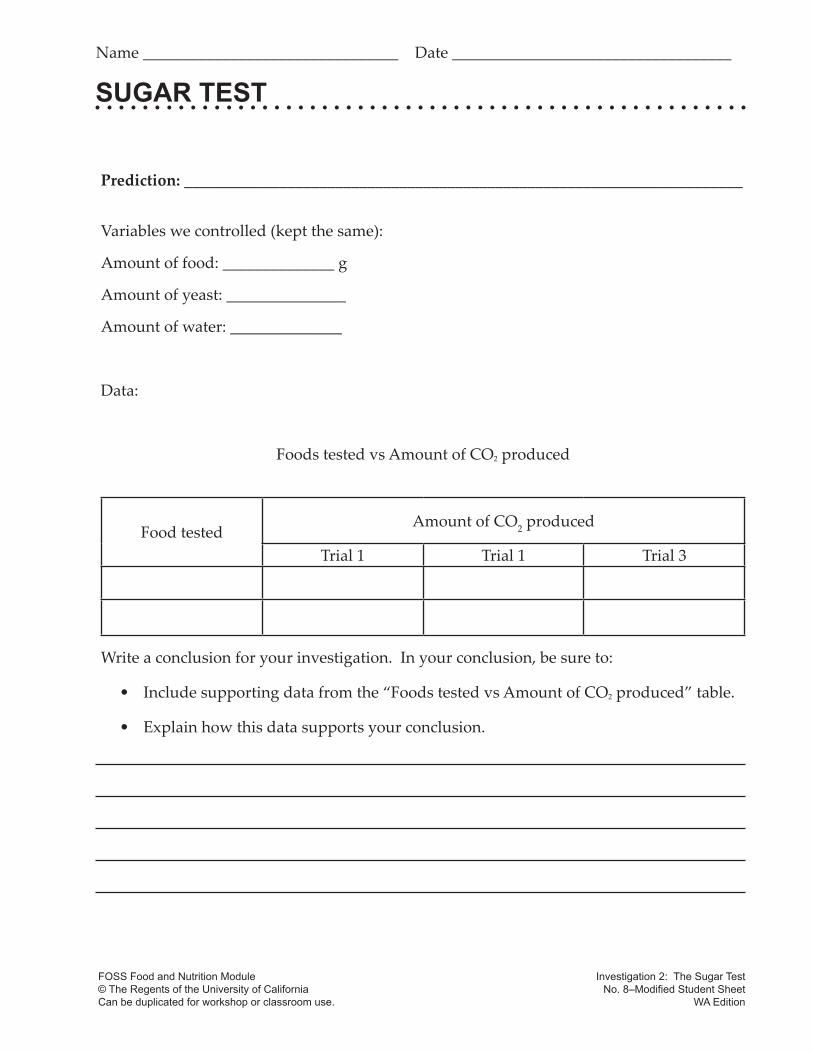
SUGAR TEST
Prediction: ______________________________________________________________________
Variables we controlled (kept the same):
Amount of food: ______________ g
Amount of yeast: _______________
Amount of water: ______________
Data:
Foods tested vs Amount of CO2 produced
Food testedAmount of CO2
produced
Trial 1 Trial 1 Trial 3
Write a conclusion for your investigation. In your conclusion, be sure to:
• Include supporting data from the “Foods tested vs Amount of CO2 produced” table.
• Explain how this data supports your conclusion.
Name ________________________________ Date ___________________________________
FOSS Food and Nutrition Module© The Regents of the University of CaliforniaCan be duplicated for workshop or classroom use.
Investigation 2: The Sugar Test No. 8–Modified Student Sheet
WA Edition
FULL OPTION SCIENCE SYSTEM
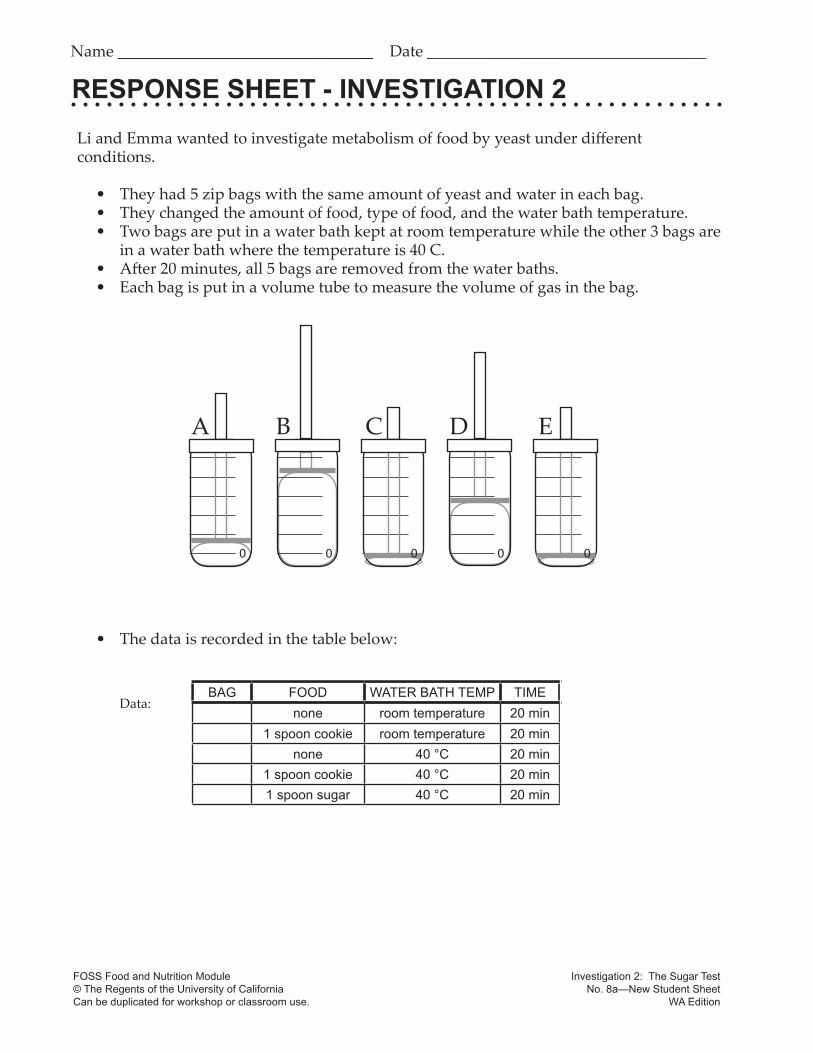
RESPONSE SHEET - INVESTIGATION 2Li and Emma wanted to investigate metabolism of food by yeast under different conditions.
• They had 5 zip bags with the same amount of yeast and water in each bag.• They changed the amount of food, type of food, and the water bath temperature.• Two bags are put in a water bath kept at room temperature while the other 3 bags are
in a water bath where the temperature is 40 C.• A�er 20 minutes, all 5 bags are removed from the water baths.• Each bag is put in a volume tube to measure the volume of gas in the bag.
• The data is recorded in the table below:
Data:
A B C D E
0 0000
FOSS Food and Nutrition Module© The Regents of the University of CaliforniaCan be duplicated for workshop or classroom use.
Investigation 2: The Sugar TestNo. 8a—New Student Sheet
WA Edition
Name ________________________________ Date ___________________________________
BAG FOOD WATER BATH TEMP TIMEnone room temperature 20 min
1 spoon cookie room temperature 20 minnone 40 °C 20 min
1 spoon cookie 40 °C 20 min1 spoon sugar 40 °C 20 min
FULL OPTION SCIENCE SYSTEM
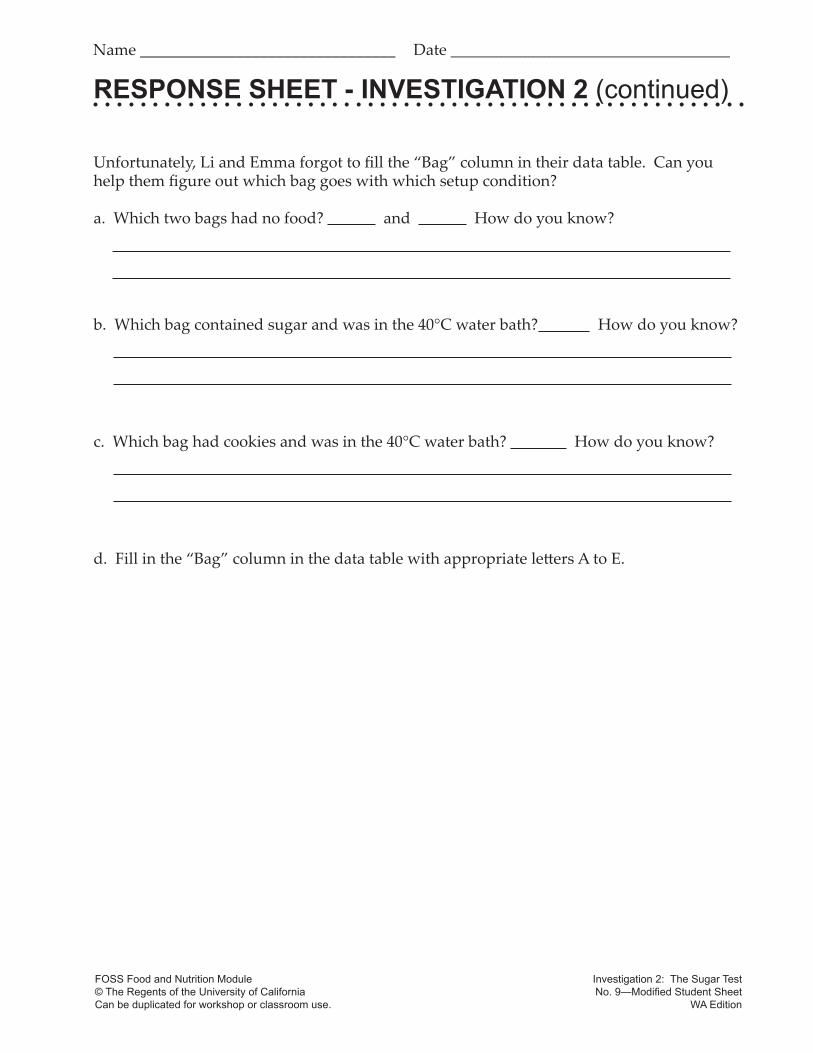
RESPONSE SHEET - INVESTIGATION 2 (continued)
Unfortunately, Li and Emma forgot to fill the “Bag” column in their data table. Can you help them figure out which bag goes with which setup condition?
a. Which two bags had no food? and How do you know?
b. Which bag contained sugar and was in the 40°C water bath? How do you know?
c. Which bag had cookies and was in the 40°C water bath? How do you know?
d. Fill in the “Bag” column in the data table with appropriate le�ers A to E.
FOSS Food and Nutrition Module© The Regents of the University of CaliforniaCan be duplicated for workshop or classroom use.
Investigation 2: The Sugar TestNo. 9—Modified Student Sheet
WA Edition
Name ________________________________ Date ___________________________________
FULL OPTION SCIENCE SYSTEMFULL OPTION SCIENCE SYSTEM20 Grade 6 Version FULL OPTION SCIENCE SYSTEM
FORMATIVE ASSESSMENT
No. 8—Modified Student Sheet
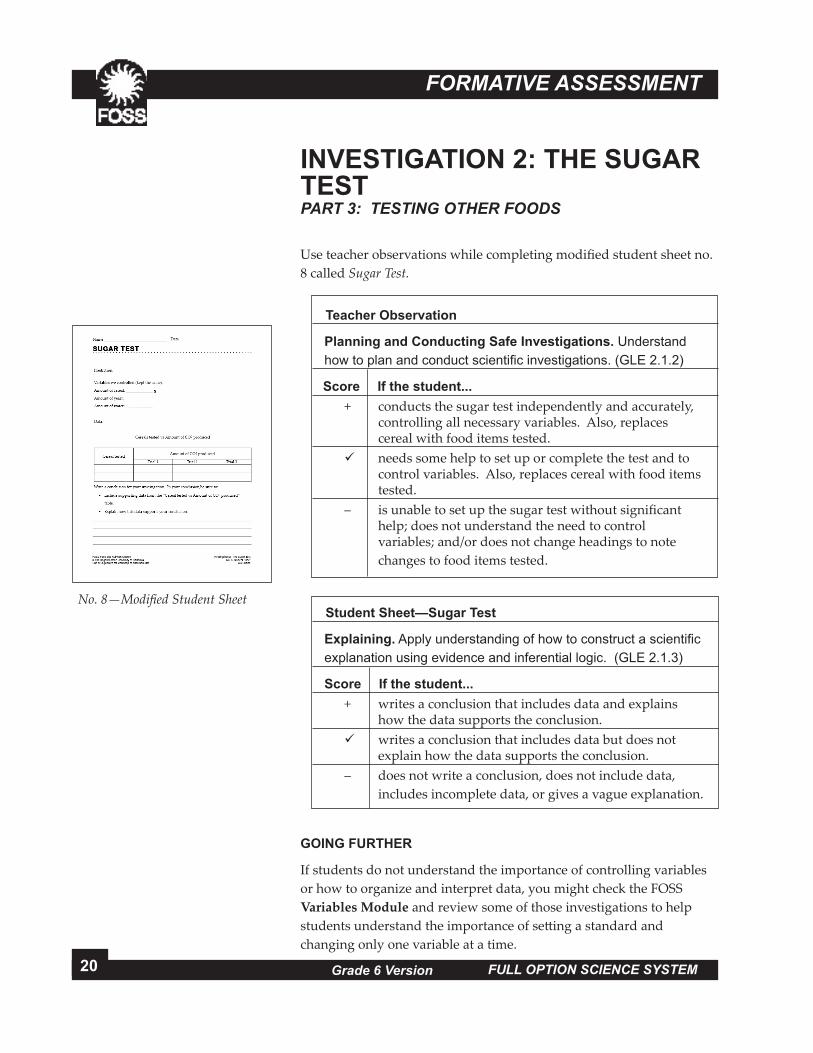
INVESTIGATION 2: THE SUGAR TESTPART 3: TESTING OTHER FOODS Use teacher observations while completing modified student sheet no. 8 called Sugar Test.
Teacher Observation
Planning and Conducting Safe Investigations. Understand how to plan and conduct scientific investigations. (GLE 2.1.2)
Score If the student... + conducts the sugar test independently and accurately,
controlling all necessary variables. Also, replaces cereal with food items tested.
needs some help to set up or complete the test and to control variables. Also, replaces cereal with food items tested.
– is unable to set up the sugar test without significant help; does not understand the need to control variables; and/or does not change headings to note changes to food items tested.
Student Sheet—Sugar Test
Explaining. Apply understanding of how to construct a scientific explanation using evidence and inferential logic. (GLE 2.1.3)
Score If the student... + writes a conclusion that includes data and explains
how the data supports the conclusion. writes a conclusion that includes data but does not
explain how the data supports the conclusion. – does not write a conclusion, does not include data,
includes incomplete data, or gives a vague explanation.
GOING FURTHER
If students do not understand the importance of controlling variables or how to organize and interpret data, you might check the FOSS Variables Module and review some of those investigations to help students understand the importance of se�ing a standard and changing only one variable at a time.
FULL OPTION SCIENCE SYSTEMFULL OPTION SCIENCE SYSTEM
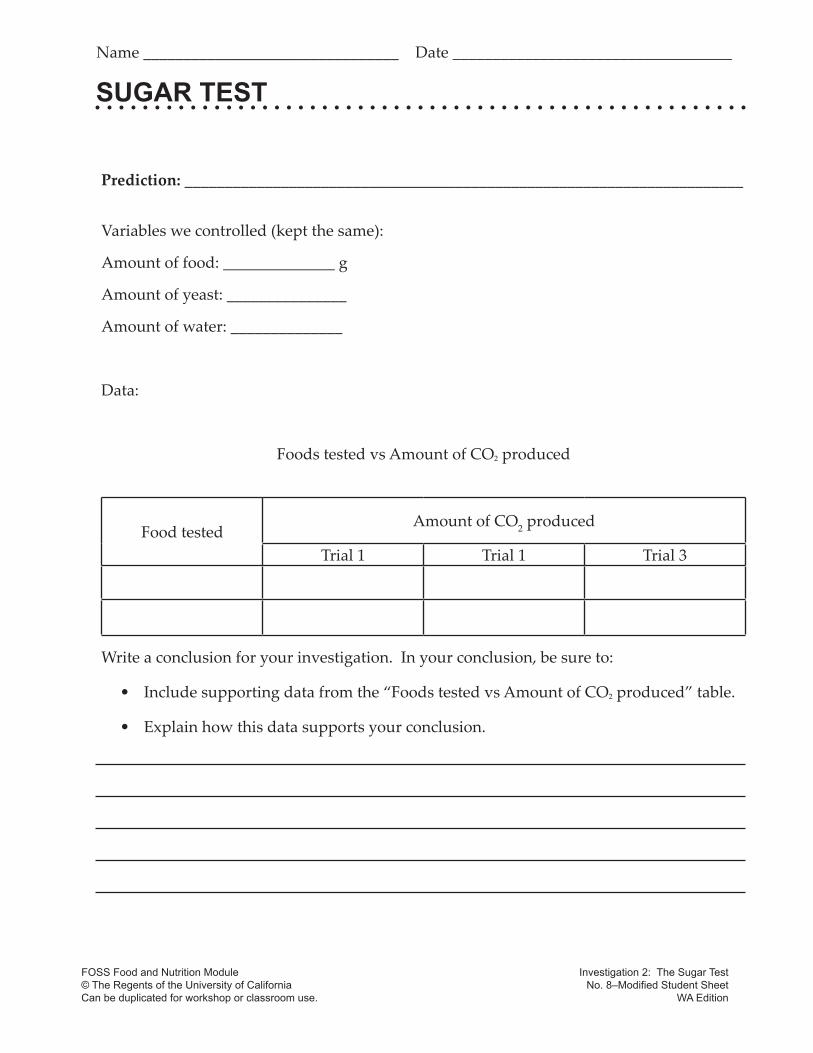
SUGAR TEST
Prediction: ______________________________________________________________________
Variables we controlled (kept the same):
Amount of food: ______________ g
Amount of yeast: _______________
Amount of water: ______________
Data:
Foods tested vs Amount of CO2 produced
Food testedAmount of CO2
produced
Trial 1 Trial 1 Trial 3
Write a conclusion for your investigation. In your conclusion, be sure to:
• Include supporting data from the “Foods tested vs Amount of CO2 produced” table.
• Explain how this data supports your conclusion.
Name ________________________________ Date ___________________________________
FOSS Food and Nutrition Module© The Regents of the University of CaliforniaCan be duplicated for workshop or classroom use.
Investigation 2: The Sugar Test No. 8–Modified Student Sheet
WA Edition
22 FULL OPTION SCIENCE SYSTEM
INQUIRY INVESTIGATION SUMMARY
PART 1
Grade 6 Version
PART 2
PART 3
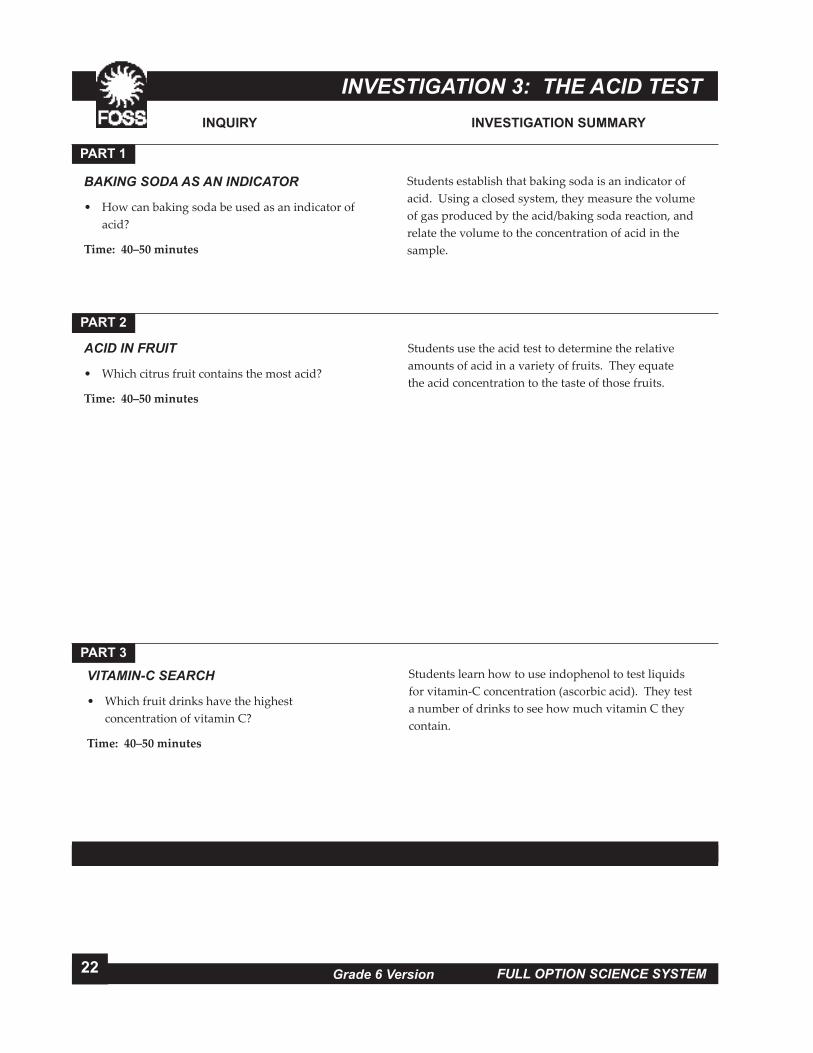
BAKING SODA AS AN INDICATOR
• How can baking soda be used as an indicator of acid?
Time: 40–50 minutes
ACID IN FRUIT
• Which citrus fruit contains the most acid?
Time: 40–50 minutes
Students establish that baking soda is an indicator of acid. Using a closed system, they measure the volume of gas produced by the acid/baking soda reaction, and relate the volume to the concentration of acid in the sample.
Students learn how to use indophenol to test liquids for vitamin-C concentration (ascorbic acid). They test a number of drinks to see how much vitamin C they contain.
VITAMIN-C SEARCH
• Which fruit drinks have the highest concentration of vitamin C?
Time: 40–50 minutes
Students use the acid test to determine the relative amounts of acid in a variety of fruits. They equate the acid concentration to the taste of those fruits.
INVESTIGATION 3: THE ACID TEST

23FOOD AND NUTRITION
WASHINGTON EDITION—AT A GLANCECONCEPTS AND PRINCIPLES ASSESSMENT OPPORTUNITIES
Grade 6 Version
New Student Sheet
Chemical Reaction
Conservation of Ma�er and Energy. Understand that ma�er is conserved during physical and chemical changes. (GLE 1.3.3)
Examples of questions students might generate for inquiry projects.
• Does starfruit have as much acid as orange juice?
• Is there acid in meat?
• Baking soda and acid react chemically to form new products, one of which is carbon dioxide.
• Baking soda can be used to indicate acid.
• If baking soda is present in excess, the volume of carbon dioxide produced when soda reacts with an acid is proportional to the concentration of the acid.
• Indophenol can be used to indicate vitamin C (ascorbic acid).
• Vitamins are nutrients that help the body function properly.
• Baking soda can be used to measure the relative concentration of acid in citrus fruits.
• The sour taste of foods is caused by acid.
Teacher Observation and New Student Sheet
Acid Test and Acid Test Conclusion
Planning and Conducting Safe Investigations. Understand how to plan and conduct scientific investigations. (GLE 2.1.2)
Explaining. Apply understanding of how to construct a scientific explanation using evidence and inferential logic. (GLE 2.1.3)
Modified Student Sheet
Response Sheet—Investigation 3
Evaluating Methods of Investigation. Understand how to make the results of scientific investigations reliable and how to make the method of investigation valid. (GLE 2.2.4)
Modified Student Sheet
Vitamin⁻C Score Sheet
Planning and Conducting Safe Investigations. Understand how to plan and conduct scientific investigations. (GLE 2.1.2 )

FULL OPTION SCIENCE SYSTEMFULL OPTION SCIENCE SYSTEM24 Grade 6 Version
FORMATIVE ASSESSMENT
No. 10a —New Student Sheet
INVESTIGATION 3: THE ACID TESTPART 1: BAKING SODA AS AN INDICATOR Use new student sheet no. 10a called Chemical Reaction or use as a journal prompt.
Student Sheet—Chemical Reaction
Conservation of Matter and Energy. Understand that matter is conserved during physical and chemical changes. (GLE 1.3.3)
Score If the student...
states that when (1) baking soda is mixed with an acid (e.g., vinegar) a chemical reaction takes place, (2) states fizzing as evidence of chemical reaction, and (3) mentions a gas/carbon dioxide as the new substance produced.
– is able to identify baking soda and acid as the two substances but unable to give evidence of a chemical reaction and/or identify the new substances.

FULL OPTION SCIENCE SYSTEM
CHEMICAL REACTION
1. Which two substances did you mix to form a chemical reaction?
2. What evidence do you have that a chemical reaction took place?
3. What new substance was produced by this chemical reaction?
Name ________________________________ Date ___________________________________
FOSS Food and Nutrition Module© The Regents of the University of CaliforniaCan be duplicated for workshop or classroom use.
Investigation 3: The Acid Test No. 10a–New Student Sheet
WA Edition
FULL OPTION SCIENCE SYSTEMFULL OPTION SCIENCE SYSTEM26 Grade 6 Version FULL OPTION SCIENCE SYSTEM
FORMATIVE ASSESSMENT
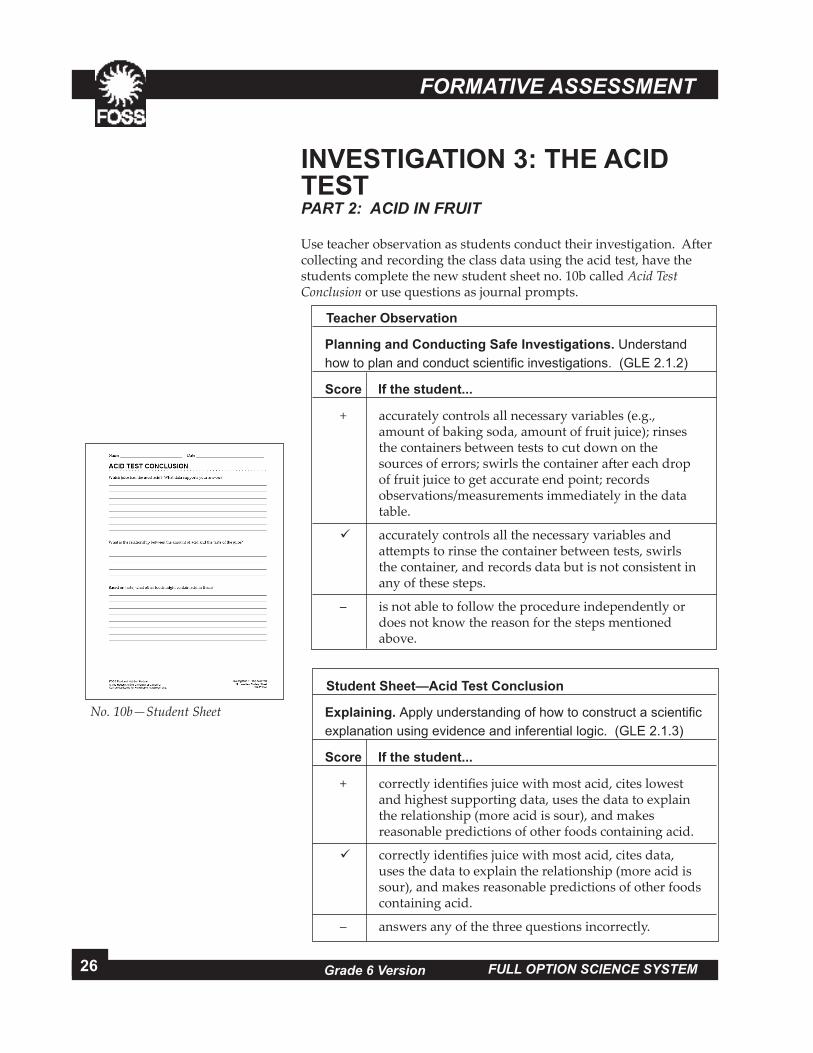
INVESTIGATION 3: THE ACID TESTPART 2: ACID IN FRUIT Use teacher observation as students conduct their investigation. A�er collecting and recording the class data using the acid test, have the students complete the new student sheet no. 10b called Acid Test Conclusion or use questions as journal prompts.
Teacher Observation
Planning and Conducting Safe Investigations. Understand how to plan and conduct scientific investigations. (GLE 2.1.2)
Score If the student...
+ accurately controls all necessary variables (e.g., amount of baking soda, amount of fruit juice); rinses the containers between tests to cut down on the sources of errors; swirls the container a�er each drop of fruit juice to get accurate end point; records observations/measurements immediately in the data table.
accurately controls all the necessary variables and a�empts to rinse the container between tests, swirls the container, and records data but is not consistent in any of these steps.
– is not able to follow the procedure independently or does not know the reason for the steps mentioned above.
Student Sheet—Acid Test Conclusion
Explaining. Apply understanding of how to construct a scientific explanation using evidence and inferential logic. (GLE 2.1.3)
Score If the student...
+ correctly identifies juice with most acid, cites lowest and highest supporting data, uses the data to explain the relationship (more acid is sour), and makes reasonable predictions of other foods containing acid.
correctly identifies juice with most acid, cites data, uses the data to explain the relationship (more acid is sour), and makes reasonable predictions of other foods containing acid.
– answers any of the three questions incorrectly.
No. 10b—Student Sheet

FULL OPTION SCIENCE SYSTEM MAGNETISM AND ELECTRICITYFULL OPTION SCIENCE SYSTEM 27FOOD AND NUTRITION
WASHINGTON EDITION
Grade 6 Version
No. 11—Modified Student Sheet
Use modified student sheet no. 11 called Response Sheet— Investigation 3.
Response Sheet—Investigation 3
Evaluating Methods of Investigation. Understand how to make the results of scientific investigations reliable and how to make the method of investigation valid. (GLE 2.2.4)
Score If the student...
+ evaluates design, identifies and describes a) the variable that was controlled (equal amounts of baking soda in each bo�le) and b) the variable that needed to be controlled (equal amounts of fruit juice).
evaluates design and either identifies the variable that was controlled or the variable that needed to be controlled.
– is unable to identify either the variable that was controlled or the variable that needed to be controlled.

ACID TEST CONCLUSION
Name ________________________________ Date ___________________________________
Which juice had the most acid? What data supports your answer?
What is the relationship between the amount of acid and the taste of the juice?
Based on taste, what other foods might contain acid in them?
FOSS Food and Nutrition Module© The Regents of the University of CaliforniaCan be duplicated for workshop or classroom use.
Investigation 3: The Acid Test No. 10b–New Student Sheet
WA Edition
BAV C
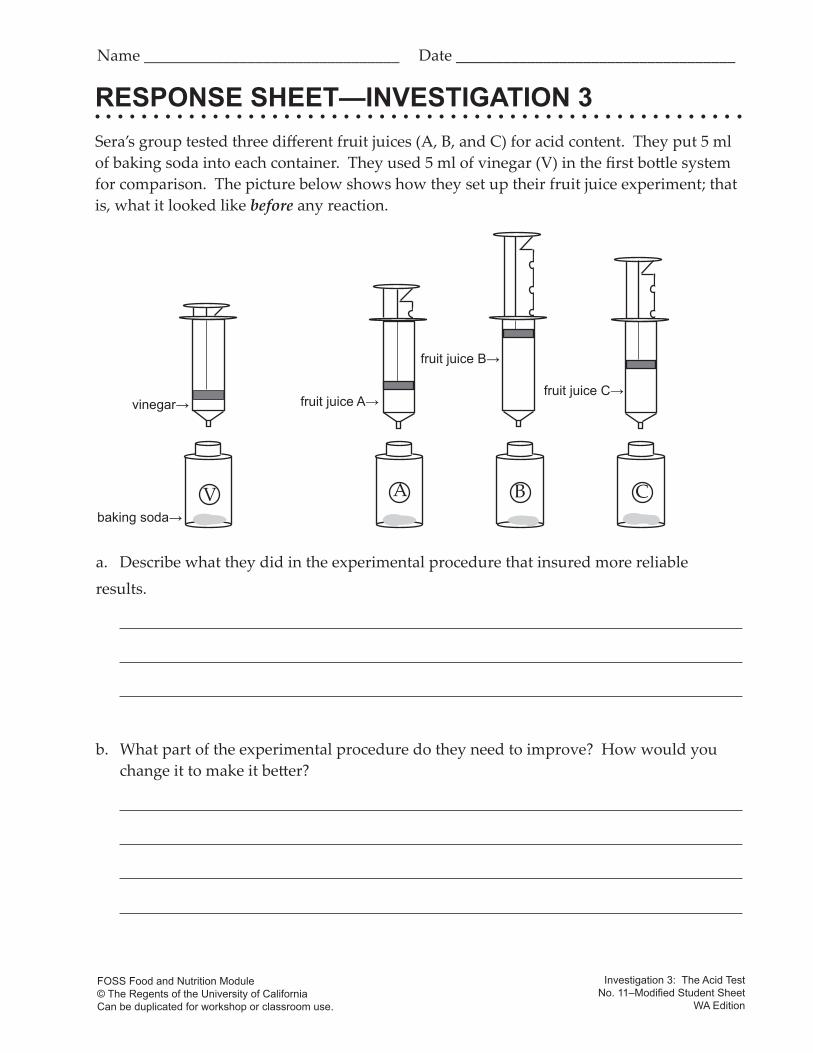
RESPONSE SHEET—INVESTIGATION 3Sera’s group tested three different fruit juices (A, B, and C) for acid content. They put 5 ml of baking soda into each container. They used 5 ml of vinegar (V) in the first bo�le system for comparison. The picture below shows how they set up their fruit juice experiment; that is, what it looked like before any reaction.
a. Describe what they did in the experimental procedure that insured more reliable results.
b. What part of the experimental procedure do they need to improve? How would you change it to make it be�er?
Name ________________________________ Date ___________________________________
FOSS Food and Nutrition Module© The Regents of the University of CaliforniaCan be duplicated for workshop or classroom use.
Investigation 3: The Acid Test No. 11–Modified Student Sheet
WA Edition
vinegar→ fruit juice A→
baking soda→
fruit juice B→
fruit juice C→

FULL OPTION SCIENCE SYSTEMFULL OPTION SCIENCE SYSTEM30 Grade 6 Version
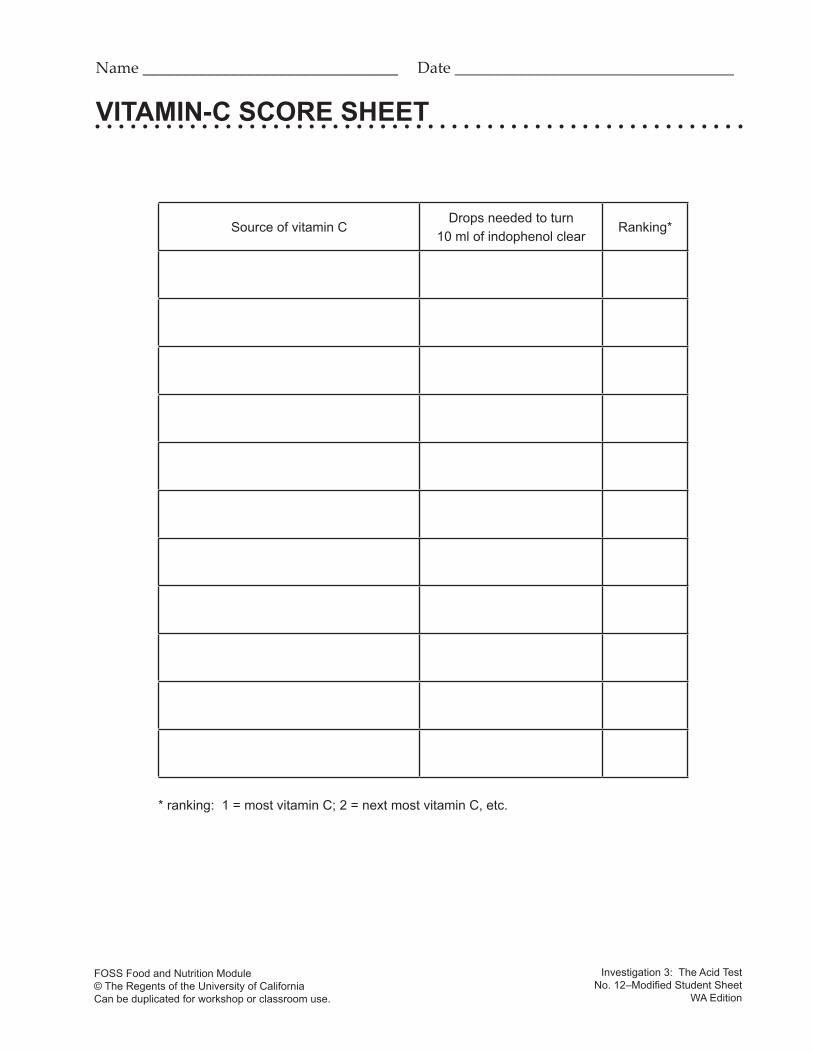
INVESTIGATION 3: THE ACID TESTPART 3: VITAMIN-C SEARCH Use teacher observation along with modifed student sheet no. 12 called Vitamin⁻C Score Sheet.
Teacher Observation and Modified Student Sheet— Vitamin-C Score Sheet
Planning and Conducting Safe Investigations. Understand how to plan and conduct scientific investigations. (GLE 2.1.2)
Score If the student...
+ accurately controls all necessary variables (e.g., amount of baking soda, amount of fruit juice); rinses the containers between tests to cut down on the sources of errors; swirls the container a�er each drop of fruit juice to get accurate end point; records observations/measurements immediately in the data table.
accurately controls all the necessary variables and a�empts to rinse the container between tests, swirls the container, and records data but is not consistent in any of these steps.
– is not able to follow the procedure independently or does not know the reason for the steps mentioned above.
FORMATIVE ASSESSMENT
No. 12—Modified Student Sheet
FULL OPTION SCIENCE SYSTEM
VITAMIN-C SCORE SHEET
Source of vitamin CDrops needed to turn
10 ml of indophenol clearRanking*
* ranking: 1 = most vitamin C; 2 = next most vitamin C, etc.
Name ________________________________ Date ___________________________________
FOSS Food and Nutrition Module© The Regents of the University of CaliforniaCan be duplicated for workshop or classroom use.
Investigation 3: The Acid Test No. 12–Modified Student Sheet
WA Edition

32 FULL OPTION SCIENCE SYSTEM
INQUIRY INVESTIGATION SUMMARY
PART 1
Grade 6 Version
PART 2
FREE LUNCH
• What are the components of a nutritional lunch?
Time: two 45-minute sessions
CHOOSING YOUR OWN INVESTIGATION
• Students ask their own questions and plan investigations or research to answer them.
Time: 4–6 sessions
Students learn that foods o�en combine different kinds of nutrients. They guess the identity of lunch items from lists of ingredients. They assemble hypothetical lunches, analyze them, and assess the nutritional value and total number of calories.
Students select a topic from their study of food and nutrition to investigate in greater depth. They share the results of their project with the class in a formal presentation.
INVESTIGATION 4: FREE LUNCH
33FOOD AND NUTRITION
WASHINGTON EDITION—AT A GLANCECONCEPTS AND PRINCIPLES ASSESSMENT OPPORTUNITIES
Grade 6 Version
Modified Student Sheet and New Student Sheet
Response Sheet—Investigation 4
Nutrient Chart
Explaining. Apply understanding of how to construct a scientific explanation using evidence and inferential logic. (GLE 2.1.3)
New Student Sheet
Science Stories—Disease Prevention and Control
Human Body. Understand human life functions and the interconnecting organ systems necessary to maintain human life. (GLE 1.2.8)
Performance Assessment
Inquiry or Design Project
Inquiry GLEs: 2.1.1—2.1.5
or Design GLEs: 3.1.1—3.1.3
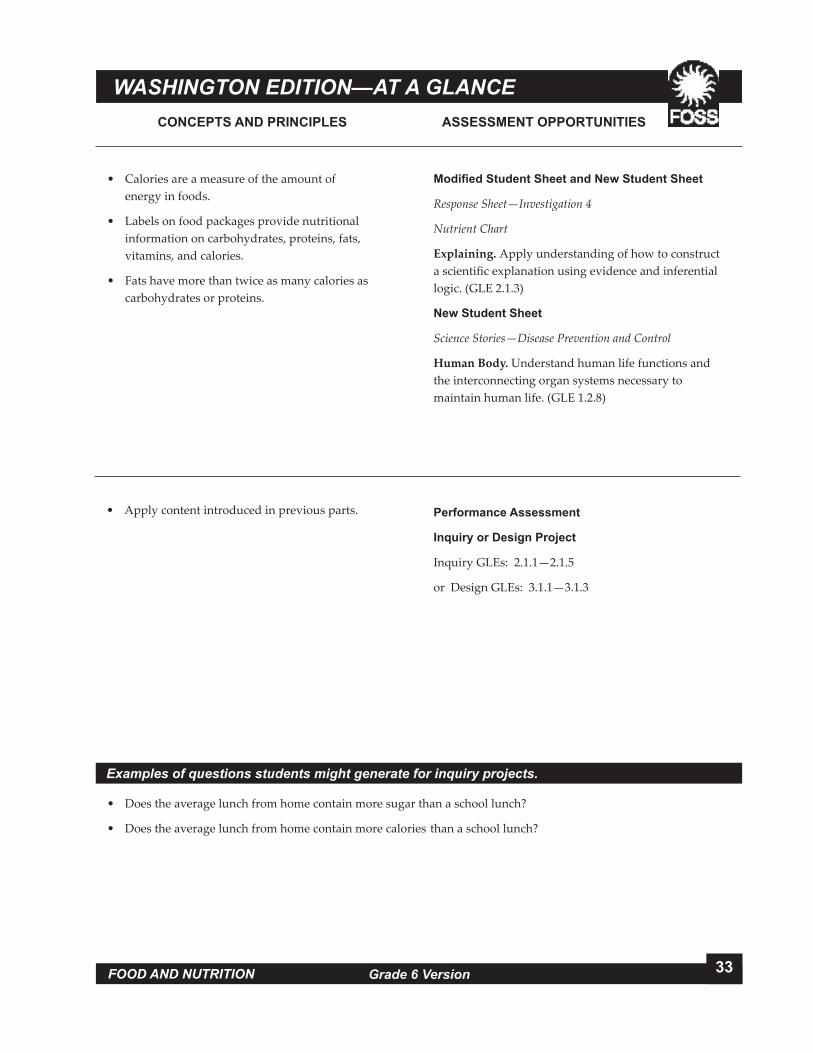
• Calories are a measure of the amount of energy in foods.
• Labels on food packages provide nutritional information on carbohydrates, proteins, fats, vitamins, and calories.
• Fats have more than twice as many calories as carbohydrates or proteins.
• Apply content introduced in previous parts.
Examples of questions students might generate for inquiry projects.
• Does the average lunch from home contain more sugar than a school lunch?
• Does the average lunch from home contain more calories than a school lunch?

FULL OPTION SCIENCE SYSTEMFULL OPTION SCIENCE SYSTEM34 Grade 6 Version
No. 18—Modified Student Sheet
FORMATIVE ASSESSMENT
INVESTIGATION 4: FREE LUNCHPART 1: FREE LUNCH
Use modified student sheet no. 18 called Response Sheet—Investigation 4 and new student sheet no. 18a called Nutrient Chart as an optional in place of student sheets nos. 16 and 17.
Response Sheet—Investigation 4
Explaining. Apply understanding of how to construct a scientific explanation using evidence and inferential logic. (GLE 2.1.3)
Score If the student... + forms a reasonable conclusion and cites data (from
science stories or experiment) and explains how data supports conclusion.
forms a reasonable conclusion and refers to data or information learned.
– does not form a reasonable conclusion and/or does not refer to data in support of conclusion.
GOING FURTHER
It is important for students to know that fat is not a bad thing. All our bodies need some fat. The problem in many diets is that there is too much fat compared to the other foods.
Lunch itemGrams of protein
Grams of carbohydrate
Grams of fat
hot dog and bun 8 20 16potato chips 4 30 20
cola 0 36 0Total grams of each nutrient 12 86 36
Calories per gram 4 4 9
Total calories for each nutrient 48 344 324
Total calories for lunch: 716 calories
No. 18a—New Student Sheet

FULL OPTION SCIENCE SYSTEM MAGNETISM AND ELECTRICITY 35FOOD AND NUTRITION
WASHINGTON EDITION
Grade 6 Version
Review pages 16–19, 21, 24–25. 34–36 in Science Stories a�er completing Part 1. Use new student sheet no. 18b called Science Stories—Disease Prevention and Control.
Student Sheet—Disease Prevention and Control
Human Body. Understand human life functions and the interconnecting organ systems necessary to maintain human life. (GLE 1.2.8)
Score If the student...
+ matches all correctly (diabetes-insulin, rickets- vitamin D, scurvy-vitamin C); lists each of the following actions and explains their importance: exercise, watch types of foods, eat regularly, monitor blood sugar, and take insulin if necessary.
(1) matches all correctly; (2) is able to list each of the actions described above, but doesn’t explain why each is important.
– (1) does not match the diseases to the correct chemical or nutrient; (2) is unable to tell what needs to happen if you developed diabetes.
No. 18b—New Student Sheet

FULL OPTION SCIENCE SYSTEM
RESPONSE SHEET—INVESTIGATION 4Molly usually eats a hot dog in a bun, potato chips, and a cola for lunch.
a. Calculate the number of calories in Molly’s lunch.
Lunch itemGrams of
protein (4 cal/g)Grams of
carbohydrate (4 cal/g)Grams of
fat (9 cal/g)hot dog and bun 8 20 16
potato chips 4 30 20cola 0 36 0
Total grams of each nutrient 12 86 36
Calories per gram
Total calories for each nutrient
Total calories for lunch:
Lunch itemGrams of
protein (4 cal/g)Grams of
carbohydrate (4 cal/g)Grams of
fat (9 cal/g)
Total grams of each nutrient
Calories per gram
Total calories for each nutrient
Total calories for lunch:
Use the nutrient chart (separate sheet) to answer the following questions.
b. If Molly wants to reduce the number of calories from carbohydrates in her lunch without reducing the amount from protein, she could eat ________________ in place of the ________________ she now eats.
c. If Molly wants to reduce the number of calories from fats in her lunch without reducing the amount from protein, she could eat ________________ in place of the ________________ she now eats.
d. Choose three or four foods from the nutrient chart to make a different lunch for Molly that you think provides a good balance of nutrients and complete the chart below.
e. On another sheet of paper, explain why you think this lunch provides a good balance.
FOSS Food and Nutrition Module© The Regents of the University of CaliforniaCan be duplicated for workshop or classroom use.
Investigation 4: Free LunchNo. 18–Modified Student Sheet
WA Edition
Name ________________________________ Date ___________________________________
FULL OPTION SCIENCE SYSTEM
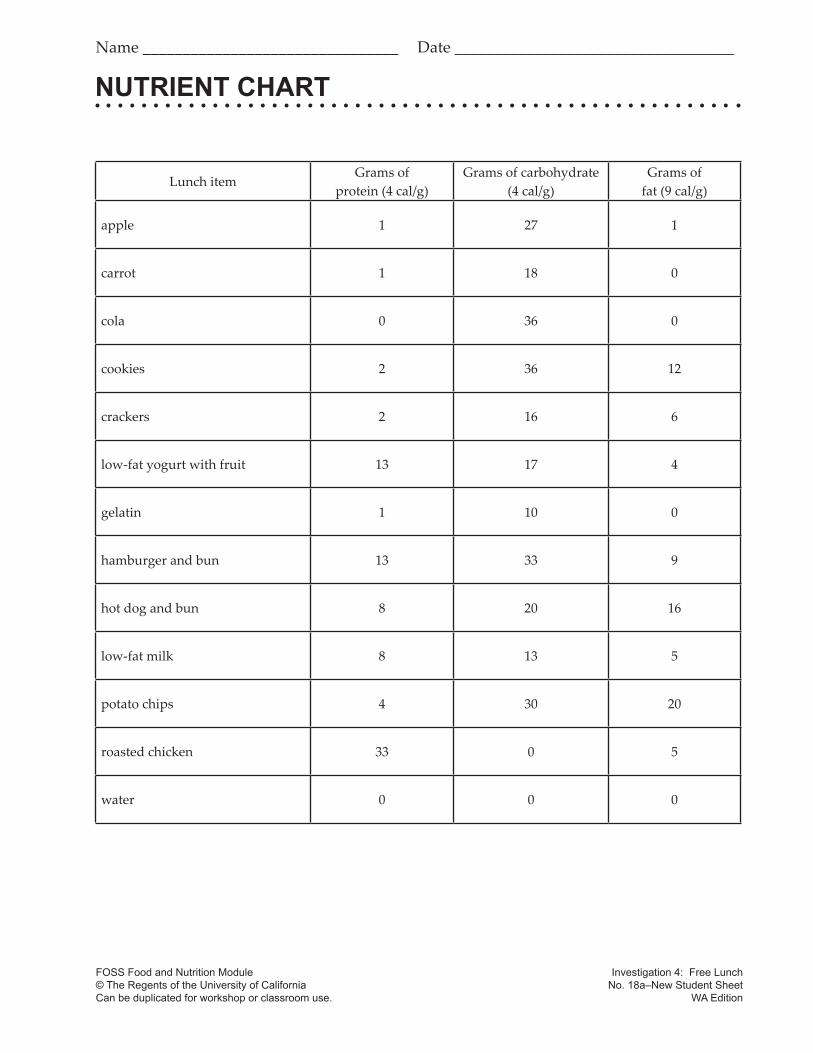
Lunch itemGrams of
protein (4 cal/g)Grams of carbohydrate
(4 cal/g)Grams of
fat (9 cal/g)
apple 1 27 1
carrot 1 18 0
cola 0 36 0
cookies 2 36 12
crackers 2 16 6
low-fat yogurt with fruit 13 17 4
gelatin 1 10 0
hamburger and bun 13 33 9
hot dog and bun 8 20 16
low-fat milk 8 13 5
potato chips 4 30 20
roasted chicken 33 0 5
water 0 0 0
NUTRIENT CHARTName ________________________________ Date ___________________________________
FOSS Food and Nutrition Module© The Regents of the University of CaliforniaCan be duplicated for workshop or classroom use.
Investigation 4: Free LunchNo. 18a–New Student Sheet
WA Edition

1. Draw lines to match the chemical or nutrient to the related disease.
Diabetes Vitamin D Rickets Vitamin C
Scurvy Insulin
2. If you developed diabetes, what actions would you have to take to stay healthy? Why is each action important?
FOSS Food and Nutrition Module© The Regents of the University of CaliforniaCan be duplicated for workshop or classroom use.
Investigation 4: Free LunchNo.18b—New Student Sheet
WA Edition
SCIENCE STORIES—DISEASE PREVENTION AND CONTROL
Name ________________________________ Date ___________________________________

MAGNETISM AND ELECTRICITY 39FOOD AND NUTRITION
WASHINGTON EDITION
Grade 6 Version

FULL OPTION SCIENCE SYSTEMFULL OPTION SCIENCE SYSTEM40 Grade 6 Version FULL OPTION SCIENCE SYSTEM
INVESTIGATION 4: FREE LUNCHPART 2: CHOOSING YOUR OWN INVESTIGATIONINQUIRY OR DESIGN PROJECT
The inquiry or design project replaces “Choosing Your Own Investigation.” It can be completed at any point in the module with any lesson that lends itself to students’ independently carrying out an investigation, starting from their own question, to drawing a conclusion. See examples of inquiry questions at the bo�om of each “At-a-Glance” page.
Use materials available from the FOSS kit and add materials as needed or possible. Use the following student sheets, which may also be found in the Assessment Overview (3-6) with more detailed information, called Meeting the Washington Standards starting on page x.
Note: Students should complete an entire inquiry project at least once in each module to build students’ understanding of the inquiry and design process by the 5th/6th grade.
INQUIRY OR DESIGN PROJECT SCORING GUIDES
Use the Student Sheet—Inquiry Project and Writing A Conclusion Scoring Rubric. By the end of 5th/6th grade, students should be able to score between 10-13 points for Planning an Investigation to meet standards on the WASL.
FORMATIVE ASSESSMENT

FULL OPTION SCIENCE SYSTEMFULL OPTION SCIENCE SYSTEM FOSS Module© The Regents of the University of CaliforniaCan be duplicated for classroom or workshop use.
Inquiry ProjectStudent Sheet
WA Edition
STUDENT SHEET – INQUIRY PROJECTPlan an investigation to answer a question.
In your plan, be sure to include the:• question that can be investigated• prediction of the outcome of the investigation• materials needed to do the investigation• procedure that includes:
logical steps to do the investigation variables kept the same (controlled) one variable changed (manipulated) any variables being measured and recorded how o�en measurements are taken and recordedQuestion:
Prediction:
Materials:
Date ___________________________________Name ________________________________

FULL OPTION SCIENCE SYSTEM
INQUIRY PROJECT (continued)
You may use the space below for a labeled diagram to support your procedure.
Procedure:
FOSS Module© The Regents of the University of CaliforniaCan be duplicated for classroom or workshop use.
Inquiry ProjectStudent Sheet
WA Edition
FULL OPTION SCIENCE SYSTEM FOSS Module© The Regents of the University of CaliforniaCan be duplicated for classroom or workshop use.
Inquiry ProjectStudent Sheet
WA Edition
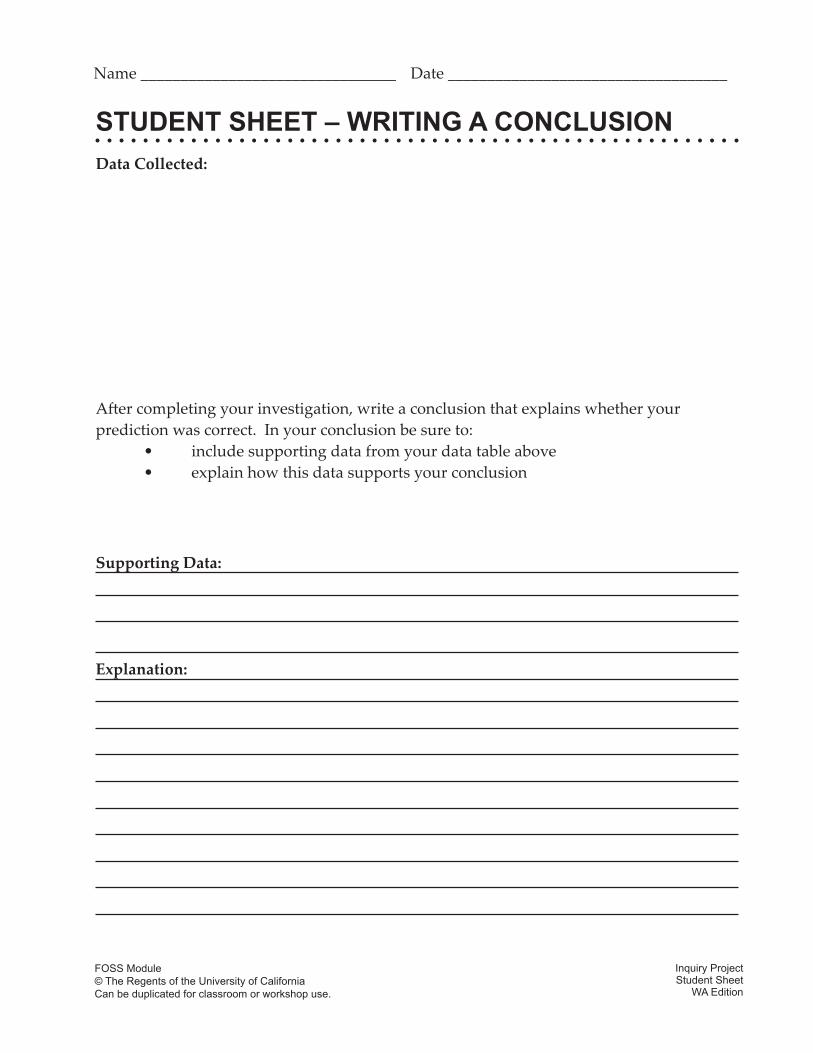
STUDENT SHEET – WRITING A CONCLUSION Data Collected:
A�er completing your investigation, write a conclusion that explains whether your prediction was correct. In your conclusion be sure to: • include supporting data from your data table above • explain how this data supports your conclusion
Supporting Data:
Explanation:
Date ___________________________________Name ________________________________

FULL OPTION SCIENCE SYSTEMFOSS Module© The Regents of the University of CaliforniaCan be duplicated for classroom or workshop use.
Inquiry ProjectStudent Sheet
WA Edition
STUDENT SHEET – INQUIRY PROJECT AND WRITING A CONCLUSION SCORING RUBRICStudent Sheet-Inquiry Project (Question)
Questioning. Understand how to ask a question about objects, organisms, and events in the environment (GLE 2.1.1)
Investigation A�ribute Description of A�ributeValue Point
Question The question must be phrased as one that can be investigated 1
Student Sheet-Inquiry Project (Planning and Conduction)
Planning and Conducting Safe Investigations. Understand how to plan and conduct simple investigations following all safety rules (GLE 2.1.2)
Planning Investigation A�ributes
Description of A�ributeThe procedure (wri�en or a labeled diagram) is evaluated as follows
Value Point
Prediction
Materials
Logical Steps
Variables Kept the Same (controlled)
One Changed Variable (manipulated)
One Measured Variable
Repeated Trials
Record Measurements
The prediction must be related to the investigative questions and include both the variable changed, as well as the variable measured A list of minimum materials needed to perform the procedure must be listed in this section
The steps of the investigation are logical with enough detail to repeat the procedure effectively
At least one variable kept the same is identified or implied
Identifies the correct variable to be changed
Identifies an appropriate variable to be measured and the units to be used.
More than one trial is planned
The procedure explicitly states to “record” or gives a data table
1
1
1
1
1
1
1
1
Conducting Investigation A�ributes Description of A�ribute
Value Point
Conducts Investigation
Data Collection
Carries out investigation as planned or recognizes problems and makes appropriate adjustments
Collects and records data
1
1
Student Sheet-Inquiry Project (Conclusion)
Explaining. Understand how to construct a reasonable explanation using evidence (GLE 2.1.3)
Investigation A�ributes Description of A�ributeValue Point
Citing Data
Citing Data
Explanation
Cites lowest supporting data.
Cites highest supporting data
Uses data to form a reasonable explanation
1
1
1

MAGNETISM AND ELECTRICITYFULL OPTION SCIENCE SYSTEM 45FOOD AND NUTRITION
WASHINGTON EDITION
Grade 6 Version
END-OF-MODULE ASSESSMENTThis assessment is used as an evaluative tool a�er all the investigations have been completed. It checks student content knowledge, skills in conducting investigations, and explanation building. Items are in three formats: performance tasks, multiple-choice/short-answer items (which give students practice for standardized tests), and narrative items that require students to write short explanations.
MATERIALS FOR EACH TESTING-LIQUIDS STATION
1 Syringe, modified 1 Reaction bo�le, 120-ml 1 Rubber stopper, 1-hole 2 Plastic cups • Baking soda 1 Spoon, 1-ml 2 Containers, 1/2-liter∆ 1 Container, 1-liter • Vinegar, 250-ml * • Food coloring, blue and green * 3 Sticky notes • Water * • Paper towels * • Assessment sheet no. 7 called Performance Assessment: Testing Liquids
* Supplied by the teacher Use the duplication master to make copies.∆ FOSS Measurement kit item
FULL OPTION SCIENCE SYSTEMFULL OPTION SCIENCE SYSTEM46 Grade 6 Version FULL OPTION SCIENCE SYSTEM
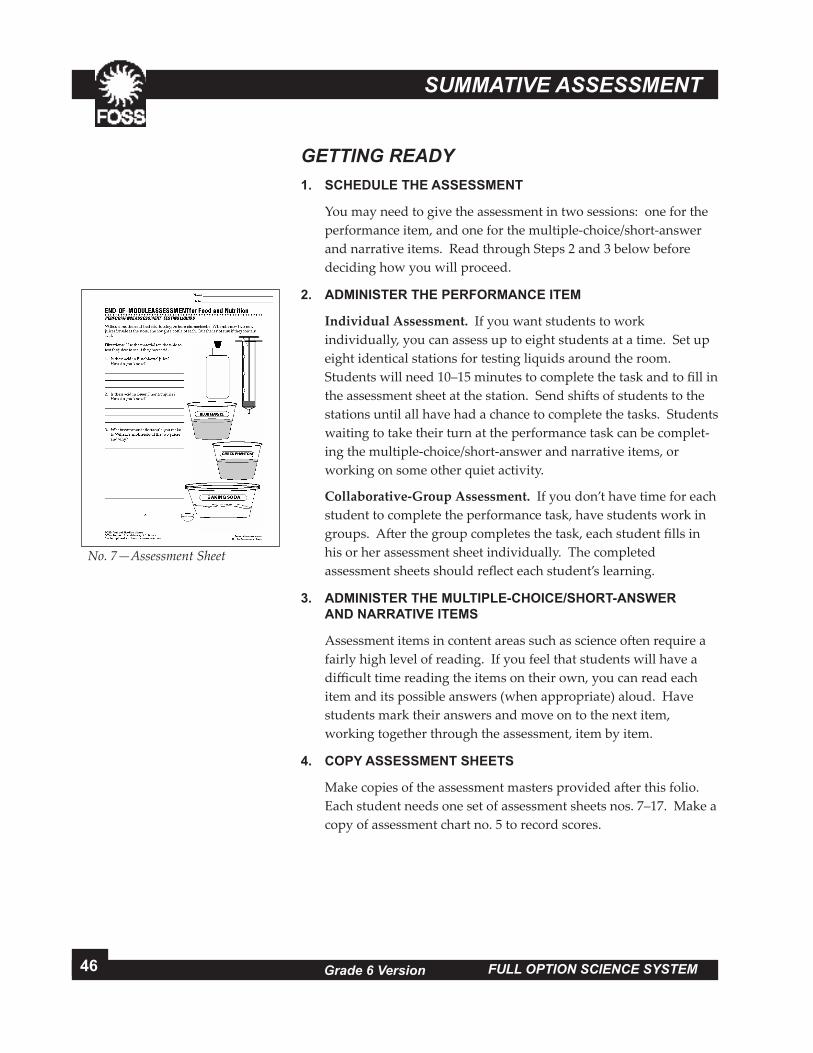
GETTING READY1. SCHEDULE THE ASSESSMENT
You may need to give the assessment in two sessions: one for the performance item, and one for the multiple-choice/short-answer and narrative items. Read through Steps 2 and 3 below before deciding how you will proceed.
2. ADMINISTER THE PERFORMANCE ITEM
Individual Assessment. If you want students to work individually, you can assess up to eight students at a time. Set up eight identical stations for testing liquids around the room. Students will need 10–15 minutes to complete the task and to fill in the assessment sheet at the station. Send shi�s of students to the stations until all have had a chance to complete the tasks. Students waiting to take their turn at the performance task can be complet-ing the multiple-choice/short-answer and narrative items, or working on some other quiet activity.
Collaborative-Group Assessment. If you don’t have time for each student to complete the performance task, have students work in groups. A�er the group completes the task, each student fills in his or her assessment sheet individually. The completed assessment sheets should reflect each student’s learning.
3. ADMINISTER THE MULTIPLE-CHOICE/SHORT-ANSWER AND NARRATIVE ITEMS
Assessment items in content areas such as science o�en require a fairly high level of reading. If you feel that students will have a difficult time reading the items on their own, you can read each item and its possible answers (when appropriate) aloud. Have students mark their answers and move on to the next item, working together through the assessment, item by item.
4. COPY ASSESSMENT SHEETS
Make copies of the assessment masters provided a�er this folio. Each student needs one set of assessment sheets nos. 7–17. Make a copy of assessment chart no. 5 to record scores.
No. 7—Assessment Sheet
SUMMATIVE ASSESSMENT

FULL OPTION SCIENCE SYSTEM MAGNETISM AND ELECTRICITYFULL OPTION SCIENCE SYSTEM 47FOOD AND NUTRITION
WASHINGTON EDITION
Grade 6 Version
5. SET UP THE PERFORMANCE STATIONSSet up stations for the performance task as suggested below.• Make enough Blue Marvel and Green Phantom juice for the
entire class. Each student should need only 5 ml of each juice if the correct procedure is followed.
Juice Recipe Blue Marvel 200 ml vinegar + blue food coloring Green Phantom 50 ml vinegar + 150 ml water + green food coloring
Testing-Liquids Station• Pour about 50 ml of Blue Marvel and Green Phantom juice
in separate labeled cups.• Fill the 1/2-liter container with water.• Place the 1-liter container at the station for liquid disposal.
BLUE MARVEL
GREEN PHANTOM
GARBAGE
WATER
BAKING SODA

FULL OPTION SCIENCE SYSTEMFULL OPTION SCIENCE SYSTEM48 Grade 6 Version FULL OPTION SCIENCE SYSTEM
No. 7—Assessment Sheet
SUMMATIVE ASSESSMENT
FOOD AND NUTRITIONEND-OF-MODULE ASSESSMENT SCORING GUIDES
Performance Assessment Item—Testing Liquids
Score If the student... 4 concludes there is acid in Blue Marvel; explains the
acid-test procedure; reports that a reaction with Blue Marvel forced the syringe plunger up; concludes there is acid in Green Phantom but not as much, because the plunger did not go up as high; recommends that Willard’s mother not drink either juice, or drink small amounts of Green Phantom since it has less acid
3 concludes there is acid in Blue Marvel but does not explain procedure; reports evidence that the plunger goes up, indicating a reaction between baking soda and the juice; concludes there is acid in Green Phantom because the plunger also goes up; recommends that Willard’s mother not drink either juice, or drink small amounts of Green Phantom since the results show it has less acid
2 concludes there is acid in Blue Marvel and Green Phantom; gives unclear explanation about how the student knows; recommends that Willard’s mother not drink either juice because both have acid
1 concludes there is no acid in one or both juices; recommends both juices for Willard’s mother to drink
0 does not complete the task, or gives information that has nothing to do with what was asked
FULL OPTION SCIENCE SYSTEMFULL OPTION SCIENCE SYSTEM
FOSS Food and Nutrition Module© The Regents of the University of CaliforniaCan be duplicated for classroom or workshop use.
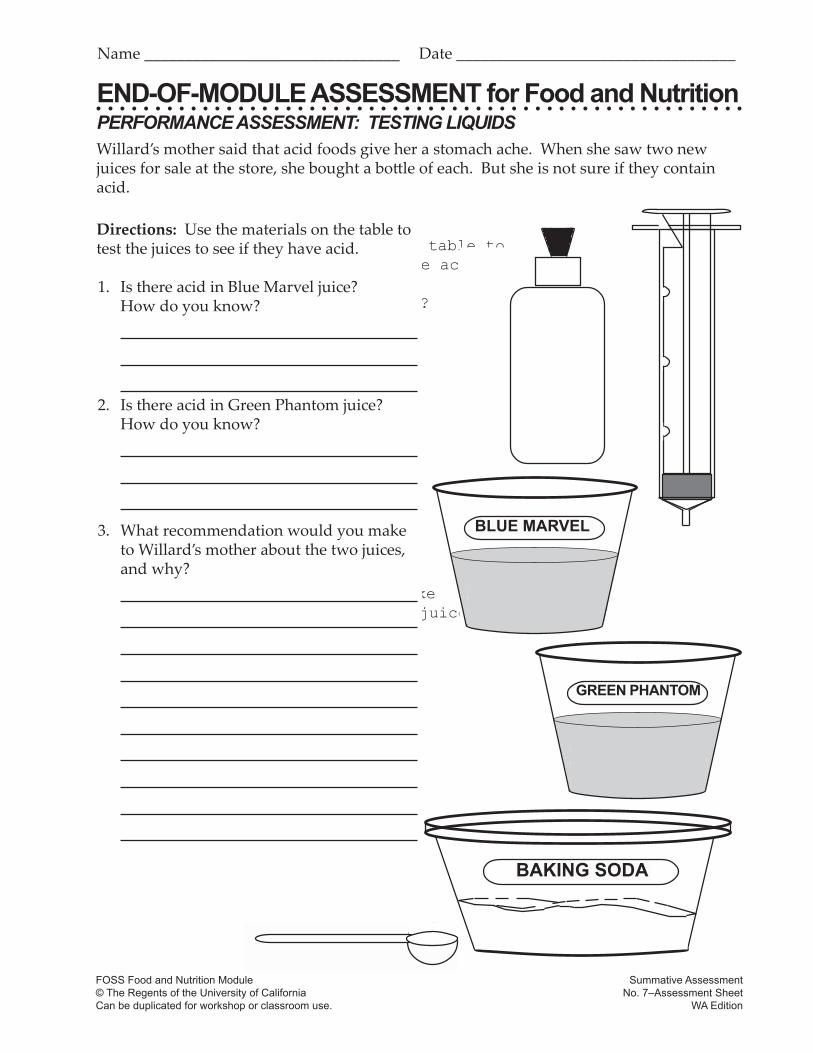
END-OF-MODULE ASSESSMENT for Food and NutritionPERFORMANCE ASSESSMENT: TESTING LIQUIDS
Summative AssessmentNo. 7—Assessment Sheet
Name ____________________________________
Date_____________________________________
W illard’s mother said that acid foods give her a stomachache. When she saw tjuices for sale at the store, she bought a bottle of each. But she is not sure if they containacid.
Directions: Use the materials on the table totest the juices to see if they have acid.
1. Is there acid in Blue Marvel juice?How do you know?
2. Is there acid in Green Phantom juice?How do you know?
3. What recommendation would you maketo Willard’s mother about the two juices,and why?
BLUE MARVEL
BAKING SODA
GREEN PHANTOM
Willard’s mother said that acid foods give her a stomach ache. When she saw two new juices for sale at the store, she bought a bo�le of each. But she is not sure if they contain acid.
Directions: Use the materials on the table to test the juices to see if they have acid.
1. Is there acid in Blue Marvel juice? How do you know?
2. Is there acid in Green Phantom juice? How do you know?
3. What recommendation would you make to Willard’s mother about the two juices, and why?
FOSS Food and Nutrition Module© The Regents of the University of CaliforniaCan be duplicated for classroom or workshop use.
END-OF-MODULE ASSESSMENT for Food and NutritionPERFORMANCE ASSESSMENT: TESTING LIQUIDS
Summative AssessmentNo. 7—Assessment Sheet
Name ____________________________________
Date_____________________________________
W illard’s mother said that acid foods give her a stomachache. When she saw tjuices for sale at the store, she bought a bottle of each. But she is not sure if they containacid.
Directions: Use the materials on the table totest the juices to see if they have acid.
1. Is there acid in Blue Marvel juice?How do you know?
2. Is there acid in Green Phantom juice?How do you know?
3. What recommendation would you maketo Willard’s mother about the two juices,and why?
BLUE MARVEL
BAKING SODA
GREEN PHANTOM
BLUE MARVEL
GREEN PHANTOM
BAKING SODA
FOSS Food and Nutrition Module© The Regents of the University of CaliforniaCan be duplicated for workshop or classroom use.
Summative AssessmentNo. 7–Assessment Sheet
WA Edition
END-OF-MODULE ASSESSMENT for Food and NutritionPERFORMANCE ASSESSMENT: TESTING LIQUIDS
Name ________________________________ Date ___________________________________

FULL OPTION SCIENCE SYSTEMFULL OPTION SCIENCE SYSTEM50 Grade 6 Version FULL OPTION SCIENCE SYSTEM
MULTIPLE-CHOICE ITEMSScore 1 point for each correct answer.
1. B 5. B 9. A
2. C 6. A 10. A
3. B 7. B 11. C
4. D 8. B 12. A
SHORT-ANSWER ITEMS
SUMMATIVE ASSESSMENT
No. 8—Assessment Sheet
No. 9—Assessment Sheet
No. 10—Assessment Sheet

FULL OPTION SCIENCE SYSTEM MAGNETISM AND ELECTRICITYFULL OPTION SCIENCE SYSTEM 51FOOD AND NUTRITION
WASHINGTON EDITION
Grade 6 Version
SHORT-ANSWER ITEMS
Short-Answer Item 13
Answers for the chart
a. Score 2 points if the student fills in the chart and correctly calculates the number of calories for the lunch. Score 1 point if the student makes no more than a few minor calculation errors.
b. Score 1 point if the student suggests reasonable substitutes that reduce the total number of calories in the lunch.
c. Score 1 point if the student suggests a reasonable substitute that specifically reduces the calories from fat.
d. Score 2 points if the student makes choices from the chart and correctly calculates the calories in the lunch. Score 1 point if the student follows the process, but makes minor calculation errors.
No. 11—Assessment Sheet
No. 12—Assessment Sheet
Lunch itemGrams from
proteinGrams from
carbohydrateGrams from
fat
hot dog and bun 8 X 4 = 32 2 X 4 = 8 16 X 9 = 144
potato chips 4 X 4 = 16 30 X 4 = 120 20 X 9 = 180
cola 0 36 X 4 - 144 0
Calories of each nutrient 48 272 324
Total calories for lunch: 644

FULL OPTION SCIENCE SYSTEMFULL OPTION SCIENCE SYSTEM52 Grade 6 Version FULL OPTION SCIENCE SYSTEM
SHORT-ANSWER ITEM 14
Score 2 points if all boxes are filled in correctly. Score 1 point if all but one or two boxes are filled in correctly.
Short-Answer Item 15a. Score 1 point if the spreads are in the order below. The least fat : Noleo Mayo-Lite Lo-Fat Ham Tuna Delight The most fat: Spicy Spread
b. Score 1 point if the student explains that the order of the spreads depends on the grease mark le� on the brown paper: the larger the mark, the more the fat.
c. Score 1 point if the student writes that Tuna Delight is 20–30% fat.d. Score 1 point if the student reports there is no fat in Noleo.
SUMMATIVE ASSESSMENT
Sugar
Carbon dioxide
Brown paper
Vitamin C
Ingredient Indicator Evidence
Yeast Carbon dioxide
Baking sodaAcid
Fat Grease marks
Indophenol Color change
No. 13—Assessment Sheet

FULL OPTION SCIENCE SYSTEM MAGNETISM AND ELECTRICITYFULL OPTION SCIENCE SYSTEM 53FOOD AND NUTRITION
WASHINGTON EDITION
Grade 6 Version
NARRATIVE ITEMS
Item 16 Testing Foods for Acid
Score If the student...
4 explains that Monica and Raul have not designed a fair experiment; says that what they did well was use the same amount of baking soda in each bo�le; says that they should use the same amount of each liquid and indicator so they can tell which juices have more acid than others.
3 explains that the students have not designed a fair experiment; says that they controlled the amount of baking soda but not the amount of liquid.
2 states that the students did not design a fair experiment; gives no further details.
1 states that the students designed a fair experiment, so no further guidelines are necessary.
0 does not complete the task, or gives information that has nothing to do with what was asked.
Item 17 Testing Foods for Acid and Sugar
Score If the student...
4 explains that Paula is right; says that Vera should have tested the food further because baking soda indicates acid in food; explains that, to test for sugar, you must follow a different procedure such as the one in the module that uses yeast as an indicator.
3 explains that Paula is right; says that Vera should have tested the food further because baking soda tests only for acid.
2 states that Paula is right; gives no further explanation.
1 states that Vera is right, no further testing is needed.
0 does not complete the task, or gives information that has nothing to do with what was asked.

FULL OPTION SCIENCE SYSTEMFULL OPTION SCIENCE SYSTEM54 Grade 6 Version FULL OPTION SCIENCE SYSTEM
Item 18 Testing Foods for Starch
Score If the student...
4 writes that Sally put iodine on the foods because she was using it as an indicator for starch; explains that something usually happens when an indicator is used to provide evidence that a food contains a nutrient; concludes that the bread, rice, and potato all contain starch, because they turned black when the indicator was placed on them.
3 writes that Sally put iodine on the foods because she was using it as an indicator for starch; includes no further information about indicators; concludes that bread, rice, and potato contain starch, because they turned black.
2 writes that Sally put the iodine on the foods to test for starch; concludes that the bread, rice, and potato contain starch.
1 writes something about testing for starch; may concludes that bread, rice, and potato contain starch; gives an explanation that is unclear or has major mis-conceptions.
0 does not complete the task, or gives information that has nothing to do with what was asked.
SUMMATIVE ASSESSMENT
FULL OPTION SCIENCE SYSTEM MAGNETISM AND ELECTRICITYFULL OPTION SCIENCE SYSTEM 55FOOD AND NUTRITION
WASHINGTON EDITION
Grade 6 Version
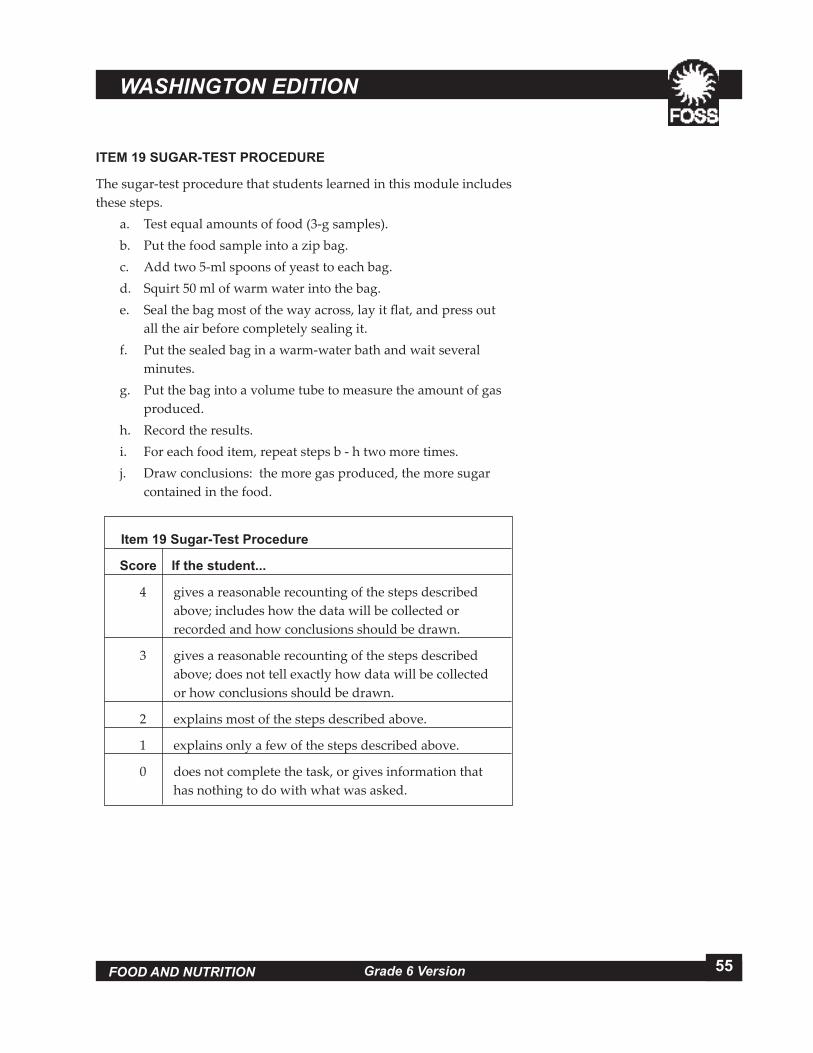
ITEM 19 SUGAR-TEST PROCEDURE
The sugar-test procedure that students learned in this module includes these steps.
a. Test equal amounts of food (3-g samples).b. Put the food sample into a zip bag.c. Add two 5-ml spoons of yeast to each bag.d. Squirt 50 ml of warm water into the bag.e. Seal the bag most of the way across, lay it flat, and press out
all the air before completely sealing it.f. Put the sealed bag in a warm-water bath and wait several
minutes.g. Put the bag into a volume tube to measure the amount of gas
produced. h. Record the results.i. For each food item, repeat steps b - h two more times.j. Draw conclusions: the more gas produced, the more sugar
contained in the food.
Item 19 Sugar-Test Procedure
Score If the student...
4 gives a reasonable recounting of the steps described above; includes how the data will be collected or recorded and how conclusions should be drawn.
3 gives a reasonable recounting of the steps described above; does not tell exactly how data will be collected or how conclusions should be drawn.
2 explains most of the steps described above.
1 explains only a few of the steps described above.
0 does not complete the task, or gives information that has nothing to do with what was asked.

FULL OPTION SCIENCE SYSTEM56 FULL OPTION SCIENCE SYSTEMFULL OPTION SCIENCE SYSTEM
GRADE 6 VERSION FOOD AND NUTRITION BLUEPRINT
Forms of Energy. Understand that energy is a property of matter, objects, and systems and comes in many forms (i.e., heat [thermal] energy, sound energy, light energy, electrical energy, kinetic energy, potential energy, and chemical energy). (GLE 1.1.4)
Human Body. Understand human life functions and the interconnecting organ systems necessary to maintain human life. (GLE 1.2.8)
Conservation of Matter and Energy. Understand that matter is conserved during physical and chemical changes. (GLE 1.3.3)
Life Processes and the Flow of Matter and Energy. Understand that living things need constant energy and matter. (GLE 1.3.8)
Planning and Conducting Safe Investigations. Understand how to plan and conduct scientific investigations. (GLE 2.1.2) Explaining. Apply understanding of how to construct a scientific explanation using evidence and inferential logic. (GLE 2.1.3) Evaluating Methods of Investigation. Understand how to make the results of scientific investigations reliable and how to make the method of investigation valid. (GLE 2.2.4)
Inv. 1, Pt. 2Inv. 2, Pt. 3Inv. 3, Pt. 2, 3
Inv. 1, Pt. 2Inv. 4, Pt. 1
Inv. 1, Pt. 1
Inv. 1, Pt. 2Inv. 2, Pt. 2, 3 Inv. 3, Pt. 2Inv. 4, Pt. 1
SYSTEMS FORMATIVE SUMMATIVE COMMENTS
INQUIRY
15a, 15b
Performance Assessment
Performance Assesment
Assessed throughout grades in inquiry projects.
Assessed throughout grades in inquiry projects.
Inv. 1, Pt. 1Inv. 2, Pt. 1Inv. 2, Pt. 2
Inv. 3, Pt. 1
6-8 Grade Level Expectations (GLE) Assessment Opportunities
INQUIRY OR DESIGN PROJECT Inquiry GLEs: 2.1.1—2.1.5 orDesign GLEs: 3.1.1—3.1.3
Projects Important to do one project per module.
Important to cover in this module.
Important to cover in this module.
Important to cover in this module.
Important to cover in this module.
Inv. 3, Pt. 2