
Assessment Framework for Wireless V2V Communication … Shankar... · Assessment Framework for...
104
Assessment Framework for Wireless V2V Communication-based ITS Applications MASSACHUSETTS INSITTE by OF TECHNOLOGY Swapnil Shankar Rajiwade MAR 0 8 2012 Bachelor of Technology in Civil Engineering (2009) LIBRARIES Indian Institute of Technology Bombay, Mumbai, India Submitted to the Department of Civil and Environmental Engineering in partial fulfillment of the requirements for the degree of ARCHNVES Master of Science in Transportation at the MASSACHUSETTS INSTITUTE OF TECHNOLOGY September 2011 © Massachusetts Institute of Technology 2011. All rights reserved. A u th or ....................... 2 ............................... Department of Ci and Environmental Engineering August 18, 2011 Certified by.............. Moshe E. Ben-Akiva Edmund K. Turner Professor of Civil and Environmental Engineering Thesis Supervisor ,1 A Accepted by .......... Heidi M. ep[ Chair, Departmental Committee for Graduate Students
Transcript of Assessment Framework for Wireless V2V Communication … Shankar... · Assessment Framework for...

Assessment Framework for Wireless V2V
Communication-based ITS ApplicationsMASSACHUSETTS INSITTEby OF TECHNOLOGY
Swapnil Shankar Rajiwade MAR 0 8 2012
Bachelor of Technology in Civil Engineering (2009) LIBRARIESIndian Institute of Technology Bombay, Mumbai, India
Submitted to the Department of Civil and Environmental Engineeringin partial fulfillment of the requirements for the degree of
ARCHNVESMaster of Science in Transportation
at the
MASSACHUSETTS INSTITUTE OF TECHNOLOGY
September 2011
© Massachusetts Institute of Technology 2011. All rights reserved.
A u th or ....................... 2 ...............................Department of Ci and Environmental Engineering
August 18, 2011
Certified by..............Moshe E. Ben-Akiva
Edmund K. Turner Professor of Civil and Environmental EngineeringThesis Supervisor
,1 AAccepted by ..........
Heidi M. ep[
Chair, Departmental Committee for Graduate Students


Assessment Framework for Wireless V2V
Communication-based ITS Applications
by
Swapnil Shankar Rajiwade
Submitted to the Department of Civil and Environmental Engineeringon August 18, 2011, in partial fulfillment of the requirements for the degree of
Master of Science in Transportation
Abstract
Inter-vehicle communication enabled by wireless technology is an emerging area of In-telligent Transportation Systems (ITS). This technology has generated great interestamong automobile manufacturers and ITS researchers alike because of its poten-tial to improve safety and non-safety ITS applications by supporting data collectionand dissemination at the individual vehicle level. A modelling framework based ona microscopic traffic simulator is presented in this thesis to explore the effects ofwireless Vehicle-to-Vehicle (V2V) communication based ITS applications on trafficperformance.
Microscopic traffic simulators describe the interaction between drivers and infras-tructure at individual vehicle level. The behaviour models in microscopic traffic sim-ulators describe driving decisions like route choice, car-following and lane-changing.The existing behaviour model is extended to incorporate the effect of V2V commu-nication based applications by tying information generated by the application to thebehaviour model.
A case study on a road network in Singapore with green light prediction applica-tion as the V2V communication application is implemented. The car-following modelin MITSIMLab is modified to account for speed advisories generated by green lightprediction application. The application shows gains in travel time savings and asmoother traffic flow as a result of the green light prediction. Higher improvementsacross penetration rates were observed at high demand levels. The incremental im-pact of the application on traffic performance tapers off at higher penetration rates.Drivers responding to the speed advisories also affect vehicles immediately followingthem. Hence the effective penetration rate of the application is higher than actualpenetration rate. The results imply that the green light prediction application wouldreduce the average number of halts per trip by approximately 10% at existing traveldemand. The current model can be extended to test other V2V based ITS applica-tions and to couple with a wireless network simulator to represent wireless data flowsmore realistically.
Thesis Supervisor: Moshe E. Ben-AkivaTitle: Edmund K. Turner Professor of Civil and Environmental Engineering


Acknowledgements
I would like to take this opportunity to express my sincere gratitude to my research advisor
Prof. Moshe Ben-Akiva. I have learnt a lot from Prof. Ben-Akiva, both academic and
otherwise, and I consider myself lucky to have had the opportunity to work under his
guidance. It has been a wonderful growing experience for me.
Thanks to Prof. Charisma Choudhury, for guiding me through my initial research at the
ITS Lab.
This research was funded by Singapore-MIT Alliance for Research and Technology (SMART).
I would like to acknowledge Future Urban Mobility - Interdisciplinary Research Group (FM-
IRG) for lending support to the research; as well as all the PIs involved directly or indirectly
in the development of SimMobility, for showing interest in this research. Thanks to Em-
manouil for acquiring and sharing the data for Bugis network.
I want to thank my fellow lab-mate, Marty Milkovits for all the help and support during
my stay in the ITS Lab. His constant feedback and constructive criticism of my work has
been a key motivating factor in the whole process.
I am extremely thankful to all of my friends from the ITS Lab for making this stay a
memorable one. Thanks to Li for her help on Linux and MITSIMLab. Thanks to Carlos
for his input on the GIS shape-files. I want to acknowledge other members of the lab for
their constant support and moments of laughter: Angelo, Varun, both Joao's, Peter, Eric
and Sujith. Thanks to Katie for organising things and making the lab a lively place.
Thanks to all of my friends from MST; especially Paul and Kari for always being great
friends and introducing me to the American way of life.
Thanks to all of my Indian friends for making the moments away from home and family,ones to cherish; especially Nihit for his friendship and support, and Arun for being such a
great room-mate over the last two years.
Above all, I want to thank my family: my parents, Sunita and Shankar for their unending
love and faith in me. I dedicate this work to my brother, Amol who has been instrumental
in my academic growth and has always been the caring figure.

6

Contents
1 Introduction
1.1 V2V Communication ...........1.1.1 Technology . . . . . . . . . . . .1.1.2 Application ............
1.1.2.1 Potential Applications .1.1.2.2 IntelliDrive . . . . . . .1.1.2.3 Non-Safety Applications:
1.2 Simulation approach . . . . . . . . . . .1.3 Future Urban Mobility Project . . . . .1.4 Objectives . . . . . . . . . . . . . . . . .1.5 Thesis Outline . . . . . . . . . . . . . . .
2 Literature Review
2.1 Applications . . . . . . . . . . . . . . . .2.2 Need for simulation approach . . . . . .
2.2.1 ParkNet . . . . . . . . . . . . . .2.2.2 En route connectivity . . . . . . .
2.3 Simulation approach . . . . . . . . . . .2.3.1 Wireless network simulation . . .2.3.2 Traffic network simulation . . . .
2.3.3 Integrated simulation approach .2.3.4 Conclusion . . . . . . . . . . . . .
2.4 Summary . . . . . . . . . . . . . . . . .
3 Methodology
3.1 Requirements . . . . . . . . . . . . . . .3.2 Framework Design . . . . . . . . . . . .
3.2.1 Actors and interactions . . . . . .
Green Light Prediction

3.2.2 Driving Response
3.3 Implementation . . . . .
3.3.1 Traffic Simulator
3.3.2 Data needs . . .
3.4 Summary . . . . . . . .
4 Case Study: Bugis Road Network, Singapore
4.1 Green light prediction application ..........
4.1.1 Goal of the application . . . . . . . . . . .
4.1.2 Data collection and prediction . . . . . . .
4.2 Modelling framework for the green light prediction
4.2.1 Driving Response . . . . . . . . . . . . . .
4.3 Application of the framework in a Case Study . .
4.3.1 Dataset Description . . . . . . . . . . . . .
4.3.1.1 Study Area . . . . . . . . . . . .
4.3.1.2 Dataset Overview . . . . . . . . .
4.3.2 Aggregate Calibration . . . . . . . . . . .
4.3.3 Base-line Scenario. . . . . . . . . . . . . .
4.3.4 Scenario Analysis . . . . . . . . . . . . . .
4.3.4.1 Average Speed . . . . . . . . . .
4.3.4.2 Travel Time . . . . . . . . . . . .
4.3.4.3 Halts . . . . . . . . . . . . . . .
4.4 Summary . . . . . . . . . . . . . . . . . . . . . .
application
5 Conclusion
5.1 Thesis Summary . . . . . . . . . . . . . . . . . . . . . . . . . . . . . . . .
5.2 Contribution. . . . . . . . . . . . . . . . . . . . . . . . . . . . . . . . . . .
5.3 Future Directions for Research . . . . . . . . . . . . . . . . . . . . . . . . .
Bibliography
A MITSIMLab: Micro-scopic Traffic Simulation Laboratory
A.1 MITSIMLab . . . . . . . . . . . . . . . . . . . . . . . . . . . . . . . . . . .
A.1.1 Traffic Flow Simulator (MITSIM): . . . . . . . . . . . . . . . . . .
A.1.2 Traffic Management Simulator (TMS): . . . . . . . . . . . . . . . .
A.1.3 Graphical User Interface (GUI): . . . . . . . . . . . . . . . . . . . .
87
93
93
94
95
96

B Aggregate Calibration Framework 97B.1 Calibration Framework .............................. 97
B.1.1 Problem Formulation ................................ 98
B.2 Goodness of fit measures .................................. 100
C Communication Technologies 101
D Network Capacity 103

10

List of Figures
1.1 2004 US Crash statistics classified by manner of collision . . . . . . . . . . .
2.1 Ultrasonic sensor fitted on the side of a car detects parked cars and vacant
spaces . . . . . . . . . . . . . . . . . . . . . . . . . . . . .
2.2 Sketch of communication between a car and a sensor belt in
tecture .................................
2.3 Simple incident message propagation scenario . . . . . . .
2.4 Coupling of network and traffic simulator . . . . . . . . . .
3.1
3.2
3.3
4.1
4.2
4.3
4.4
4.5
4.6
4.7
4.8
4.9
4.10
4.11
4.12
4.13
4.14
NOTICE archi-. . . . . . . . . . 30
. . . . . . . . . . 32
. . . . . . . . . . 35
Driver - Wireless Network interaction . . . . . . . . . . . .
Modelling Framework . . . . . . . . . . . . . . . . . . . . .
MITSIM-Traffic Management System Integration . . . . .
Schematic of green light prediction . . . . . . . . . . . . . . . . . . . . . . .
Lane change by the V2V enabled driver to pass the myopic driver . . . . . .
Driver response to green light prediction flow-chart . . . . . . . . . . . . . .
Bugis Network . . . . . . . . . . . . . . . . . . . . . . . . . . . . . . . . . . .
Location of loop detectors on the Bugis Network . . . . . . . . . . . . . . . .
Average Speed across penetration rates over different travel demand levels .
Average Speed across travel demand levels over different penetration rates .
Average speed across different penetration rates at 25% compliance rate . . .
Average speed across different penetration rates at 50% compliance rate . . .
Average speed across different penetration rates at 75% compliance rate . . .
Average travel time across penetration rates at existing travel demand level
Average travel time across compliance rates at existing travel demand level
Percentage change in average number of halts per trip across penetration rates
Percentage change in average number of halts per trip across compliance rates
A.1 MITSIMLab Framework . . . . . . . . . . . . . . . . . . . . . . . . . . . . . 94

B.1 Calibration Framework . . . . . . . . . . . . . . . . . . . . . . . . . . . . . . 97

List of Tables
4.1 Statistics of Count Data . . . . . . . . . . . . . . . . . . . . . . . . . . . . . 61
4.2 Calibration Results . . . . . . . . . . . . . . . . . . . . . . . . . . . . . . . . 62
4.3 Validation Results - Measures of effectiveness for counts . . . . . . . . . . . . 63
4.4 Network performance across different penetration rates at One-third of exist-
ing travel demand . . . . . . . . . . . . . . . . . . . . . . . . . . . . . . . . . 65
4.5 Network performance across different penetration rates at Two-third of ex-
isting travel demand . . . . . . . . . . . . . . . . . . . . . . . . . . . . . . . 66
4.6 Network performance across different penetration rates at existing travel de-
mand......... .................. ...................... 66
4.7 Network performance across different penetration rates at Maximum travel
dem and . . . . . . . . . . . . . . . . . . . . . . . . . . . . . . . . . . . . . . 67
4.8 Network performance across different penetration rates at 25% compliance rate 71
4.9 Network performance across different penetration rates at 50% compliance rate 72
4.10 Network performance across different penetration rates at 75% compliance rate 73
4.11 Average number of halts per trip across penetration rates . . . . . . . . . . . 76
4.12 Average number of halts per trip across compliance rates . . . . . . . . . . . 77
C.1 Wireless Communication: Technology Options . . . . . . . . . . . . . . . . . 101

14

Chapter 1
Introduction
Traffic congestion is a source of significant economic and social costs in urban areas. Ac-
cording to the Urban Mobility Report developed by the Texas Transportation Institute in
2007 (Schrank and Lomax, 2007), the costs of congestion (realised as prolonged travel time
and wasted fuel) in leading US cities has been steadily increasing. In 2007, an estimated
amount of 4.2 billion hours and 2.9 billion gallons of fuel were wasted in the US due totraffic congestion.
Intelligent Transportation Systems (ITS) combine advances in information systems, com-munications, sensors, and advanced modelling and algorithms to improve the performanceof surface transportation. For years ITS have been successful in addressing transportation
problems and improving traffic performance. In the past, ITS applications were limited todeployment of fixed infrastructure based technology such as Variable Message Signs (VMS)which disseminate useful information or traffic guidance and automatic toll collections likeElectronic Road Pricing (ERP) in Singapore (Tuan Seik, 2000). Research in wireless com-
munications has opened a new area of ITS application by making communication betweenvehicles (Vehicle-to-Vehicle/V2V) possible which supports data collection and informationdissemination at individual vehicle level. To model the impact of V2V communication basedapplications, a microscopic traffic simulation model is necessary.
Microscopic traffic simulators have been used as evaluation and planning tools for policies
and initiatives to improve traffic performance (Barcelo, 2010). These simulators includedriving behaviour models that represent interactions between vehicles by simulating drivingdecisions by individual drivers. These behaviour models are sensitive to information pro-vided by fixed infrastructure based ITS applications like VMS and Variable Speed LimitSigns (VSLS). However, ITS applications enabled by wireless V2V communication can pro-

vide important traffic information to vehicles irrespective of the location of VMS or VSLS.To analyse the effects of these applications, the underlying driving behaviour models need
to be modified. This thesis presents a modelling framework for behavioural models that are
sensitive to V2V communication based ITS applications.
The next section provides an overview of V2V communication and examples of applications,followed by a summary of our microsimulation framework. Finally the funding project
Future Urban Mobility (FM) is described and the objectives and organisation of this thesis
are presented.
1.1 V2V Communication
V2V communication, also referred to as inter-vehicle communication, is a communications
technology that allows the vehicles on a network to "talk" to each other. The technologywas first developed and successfully demonstrated for safety purposes by General Motors in2005 (AutomotiveWorld.com, 2005).
1.1.1 Technology
Communication is established through Dedicated Short Range Services (DSRC) devices(ITS Standards Advisory, 2003) installed on individual vehicles which allows high-speedcommunications between vehicles and infrastructure. In October 1999, the Federal Com-munication Committee granted the use of 5.9 GHz frequency with a 75 MHz wide spectrumfor DSRC with a stipulation for priority to public safety uses (Research and InnovativeTechnology Administration, 2003). DSRC devices have a range up to 1000 metres and af-ter accounting for various obstacles in the message transmission, the wireless connectivityrange can be around 300 metres (ITS Standards Advisory, 2003). Thus communication overDSRC enables vehicles to exchange data with other vehicles that are out of the visibility
distance and even line of sight. Vehicles can even "relay" the messages onwards to form amultihop network where the connectivity range can go well beyond the radio range.
1.1.2 Application
The goal of the wireless network of participating vehicles to increase traffic safety is wellsummarised by the vision for V2V as stated by Research and Innovative Technology Ad-ministration (RITA, 2011):

* "Eventually, each vehicle on the roadway will be able to communicate with other vehi-cles and that this rich set of data and communications will support a new generationof active safety applications and safety systems."
Vehicle collectively scout a large area of a road network while making their trips to respec-tive destinations. With robust and reliable sensing technology, individual vehicles can beused as data collectors. This level of physical penetration of the network is not offered byother surveillance technologies which rely on fixed infrastructure. Hence a higher level ofdata collection and sharing can be achieved by enabling wireless connectivity among mov-ing vehicles. This rich set of data and communications can also be leveraged to realiseinformational (non-safety) applications.
Information disseminated over the wireless network connecting vehicles via wireless V2Vcommunication can include valuable information about road congestion, physical conditionof the road, facility locations, etc. As a result, users on this wireless network can poten-tially have information about a broader area of road network. This information could havesignificant effects on driving decisions and improve capacity of the network.
1.1.2.1 Potential Applications
Figure 1.1: 2004 US Crash statistics classified by manner of collision
Source: Carter et al. (2009)

The importance of V2V communication can be accentuated with the help of the crashstatistics depicted in Figure 1.1. It gives the distribution of the 6.2 million crashes reportedin 2004 via NHTSA's General Estimate System (GES). Data for GES is comes from na-tionally representative sample of police reported motor vehicle crashes (National HighwayTraffic Safety Administration, 2011). V2V communication combined with GPS enables a360 degree field of view which covers the "blind spots" in the limited field of view of con-
ventional radars which only cover head-on and angle crashes. Rear-end, head-on, angle andside-swipe collisions, all are relevant to V2V communication amounting to a total of 66% of
annual crashes. Thus, V2V applications can prevent a larger share of accidents amounting
to about 4 million crashes annually. Initially, V2V communication was implemented primar-ily for safety applications (AutomotiveWorld.com, 2005); e.g., the VSC-A project (Carteret al. 2009) developed interoperable crash avoidance applications. Hence the use of V2V in
the traffic safety application is of extreme importance as realised by the automobile manu-
facturers. Because of its immense potential to increase traffic safety, there has been a greatgovernment interest in V2V communication (Shulman and Deering, 2007). IntelliDrive is
an initiative from US DOT to leverage V2V communication for traffic safety (RITA, 2010).
1.1.2.2 IntelliDrive
IntelliDrive is a US Department of Transportation (US DOT) initiative which enables safe,interoperable networked wireless communications among vehicles, the infrastructure, andpassenger's personal communication devices in an attempt to make surface transportation
safer, smarter and greener. The IntelliDrive approach can increase the efficiency of the road-way systems and provide economic and environmental benefits. The IntelliDrive system willcombine technology solutions - advanced roadside infrastructure, wireless communications,advanced vehicle sensors, onboard computer processing, and GPS navigation - to providevehicles the capability to detect threats and hazards on the roadway and to communicatethis to the driver through alerts and warnings.
1.1.2.3 Non-Safety Applications: Green Light Prediction
The potential applications of V2V communication also go beyond safety purposes. For
example, SignalGuru (Koukoumidis, Peh and Martonosi; 2011) is a software service thatuses a collection of mobile phones mounted on the wind-shields of vehicles to detect trafficsignals with the cameras, collaboratively communicate and learn traffic signal schedule pat-terns to predict their future schedule. The application was tested only on 5 vehicles mountedwith iPhones carrying SignalGuru application, travelling around three intersections in Cam-

bridge, MA. Using SignalGuru to generate Green Light Optimal Speed Advisories showed
fuel consumption savings of 20.3%. A larger scale experimentation of this application has
not been carried out. To predict the impact of such an application on traffic performance
would require running various hypothetical scenarios on a simulation framework.
1.2 Simulation approach
As we have seen above there are several opportunities to exploit this technology to mitigate
traffic problems. Since these applications are relatively new and their experimental deploy-
ment in the field is costly, traffic simulation offers a practical way to evaluate the efficiency
and the impact of these technologies. These applications need to be tested under different
scenarios varying across penetration rates, reliability of technology, etc. for a comparative
study of their practicality and benefits.
In case of the deployment of V2V communication, there are two distinctly different systems
interacting with each other:
e The wireless network system comprising mobile nodes capable of telecasting signals
over a wireless network and;
a The transportation network system comprising drivers interacting with each other and
the infrastructure to arrive at desired destination.
Since this technology involves smarter vehicles with communication capabilities, the best
approach would be to simulate the traffic flow and the wireless connectivity at the same time.
These two systems can be modelled separately in a simulation environment. The wireless
network simulators use wave propagation and interference models to compute the strength
and range of the signal transmitted, whereas traffic simulators use behaviour models to
predict vehicle movements. Hence to model V2V communications completely, it is beneficial
to couple these simulators together in a closed feedback loop.
In this coupling scenario, the traffic simulator can receive the state of the wireless network
in terms of the wireless connectivity and data transfer taking place between the vehicle.
To make the driving behaviour models sensitive to the V2V communication technology, we
need to incorporate this dynamic information exchange in our modelling framework. Thus
we modify the behavioural models to reflect the changes brought about by the conveyed
information.

The use of microscopic traffic simulators as evaluation and planning tools has been wellestablished by a number of case studies (Ben-Akiva et al., 2003; Choudhury et al., 2011).Microscopic traffic simulators provide the ability to model driving behaviour and the inter-action between the vehicles at the level of granularity of individual vehicles and individuallanes. One of the approaches to driving behaviour models is based on frameworks thatincorporate different stages of decision-making (Choudhury, 2007). In this model, drivingbehaviour of the user is viewed as a combination of his/her own intentions and his/herresponse to the surroundings based on the perceived information.
In this thesis, we focus on the traffic simulation side of this integrated simulation approach.We extend behaviour models that take into account ITS applications deployed as fixedinfrastructure, to make them sensitive to these new technologies. The improved model canbe linked to a wireless simulator to achieve the desired integration of the simulators.
1.3 Future Urban Mobility Project
This research is conducted as a part of the Future Urban Mobility (FM-IRG) project (Ben-Akiva, 2010). It is an inter-disciplinary research project funded by National Research Foun-dation (NRF), Singapore. The goal of the FM-IRG is to develop, in and beyond Singapore, anew paradigm for the planning, design and operation of future urban mobility systems. Thebasic premise of FM-IRG is that the advances in computing, communications and sensingtechnologies give us powerful capabilities to model, evaluate and optimise urban mobilitysystems.
One of the goals of this project is to leverage the devices on pedestrians, cars, roads, etc. tobuild a network of computation devices to enable better traffic control. These devices areexcellent potential wireless nodes that can track the mobility of their user. The connectionof all these devices over the wireless network forms a mesh network of mobile data collec-tion/dissemination nodes over the road network. The connectivity of these devices can beextended to a server in the cloud via the internet to achieve real-time data exchange amongthe peers partaking in this mesh network of vehicles. The result is accessibility to a verylarge pool of data and its real-time dissemination. One of these applications will be used totest our modelling framework in a case study.

1.4 Objectives
Here we define our objectives for this thesis:
e Develop a modelling framework that is sensitive to changes brought to ITS by the useof wireless communication technology based V2V applications.
a Use this framework to model an application based on wireless V2V communication
and test for its effect on traffic performance.
e Develop behaviour models in a traffic simulator in order to extend to implement the
integration of a wireless and a network simulator in the future.
a Demonstrate the use of micro-simulation models to assess V2V communication based
applications.
1.5 Thesis Outline
This thesis is organised in five chapters including this introductory chapter. Chapter 2
covers a literature review of the existing V2V applications and the approaches to analyse
their impact with the help of microscopic traffic simulation, in some cases along with wireless
network simulation. The various methodologies used to quantify the impacts are detailed.
In Chapter 3 we describe the conceptual framework and model structure. The modelling
framework is generalised to be expanded into an integration approach in the future.
Chapter 4 presents a case study on the Bugis road network in Singapore. In this chapter,we test the modelling framework using a green light prediction application as an example
of the V2V communication based technology.
Finally in Chapter 5, we draw conclusions and discuss the potential for future work.

22

Chapter 2
Literature Review
There has been a recent surge in research activity in the area of V2V communication and its
applications in ITS for safety (Gallagher et al., 2006), route guidance (Weis and Sandweg,2010), energy efficiency (Tsugawa and Kato, 2010), etc . Several different aspects of the useof DSRC technology to establish vehicular ad-hoc networks (VANET) have been explored
in the previous work (Yin et al., 2004; Torrent-Moreno et al., 2004). The literature on theinteraction of wireless network with transportation systems needs to be reviewed to under-stand state-of-the-art practices and gain insights on the potential of the V2V technology toimprove the performance of traffic systems. It is important to understand its applications
and possible approaches to assess their impact with a simulation platform. The literaturereview of these aspects is necessary to understand how the behavioural models need to bechanged to make them sensitive to these changes in the technologies deployed in ITS.
The impact of V2V technology on traffic performance depends on the changes in drivingexperience in response to these technologies. The first step to understand this changeis to understand the type and value of information provided to the user. This accuracyand reliability of information provided to the user via V2V communication depends onthe deployed technology and the connectivity over the wireless network among the users.The information conveyed over the V2V communication can contain any data that can becollected/processed by other vehicles on the wireless network. This information can beleveraged to build a variety of ITS applications addressing different traffic problems. Hencethe potential applications of V2V technology can affect the driving behaviour in differentways.
To assess the effect of V2V communication based ITS applications on traffic performance,we can create a physical experimental setup on a test-bed or conduct the same comparative

analysis on a simulation platform tool. The selection of the approach depends on trade-offs
between the cost of experimentation and the extent of interactions captured.
In order to gain sufficient depth and clarity in the dynamics of this problem, we need to:
e Gain brief understanding of types of V2V applications and their inputs to the trans-
portation system;
e Review physical experimental setups to justify a simulation approach and
a Review simulation studies to gain understanding of the various approaches used for
the assessment of these applications.
In this chapter, we first briefly give an account of different types of applications of V2V
communication. Later we present a review of different studies about the assessment of theseapplications. We begin with a few examples of physical experimentation studies followed by
different approaches to model the wireless networks over a traffic network on a simulation
platform. We develop the section further by detailing some of the integration approaches
used for analysing such systems. We conclude the chapter by drawing motivation from
previous works to identify areas to improve and to build our own methodology framework
for the assessment of the technology.
2.1 Applications
The applications of V2V communication can be broadly categorised as follows:
a Safety related: collision avoidance, cooperative merging, etc.
9 Incident report: dissemination of data regarding accidents on the network or break-
down/ blockage of a link, etc.
e Route Guidance: en-route guidance about the shortest path, route guidance for gas
stations, etc.
e Miscellaneous: green light prediction, parking space availability, etc.

Safety related applications are among the first to be implemented using V2V communica-
tion technology. The basic applications typically include crash-avoidance and co-operative
driving systems. Incident report and route guidance applications (Thiagarajan et al., 2009)
disseminate information that is directly relevant to the driver and his/her immediate de-
cision making process. Miscellaneous applications try to mitigate the problems that affect
the traffic conditions in more indirect way; e.g., finding parking space is a major concern
in urban areas. ParkNet (Mathur et al., 2010) is one such drive-by sensing technology that
has been tested using physical experimentation. In fact research (Shoup, 2007) points out
that the driver spends a significant amount of travel time at the end of the trip in an effort
to find a parking space. The effects of this additional travel time are conspicuously visible
in congested metropolitan areas such as New York City.
The impact assessment for these different types of applications can be done either by di-
rect physical experimentation or simulation studies. In the simulation studies, the wireless
network and the traffic system would be required to be modelled together in an integrated
approach. In the following section we discuss the need for the simulation approach with the
help of an example of physical experimentation. In the later sections we look into the litera-
ture about simulation approaches to gain any insights in the assessment of V2V technology
and its applications.
2.2 Need for simulation approach
The utilisation of wireless communication technology goes beyond the safety measures that
triggered the conceptualisation of V2V connectivity in the first place. ParkNet is one such
example of addressing non-safety problems of transportation systems by using vehicles as
mobile sensors. Other applications also support the view that vehicular wireless networks
can be used to collect and disseminate critical traffic data to users. Physical experimentation
is the direct way of assessing the performance of any technology. It involves deploying the
technology in a controlled or uncontrolled environment; and observing a set of measures of
performance reflecting the impact of the concerned technology. A large scale deployment
of any new technology for experimental purposes comes with high costs in terms of money,time and efforts. Hence costs of the whole experiment needs to be justified by the depth of
the insights gained by physical experimentation.

2.2.1 ParkNet
1- SenSor car driing by
Vacant spotParked car Parked car
Figure 2.1: Ultrasonic sensor fitted on the side of a car detects parked cars and vacantspaces
Source: Mathur et al. (2010)
Mathur et al. (2010) describe a physical experimentation study to test ParkNet, a drive-bysensing technology to collect road-side parking statistics. The key idea of ParkNet is toleverage the mobility of vehicles that regularly comb a city, such as taxicabs. In the absenceof ParkNet this service would be provided by more expensive fixed sensor infrastructure. Thegoal of ParkNet architecture is to reduce the number of sensors needed to offer this service.Each ParkNet vehicle is equipped with a GPS receiver and a passenger-side facing ultrasonicrangefinder to determine parking spot occupancy (Figure 2.1). The data is aggregated at acentral server, which builds a real-time map of parking availability.
A physical experiment was conducted to assess the practicality of this application. About500 miles of road-side parking data was collected by the taxicabs over a period of twomonths and matched against the observed parking data to check for accuracy of the parkingspace reporting. The accuracy of the GPS technology was found to be 95% in terms ofthe parking spots counts accuracy and 90% in terms of occupancy maps accuracy. Thestudy also quantifies the amount of sensors required to provide adequate coverage in a city.The results show that ParkNet technology deployed on city taxicabs can provide adequatecoverage and are more cost-effective by a factor of 10-15 as compared to a network with adedicated sensor at every parking space. The technology restrictions limited this applicationonly to single lane roads and some issues with power sources were also reported.

This study shows the feasibility of developing a technology to use individual vehicles as
sensors and leverage the mobility of the participants that continuously traverse an area to
build and maintain a database of a network. The big contribution of this study was proving
the effectiveness and sufficiency of the regular fleet of taxicabs to generate a vehicle mobility
based service in terms of the parking spots maps. Also the study observed certain drawbacks
of the infrastructure which otherwise possibly would not have been detected on a simulation
model. But the approach suffers from the drawbacks of a physical experimentation. The
experiment had to be carried out in the field which is costly and may not be possible for
every application. A simulation study perhaps, can be used to perform the same analysis
over a broader range of scenarios.
2.2.2 En route connectivity
A similar approach to leverage existing infrastructure for en route connectivity of vehicles
was presented in Bychkovsky et al. (2006). The authors discussed the practicality aspects
of an unplanned in situ 802.11 (Wi-Fi) network service to provide reasonable performance
to network clients moving in cars at vehicular speeds. The goal was to "open up" Wi-Fi
Access Points (AP) in the vicinity of the route and leverage this connectivity to upload data
to the cloud. This approach extends the wireless connectivity from inter-vehicle domain to
the internet.
The study evaluates expected performance of these open Wi-Fi networks for users moving in
automobiles. A measurement study was conducted in and around the Boston metropolitan
area using several cars which logged a total of 290 "drive-hours" collected over 232 different
days over a year. Nine cars, each out-fitted with a cell-phone embedded computer running
the CarTel system software (Hull et al., 2006), collected data about Wi-Fi networks during
the course of their driving. During the course of test run, cars were able to successfully
associate with APs and transfer data at all speeds between 0 to 60 km/hr. The APs
appeared in clusters and the mean inter-arrival duration for these clusters was found to be
about 75 seconds. However frequent power disruptions and flash failures that corrupted the
file-system and extremely time consuming data analysis were observed to be the two biggest
challenges. The median AP coverage was found to be 96 metres with top 10 percentile having
a coverage more than 300 metres. Uni-directional delivery rate of packets was about 90%.
Overall the study was able to establish the promise of in situ wireless connections to upload
the data over the internet.

Based on the observations of this experiment, authors were able to suggest some policiesto give incentives to users and service providers to open their APs in order to exploitthis connectivity in metropolitan areas. Such open Wi-Fi networks can be leveraged for avariety of vehicular applications that can tolerate some intermittent connectivity. The enroute connectivity if achieved can become the basis of several other ITS applications. Theexperimentation was also successful in obtaining the critical parameter values to appraisethe scope for "open Wi-Fi networks" in the future. The approach however was limited toonly nine cars which is a typical restriction of physical experimentation. Transferring thesetup to a simulation model can help run the scenarios with more realistic number of carsaccessing the CarTel system software.
In these applications technology evaluation was conducted by actual physical experiments.To summarise:
e The use of the existing infrastructure in conjunction with the mobile computing de-vices carried by the users on the road was shown to be capable of sustaining thedissemination of key information and making it accessible to participating users.
e Also the experimentation was able to observe certain technical difficulties in the in-frastructure which otherwise may not be detected on a simulation platform.
a However the costs involved in conducting these experiments motivate the need for thesimulation studies.
In the next section we look at some simulation approaches to analyse the feasibility and thebenefits of such systems.
2.3 Simulation approach
In almost all the V2V applications, deploying a prototype and analysing its effects is imprac-tical because of the relatively high costs involved. A realistic penetration rate of technologyto carry out experiments is not feasible to achieve in real life unless technology requiresonly a very simple modification to existing infrastructure. Hence simulation is a betterway of assessing a modern technology like V2V communication. To evaluate their impact,traffic simulations based on an agent-based architecture that also take into account thecommunication between vehicles are needed (Fernandes and Nunes, 2008).

In the following sub-sections, we look into various studies that used simulation approach to
model the wireless network and the traffic network separately followed by studies focussing
on integrated approach.
2.3.1 Wireless network simulation
ElBatt et al. (2006) tested the suitability of DSRC for Cooperative Collision Warning
(CCW) using simulation of wireless network. CCW is a class of vehicular safety applications
where vehicles periodically broadcast short messages for the purposes of driver situational
awareness and warning. The Forward Collision Warning (FCW) application was modelled
using the QualNet (Scalable Network Technologies, 2011) as the simulation tool. QualNet
is a simulation tool that contains detailed 802.lla radio and channel models, including
widely accepted models for wireless propagation and interference. In FCW it was assumed
that each vehicle carries some type of localisation device like GPS in addition to a wireless
communication device using DSRC. Each vehicle periodically broadcasts the information
regarding its current status like location, velocity, etc. The neighbouring vehicles which
receive this information calculate the likelihood of collision based on their own status. The
simulation runs were performed to assess the performance of the application in extreme
vehicle densities and to explore potential broadcast enhancement techniques. The approach
uses QualNet which applies widely accepted wireless propagation models, but the models
governing the vehicle movements in the simulation run are not very clear.
Conceicao et al. (2008) used an integrated approach to simulate large scale V2V environ-
ments. The study makes use of a simulation prototype named DIVERT set up over road
network of the city of Porto. It uses shortest path algorithm to generate random or pre-
defined routes. To capture the inter-vehicle communication, a very simple broadcasting
model, in which vehicles within certain threshold (determined by the transmission radius)
are able to communicate with each other is used. Every "sensor" vehicle in the traffic simu-
lation generates GPS-like messages with its position and speed. The communication layer
in the wireless network simulator transmits this data package according to an algorithm to
other vehicles within the threshold. The simulation runs had 5000 vehicles with 10% pen-
etration rate of the inter-vehicle communication technology. To implement mobility based
navigation, vehicles should have a good knowledge of traffic conditions at a given instant.
Hence, the mobility propagation was used as the metric to test over a spectrum of conser-
vative transmission ranges. With this approach, the authors were able to generate a map
of segments about which more than 50% of the sensor vehicles had traffic information that

was fresher than the last 5 minutes. Though the study provides a good way of measuringthe spread of traffic conditions across a large V2V network, it suffers from drawbacks onthe traffic modelling side. The traffic simulator accounts for only the longitudinal motion.The approach can be improved by integrating the network simulator with a better trafficsimulation model. Also the simplistic propagation model can be extended to include morerigorous models.
2.3.2 Traffic network simulation
# I radio for handshaking# 2 radio for data exchange
Sensor belt
Figure 2.2: Sketch of communication between a car and a sensor belt in NOTICE architec-ture
Source: Rawat et al. (2008)
The wireless network side of the problem is addressed in the above studies. On the otherhand, traffic simulation studies also have been used to assess the performance of inter-vehicle communication. Chiara et al. (2008) defined a Risk Index (RI) to assess the effectsof inter-vehicle communication systems in terms of the risk of longitudinal collisions forvehicles. Aim-sun was used as the traffic simulator platform to analyse a hypotheticalhighway scenario where a vehicle suddenly brakes down. The RI values with the inter-vehicle communication showed significant improvement in the safety with respect to thecurrent scenario without the technology. However the study is limited to single lane scenarioand the improvements shown might be a little too idealistic.

Rawat et al. (2008) describe the NOTICE architecture for vehicular communications anduse a traffic simulation approach to test the challenges in its implementation. NOTICE
is a new concept in VANET that aims at providing automated notification of traffic inci-
dents on the highways in order to reduce congestion and improve overall traffic safety. InV2V communication, vehicles are responsible for forwarding and exchanging information tofellow participants. This makes the system vulnerable to attacks from malevolent traffic
participants. Hence to address these issues, in NOTICE architecture the communicationtakes place through a system of sensor belts embedded in the roadway (Figure 2.2) thatcollect information and provide driver notification in case of highway incidents.
A traffic simulator based on Intelligent Driver Model (IDM) (Abuelela et al., 2008) was usedto evaluate the NOTICE architecture. The incident detection time was used as the metricto test the efficiency of architecture. The simulation analysis showed a U-shaped trend
in detection time with respect to density whereas the incident detection time was shown
to increase as distance between belts increases. The simulation was useful in identifyingpossible belt and traffic densities for a practical implementation of NOTICE architecture.
This study provides a good example of investigating a proposed architecture using the trafficsimulation approach.
Yeo et al. (2010) analysed the impact of V2V communication systems on traffic operations.
The modelling of driving behaviour with V2V communication hazard alert system in incidentsituations on freeways was carried out for a range of traffic operations conditions. TheNGSIM freeway flow algorithm was used to simulate the driving behaviour. This algorithm
is an integrated car-following and lane changing model which also explicitly models "shortgap" where drivers accept very small gaps in the target lane. Lane changing manoeuvres
were classified as mandatory or discretionary depending on the situation.
To model the driver response to an incident, a blockage is introduced in one lane of a
four-lane homogeneous freeway section. In a lane specific scenario, the vehicle involved
in the incident sends a warning message with the location, time and lane of the incident.This message is relayed upstream by equipped vehicles within certain communication range
R (Figure 2.3). Vehicles equipped with V2V receive the information about the incidentwherever they are on the freeway. Drivers of unequipped vehicle have no information aboutthe incident until it comes within their visibility distance. All warned drivers are assumedto be identical in their response to the warning message. Due to lower expected downstream
speeds, larger gaps and slower speeds are generated.
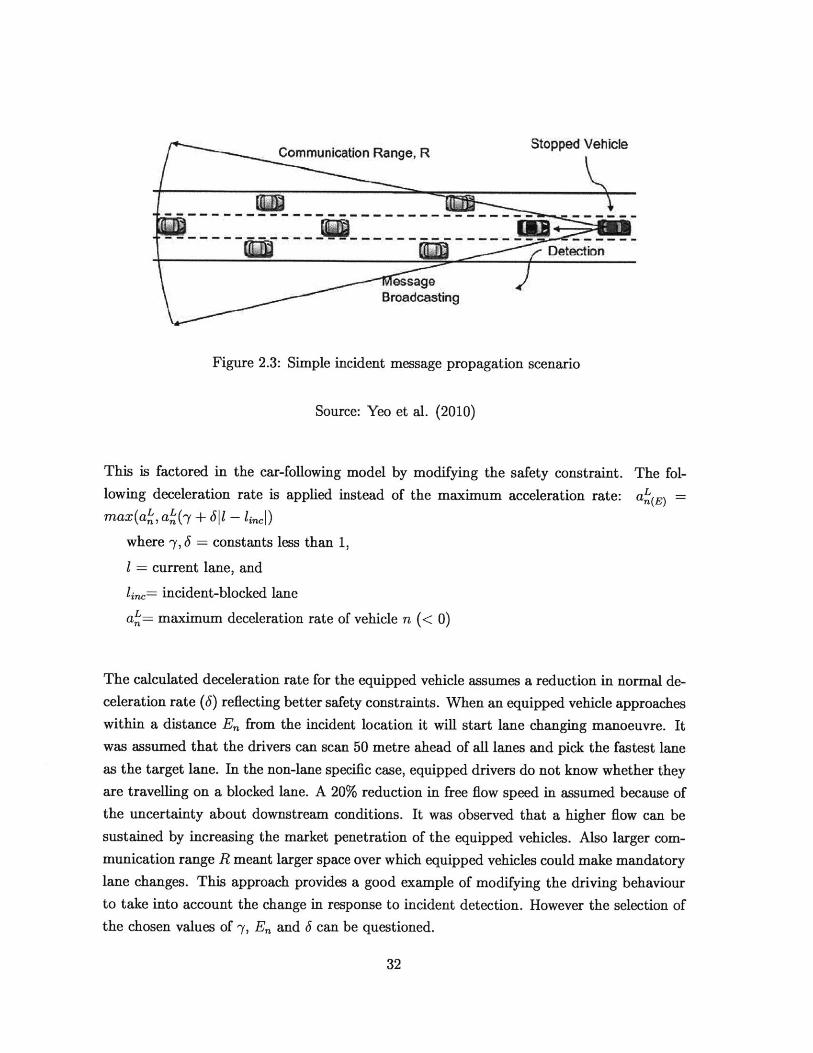
Figure 2.3: Simple incident message propagation scenario
Source: Yeo et al. (2010)
This is factored in the car-following model by modifying the safety constraint. The fol-lowing deceleration rate is applied instead of the maximum acceleration rate: aL(E)max(aL, aL(7 + 611 - linc|)
where y, 6 = constants less than 1,
1 = current lane, and
linc= incident-blocked lane
aL= maximum deceleration rate of vehicle n (< 0)
The calculated deceleration rate for the equipped vehicle assumes a reduction in normal de-celeration rate (6) reflecting better safety constraints. When an equipped vehicle approacheswithin a distance En from the incident location it will start lane changing manoeuvre. Itwas assumed that the drivers can scan 50 metre ahead of all lanes and pick the fastest laneas the target lane. In the non-lane specific case, equipped drivers do not know whether theyare travelling on a blocked lane. A 20% reduction in free flow speed in assumed because ofthe uncertainty about downstream conditions. It was observed that a higher flow can besustained by increasing the market penetration of the equipped vehicles. Also larger com-munication range R meant larger space over which equipped vehicles could make mandatorylane changes. This approach provides a good example of modifying the driving behaviourto take into account the change in response to incident detection. However the selection ofthe chosen values of -y, En and 6 can be questioned.
Wang et al. (2007) explored the benefit of applying simple traffic control strategy at a
merging section in the presence of V2V connectivity. The goal was to promote collision free
ways of effective "proactive" merging for improved throughput. The methodology involved
dissociating the point of merging and point of decision making. Proactive action on the
part of driver leads to more efficient merging manoeuvres. This merging strategy leverages
the information communicated via the V2V technology at the decision point to compute a
proper gap to prepare for merging. The information received includes the position, velocity
and acceleration of competing vehicles. Along the approach to the merging point the vehicle
adjusts its velocity to prepare for actual merging. A microscopic simulator IDM was used to
test this strategy against the priority based, non-proactive merging strategy. The simulation
results show a reduced delay in proactive merging to about only a third of the delay in the
priority merging strategy. Also the throughput in proactive merging strategy is observed to
be higher.
The studies mentioned in this sub-section show the importance of modifying the driving
behaviour models to take into account change in the information provided to driver. The
simulation approaches were able to model the changes in traffic flow while making certain
assumptions about the wireless communication.
2.3.3 Integrated simulation approach
The simulation approach can be extended to include traffic flow side of the problem by
coupling together wireless network simulator and traffic simulator. An integration between
a wireless network simulator with wireless propagation and interference models and a traffic
simulator with vehicle movement models is a more complete way to address the problem.
Kim and Fujimoto (2009) presented a traffic simulation study to explore the effect of an
ATIS architecture using wireless communications. The ATIS application under considera-
tion was Dynamic Route Guidance System (DRGS) which attempts to search for the most
cost effective route for a participating vehicle. An integration approach using an off-the-shelf
microscopic simulation model with a Vehicle Communication Module (VCM) was used. A
simple VISSIM traffic network is utilised across different demands and penetration ratios of
enabled vehicles to evaluate travel time savings of participating vehicles. A simple incident
is generated to trigger the DRGS which helps participating drivers to choose better routes.
Some delay was observed between the incident start and the instant when it starts affect-
ing the travel time estimates by the DRGS. As expected the travel time savings show an
increasing trend as the penetration ratio increases. The integration approach covers bothsides of the problem. However the system suffers from some modelling drawbacks. E.g.the participating vehicles did not opt for the incident hit link even after the incident wasremoved. The travel time estimates are updated by the data collected by probing vehicles.When the vehicles are diverted away from the incident hit link, there is no further datacollected regarding that link. Thus the DRGS does not redistribute the traffic even afterthe incident is removed. A better algorithm for route guidance can improve the impact ofthe technology in reducing congestion.
Bing Mei et al. (2010) use a simulation approach to test the impact of route guidanceinformation disseminated over VANET on traffic performance. Modelling methodologyinvolved two types of networks: a highway network and wireless VANET. When the twonetworks are in operation, highway traffic operations data are simultaneously collected,transmitted and analysed by and among vehicles. To model these networks together Aimsunwas used as a platform for the integrated model. The programming language Python wasused to develop a customised module to interface with Aimsun. Some of the vehicles loadedin the network were assumed to have onboard equipment that can identify the locationof other vehicles, collect operations data and communicate with other similarly "equippedvehicles". These vehicles can receive en route traffic information which can help driversmake decisions to improve their travel plans.
An incident was assumed to have occurred if the ratio of the average instant speed to thetypical speed on the link fell below 0.5. If an incident was detected, an alarm was triggeredwhich is immediately sent via VANET. All directions, single-hop broadcasting was used formessage transmittals to other vehicles within a wireless transmittal range of 250 metres. Inother words, if an equipped vehicle is within this range, it receives this message and thencan forward it onwards. After the message is received it was checked for relevance to thecurrent vehicle path. If deemed relevant, the message was evaluated for the reliability ofthe broadcasted traffic information. A reliability index was generated which reflects thesignificance of each message based on its age, frequency and the degree of atypicality. Ifthis index is greater than a certain threshold, the driver was allowed to act on it. Two typesof response types were modelled: dynamic route diversion (DRD) and variable speed limits(VSL). Normal control is resumed once the incident section is no longer on the vehicle'spath.

Network ~~~~ "~ TrafficSimtor Communication Communa SiSinulator Module Data Modute
exchangeClient Server
Figure 2.4: Coupling of network and traffic simulator
A small portion of the city of Victoria, Spain was used as a test bed. Eight different scenarios
including a baseline scenario were tested.
Source: Eichler et al. (2005)
An incident was created on one of the links which takes 15 minutes to clear up. The results
showed that most messages can propagate to the maximum range within 7 to 8 seconds. The
average number of stops decreased slightly when VSL was deployed. Overall, an increased
market penetration of the V2V vehicles in the fleet showed benefits for both appropriate
incident response and better utilisation of network capacity. However in some cases, penalis-
ing alternative routes with excessive diversions were observed. The key observation to infer
from this study is that the impact of this technology depends significantly on two factors:
reliability of the information and penetration rate of the technology. These effects need not
be intuitive and a simulation case study can provide a useful insight in the effectiveness of
technology.
Eichler et al. (2005) analyse the effects of a real-time V2V warning message distribution
application on road traffic. This paper presents the work on an integrated simulation en-
vironment with three components: Traffic Simulator CARISMA; Network Simulator NS-2;
and an incident warning Application. CARISMA randomly chooses a start and destination
point for every vehicle on the map and the vehicles choose the shortest path for their travel.
It periodically receives the data regarding changes in the vehicle behaviour from the traffic
simulator and sends node positions and connectivity patterns back to the network simulator
(Figure 2.4).
A total of 900 cars of which 400 cars were equipped with wireless technology were used in
the case study over 8 sq km city area. In the simulation one specific vehicle breaks down

at the beginning of a simulation run and starts periodically sending a warning message.V2V equipped cars have the assistance of route guidance which leads them to other routes,while not warned vehicles still drive through the affected zone and possibly get trapped incongestion. Several simulation runs over different vehicle densities and penetration ratesof V2V technology showed significant travel time benefits for V2V enabled cars. The keyobservation from this study was that the loss of these travel time benefits as the numberof informed cars goes up. The broadcast of warning message to a large number of usersdecreases the benefits from alternative routes.
Klunder et al. (2009) discuss the results of a field operational test to test the effect ofadaptive cruise control (ACC) on driving behaviour. ACC is mainly a comfort systemthat manages car-following while the driver remains responsible for steering and collisionavoidance. The study tested the effect of larger penetration rate of ACC on traffic safety,throughput and environment using ITS modeler, a microscopic simulator platform interfacedwith Paramics, a traffic simulator. The implemented cooperative driver models specifiedactive gap creation, active gap searching and adaptation to the speed in the left lane. Themodel also considered the on and off modes of ACC in the cases where the driver desiresa different manoeuvre. The simulation setup included scenarios with different penetrationrates and continuous or interrupted ACC activity. The results from the study showed sig-nificant impact on the traffic throughput in presence of ACC. The effect was observed tobe higher during high congestion. Also the freedom to turn ACC on or off had a nega-tive impact on the throughput while continuous use of ACC showed improvements in thethroughput.
2.3.4 Conclusion
The previous studies suggests that an integrated simulation module does a better job ofassessing the application of V2V technology by capturing the interactions between the wire-less network and the traffic network than individual simulation modules alone. The wirelessnetwork simulator modules used in these case studies follow the established message prop-agation models. However there is room to improve on traffic simulation models in theseapproaches. In the integration of simulators approach, wireless network simulators are ableto simulate the wireless environment based on the technology specifications and vehicletraces. But the driving response is heavily dependent on the content of the informationcarried by messages. Thus driving response and hence the traffic performance can be ex-pected to follow different trends for different applications. Therefore every application needs

to be classified based on the content of the information carried and should be addressed
accordingly in the traffic simulator module. The previous simulation studies show consid-
erable variation in the impact of the V2V technology across different penetration rate of
the technology. Also the effects vary according to the type and content of the informa-
tion disseminated and driver never relies or follows this technology perfectly. Therefore the
reliability and compliance to the technology shall be considered in the traffic simulation
model.
2.4 Summary
To summarise,
" There is a myriad of different possible applications of V2V technology. The benefits
from the additional information communicated between the users are significant.
" We looked at a few examples of physical experiments that were carried out for the
impact assessment. However the experiments are costly and may not be possible for
all the applications.
" Though physical experiments to test the validity of these technologies are not practical,the simulation methodologies have proved to be a good way to predict the impact of
these technologies.
" Integrating the wireless and traffic simulators together is a good way to represent both
sides of the situation.
" Several scenarios across different penetration rates and reliability of the broadcasted
information need to be modelled in the simulation to observe non-intuitive effects the
technology might have on the network performance.
" Also the impact of every technology depends on the type and content of the infor-
mation disseminated. A new simulation approach needs to be defined to analyse
the impact of a new V2V technology application such as the green light predictiontechnology on the overall network performance.
" Hence it is essential to modify the behavioural models to make them sen-
sitive to the deployed V2V application.
In the next chapter, we look at the methodology of our approach to analyse the impact ofV2V technology on traffic performance.

38

Chapter 3
Methodology
This chapter presents a general methodology and framework to evaluate the impact of V2Vcommunication technology on overall network performance. It is necessary to address theimpact of technology on driving response in the traffic simulator module. The proposedmethodology adds a layer to the traffic modelling framework where the effects of V2V basedapplication are translated into behaviour models. The impact can be quantified by severalmeasures like average travel times, number of halts, etc. depending on the applicationbeing tested. Section 3.1 describes the requirements of the simulator platform to be used.Section 3.2 presents the actors and the interactions involved and motivates a discussionabout how they can be modelled. Later in Section 3.3 we discuss how these requirementscan be implemented. We finish the chapter with a brief discussion of how the approachneeds to vary to model any V2V application in the future.
3.1 Requirements
In the previous chapter, we noted that integration of a traffic simulator and wireless net-work simulator is a better way to approach modelling the impact of wireless based V2Vtechnologies on traffic performance. Wireless networks can be simulated over off-the-shelfsimulators like ns-3 which utilise widely accepted wave propagation and interference models.The selection of the traffic simulator, however, depends on the requirements of simulationexperiments.
e The exchange of messages over wireless network occurs between individual vehicles.This message exchange over wireless networks is modelled by the wireless networksimulator. The underlying models in these simulators take into account the relativeposition and relative speed of the "mobile" wireless nodes to simulate the data ex-

change. In the case of wireless technology based V2V communication these nodes are
the individual vehicles. Hence it is essential for the traffic simulator to keep
track of the movements of the individual vehicles.
" The wireless data exchange is dynamic and has a different impact on the movements of
different vehicles. The dynamic interaction between the vehicles requires modelling of
the responses from the driver to the information received. The traffic simulator needs
to model the manoeuvres of the driver on the road along with its interactions with
other vehicles in the surroundings. Microscopic behaviour models are required
to simulate the driving response at this level.
" The driving response as modelled by the microscopic behaviour models is a combina-
tion of various manoeuvres like acceleration/deceleration, lane-changing, merging, etc.
The road network needs to be represented at the level of individual links, lanes, inter-
sections, traffic lights, etc. to accommodate the details of road geometry as required
by the behaviour models.

3.2 Framework Design
3.2.1 Actors and interactions
Figure 3.1: Driver - Wireless Network interaction
To model the impact of V2V technologies on traffic performance correctly, we need to make
a clear distinction between the technological aspects of application and the information
conveyed to driver. The wireless technology creates the "connections" between vehicles
which can be used for data gathering and information dissemination. The content and
extent of the information conveyed to the driver is the outcome of this technology and is the
component that actually changes the way a driver responds. Hence the change in driving
manoeuvres occurs as a response to the information conveyed by the technology (dotted
rectangle in Figure 3.1). However the dynamics of data sharing among participating users
and how information is disseminated on a larger scale is modelled in a wireless network
simulator like ns-3. The traffic modelling part of the simulation is only concerned about the
type and content of the information shared.

The drivers on the road network and the wireless network connecting the vehicles are the twomain actors in this process. The interactions between them have been depicted in Figure 3.1.The drivers in the simulation run follow behaviour models in the microscopic traffic simulatorlike MITSIMLab. The interactions of individual drivers generates vehicle trajectories andtraffic flow. Individual vehicle movements, speeds and trajectories are given as input to thewireless network simulator like ns-3. The wireless network simulator uses wave propagation
and interference models to calculate wireless connectivity between the mobile nodes. TheV2V application uses this as one of the inputs and generates information pertaining to theunderlying algorithm of the application. Which users receive this information is calculatedby a wireless connectivity pattern generated from outputs of the wireless network simulator.To complete the loop, the traffic simulator receives information from the V2V applicationwhich is made available to certain users. This information affects the driving behaviour andthe behaviour models in the traffic simulator need to be modified to be sensitive to thisinformation.
The traffic information received by the vehicles is perceived by the driver and helps him/herdetermine his/her next manoeuvre. The traffic information received over the wireless V2Vnetwork is used as an input to the microscopic traffic simulator like MITSIMLab. Themodels implemented in MITSIMLab describe both the longitudinal and lateral movementsof the vehicles.
Longitudinal movement:
Car-following models:
Car-following models define how the vehicles in the simulation world move in the longitu-dinal direction. Acceleration and current speed are the key parameters calculated at eachupdate time-step. The models take in to account parameters like relative speed and relativedistance which are dependent on their surroundings. The acceleration regime generated foreach vehicle is thus sensitive to changes in its immediate surroundings. Hence the infor-mation made accessible via V2V communication can alter the urgency in the longitudinalmovements of the vehicle. e.g. a change in the perception of downstream traffic conditionsmay cause the driver to deviate from the usual regime and accelerate or decelerate.
This can be explained better by the following example. In a free flowing regime, the acceler-ation of the vehicle at the next time step is given by a,(t) = A [VdeMired(t) - V(t--r)] +Vn(t)
where

t : time instant
-: reaction time of the driver of vehicle n
A: parameter
v: error term
Thus the acceleration of the vehicle in the free flowing regime depends on the desired speed
of the vehicle. The desired speed depends on a number of factors that affect the perception
of the driver. If the V2V communication application increases the desired speed Vesired of
the vehicle by AV then the acceleration at the next time step increases by a quantity of
AAV. This is one example of the ways in which the behaviour models are made sensitive
to the information disseminated over V2V communication.
Lateral movement:
Lane change models:
The lateral movement of the vehicle is governed by the lane changing models. The lane
changing manoeuvres are further classified as mandatory or discretionary. Mandatory lane
changes are usually performed when it is necessary to follow the desired path or to avoid
lane closure. The discretionary lane changes can be undertaken to achieve the desired speed,avoid slow vehicles or to avoid the merging traffic. Thus the lane changes are sensitive to
any changes in the path selection, desired speed, traffic congestion, etc. If the "intention"
to perform a lane change is communicated in advance to the other vehicles in the vicinity,a cooperative lane change can be executed by the driver. The lane change model would be
required to incorporate this change in the driving behaviour.
For example, the lane changing manoeuvre involves selection of a target lane as the first
step. This selection is based on the random utility terms of the lanes available in the choice
set. The total utility of lane i to driver n at time step t is given by (Choudhury 2002):
where Vin is the systematic component of the utility term and e1 is the random term.
The systematic utilities are expressed as: V = #TLXIft + afTL
where Xj is a vector of explanatory variables that affect the utility of the lane i, and
#TL is the corresponding vector of parameters. eJL is the random term associated with
target lane utilities with aTL being the parameter of the individual specific latent variable
vn.
One of the explanatory variables in the vector XIJj is the remaining distance to the pointat which the lane change must be completed. If the information received over V2V com-munication application changes the location of this point, it affects the systematic utilitypart of the target lane. In other words, an application based on V2V communication thatconveys route guidance advisories to the driver will affect the "urgency" of the driver tomake the lane change. Thus lane changing behaviour is changed by linking this variable tothe advisories the application.
Gap acceptance models:
The gap acceptance models decide if the gap observed in the nearby lane is good enough fora lane change. This decision depends on several factors like the length of the gap, relativespeed, the number of gaps already rejected, urgency of the lane change (reflected by theremaining distance to a mandatory lane change), traffic conditions, etc. The critical lengthof an acceptable gap can be reduced if the cooperative lane change is performed as describedin the previous paragraph. Thus the threshold gap length will change significantly in thegap acceptance model.
These sets of behavioural models govern the entire movement of the simulated vehicles.These movements are sensitive to their traffic surroundings and the information received/perceivedby the driver. The position, speed and acceleration of each vehicle is then used as the in-put to the wireless network simulator as shown in Figure 3.1. This completes the loop ofinteractions between the actors in our framework.
We propose the following modelling framework for the driving response to this conveyedinformation.
3.2.2 Driving Response
The proposed modelling framework is shown in Figure 3.2. The simulation of the wirelessnetwork and message propagation is assumed to happen outside our framework (shownin dashed rectangle in Figure 3.2). A wireless network simulator like ns-3 reads in thetrajectories and speeds of the individual vehicles as the input and generates the wirelessconnectivity and information dissemination patterns among the vehicles.
Our framework expects additional information parameters like the wireless connectivityand reliability of the message from the wireless network as an input. To act as a proxy
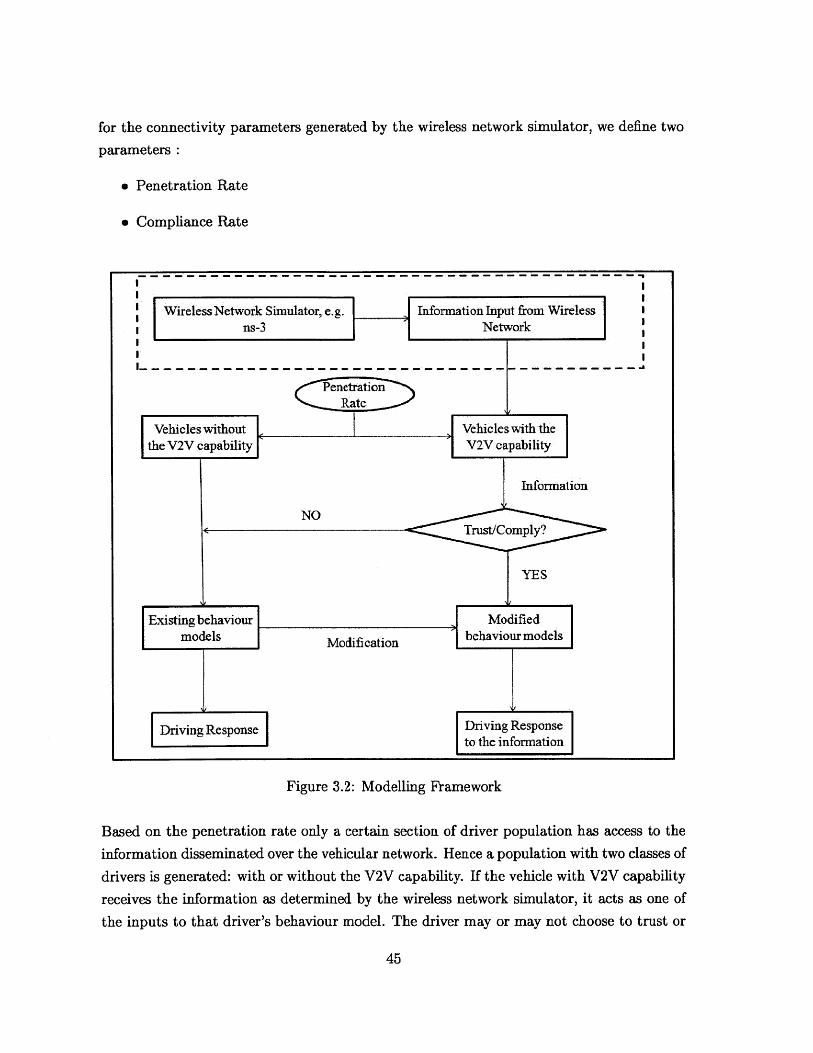
for the connectivity parameters generated by the wireless network simulator, we define two
parameters :
" Penetration Rate
" Compliance Rate
I IWireless Network Simulator, e.g. Information Input from Wireless
ns-3 Network
I.-- ----------------------------- -------------. 1
Figure 3.2: Modelling Framework
Based on the penetration rate only a certain section of driver population has access to the
information disseminated over the vehicular network. Hence a population with two classes of
drivers is generated: with or without the V2V capability. If the vehicle with V2V capability
receives the information as determined by the wireless network simulator, it acts as one of
the inputs to that driver's behaviour model. The driver may or may not choose to trust or

comply with the information provided to him/her. These parameters could be used to buildthe linkage between the wireless network simulator and the traffic simulator for extendingthe proposed framework in the future.
According to the framework, vehicles without V2V capability follow existing behaviourmodels. The V2V enabled drivers, who do not receive traffic information or who choosenot to trust or comply with the provided traffic information, also follow the same behaviourmodels. The behaviour models for drivers who receive the traffic information and whochoose to trust and comply with it are altered. The modification of the models depends onthe application of the technology being tested. The different behaviour models mark thedifference between the two different classes of drivers.
To assess the impact of the V2V based application, the metrics shall be defined to reflect thegoal of the technology. Such metrics may be average speeds, travel time savings, networkcapacity, etc. E.g. if the impact of the technology needs to be assessed in terms of thenetwork performance in terms of the throughput, network capacity shall be used as oneof the metrics. Rapolu (2010) defined network capacity (Appendix D) in terms of vehicle-km travelled per hour to assess the impacts of interventions on the network performance.Also the V2V communication technology is not yet deployed at a practical scale. Since thepenetration rate of the technology in the future is unknown, it is interesting to analyse theimpact of the technology over a spectrum of penetration rates.
3.3 Implementation
3.3.1 Traffic Simulator
A microscopic traffic simulator needs to be utilised to represent the traffic side of the simu-lation. MITSIMLab is one such microscopic traffic simulator tool that has been tested andapplied successfully in several cities around the world. MITSIMLab (Yang and Koutsopou-los, 1996) is a simulation-based laboratory that was developed for evaluating the impactsof alternative traffic management system designs at the operational level and assisting insubsequent refinement. The overall structure and components of MITSIMLab have beendescribed in Appendix A. The key modules of MITSIMLab are:
" MITSIM, the traffic simulator and
" TMS, the traffic management simulator

Figure 3.3: MITSIM-Traffic Management System Integration
The traffic simulator module, MITSIM contains all the driving behaviour models whichgovern the manoeuvres and responses of the drivers during the simulation. The traffic man-agement simulator, TMS works on the logic and algorithms of the signalling and surveillancesystems on the network. Hence during a simulation run, these two modules run simultane-ously while providing inputs to each other in a closed loop formation (Figure 3.3).
The traffic management center, TMS may respond to the traffic conditions by alteringthe traffic signal timings or changing the speed limits conveyed via variable message signs(VMS). This information acts as an input to the behaviour models in MITSIM (as shown inFigure 3.3). Hence the dynamics of the traffic movements are captured by the behavioural
models in response to the traffic surroundings and the control and routing devices.
3.3.2 Data needs
The underlying behaviour models in MITSIM have been successfully demonstrated to reflectbetter the real life conditions on the road in a simulation environment. The models are
able to describe both the longitudinal and lateral movements of the vehicles by modellingthe decision making process of the driver in response to the traffic conditions. First thebehaviour models need to be calibrated and validated against the on-field data for thenetwork under the study. The data required for these purposes can be detailed trajectorydata or aggregate counts/speeds data from the sensors on the road network. Also thedetailed geometry of road network along with sensor and traffic light positions is required
to build the network model in the simulator.
The data required to represent the V2V technology components may vary from applicationto application.

3.4 Summary
This chapter presented a general methodology and framework to assess the V2V technologyon the network performance using a microscopic traffic simulator. The methodology frame-
work expects parameters like the V2V capability and reliability to passed from a wireless
network simulator. We defined two parameters to act as a proxy for the inputs from thewireless network simulator. Our framework assumes that the goal of the V2V communica-
tion system is to reduce the congestion delays and increase network throughput. Thus theimpact can be measured by the change in the network capacity or reduction in travel times.
An aggregate calibration and validation method is described in the appendix (AppendixB). The model is calibrated for some key parameters in the behaviour models and validatedagainst the on-field data. The calibrated model is used to assess the impact of an application
of this technology over a range of penetration rates of the technology.
In the next chapter, we look at the application of this framework to a sub-network in
Singapore.

Chapter 4
Case Study: Bugis Road Network,Singapore
The previous chapter described the overall modelling framework for analysis of the impact
of V2V communication based applications on driving response and the resultant overall
network performance. In this chapter, a real road network with complex traffic flow patterns
has been used to assess the impact of the green light traffic prediction technology on the
performance of the overall network. A network near Bugis MRT station on the East West
Line of Singapore MRT has been used for this purpose. MITSIMLab has been used as the
micro-scopic traffic simulation tool to perform the analysis. The behaviour models have
been modified to account for the effects of speed advisories generated by the green light
prediction application on driving response. The chapter is organised as follows: Section 4.1
describes green light prediction application as V2V based technology to be tested in the
case study and explains the methodology behind it. We develop requirements to build the
framework to model this application. We follow it by laying out our approach to model the
green light prediction application in Section 4.2. In Section 4.3 we present an application
of our framework in a simulation case study on a road network in Singapore. Finally in
Section 4.4 we summarise the findings and observations from the case study.
4.1 Green light prediction application
The increased prevalence of personal devices, such as smart phones, tablets which include
computational power, wireless connectivity, and multiple sensors opens up new avenues of
research and development. Computing and communication devices on mobile users can
provide richer pool of information about the state of the network to participating users

and system managers. Every user with such a device is a potential data collector andinformation provider. All these mobile devices when coupled with a resilient internet cloudcan provide real-time information in a consistent and comprehensive manner. As part ofthe research under FM-IRG (Ben-Akiva, 2010), work is being done to build a framework tofacilitate creation and evolution of such vehicular ad-hoc networks (VANET). This networkcan support technologies that enhance traffic and transit management, transportation andplanning, emergency management, etc. The green light prediction application software,SignalGuru (Koukoumidis, Peh and Martonosi; 2011) is one such application.
4.1.1 Goal of the application
Most of the delays in travel time are experienced at the intersections. The deceleration toa come to complete halt at a red light and the subsequent acceleration by every vehicle inthe queue when the light turns green are the two major points where the travel time delayspile up. Hence, the goal of the technology is to reduce this delay caused by traffic lights.With the help of traffic light prediction, the users try to avoid stopping at the downstreamtraffic light.
4.1.2 Data collection and prediction
Server inthe cloud
-Phase of trafficlightdownistream-Time till the next end o Trafficlight lDgreen Signal state*Timetillthenext limestampbeginningof green
cars
dist
Figure 4.1: Schematic of green light prediction
The application is designed to run on a smart-phone device like an iPhone. The participatingusers with this application can mount their iPhone behind the wind-shield while driving.As the vehicle moves along its course, the iPhone device keeps on taking pictures at regularintervals. The application uses an image recognition technology to identify the traffic lights
encountered in the field of view (Figure 4.1) and associate it with an ID of the corresponding
traffic light and time instant. Thus the application builds up a database of time-stamped
array of phases of traffic lights encountered over the vehicle's route in the network.
The signal phase observed at that traffic light at that moment is associated with a time-
stamp. This traffic light ID-signal state-time stamp combination is registered as a data point
(i, s, t) in the database. This chunk of data can be shared with other iPhone users with this
application within the wireless range and can be uploaded to the server in the cloud via
internet. Thus the database on the common server is continuously enriched with such data
points. Using these data points the application implements an algorithm to "decode" the
phases of every traffic light in the network coverage. The algorithm reverse engineers the
phase cycles of the traffic light to come with the predictions of the following key parameters:
e Current phase of the traffic light
e Time till the end of the current/next green phase
e Time till the beginning of the next green phase
This information along with the distance of the vehicle from a downstream traffic light can be
made available to users of the application which are still connected to the wireless network.
The application on iPhone uses these variables to predict the time of arrival of the vehicle
at the downstream traffic light and generates speed advisories within safety constraints to
avoid a stop at that traffic light. The user may or may not choose to follow these advisories
based on a number of factors. The drivers are different in personalities, approach to driving
(safe/risky), faith in the technology, familiarity with the network, etc. Thus population of
drivers is heterogeneous with respect to their compliance to the advisories generated by the
application. The longitudinal movement of the vehicle will change only if the driver chooses
to follow the speed advisories.
To summarise, the application uses its subscribers as the data collectors and offers them
speed advisories to avoid the stops at traffic lights. Thus the driver with this application
is more informed with respect to drivers without this application who will show relatively
myopic behaviour. Hence the driving behaviours of these two classes of drivers will differ.
In the following section, we lay out our framework to incorporate the green light prediction
application in behaviour models.

4.2 Modelling framework for the green light prediction
application
We modify the way a driver reacts to the received information by adding another layerto the model (Figure 3.2) that governs the response to the traffic signal. In our modelwe strictly restrict ourselves to the way a driver reacts to the information. We assumethat the information about speed advisories is received by the driver through the wirelesscommunication. Based on this assumption we then develop our model to reflect the drivingresponse to the green light prediction application. A V2V-penetration parameter is definedto generate the population of drivers based on the penetration rate of technology for thesimulation run. A compliance dummy variable is also defined to account for the reliabilityof speed advisories and compliance of the driver. To simulate the complete picture of thetechnology the traffic simulator shall be coupled with a wireless network simulator. Thiscoupling of simulators is beyond our scope at this point of writing this document. Hencefor the sake of simplicity the exact model governing the wireless message exchange is keptexogenous to the model described here. However we develop our model so that it canintegrate with a wireless network simulator for future work.
To model driver's response to this information, we assume a steady state where the serverin the cloud has gathered enough data points to make accurate predictions about all thetraffic lights in the simulation for the entire duration of the simulation run. The informationis reliable and is conveyed to every participating user on time whenever he/she is withina threshold distance from the downstream traffic light. It is advised to keep in mind thatthe speed advisories may not be generated with sufficient reliability if there are not enoughvehicles with this application scouting the network. Also the wireless connectivity of thevehicle will define if the vehicle receives the advisories or not. In the absence of the couplingwith the wireless network simulator the reliability issue is represented by a compliance factorthat will be described later in this section.
The schematic of information relay is shown in Figure 4.1. The iPhone in the car passingby a traffic light takes a picture of the traffic signal light and relays that information tothe server in the cloud. The server adds this information as another data point for thatparticular traffic light. The server uses the green light prediction algorithm to calculatethe current phase of that traffic light. The information about the phase of the traffic lightdownstream is conveyed to the participating user at a distance dist upstream (Figure 4.1).This distance is usually much larger than the physical visibility distance of the particular

traffic light.
Thus the application knows the amount of green time left at that traffic signal downstream,greenleft, and the time left till the beginning of the next green phase, greenbeg (Figure
4.3). Based on these two variables and distance from the traffic light, one of the following
things is performed by the application.
e If the manoeuvre at the current speed is sufficient enough to reach the intersection
during the green time, the desired speed is left unchanged. If the current manoeuvre is
estimated to lead to a red light downstream, the application first tests for the possibil-
ity of an accelerated manoeuvre within safety constraints to arrive at the intersection
before the light turns red.
e If such a manoeuvre is not possible, the application suggests a slowing down approach
to arrive at the intersection during the next green light phase. Thus appropriate
advisories are generated to alter the desired speed so as to reach the intersection
either before the the end of the current green cycle or after the beginning of the next
green cycle.
The generated advisories take into account the speed limits and maximum acceleration for
the vehicle type.
The compliance to the generated advisories will depend on the personality of the user
and the perceived reliability of the information. Hence, a compliance rate is defined to
incorporate the differences in the willingness to follow the advisories among the population.
If the compliance dummy is zero, the user ignores the advisories and adheres to the driving
behaviour in typical conditions. This compliance rate can be later used to communicate
the reliability of the message received from the communication module in an integrated
approach.

4.2.1 Driving Response
V2V enabled user Myopic user
Figure 4.2: Lane change by the V2V enabled driver to pass the myopic driver
The driving behaviour is governed by two types of models: car-following and lane changing.The car following model describes the longitudinal movement whereas the lane changingmodel reflects the lateral movement decisions made by the driver. The car following model isinfluenced by several factors such as headway between the cars, desired speed, aggressivenessof the driver, etc. The lane changing decisions are affected by the density and averagespeed in the neighbouring and current lanes as well as the perceived utility of a lane tomake certain manoeuvres. The added information received from the green light predictiontechnology changes the urgency of the longitudinal movement. Since the goal of the driveris to reach the intersection during a green cycle, the only affected variable is the desiredspeed and hence the desired acceleration. This intent to accelerate, however is limited inaction by the surrounding vehicles. If the leading vehicle has a different desired speed lessthan the concerned vehicle, the vehicle may choose to perform a lateral movement accordingto the lane changing models (Figure 4.2).
Hence the change occurs in the car following model to reflect the driver response to greentime prediction. The response to the green light prediction advisory is calculated based onthe compliance of the user in terms of the acceleration required to reach the intersectionduring a green cycle. Since this information might not be available to all the users, otherusers in the simulation may be myopic in their behaviour. These myopic drivers follow theregular car following model and become aware of the traffic signal only when within itsvisibility distance. Thus these myopic drivers act as hurdles to the informed drivers andkeep them from enjoying complete benefits of the technology. However we can expect thebenefits of this technology to be prominent at higher penetration rates of the technology.
The behaviour model in response to this green light prediction is shown in the flow-chart(Figure 4.3). In our behaviour model, the users are differentiated based according to the

possession of such a device with the green light prediction application. The users withoutsuch capability are unaware of the phase of the traffic light downstream and hence do not
respond to it until it comes within the physical visibility distance for that traffic light. These
users follow the usual car-following behaviour in response to the traffic light.

Figure 4.3: Driver response to green light prediction flow-chart

When the users with the green light prediction capability are at a distance dist from the
traffic light, they receive the prediction parameters for that traffic light. The model first
decides if the current state of the traffic light is green or red. If the current state is green
(i.e. greenend < greenbeg), the model checks for the possibility of reaching the intersection
by the end of the current green light while staying within the speed limit. If this is possible,the desired speed is set at the speed limit. Otherwise the desired speed drops down to
the speedbeg so as to arrive at the intersection at the beginning of the next green. If the
current state is red or yellow (i.e. greenend > greenbeg), the model checks if the manoeuvre
required to reach at the beginning of the next green cycle is possible within the speed limit.
If this is possible, the desired speed is set at speedbeg so as to arrive at the beginning of
the next green cycle. Otherwise, the desired speed is set at speedend so as to arrive at the
intersection by the end of the next green cycle.
In both of these cases, the accelerations calculated are bound by the maximum acceleration
possible for that particular vehicle. This acc.reqd reflects the driver's response to the advi-
sory. The driver's response is initiated only if he/she decides to comply with the advisory.
Since not all the vehicles in the model have the green light prediction capability, some vehi-
cles are "myopic" with respect to the traffic light. The interaction between these two types
of vehicles is then governed by the conventional car-following models in MITSIMLab.
Measures of Effectiveness
The goal of the technology is to make the driver aware of signal timings of a traffic light
downstream and suggest speed advisories to reduce the number of halts at the intersection.
Hence to quantify the impact of the technology, we define MOEs which reflect the savings
in travel times and the smoothness of the uninterrupted traffic flow. For the purpose of the
case study we use the following MOEs:
1. Average speed: The mean of average speeds of every vehicle in the simulation run.
2. Average travel time: The mean of the time required to complete each trip in the
simulation run. A complete trip is defined as an instance of a vehicle successfully
reaching its destination.
3. Average number of halts: The mean number of halts encountered by each vehicle per
trip. A halt is defined as the instance when the instantaneous speed of the vehicle
falls below a preset minimum threshold speed.

4.3 Application of the framework in a Case Study
4.3.1 Dataset Description
4.3.1.1 Study Area
Figure 4.4: Bugis Network
Source: Google Maps
The chosen study dataset is from the traffic data around the Bugis MRT in Singapore (Figure4.4). Bugis MRT is a major station on the East West line of the Singapore MRT. The roadnetwork around the MRT sees busy traffic because of the connectivity to many shoppingmalls and several other busy parts of the city like Bugis Village and Bugis Junction. Thislocation was chosen as the network to deploy pilot applications of the green light predictiontechnology because of the complex traffic flows during the peak periods. The networkconsidered in this study consists of all major urban roads around this MRT station.

The road network modelled in MITSIMLab is shown by red lines in Figure 4.4. The network
file in MITSIMLab consists of 44 nodes, 56 links and 31 signal heads. The signal traffic
controllers used in this are pre-timed controllers.
4.3.1.2 Dataset Overview
Data collected from the loop detectors in the study area was used to derive the counts data.
The counts data for a total of 22 loop detectors covering the Bugis network was obtained.
The dataset in its original form records the number of vehicles passing a certain lane at a
granularity of about a couple of minutes. For consistency among the data collected from all
the loop detectors, the counts data was aggregated over 15 minute intervals. The data was
available for 90 minutes of morning peak period over 10 days in the month of June 2010.
Hence the processed data contains vehicle counts data for six 15 minute intervals for each
of the ten days. The counts data was used to generate OD matrices for the whole network
which are used as the demand files for the simulation runs. Figure 4.5 shows the locations
of the loop detectors on the network.

Figure 4.5: Location of loop detectors on the Bugis Network
Source: Map - Google Maps, Sensor Locations - Land Transportation Authority, Singapore
60

Sensor ID Average Counts1 1642 3643 2884 13385 686 8857 2608 2429 90810 41911 5312 26613 14714 11215 12816 1217 7718 16119 32620 21021 30722 132
Table 4.1: Statistics of Count Data
The sensors in the network are located on both sides of the road. Overall there are 22 loop
detectors, each of which records counts at different locations in the network. The statistics
for average counts over a fifteen minute interval are presented in Table 4.1.
4.3.2 Aggregate Calibration
Aggregate calibration of the model has been formulated as an optimisation problem which
seeks to minimise the deviation of the simulated traffic measurements from the observed
measurements. The optimisation process has been performed using MATLAB following
Box's complex algorithm (Box, 1965). The details of the calibration methodology have
been discussed in B.
Calibration of all the parameters in the behavioural models of MITSIMLab is too costly.
Based on previous experience, the following parameters have been selected for calibration:
e Car-following parameters:

- Acceleration constant
- Deceleration constant
" Desired Speed
- Mean
- Standard Deviation
" Critical Gaps
- Lead gap constant
- Lead gap standard deviation
- Lag gap constant
- Lag gap standard deviation
" Lane Utility model
- Current Lane constant
- Right-most lane constant
Parameter Initial Value Calibrated Value]Acceleration constant 0.0916 0.0730Deceleration constant -0.0278 -0.0259Desired Speed Mean 0.100 0.260
Desired Speed Standard Deviation 0.166 0.154Lead Gap Constant 2.6241 3.5255
Lead Gap Standard Deviation 0.5961 0.7592Lag Gap Constant -0.4693 0.0410
Lag Gap Standard Deviation 4.8637 1.3309Current Lane constant 3.7063 3.9443
Right-most Lane constant -0.5631 -0.3213
Table 4.2: Calibration Results
The calibration process is carried out to match the model to observed counts data as closelyas possible. Table 4.2 shows the initial and calibrated values of the parameters:

RMSPE 0.798MPE -97.74
Table 4.3: Validation Results - Measures of effectiveness for counts
To test the goodness of fit of our calibrated model, we validated the model against the count
data from another 3 weekdays of data for the same network. The results of the validation
process are tabulated in Table 4.3. The results of the validation can be improved with
additional data like speeds or trajectory data to calibrate our model.
4.3.3 Base-line Scenario
The base-line scenario reflects the current situation without the use of green light prediction
application. To simulate the baseline scenario, the penetration rate of the application in our
model is kept at zero. Since the expected benefits from the green light prediction are the
travel time savings achieved by avoiding the delays at the red light, the average speed can
be used as proxy to represent the network performance. This value along with the average
number of halts per trip for the vehicles during the simulation run are used as the datum
bar against which different V2V scenarios can be assessed. The base-line average speed
depends on a number of factors like the network configuration, incidents, etc. To account
for the stochasticity of the underlying models, the simulation is run 8 times to calculate
the average values. The network is assumed to reach its base-line capacity without any
deployment of the V2V technology when the spill-back queues start to form at the entry
nodes at the critical OD matrix scaling factor (Appendix D). The critical scaling factor is
used to run simulations to reflect maximum travel demand on the network.
For the Bugis network, the average speed in the base-line scenario was found to be 11.64km/hour. In the next section, we look at the network performance analysis under different
penetration rates of the V2V technology.
4.3.4 Scenario Analysis
Since the technology under consideration has never been deployed, we do not have any
previous experience and ideas about the level of acceptance or penetration of the technology.
Hence for a complete assessment of the impact of the technology, we define several different
scenarios across three parameters:
e Penetration rate: fraction of driver population with green light prediction application

e Compliance rate: fraction of total advisories followed by drivers
* Travel Demand level: One-third of existing demand, Two-third of existing demand,Existing demand, Maximum demand; where Maximum demand is the travel demand
served by the network at it capacity (Appendix D).
In the following sub-sections, we see the variation in the impact of the technology acrossdifferent penetration rates at different travel demand levels. Then we go on to see thevariation in the impact across different compliance rates to the technology. The average
speed, travel time savings and the average number of halts per trip during the simulationruns has been used as the measure to assess the impact of the technology across thesescenarios. To take into account stochasticity of the underlying models in MITSIMLab, forevery scenario simulations were run 8 times. The average MOEs across the 8 simulation
runs are reported in the following section.
4.3.4.1 Average Speed
We use average speed as a proxy to measure any travel time savings that can be realised bythe green light prediction application. We calculate the average speed for simulation runsacross different penetration rate, compliance rate and travel demand levels.
Penetration Rate
In this test, we observe the variation of traffic performance across different penetration
rates of green light prediction application. The changes in the penetration rates are re-flected in MITSIMLab model by the parameter V2V penetration. For example, when theV2Vpenetration is set at 0.80, 80% of the vehicles entering the simulation have the V2Vcapability. Hence these vehicles have pre-knowledge of state of the downstream signal andremaining green time. These vehicles alter their manoeuvres to try to comply with speedadvisories The rest of the 20% population of vehicles follows the regular car-following be-haviour.
As the penetration rate of application increases informed behaviour can be expected froma larger portion of the users. In the extreme case of 100% penetration, the scenario shall
turn in to a collaborative driving case where the manoeuvres by all the users act towards acommon goal. Hence we can expect a gradual improvement as the penetration rate increases.

Penetration Rate Average Speed (km/hr) Percentage change in
I _average speed
Base-line 15.48 00.1 15.67 1.230.2 15.80 2.070.3 15.85 2.390.4 15.86 2.450.5 16.05 3.680.6 16.06 3.750.7 16.07 3.810.8 16.32 5.430.9 16.36 5.681.0 16.42 6.07
Table 4.4: Networktravel demand
performance across different penetration rates at One-third of existing
Table 4.4 shows the impact of the different penetration rates on the traffic performance
measured in terms of average speed at One-third of existing travel demand.
The variation in the average speed across the range of penetration rate suggest a gradual
improvement in the average speeds over the whole network. The model predicts a significant
increase of 6.07% in the average speed at the complete penetration of the technology. As
more number of people on the road start using the application, the flexibility to leverage the
information increases. At low penetration levels the myopic behaviour by the uninformed
drivers acts as a constraint to the movement of informed drivers. Hence as the penetration
rate increases more travel time savings benefits can be realised as a result of informed
manoeuvres by most of the drivers.

Penetration Rate Average Speed (km/hr) Percentage change inthe average speed
Base-line 14.01 00.1 14.09 0.570.2 14.13 0.860.3 14.16 1.070.4 14.16 1.070.5 14.16 1.070.6 14.17 1.140.7 14.20 1.360.8 14.20 1.360.9 14.21 1.431.0 14.22 1.50
Table 4.5: Networktravel demand
performance across different penetration rates at Two-third of existing
Table 4.5 shows the variation in the impact of green light prediction technology acrossdifferent penetration rates at Two-third of existing travel demand.
The variation in the average speed is very gradual across the penetration rates at Two-thirdof existing travel demand. However the trend still shows travel time saving benefits becauseof the green light prediction technology. Also a drop in average speed is noticed as thetraffic demand increases from the last scenario.
Penetration Rate Average Speed (km/hr) Percentage change inthe average speed
Base-line 11.75 00.1 11.78 0.260.2 11.79 0.340.3 11.84 0.770.4 11.85 0.850.5 11.87 1.020.6 11.88 1.110.7 11.91 1.360.8 11.94 1.620.9 11.99 2.041.0 12.00 2.13
Table 4.6: Network performance across different penetration rates at existing travel demand

Table 4.6 shows the variation in average speed limits across different penetration rates at
existing travel demand. The average speed at complete penetration of the application at
existing travel demand was found to be 12.00 krn/hour with a standard error of 0.13
km/hour for 8 number of observations. The increase in the average speed with respect to
the baseline scenario was 1.85 times of the standard error.
Penetration Rate Average Speed (km/hr) Percentage change inthe average speed
Base-line 7.23 00.1 7.31 1.110.2 7.77 7.470.3 8.25 14.110.4 8.37 15.770.5 8.52 17.840.6 8.53 17.980.7 8.68 20.060.8 9.05 25.170.9 9.19 27.111.0 9.36 29.46
Table 4.7:mand
Network performance across different penetration rates at Maximum travel de-
Table 4.7 shows the variation in the average speed of all the vehicles entering the simulation
at High traffic demand.

18.00
Figure 4.6: Average Speed across penetration rates over different travel demand levels
Figure 4.6 shows the variation of average speed across the penetration rate at different traveldemand levels.
As we can see from Figure 4.6 the variation in the average speed is found to be mostsignificant at Maximum travel demand level. The slopes for the trends at Two-third ofexisting and existing travel demand levels are smaller than those at One-third of existingor Maximum travel demand levels. In the absence of competing vehicles at One-third ofexisting travel demand levels, the driver has better flexibility in altering his/her manoeuvresin response to the green light prediction advisories. Hence higher benefits are expected fromthe technology at One-third travel demand. The benefits have been observed to drop whenthe travel demand rises to Two-third of existing and existing level. The benefits in termsof average speeds are better at Maximum travel demand level. This may be the result ofheavy penalties in terms of travel time at peak congestion without green light predictionspeed advisories. Given that during peak congestion the traffic suffers the most from thedelays from halts in the trip, the application has a better window of potential benefits toachieve. By using the green light prediction speed advisories, users are able to leverage thisknowledge to their advantage by reducing this delay from their total travel time.
Travel Demand Level
As the travel demand level increases the travel time between the same OD pair increases.Hence a decrease in average speed is expected as we increase the travel demand in our
16.00-0
= 14-00E - -E - HU0 EE
12 -4- Low Demanda1. 10.00 - Medium Demand
E 800 - *Normal Demand
6.00 -O- High Demand
4.00
0-0 0.1 0.2 0.3 04 0.5 0.6 0.7 0-8 0.9 1.0
Penetration Rates
-

model.
Figure 4.7 shows the variation in the average speed across different travel demand levels
over a spectrum of penetration rates. The average speeds show the expected decreasing
trend with the increase in the travel demand across all the penetration rates.

Average Speeds across Congestion Levels
1630
15-50
~14,50E
1-50 - 20% Penetration Rate*12 50
- -40%Penetration Rates1150
--- 60% Penetration Rate.1050
80% Penetration RateS9.50
B-54-- 100% Penetration Rate
7.50
0.25 0-50 0.75 1-00
Congestion Levels
Figure 4.7: Average Speed across travel demand levels over different penetration rates
One interesting observation from Figure 4.7 is that the plots of average speeds across thetravel demand levels tend to merge together at Two-third of existing and existing trafficdemand levels. In other words, the impact of green light prediction application is diminishedas compared to One-third of existing or Maximum travel demand levels. The One-third ofexisting and Maximum travel demand levels show significant increase in the average speed,with highest increases in average speeds observed at the Maximum travel demand level.
Compliance Rate
In this test, we see the variation of the traffic performance across different rates of complianceto the green light prediction technology. The compliance rate provides a way to factor inthe reliability of the technology as perceived by the user. Also the compliance factor canbe used to account for the wireless connectivity in the behaviour model. The changesin the compliance rates are reflected in MITSIMLab by the parameter V2Vcompliance.e.g when the V2Vcompliance is set at 0.30, 30% of the times during the simulation rundrivers of the vehicles with V2V capability entering the simulation trust and follow the greenlight prediction advisory. Hence the V2V enabled vehicles follow the regular car-followingbehaviour for 70% of the times an advisory is generated.

Penetration Rate Average Speed (km/hr) Percentage change inaverage speed
Base-line 15.48 00.1 15.67 1.240.2 15.84 2.320.3 15.91 2.770.4 15.91 2.770.5 16.05 3.720.6 16.08 3.910.7 16.13 4.230.8 16.21 4.740.9 16.22 4.801.0 16.39 5.89
Table 4.8: Network performance across different penetration rates at 25% compliance rate
Table 4.8
measured
shows the impact of the different penetration rates on the traffic performance
in terms of average speed at 25% compliance rate.
Figure 4.8: Average speed across different penetration rates at 25% compliance rate
The variation in the average speed across different penetration rates is as plotted in Figure
4.8.
The variation in the average speed across the range of penetration rates suggest a gradual
improvement in the travel time savings for the whole network. As more people on the road
start using the application, the flexibility to leverage the information increases. Hence as
Average Speed (km/hr)16.60
16.40
E 15.2015.00
15-80tft15-60 ,.
S15.40
S15.20
15.00
0 0-1 0.2 0.3 0.4 0.5 0.6 0.7 0.8 0.9 1.0
Penetration Rate

the penetration rate increases more travel time savings benefits can be realised as a result
of informed manoeuvres by most of the drivers.
Penetration Rate Average Speed (km/hr) Percentage change inthe average speed
Base-line 15.48 00.1 15.91 2.770.2 16.06 3.760.3 16.07 3.820.4 16.07 3.820.5 16.16 4.400.6 16.16 4.440.7 16.24 4.920.8 16.29 5.240.9 16.34 5.571.0 16.39 5.89
Table 4.9: Network performance across different penetration rates at 50% compliance rate
Table 4.9 shows the variation in the impact of green light prediction technology across
different penetration rates at 50% compliance rate.
Figure 4.9: Average speed across different penetration rates at 50% compliance rate
The variation in average speed across the penetration rates at 50% compliance rate is shown
in Figure 4.9.
Average Speed (km/hr)16.60
16.40
E 16-2016.00
15.80
W15.60 /L 15A
< 15.20
15.00
0 0-1 0.2 0.3 0.4 0.5 0.6 0.7 0.8 0.9 1.0
Penetration Rate

The variation in the average speed is very gradual across the penetration rates at 50%
compliance rate. However the trend still shows travel time saving benefits because of the
green light prediction technology. Also a drop in average speed is noticed as the compliance
rate increases from the last scenario.
Penetration Rate Average Speed (km/hr) Percentage change inthe average speed
Base-line 15.48 00.1 16.00 3.370.2 16.01 3.430.3 16.11 4.080.4 16.13 4.210.5 16.16 4.400.6 16.18 4.530.7 16.20 4.660.8 16.22 4.790.9 16.35 5.631.0 16.41 6.02
Table 4.10: Network performance across different penetration rates at 75% compliance rate
Table 4.10shows the variation in average speed limits across different penetration rates at
75% compliance rate.
Figure 4.10: Average speed across different penetration rates at 75% compliance rate
The variation in average speed across the penetration rates at existing travel demand is
shown in Figure 4.10.
Average Speed (km/hr)16.60
16.40
162016.00
S15.40
0 0-1 0.2 03 0.4 0.5 0.6 07 08 0.9 1.0
Penetration Rate

The variation in the average speed follows the expected trend across the penetration rateswith lower average speeds as compared to the last scenario.
As the compliance rate to the speed advisories increases most of the benefits in terms ofthe increase in average speeds are realised at lower penetration rates. The graph tendsto taper off at higher penetration rates of the technology. At lower compliance rates, theincrease in the benefits is more uniform over all the penetration rates. In other words, asthe reliability of the technology increases most of the benefits from the technology can berealised by achieving relatively lower penetration rates of the technology.
4.3.4.2 Travel Time
Penetration Rate
Figure 4.11: Average travel time across penetration rates at existing travel demand level
The trend of average travel time per trip across the penetration rates is shown in Figure 4.11.The incremental savings in the average travel time are slightly more at lower penetrationrates as the penetration rate increases. The incremental benefits in the travel time savingsby increasing the penetration rate of application gradually diminish across the range. At the100% penetration of the technology, the average travel time is found to be 2.48 minuteswith a standard error of 0.06 minutes for 8 number of observations. The reduction in traveltime with respect to baseline scenario was 1.55 times of the standard error.
Average Travel Time
00 0.1 0.2 0.3 0.4 0-5 0.6 0.7 0.8 0.9 1.0
a 0.00%& -0.50%
-1.00%
*-1-50%E-2-00%
.=-2-50%
-3-00%
-50%
-4.00% Penetration Rate

Compliance Rate
Average Travel Time
0.00 0.20 0.40 0.60 0.80 1OO
0.00%
E -0.50%
* 1.00%
~E-1.50%.z -2.00%W
-2.50%
-3.00Y%
-3.50%ComplianKe Rate
Figure 4.12: Average travel time across compliance rates at existing travel demand level
The trend of average travel time across the compliance rate is shown in Figure 4.12. The
trend in average travel time follows an almost linear pattern across the compliance rates.
The incremental increase in the average travel time is marginally larger as the compliance
and trust for the technology goes up.
4.3.4.3 Halts
The goal of the green light prediction application is to avoid the halts at the intersections.
Hence to assess the impact of the technology on the network performance we need to observe
the trend of the average number of halts per trip across different penetration rates. We de-
fine a halt as an instance where the speed of a vehicle drops below a certain pre-determined
threshold like 3 km/hr. We calculate this parameter across different penetration and com-
pliance rates.

Penetration Rate
Penetration Rate Average number of halts per trip0.0 3.640.1 3.560.2 3.520.3 3.450.4 3.440.5 3.370.6 3.330.7 3.290.8 3.290.9 3.271.0 3.25
Table 4.11: Average number of halts per trip across penetration rates
Figure 4.13: Percentage change in average number of halts per trip across penetration rates
The variation of the average number of halts per trip across different penetration rates is
shown in Table 4.11 and Figure 4.13. The average number of halts per trip at complete
penetration of the application at existing travel demand was found to be 3.25, with a
standard error of 0.13 for 8 number of observations. The reduction in average number of
halts per trip with respect to baseline scenario was 2.87 times of the standard error.
Halts per trip
0.0 0.1 0-2 0.3 0.4 0.5 0.6 0-7 0.8 0.9 1.0
C. 0.00%*-
-2.00%
-4.00%
'~-5.00%
-8.00%E -
-10.00%
g -12.00% ePenetration Rate

The reduction in the average number of halts per trip is observed to be approximately
linear. The incremental effect of the technology is more predominant for lower penetration
rates. The potential increment in benefits from the technology begin to taper off as the
penetration rate rises. These observations are in agreement with the travel time benefits
across the penetration rates.
Compliance Rate
The variation of average number of halts per trip was calculated across different compliance
rates at a 100% penetration rate of the technology. The trend is shown in Table 4.12 and
Figure 4.14.
Compliance Rate Average number of halts per trip0.0 3.640.2 3.490.4 3.470.6 3.460.8 3.361.0 3.10
Table 4.12: Average number of halts per trip across compliance rates
Halts per trip
0.20 0.40 0.60 0.80 1.00
0.00%
-2.00%
-4.00%- 0
*-6.00%
-8.00%
. -10.00%E - .g -12.00%C
~-14.00%
-16.00%Compliance Rate
Figure 4.14: Percentage change in average number of halts per trip across compliance rates
The number of interruptions reduce as the compliance and trust in speed advisories increases.
The incremental benefits show a peak at higher rates of compliance. In other words, the

vehicles trips are smoother with less interruptions as the reliability of the speed advisoriesincreases. At lower compliance to the speed advisories, the model essentially replicates thescenario without any V2V application. The resultant vehicle trips are still abrupted by thestops at the intersections. As higher reliability of the speed advisories is achieved, the trafficflow shows signs of cooperative driving where all the vehicles drop or increase their speedsto avoid the delay at the intersections. Hence higher benefits in terms of halts per trip maybe observed at higher compliance rates.
4.4 Summary
In this chapter, we use a real road network near the Bugis MRT station in Singapore toperform a case study analysis. The driving response to the green light prediction wasmodelled by using the received information to generate speed advisories. The goal of thespeed advisories is to reduce delays at the intersections by avoiding the red light. Complianceto these advisories alters car-following behaviour of the driver. The compliance in turndepends in the reliability of the speed advisories as perceived by the user and his/herfamiliarity with the network.
Since the technology is not yet deployed and there are not reliable predictions about thepenetration rates of this application, the analysis was carried out over a range of differentscenarios. These scenarios encompassed the variation in impact of the technology acrossdifferent penetration rates, travel demand levels and compliance rates. Since the goal of thetechnology is to reduce the number of halts at the red light, we use average speed, traveltime and average number of halts per trip as the measures of effectiveness.
The results of the analysis across these scenarios show significant improvement in the averagespeeds as the penetration rate of the application increases. For existing conditions, theaverage travel time and average number of halts per trip were found to improve by 3.69%and 10.71% respectively, at complete penetration by the green light prediction applicationwhen compared to the scenario without the application.
The increments in average speeds are mostly uniform across penetration rates with lowerpenetration rates yielding slightly higher incremental benefits in terms of average speeds.The compliance rate is seen to have a similar effect on the benefits achieved by the ap-plication. As the travel demand goes up, an expected drop in average speed is observed.An interesting observation was that most of the benefits of the application were observed

at one-third of existing or maximum travel demand levels. At two-third of existing and
existing travel demand levels the benefits of the technology seemed to diminish.
The average travel times and average number of halts per trip are observed to follow the
expected reducing trend as the penetration rate of the application increased. Most of the
benefits in terms of both of these metrics are observed to be realised at lower penetration
rates of the technology with higher penetration rates not yielding significant increments in
the benefits.
It must be mentioned that reliability of speed advisories in our model follows random dis-
tribution whereas in reality it will depend on the number of vehicles passing a traffic light,wireless connectivity among vehicles, etc. The observed trends can be improved by consid-
ering these interactions by coupling this model to a wireless network simulator.
To summarise, the green light prediction technology can improve average speed in the orderof 2% at existing travel demand level, by reducing the delays at the traffic light intersections,even at relatively low compliance and reliability of the technology. These travel time savings,if monetised, along with the fuel savings and the environmental benefits, can be used tojustify the deployment of such a technology in real life. Since significant benefits have been
observed at lower penetration rates with tapering incremental benefits at higher penetration
rates, we can find an optimal penetration rate where the incremental monetary benefitsmatch the incremental costs of the technology deployment.
In the next chapter, we draw conclusions and inferences from the case study. We also
identify the next step in development of this approach for future directions for research.

80
Chapter 5
Conclusion
In this chapter we summarise the research and the findings reported in this thesis. We
highlight the major contributions and conclude the chapter by suggesting possible directions
for future work along the line of research presented in this thesis.
5.1 Thesis Summary
The objective of this thesis is to explore the applications of wireless technology and its
deployment for ITS purposes and to develop a simulation framework in order to assess their
impact on traffic performance.
The first step is to gain an understanding of the applications of this technology and the
approaches used to assess its performance. The goal of the literature review is to identify
the ways to make the driving behaviour models sensitive to the V2V technology applications.
From previous work, integration of a wireless network simulator with a traffic simulator is
observed as a better approach than using individual simulators. However the need to make
behaviour models sensitive to the V2V application is observed.
An integrated modelling framework is proposed to capture the effects of a wireless V2V
communication application in a simulation study. The wireless network simulators expect
the relative position, speed and wireless device capability of every individual network in the
simulation as the input. The wireless network simulator reads these inputs as "mobile nodes"
with wireless capabilities and uses wireless message propagation and interference models to
establish wireless "connectivity" and "reliability" of the message exchanged between the
vehicles. Wireless connectivity is established among two vehicles if they can exchange a

message over the wireless network. Reliability of the message reflects the confidence in datacollection accuracy and algorithm used to generate advisories.
In the proposed modelling framework, we demonstrate that the "connectivity" and "reliabil-ity" of the message exchange affects the way the information disseminated over the wirelessnetwork affects the driver. Driving behaviour models like car-following and lane-changingpredict the manner in which a driver reacts to the surrounding traffic and information.Hence depending on the goal V2V communication application,driving behaviour models aremodified to reflect the knowledge of the information to the driver. To account for less than100% penetration rate of the technology, the drivers are categorised as either ordinary orV2V enabled. Each class of user follows the models pertaining to the respective class.
The proposed modelling framework is used to develop a case study on the Bugis roadnetwork in Singapore. A green light prediction application was the application chosen forthe purpose of the case study. The purpose of the application is to generate speed advisoriesin order to avoid any halts at the red traffic light downstream. The application is designedto operate on a smart phone installed behind the windshield of a vehicle. It takes pictures oftraffic lights in its field of view and collaboratively shares this information with other user.Based on this collaborative database of time-stamped traffic light phases, the applicationgenerates optimal speed advisories.
A model for a road network near the Bugis MRT station in Singapore is developed in the mi-croscopic traffic simulator laboratory MITSIMLab. The road network has several signalisedintersections and has complex traffic flows during peak hours. The model is calibrated andvalidated using counts data to replicate the traffic flow behaviour on the network. Thecalibrated model was validated against counts data for another set of weekdays. Then themodel was run for a base-line scenario which reflected the existing traffic pattern withoutany V2V application considered.
The impact of the green light prediction application is incorporated in the car-followingmodels. A certain section of the driver population which has the V2V capability based onthe penetration rate of the technology carries the application on their vehicle and respondsto the advisories. Also a compliance rate was defined for every driver to reflect the reliabilityof the advisories which in turn depends on the wireless connectivity of the vehicles. Basedon this compliance rate the drivers may or may not choose to follow the advisories.

Since the technology is yet to be deployed, a number of scenarios were generated based on
the penetration rate of the technology and the compliance to the advisories. The goal of the
technology is to reduce the number of halts and promote uninterrupted traffic flows. Hence
average speeds, average travel time and average number of halts per trip were used as the
MOEs across the alternatives.
As expected, traffic performance improved as the penetration rate of green light prediction
application increased. The greatest improvement in traffic performance is seen at higher
level of demand. One reason for this might be that, the traffic performance drops rapidly as
demand rises and traffic approaches crawling speed. Thus the application has a bigger win-
dow of potential improvement in traffic performance. As expected, average speed increases
as the reliability and hence the compliance to the technology increases. The observed trends
for average travel time and average number of halts agree with the trends for average speeds.
One key observation is that incremental benefits taper off at higher penetration rates.
The SignalGuru application was evaluated by (Koukoumidis, Peh and Martonosi; 2011)
and the results showed 20.3% savings in fuel consumption, on average. Even though the
relationship between in fuel consumption and average speed might not be linear; the findings
from physical experimentation are higher compared to the findings of this study. The
physical experimentation had only five vehicles with the application scouting a network,while our simulation approach considers higher penetration rates of application. Physical
experimentation captures all interactions of wireless connectivity whereas it is exogenous
to our model at the moment. Our approach shall be explored further to produce results to
compare with physical experimentation.
The study gives empirical evidence about the potential benefits that can be achieved from
green light prediction application. Also the cost of the technology may depend on the
penetration rate and the desired reliability of the advisories. Hence the trends presented
in this thesis can be used as as indication of the optimal point where the benefits could be
maximised while keeping the costs withing the budget constraints.
5.2 Contribution
The thesis proposes a modelling framework to modify behaviour models to account for the
impact of V2V communication based applications on traffic performance. The framework
suggests coupling of a microscopic traffic simulator with a wireless network simulator to

capture both sides of the problem. However, in this thesis we limit ourselves to developingbehavioural models to incorporate the driving response to the V2V communication basedtechnologies. The step of modification of behaviour models depends on the kind and contentof information made available by the use of the technology. The effect of V2V communicationbased ITS applications is linked to the changes in certain parameters in the behaviouralmodels reflecting the perception of the driver.
The proposed modelling framework is developed for a case study in Singapore with greenlight prediction application as the V2V communication application. The car-following modelis modified to account for driver's knowledge of speed advisories to avoid red lights. Themodification in car-following model changes the urgency of the driver to reach the intersec-tion.
The green light prediction application has been presented as the technology enabled bywireless V2V communication. The speed advisories generated are incorporated with thecar-following model in response to the concerned traffic light. The model accounts for thevarious penetration rates of the technology and uses compliance rate as a proxy for thereliability of the delivered message. The study used average speeds and average number ofhalts per trip as the MOEs to assess the improvement in the traffic performance as a directresult of the technology. The trends of these MOEs across different penetration rates andcompliance rates were obtained. The trends are indicative of the potential benefits of thetechnology and may be used to find the optimal point for the deployment of the technology.
5.3 Future Directions for Research
The research presented in this thesis focussed on the traffic simulation side of the simulationapproach to model wireless V2V communication. However there is a lot of scope for workto be done in the future in this direction. Some of those ideas are described below:
e Expansion to integration of simulators:
- The presented case study assumes a certain penetration rate of the technology.All the users with the device are assumed to receive "accurate" advisories whichthey follow based on a certain "compliance factor". In practice, not all the vehicleswill receive accurate advisories all the time. This simplification can be removedby introducing a wireless network simulator in the study. A wireless networksimulator coupled with the traffic simulator will be able to generate parameter

values like reliability of the message transfer among vehicles. These values would
be important to determine which vehicles will receive the advisories. The current
model can be modified to inform only these drivers about the advisories.
" Evaluation of green light prediction algorithm:
- The speed advisories generated by the green light prediction application depend
on the knowledge of the phases of traffic lights in the network. Hence if a partic-
ular intersection is traversed by very low amount of traffic, the application might
not be able to generate speed advisories or may generate advisories with low
reliability for that traffic light. A simulation study on the integrated platform
can be used to determine the minimum traffic throughput at an intersection to
sustain reliable predictions from the application.
" Reliability of the advisories:
- The reliability of speed advisories has been represented in terms of the compliance
factor in this model. The reliability of advisories can be linked to the reliability
of the message transfer as generated by the wireless network simulator. Also
every person in the population may comply to the technology differently. The
approach could be improved by modelling this heterogeneity of population with
respect to the technology.
" Refining the behaviour model:
- In the presented study, the behaviour models were calibrated and validated using
aggregate data. The model can further be refined by obtaining and using disag-
gregate trajectory data for the site. A model calibrated on the disaggregate data
will be able to predict the behaviour more accurately.
" Incorporating route choice:
- The current model looks into the changes in desired speed in response to the
advisories from the green light prediction application. The application can be
extended to generate route advisories to avoid halts at red traffic light. The
model can be transferred to a bigger network to incorporate the route choice
framework.

86

Bibliography
Abuelela, M., Olariu, S. & Weigle, M. 2008, 'NOTICE: An Architecture for the Notification
of Traffic Incidents', Vehicular Technology Conference, VTC Spring 2008, IEEE , pp.3001-
3005.
AutomotiveWorld.com, 2005: http://www.automotiveworld.com/news/oems-and-markets/general-
motors-demonstrates-new-v2v-technology.
Barcelo, J. (ed.) 2010, Fundamentals of Traffic Simulation, Springer, New York, NY.
Ben-Akiva, M. 2010, 'SMART - Future Urban Mobility', JOURNEYS.
Ben-Akiva, M., Cuneo, D., Hasan, M., Jha, M. & Yang, Q. 2003, 'Evaluation of freeway con-
trol using a microscopic simulation laboratory', Transportation Research Part C: Emerging
Technologies, vol. 11(1), pp. 29-50.
Box, E. 1965, 'A new method for constrained optimization and a comparison with other
method's, The Computer Journal, vol. 8, pp. 42-52.
Bychkovsky, V., Hull, B., MI, A., Bulgarian, H. & Madden, S. 2006, 'A Measurement Study
of Vehicular Internet Access Using in situ Wi-Fi Networks', Modicum.
Carter, A. & Chang, J. 2009, 'Using Dedicated Short Range Communications for Vehicle
Safety Applications - the Next Generation of Collision Avoidance'.
Choudhury, C. 2002, 'Modeling Lane-changing Behavior in Presence of Exclusive Lanes',Masters Dissertation, MIT, pp. 37.
Choudhury, C. 2007, 'Modeling Driving Decisions with Latent Plans', Doctoral Dissertation,MIT.

Choudhury, C., Rajiwade, S., Rapolu, S., Ben-Akiva, M. & Emends, A. 2011, 'Evaluatingthe Impact of Interventions on Network Capacity', TRB 90th Annual Meeting, Compendiumof Papers DVD, 11-0340.
Conceigio, H., Damas, L., Ferreira, M., & Barros, J. 2008, 'Large-scale simulation of V2Venvironments', 2008 ACM symposium on Applied computing (SAC '08), ACM, New York,NY, pp. 28-33.
Dalla Chiara, B., Deflorio, F. & Diwan, S. 2009, 'Assessing the effects of inter-vehiclecommunication systems on road safety', Intelligent Transportation Systems IET, vol.3, no.2,pp. 225-235.
Eichler, S. 2007, 'Performance Evaluation of the IEEE 802.11p WAVE CommunicationStandard', Vehicular Technology Conference, 2007, IEEE 66th , pp.2199-2203.
Eichler, S., Ostermaier, B., Schroth, C. & Kosch, T. 2005, 'Simulation of Car-to-Car Mes-saging: Analyzing the Impact on Road Traffic', MASCOTS '05, pp. 507-510.
ElBatt, T., Siddhartha, K., Gavin, H., Hariharan, K. & Jayendra, P. 2006, 'Cooperativecollision warning using dedicated short range wireless communications', 3rd internationalworkshop on Vehicular ad hoc networks, VANET06, Los Angeles, CA.
Fernandes, P. & Nunes, U. 2008, 'Multi-agent Architecture for Simulation of Traffic withcommunications', ICINCO 2008 International Conference on Informatics in Control, Au-tomation & Robotics, Funchal.
Gallagher, B., Akatsuka, H. & Suzuki, H. 2006, 'Wireless communications for vehicle safety:Radio link performance and wireless connectivity methods', Vehicular Technology Magazine,IEEE , vol.1, no.4, pp. 4-24.
Holfelder, W. 2004, 'Vehicle-to-Vehicle and Vehicle-to-Infrastructure Communication Re-cent Developments, Opportunities and Challenges', Future Generation Software Architec-tures in the Automotive Domain Connected Services in Mobile Networks Workshop.

Hull, B., Bychkovsky, V., Zhang, Y., Chen, K., Goraczko, M., Miu, A., Shih, E., Balakrish-
nan, H. & Madden, S. 2006, 'CarTel: A Distributed Mobile Sensor Computing System', 4th
international conference on Embedded networked sensor systems (SenSys '06), ACM, New
York, NY, pp. 125-138.
ITS Standards Advisory, 2003: http://www.standards.its.dot.gov/Documents/advisories/dsrcadvisory.ht
Kim, H., Hunter, M. & Fujimoto, R. 2009, 'A simulation-based investigation of a dynamic
Advanced Traveler Information System', Winter Simulation Conference 2009, pp.1124-1135.
Klunder, G., Li, M. & Minderhoud, M. 2009, 'Traffic Flow Impacts of Adaptive Cruise
Control Deactivation and (Re)Activation with Cooperative Driver Behavior', Transportation
Research Board of the National Academies, vol. 2129/2009, pp. 145-151.
Koukoumidis, E., Peh, L. & Martonosi, M. 2011, 'SignalGuru: Leveraging Mobile Phones
for Collaborative Traffic Signal Schedule Advisory', 9th ACM International Conference on
Mobile Systems, Applications and Services (MobiSys), Washington, DC, pp. 127-140.
Mathur, S., Jin, T., Kasturirangan, N., Chandrasekaran, J., Xue, W., Gruteser, M. &
Trappe, W. 2010, 'ParkNet: Drive-by Sensing of Road-side Parking Statistics', MobiSys
Conference, New York, NY.
Mei, B., Hu, H., Rouphail, N. & Lee, J. 2010, 'Simulation Model for Studying Impact of
Vehicle-to-Vehicle Wireless Communications on Traffic Network Operations', Transportation
Research Board of the National Academies, vol. 2189/2010, pp. 107-115.
NHTSA, 2011: http://www.nhtsa.gov/Data/National+Automotive+Sampling+System+(NASS)/NASS+
Rapolu, S. 2010, 'Evaluating the Impact of Interventions on Network Capacity', Masters
Dissertation, MIT.
Rawat, D., Treeumnuk, D., Popescu, D., Abuelela, M. & Olariu, S. 2008, 'Challenges and
perspectives in the implementation of NOTICE architecture for vehicular communications',Mobile Ad Hoc and Sensor Systems, MASS 2008, 5th IEEE International Conference, pp.
707-711.
RITA, 2003: http://www.its.dot.gov/press/dsrclicensingfinal.htm

RITA, 2010: http://www.its.dot.gov/press/2010/vii2intelidrive.htm
RITA, 2011: http://www.its.dot.gov/factsheets/v2vfactsheet.htm
Scalable Network Technologies, 2011: http://www.scalable-networks.com/products/qualnet/
Schrank, D., & Lomax, T. 2007, 'The 2007 urban mobility report', Texas TransportationInstitute, College Station, Texas.
Shoup, D. 2007, 'Cruising for parking', Access, vol. 30, pp. 16-22.
Shulman, M. & Deering, R. 2007, 'Vehicle Safety Communications in the United States',Vehicle Safety Communications Project Report, Ford Motor Company and General Motors,Paper Number 07-0010.
Thiagarajan, A., Ravindranath, L., LaCurts, K., Madden, S., Balakrishnan, H., Toledo, S.& Eriksson, J. 2009, 'Vtrack: accurate, energy-aware road traffic delay estimation usingmobile phones', A CM SenSys, pp. 85-98.
Torrent-Moreno, M., Jiang, D. & Hartenstein, H., 'Broadcast reception rates and effects ofpriority access in 802.11-based vehicular ad-hoc networks', 1st A CM international workshopon Vehicular ad hoc networks (VANET '04), ACM, New York, NY, pp. 10-18.
Tsugawa, S. & Kato, S. 2010, 'Energy ITS: another application of vehicular communica-tions', Communications Magazine, IEEE , vol.48, no.11, pp. 120-126.
Tuan Seik, F. 2000, 'An advanced demand management instrument in urban transport:electronic road pricing in Singapore', Cities, vol.17, pp. 33-45.
Wang, Z., Kulik, L. & Ramamohanarao, K. 2007, 'Proactive traffic merging strategies forsensor-enabled cars', 4th ACM International Workshop on Vehicular Ad Hoc Networks.
Weis, B. & Sandweg, A. 2010, 'GuideWeb: A New Paradigm for Navigation Support basedon V2V Communication', Advanced Microsystems for Automotive Applications, eds. Meyer,G., & Valldorf, J., pp. 423-432.

Yeo, H., Shladover, S., Krishnan, H. & Skabardonis, A. 2010, 'Microscopic Traffic Simula-
tion of Vehicle-to-Vehicle Hazard Alerts on Freeway', Transportation Research Board of the
National Academies, vol. 2189/2010, pp. 68-77.
Yin, J., ElBatt, T., Yeung, G., Ryu, B., Habermas, S., Krishnan, H. & Talty, T. 2004,'Performance evaluation of safety applications over DSRC vehicular ad hoc networks', 1st
ACM international workshop on Vehicular ad hoc networks (VANET '04), ACM, New York,NY, pp. 1-9.
Yang, Q. & Koutsopoulos, H. 1996, 'A Microscopic Traffic Simulator for Evaluation of
Dynamic Traffic Management Systems', Transportation Research, 4C, pp. 113-129.

92

Appendix A
MITSIMLab: Micro-scopic Traffic
Simulation Laboratory
A.1 MITSIMLab
MITSIMLab (Yang and Koutsopoulos, 1996) is a simulation-based laboratory that was
developed for evaluating the impacts of alternative traffic management system designs at
the operational level and assisting in subsequent refinement. Examples of systems that can
be evaluated with MITSIMLab include advanced traffic management systems (ATMS) and
route guidance systems.
MITSIMLab is a synthesis of a number of different models and has the following character-
istics:
e Represents a wide range of traffic management system designs;
a Models the response of drivers to real-time traffic information and controls;
a Incorporates the dynamic interaction between the traffic management system and the
drivers on the network.
The various components of MITSIMLab are organized in three modules:
e Microscopic Traffic Simulator (MITSIM)
e Traffic Management Simulator (TMS)
a Graphical User Interface (GUI)

Figure A.1: MITSIMLab Framework
The interactions among the various MITSIMLab modules are shown in Figure A.1. Amicroscopic simulation approach, in which movements of individual vehicles are represented,is adopted for modelling traffic flow in the traffic flow simulator (MITSIM). This level ofdetail is necessary for an evaluation at the operational level. The Traffic ManagementSimulator (TMS) represents the candidate traffic control and routing logic under evaluation.The control and routing strategies generated by the traffic management module determinethe status of the traffic control and route guidance devices. Driver behaviour is a responseto the control strategies and a result of the interaction with other drivers in the model.
A.1.1 Traffic Flow Simulator (MITSIM):
Traffic and network elements are represented in detail in order to capture the sensitivity oftraffic flows to the control and routing strategies. The main elements of MITSIM are:
e Network Components: The road network geometry along with the traffic controlsand surveillance devices are represented at the microscopic level. The road networkconsists of nodes, links and segments with lateral segmentation in to lanes.
a Travel Demand and Route Choice: A time-dependent origin to destination trip
table is loaded as the demand input in to the traffic simulator. These OD tables

represent either expected conditions or are defined as part of a scenario for evaluation.
A probabilistic route choice model governs the route choice decisions of the drivers
once they enter the simulation.
e Driving Behaviour: The origin/destination flow demand creates a number of ve-
hicles about to enter the network at different times during the simulation run. The
driver is identified with the vehicle itself. Thus the behaviour parameters (such as
desired speed, aggressiveness, etc.) and vehicle characteristics are assigned to every
vehicle entity to generate a realistic population of network users. MITSIM moves ve-
hicles according to car-following and lane-changing models. The car-following model
captures the response of a driver to conditions ahead as a function of relative speed,headway and other traffic measures. The lane-changing model distinguishes between
mandatory and discretionary lane changes. On-ramp merging and response to control
devices like traffic signals, VMS, toll-booths, etc can also be modelled.
A.1.2 Traffic Management Simulator (TMS):
The traffic management simulator mimics the traffic control system in the network under
consideration. A wide range of traffic control and route guidance systems can be simulated,such as:
e Ramp control
a Freeway mainline control
e Lane control signs (LCS)
e Variable speed limit signs (VSLS)
e Portal signals at tunnel entrances (PS)
e Intersection control
a Variable Message Signs (VMS)
e In-vehicle route guidance TMS has a generic structure that can represent different
designs of such systems with logic at varying levels of sophistication (from pre-timed
to responsive).

A.1.3 Graphical User Interface (GUI):
The simulation laboratory has an extensive graphical user interface that is used for bothdebugging purposes and demonstration of traffic impacts through vehicle animation.

Appendix B
Aggregate Calibration Framework
B.1 Calibration Framework
Source: Rapolu (2010)
Po oiginaly estumsated parmetersP =Calibrated parameteraOD =Origin destiration flows
Figure B.1: Calibration Framework

The process of calibration of the simulation system aims to set the various parameters in themodels so that observed traffic conditions are replicated as closely as possible. The overallcalibration framework is summarized in Figure B.1.
The calibration process consists of two steps: first, the individual models of the simula-tion are estimated using dis-aggregate data. Dis-aggregate data includes detailed driverbehaviour information such as vehicle trajectories.
In the second step, the simulation model as a whole is calibrated using aggregate data suchas: flows, speeds, occupancies, time head-ways, travel times, queue lengths etc. The purposeof aggregate calibration of the simulation system is to adjust the various parameters so thatobserved traffic conditions are replicated as closely as possible. These parameters consistof the parameters of the behaviour model (initially estimated parameters 8i adjusted to #) and the travel demand (expressed in terms of origin - destination or OD flows). In caseof unavailability of the dis-aggregate dataset for a parameter, the values of these omittedparameters can be captured during the aggregate calibration.
Once the calibration is complete, the values of the full set of behavioural parameters arefixed (#) and a second set of data is used for validation. Application of the simulation toreplicate this dataset al.so requires OD flows as input. However, these may be differentfrom the ones obtained in the calibration phase and so the OD estimation component ofthe calibration must be re-done for this dataset. These new OD flows and the calibratedparameter values are used as inputs to the simulation system.
B.1.1 Problem Formulation
Aggregate calibration can be formulated as an optimization problem, which seeks to min-imize a function of the deviation of the simulated traffic measurements from the observedmeasurements and of the deviation of calibrated values from the a-priori estimates of theOD flows and the estimated behaviour parameters.
The formulation is shown below. The first and second terms in the objective functionare a measure of deviation between observed and simulated measurements and between apriori OD flows and the estimated OD flows respectively. The first constraint shows thedependence of simulated measurements on the driving behaviour parameters, OD flows andthe network conditions. The second constraint is a non-negativity constraint for the ODflows.

min,OD E=1 (Msim - Mob)TW-1(Msim - Mf") + (OD - OD)TV-1(OD - OD) such
that Mi m = S(0, OD)
where
O= driving behaviour parameters
OD = OD flows
ODO= a-priori OD flows
N = number of days for which sensor data is available
Msim=simulated measurements
Mf"s= observed measurements for day i
S = the simulation model function, which generates simulated traffic measurements
W = variance-covariance matrix of the sensor measurements
V = variance-covariance matrix of the OD flows
The sensor measurements in this case constitute the traffic flows at all sensor stations
and all time intervals. The formulation presented above is difficult to solve because of the
absence of analytical formulations that relate the affect of behaviour parameters to the sensor
measurements and relatively large number of parameters to calibrate. An iterative solution
approach is therefore adopted. In each iteration, first the driving behaviour parameters
are kept fixed and the OD flows are estimated. Then the OD flows are kept fixed and the
driving behaviour parameters are estimated.
The number of behaviour parameters in the simulation model is very large. It is not feasible
to calibrate all of them. A sensitivity analysis is often done to identify the parameters
that contribute most in improvement of the objective function. In sensitivity analysis, the
impact of an individual factor on the overall predictive quality of the simulator is measured
while keeping all other parameters at their original values.
Since the technology we need to test is not being implemented, we do not have any data
that represents the driving behaviour in response to the technology. Hence we will calibrate
our model to adjust for the travel flows observed on the field for the real life scenario. This
model will then be used to test the impact of green light prediction over a range of different
penetration rates.

B.2 Goodness of fit measures
Model validation typically includes in it the tasks of aggregate calibration and aggregatevalidation.
The aggregate calibration process involves adjusting the values of the parameters of thebehavioural models and estimating travel demand, in the form of OD flows, on the networkbeing studied in order to obtain a better fit of the model output with the actual traffic flow.The aggregate validation process involves using the calibrated model on a different datasetto determine the extent to which the model accurately replicates traffic behaviour.
A number of goodness-of-fit measures can be used to evaluate the overall performance ofthe simulation model. Popular among them are the root mean square error (RMSE) androot mean square percent error (RMSPE). The two measures are given by:
RMSE = n Y -Ybs)2
RMSPE = Z i( "b8)2 where Ynfmand Yesare the averages of observed andsimulated measurements at space-time point n, calculated from all available data.
RMSE and RMPSE penalise large errors at a higher rate relative to small errors.
100

Appendix C
Communication Technologies
Coverage Technology Pros Cons
Wide Area Satellite Data Global coverage Very expensive, lowdata rate
Wide Area AM/FM Radio Regional coverage, Only broadcast, lowubiquitous deployment data rate, no uplink
Wide Area Digital Satellite Radio Continent coverage, Only broadcast, no
exclusive data channel uplink
Wide Area Digital Audio Broadcast Regional coverage, high Only broadcast, not
data rate widely deployed yet, no
uplinkWide Area Cellular Sufficient population Relative expensive for
coverage, reasonable data, low data rate
data rate
Local Area Wireless LAN No license cost, Hotspot coverage
inexpensive, highbandwidth, strongindustry support
Local Area Infrared No license, inexpensive, Limited range, limited
already established bandwidth, only line ofsight
Personal Area Infrared No license, inexpensive Limited range, limited
bandwidth, only line of
sight
Personal Area Bluetooth No license, inexpensive Limited range, limited
bandwidth
Personal Area UWB No license, very high No standards
bandwidth
Table C.1: Wireless Communication: Technology Options
101

Source: Holfelder (2004)
Establishing a wireless communication network among mobile vehicles is a challenge andthere is no perfect technological solution. While selecting the underlying technology, weneed to consider three competing factors: Cost, Quality of Service and Availability. Thereare several options for the technology to be used to establish the V2V communication. Eachof these technologies have a set of certain pros and cons (Table C.1; Holfelder, 2004). Theinitial use of sensors on vehicles involved radar or ultrasonic systems for safety applications.Though these systems provide additional safety, they have their natural limits. The tradi-tional sensors are short-haul, have limited data capabilities and are relatively expensive.
Wireless communication established over a LAN (WLAN) can be used as a sensor collagewhich enables a vision for the driver encompassing a larger range on both the space andtime dimensions. The extended local environment effectively extends the driver's horizonand can be used for a new class of safety and guidance applications.
To realise the effective communication, it is essential to establish a common "language" forall the participating vehicles. In 1999, the US Federal Communication Commission (FCC)allocated 75 MHz of spectrum at 5.9 GHz to be used exclusively for V2V and V21 commu-nication in the US. This reserved spectrum is also referred to as the Dedicated Short RangeCommunication (DSRC). DSRC is based on the IEEE 802.11 WLAN standards family.IEEE 802.11 is a set of standards for implementing WLAN which follow the same protocolfor communication. The research in this field has been dynamic with the development ofa new standard, IEEE 802.11p Wireless Access in Vehicular Networks (WAVE) (Eichler,2007). The approximate range of DSRC devices can be up to 1000m.
102

Appendix D
Network Capacity
Capacity is typically defined for a particular link in the network. The lack of common
currency for the network capacity that can be used to make comparisons across different
networks and situations makes the analysis difficult. A framework to calculate the network
capacity that can be used across different networks and scenarios was developed in the
work by Rapolu (2010). This currency is particularly useful in assessing the impact of any
futuristic technology application such as V2V on the network performance.
The conventional link-based network analysis defines capacity as the maximum number of
vehicles that can pass through a point in a unit time. This definition works fine for an
individual link. However these capacities cannot be summed up over the entire network to
get an idea of the network performance. Also this capacity value depends highly on the
other traffic flows and the route patterns in the system creating an in-separable problem.
e.g. the network performance changes significantly if a bottleneck is introduced in the
network. Also the number of vehicles that can be physically accommodated in a given
network is not an efficient way to define network capacity. A network which can physically
accommodate fewer vehicles at a given time can still allow better throughput of vehicles in
unit time. Thus, both static and throughput capacities contribute to the effective capacity
of a network. Therefore, the unit of measurement for network capacity was defined as the
vehicle miles travelled in a unit time (VMT/time). It is a logical measure of the network
capacity as it denotes the maximum amount of travel possible in a given amount of time.
This definition of network capacity can be used to assess the network performance across
different scenarios. To determine the network capacity, we perform multiple runs of every
scenario on a microscopic traffic simulator like MITSIMLab. The demand file in MIT-
SIMLab is a time based OD matrix for the whole network. During a simulation run, the
103

simulator keeps track of the vehicles which might queue up outside the network and haveto wait to enter the network. If the network is not operating at its capacity it shall be ableto accommodate more vehicles. Hence to determine the capacity of the network, we scaleup the OD matrix to increase the demand. We keep increasing the scaling factor for theOD matrix until we observe a queue piling up outside the network. That scaling factoris called the criticql scaling factor and the network is said to be operating at its capacity.Then multiple simulation runs can be performed at the critical scaling factor to determinethe network capacity.
104