
Assessment and evaluation of MV image guidance system ...
10
reports of practical oncology and radiotherapy 2 0 ( 2 0 1 5 ) 188–197 Available online at www.sciencedirect.com ScienceDirect jo ur nal home p ag e: http://www.elsevier.com/locate/rpor Original research article Assessment and evaluation of MV image guidance system performance in radiotherapy Nithya Kanakavelu a,b,c,∗ , E. James Jebaseelan Samuel b,d a Department of Radiation Oncology, Medwin Cancer Center, Hyderabad, India b Photonics, Nuclear and Medical Physics Division, VIT University, Vellore, India a r t i c l e i n f o Article history: Received 22 May 2014 Received in revised form 19 August 2014 Accepted 15 January 2015 Keywords: Image guidance system Quality assurance Megavoltage imaging a b s t r a c t Background and aim: The clinical use of imaging system in image guided radiotherapy (IGRT) necessitates performing periodic quality assurance of the system to be confident in applying corrections for patient set-up errors. We aim to develop and implement a quality assurance (QA) programme for megavoltage (MV) based image guidance system and assess its long term performance for a period of 3 years. Materials and methods: Periodic QA tests were performed for the MV planar and cone beam computed tomography (CBCT) imaging system to assess the system safety, mechanical and geometrical accuracy, image quality and dose. The tests were performed using the equip- ment supplied by the manufacturer along with the image guidance system and using simple methods developed in-house. The test results were compared with expected or baseline values established during commissioning. Results: The safety system was found to be functional. The results of mechanical and geo- metrical tests were in good agreement with the expected results. The system mechanical positioning was stable and reproducible within ±2 mm accuracy. The image quality and the imaging dose of the planar and CBCT imaging were found to agree with the baseline values and the manufacturer specifications. Discussion: Throughout the three-year period, all the QA tests were within the specification. The mechanical and geometrical tests are most crucial as they directly affect the patient positioning accuracy. Conclusion: We conclude that the MV image guidance system is efficient to perform IGRT and insist to perform periodic QA tests and calibration for the system. © 2015 Greater Poland Cancer Centre. Published by Elsevier Sp. z o.o. All rights reserved. ∗ Corresponding author. Present address: Photonics, Nuclear and Medical Physics Division, VIT University, Vellore 632 014, India. Tel.: +91 9618015142. E-mail address: [email protected] (N. Kanakavelu). c Address: Department of Radiation Oncology, Medwin Cancer Center, Hyderabad 500 001, India. d Address: Photonics, Nuclear and Medical Physics Division, VIT University, Vellore 632 014, India. Tel.: +91 0416 2202125. http://dx.doi.org/10.1016/j.rpor.2015.01.002 1507-1367/© 2015 Greater Poland Cancer Centre. Published by Elsevier Sp. z o.o. All rights reserved.
Transcript of Assessment and evaluation of MV image guidance system ...

reports of practical oncology and radiotherapy 2 0 ( 2 0 1 5 ) 188–197
Available online at www.sciencedirect.com
ScienceDirect
jo ur nal home p ag e: ht tp : / /www.e lsev ier .com/ locate / rpor
Original research article
Assessment and evaluation of MV image guidancesystem performance in radiotherapy
Nithya Kanakavelua,b,c,∗, E. James Jebaseelan Samuelb,d
a Department of Radiation Oncology, Medwin Cancer Center, Hyderabad, Indiab Photonics, Nuclear and Medical Physics Division, VIT University, Vellore, India
a r t i c l e i n f o
Article history:
Received 22 May 2014
Received in revised form
19 August 2014
Accepted 15 January 2015
Keywords:
Image guidance system
Quality assurance
Megavoltage imaging
a b s t r a c t
Background and aim: The clinical use of imaging system in image guided radiotherapy (IGRT)
necessitates performing periodic quality assurance of the system to be confident in applying
corrections for patient set-up errors. We aim to develop and implement a quality assurance
(QA) programme for megavoltage (MV) based image guidance system and assess its long
term performance for a period of 3 years.
Materials and methods: Periodic QA tests were performed for the MV planar and cone beam
computed tomography (CBCT) imaging system to assess the system safety, mechanical and
geometrical accuracy, image quality and dose. The tests were performed using the equip-
ment supplied by the manufacturer along with the image guidance system and using simple
methods developed in-house. The test results were compared with expected or baseline
values established during commissioning.
Results: The safety system was found to be functional. The results of mechanical and geo-
metrical tests were in good agreement with the expected results. The system mechanical
positioning was stable and reproducible within ±2 mm accuracy. The image quality and the
imaging dose of the planar and CBCT imaging were found to agree with the baseline values
and the manufacturer specifications.
Discussion: Throughout the three-year period, all the QA tests were within the specification.
The mechanical and geometrical tests are most crucial as they directly affect the patient
positioning accuracy.
Conclusion: We conclude that the MV image guidance system is efficient to perform IGRT and
insist to perform periodic QA tests and calibration for the system.
© 2015 Greater Poland Cancer Centre. Published by Elsevier Sp. z o.o. All rights reserved.
∗ Corresponding author. Present address: Photonics, Nuclear and MedicTel.: +91 9618015142.
E-mail address: [email protected] (N. Kanakavelu).c Address: Department of Radiation Oncology, Medwin Cancer Cented Address: Photonics, Nuclear and Medical Physics Division, VIT Univ
http://dx.doi.org/10.1016/j.rpor.2015.01.0021507-1367/© 2015 Greater Poland Cancer Centre. Published by Elsevier
al Physics Division, VIT University, Vellore 632 014, India.
r, Hyderabad 500 001, India.ersity, Vellore 632 014, India. Tel.: +91 0416 2202125.
Sp. z o.o. All rights reserved.

radio
1
WtgpaiippaawsaTtoop
2
2
TEtCcgep(waTCw
Fe
reports of practical oncology and
. Background and aim
ith the advances in in-room imaging system, image guidedreatment has become routine in radiotherapy centres. Imageuided radiotherapy (IGRT) offers benefits in monitoring theatient treatment positional accuracy, set-up uncertaintiesnd inter-fraction anatomy changes.1–4 The clinical use of themage guidance system necessitates implementing a qual-ty assurance (QA) programme to monitor and maintain itserformance characteristics. Several guidelines have beenublished for the QA programme to verify the safety, function-lity and quality of the imaging system.5–7 In our centre, safend accurate patient positioning is our requirement to achieveith the image guidance (IG) system. Thus, the IG system
afety, mechanical and geometrical accuracy, image qualitynd imaging dose to patient need to be assessed periodically.herefore we implemented a QA programme to evaluate all
hese criteria. In this work, we share our experience in devel-ping and implementing the QA programme for a long termf 3 years for image guidance system based on manufacturerrovided test methods8 and published guidelines.
. Materials and methods
.1. Medical linear accelerator and imaging system
he Medical high energy linear accelerator, Siemens OncorxpressionTM equipped with the imaging guidance (IG) sys-em, (OPTIVUE 1000STTM, Siemens Medical solutions Inc.,oncord, CA) used for megavoltage planar and cone beamomputed tomography (MV CBCT) imaging, is attached to theantry at the counter-part of the head of the linear accel-rator, as shown in Fig. 1. The IG system consists of flatanel detectors which have sensors of amorphous silicon
a-Si) photo diodes that are deposited on a glass substrateith a scintillator coating. The pixels have a pitch of 400 �m
nd there are 1024 × 1024 pixels covering a 40 × 40 cm2 area.
he entire imaging system operates under SYNGOTM basedOHERENCETM therapist workspace which communicatesith the control console, the linear accelerator, and a localig. 1 – The Siemens Oncor Expression linear acceleratorquipped with OPTIVUE imaging system.
therapy 2 0 ( 2 0 1 5 ) 188–197 189
patient database. The workspace contains applications allow-ing the automatic acquisition of projection images, imagereconstruction, CT-to-CBCT image registration, and couchposition adjustment. Each projection of the CBCT acquisitionis corrected for defective pixels, as well as for pixel-to-pixel offset and gain variations before 3D reconstruction. Theimager uses 6 MV low dose rate 50 MU/min beam to acquireMV planar images. MV CBCT images are acquired in a conebeam mode, where the 6 MV, low dose rate beam is rotated200◦ from 270◦ to 110◦ and 200 projection images are acquiredon the flat panel in 1◦ steps. The cone beam has lower doseper radiation pulse and higher radiation pulse repetition fre-quency when compared to regular 6 MV treatment beam. TheIG system imager calibration, image acquisition, reconstruc-tion procedure and clinical use are mentioned elsewhere.1,8–11
2.2. Equipment for QA
X-ray reticule: The X-ray reticule (named ‘X-RETIC’) consists oftwo orthogonal radio-opaque tungsten wires, shown in Fig. 2,which can be inserted in an accessory slot in the gantry head.It is calibrated such that the intersection of the two wires cor-responds exactly to the mechanical isocentre and is used toalign the phantoms at the isocentre and to determine the coin-cidence between the accelerator isocentre and the imagingcentre of the flat panel imager.
QC 3V phantom: The QC-3V phantom (Standard Imaging,Inc. USA), as shown in Fig. 2, consists of a series of bar patterns,used for measuring spatial resolution and contrast-to-noiseratio. Four large numbers engraved in the corners provide acrude visual feedback but are not used for analysis. Lines areinscribed on the front and sides for easy alignment with fieldlights and lasers. Planar images are acquired with the flatpanel imager and analysed with the portal image processingprogramme.
Image quality phantom: The image quality phantom(Siemens Medical Solutions, Concord, CA), as shown in Fig. 2,is a cylindrical acrylic shell of diameter 20 cm with four solidwater sections positioned axially within the shell. Section1 is purely made of solid water of thickness 4 cm withoutany inserts and used to check image uniformity, noise andartefacts. Sections 2 and 4 consists of 5 circular inserts of 8different density materials with diameter 2, 1, 0.7, 0.5 and0.3 cm used to check low and high contrast resolution. Section3 contains 11 bar groups and each bar group contains 5 air barsto evaluate spatial resolution. The sections 2, 3, and 4 are ofthickness 2 cm each. In the outer shell, three axial planes (atthe centre, head and foot of the phantom) have four tungstenbeads arranged at 12, 3, 6 and 9 o’clock positions to determinethe geometric positional accuracy of the CBCT image.
2.3. Imaging system QA programme
To assess and evaluate the performance of the imaging sys-tem, a periodic quality assurance programme was developed.
The QA tests, frequencies and tolerances are given in Table 1.In this study, these tests were performed for a period of 3years and the results were evaluated for its accuracy andconsistency. The baseline values of these tests were defined
190 reports of practical oncology and radiotherapy 2 0 ( 2 0 1 5 ) 188–197
pha
Fig. 2 – Equipment for QA: X-RETIC (left), QC 3Vduring the acceptance testing and commissioning of the MVimager.
2.4. Safety interlock checks
Collision sensors are provided between the flat panel detec-tor and outer cover. A safety interlock is triggered when aslight pressure is applied on the outer cover. The interlock waschecked by applying a slight pressure with hands on any of thefour corners of the flat panel cover and verifying the activationof the motion stop interlock which restricts all the mechani-cal movements of the machine. With the motion stop interlockactivated, restriction of gantry, couch and imager mechanicalmovements were verified. The functionality of the door inter-lock was verified by introducing an object between the doorsensors during image acquisition, which should turn off thebeam.
2.5. Mechanical and geometric accuracy tests
Imager positioning/repositioning: The imager positioning accu-racy and reproducibility are significant in the patienttreatment position verification. A graph sheet was fixed over
Table 1 – QA tests for image guidance system.
Frequency QA test Tolerance
Daily Safety checks FunctionalImagerpositioning/repositioning
±1 mm
Imaging and treatmentco-ordinate coincidence(single gantry angle)
±1 mm
Monthly Imaging and treatmentco-ordinate coincidence (4cardinal gantry angles)
±1 mm
Image scaling ±2 mmMechanical alignment – fullrange of travel
±2 mm
Geometric accuracy forCBCT
±2 mm
Automatic imageregistration and offsetcalculation accuracy
±2 mm
Image quality – planar andCBCT
Baseline ± 5%
Annual Imaging dose Baseline ± 3%
ntom (middle), image quality phantom (right).
a 1 cm thick 30 × 30 cm2 slab phantom and its centre alignedwith the treatment isocentre. Five radio-opaque markers wereplaced at known distances on the graph sheet with onemarker at the centre and the other four at the four cor-ners of a 10 × 10 cm2 area. A planar image was acquiredwith 15 × 15 cm2 field size, gantry angle of 0◦ and imagerpositioned at the source to imager distance (SID) of 145 cm.Then, the imager was retracted, repositioned at the sameSID and imaged again. The distance between the markerswas measured with the measurement tool (ruler) available inthe ‘Coherence Therapist’ system workspace. The actual dis-tances of the 5 markers from the isocentre were comparedwith the measured distance in the MV images acquired ini-tially and after repositioning the imager.
Imaging and treatment co-ordinate coincidence: The accuracyof patient position also depends on the precision with whichthe imaging co-ordinate axis is aligned to the treatment co-ordinate axis. Even though the physical position of the imageris exactly set with respect to the mechanical isocentre ofthe machine, residual misalignment must also be accounted.The X-RETIC, as described in Section 2.2, was inserted in themachine accessory slot. A series of MV planar images weretaken at four cardinal gantry angles 0◦, 90◦, 180◦ and 270◦ at SID145 cm. The position of the projected X-RETIC wires representsthe treatment co-ordinate axis, while the imaging co-ordinateaxis can be graphically visualised in the Coherence thera-pist system using a ‘grid display’ option. The misalignmentbetween the two axes at four gantry positions was measuredwith the measurement tool available in the system workspace.
Image scaling: The same set-up used for imaging position-ing/repositioning was used to evaluate the scaling accuracy.MV images were acquired at different SID such as 115, 125,135, 145, 150 and 160 cm. As all the radio-opaque markerswere at known distances from each other, the acquired MVimages were checked for corresponding distances between themarkers.
Mechanical alignment through full range of imager travel: TheMV flat panel imager can be moved vertically along the beamaxis with SID between 115 and 160 cm. Throughout this range,the alignment of the imager with the mechanical isocentrewas verified. With the imager at calibration SID of 145 cm,a graph sheet was fixed on the imager and the centre of X-RETIC projection was marked on it. The flat panel was moved
through a range of SIDs 115, 125, 135, 145, 150, 160 cm andat each position the lateral, longitudinal shifts in the markedposition from X-RETIC projection were measured. Also at each
radiotherapy 2 0 ( 2 0 1 5 ) 188–197 191
Si
turptpipb
Tswmswdl(tttCmCccvkttw
2
2StwtTpruc
2Ttsaow(1a
Fig. 3 – Five ROIs marked on central slice in section 1 of theimage quality phantom to measure uniformity and noise.The means and standard deviations in pixel values of the
reports of practical oncology and
ID, the vertical distance between the flat panel cover andsocentre was measured, using a measuring tape.
Geometric accuracy for CBCT: The tungsten beads at the cen-re, head and foot of the image quality phantom, as describednder Section 2.2 was used to verify geometric positional accu-acy for CBCT images. MV CBCT images were acquired with thehantom aligned at the machine isocentre. In the Adaptiveargeting application of Coherence workspace, the referenceoint cursor was placed at the centre of each bead in the CBCT
mage to read the three dimensional co-ordinate of each beadosition and compared with the actual known position of eachead.
Automatic image registration and offset calculation accuracy:he Adaptive Targeting application of Coherence Therapistystem automatically registers planning CT image data setith the acquired CBCT image data set based on mutual infor-ation algorithm. On acceptance of image registration, the
oftware displays the table offset for correction. Its accuracyas checked by introducing a known off-set between the twoatasets. Image quality phantom was scanned on a CT simu-
ator, a simple plan was made in a treatment planning systemTPS) with planning isocentre coinciding with the centre ofhe phantom and the planning CT data set was exported tohe Coherence workstation. The phantom was set-up withhe planned isocentre coinciding with the machine isocentre.BCT images were acquired and the system started auto-atic registration of acquired CBCT images and the planning
T images. The registration was visually verified in the axial,oronal and sagittal views and, when accepted, the system cal-ulated and displayed the offset in the lateral, longitudinal andertical directions. The CBCT scans were repeated for differentnown shifts introduced to the CBCT images by shifting theable in the lateral, longitudinal and vertical directions. Eachime the system computed offset from automatic registrationas noted and compared with the applied table offset.
.6. Image quality checks
.6.1. MV planar Imagingpatial resolution and contrast-to-noise ratio: The spatial resolu-ion and the contrast to noise ratio of the planar MV imagesere evaluated by acquiring the planar image of QC-3V phan-
om, placed on the surface of the imager at SID 130 cm.he obtained images were evaluated automatically using theortal image processing programme to calculate the spatialesolution and the contrast-to-noise ratio. The obtained val-es were compared to the baseline values measured duringommissioning.
.6.2. MV CBCT imaginghe image quality phantom, shown in Fig. 2 was used to assess
he image quality of CBCT image, such as uniformity, noise,patial resolution and contrast resolution. The phantom wasligned with the machine isocentre using the lines engravedn the phantom, X-RETIC and room lasers. MV CBCT images
ere acquired to encompass the entire phantom, with 15 MUmonitor unit) acquisition protocol and reconstructed with mm slice thickness, 1 mm2 pixel size and smoothing headnd neck filter.
five ROIs were within our specifications.
Uniformity and noise: The uniform solid water, section 1 ofthe image quality phantom was used to evaluate image noiseand uniformity. On the CBCT image of this section, five cir-cular regions of interest (ROIs) were drawn; one in the centreand four in the periphery at 12, 3, 6, and 9 o’clock positions,as shown in Fig. 3. For each of the 5 ROIs, the mean and thestandard deviation of the pixel values were used to determinethe image uniformity and noise in the CBCT image, respec-tively. The images were visually checked for artefacts. Theobtained results were compared against baseline results.
Contrast resolution for CBCT: The image quality phantom’slow and high contrast sections 2 and 4 have inserts of 8 dif-ferent density material embedded on solid water backgroundSIG (standard imaging grade). Each material has six inserts ofcircular dimensions of diameter 20, 10, 7, 5 and 3 mm. Therelative electron density of each material with respect to thebackground is known, given in Table 2. On the acquired CBCTimages, the number of inserts visible for each material wasnoted by adjusting the window and width of the image forbetter visualisation. These were compared with the baselinevalues.
Spatial resolution for CBCT: The spatial resolution section 3 ofthe image quality phantom consists of 11 bar groups with dif-ferent resolution and five bars in each group. The dimensionsof bars in each group are given in Table 3. On the CBCT imageof this section, the number of bar groups in which all the barsare visible were counted and compared with the baseline.
2.6.3. Imaging doseThe portal imaging low dose rate output and cone beam
output were checked monthly as part of routine output cal-ibration. The beam output was calibrated routinely to deliver1 cGy/MU with ±2% accuracy. The imaging dose from clinicallyused imaging protocols in MV planar and CBCT imaging was
192 reports of practical oncology and radiotherapy 2 0 ( 2 0 1 5 ) 188–197
Table 2 – Characteristics of insert materials in sections 2 and 4 of the image quality phantom.
Phantom section Material Physical density(g/cc)
Electron densityrelative to
background
No. of insertsvisible
Size of smallest visibleinsert (mm)
2 SIG – background 1.02 1 – –2 1% SIG 1.03 1.01 1 202 3% SIG 1.05 1.03 1 202 Brain 1.05 1.05 3 72 Liver 1.09 1.07 4 54 SIG – background 1.02 1 - -4 Inner bone 1.14 1.09 4 54 Acrylic 1.18 1.17 4 54 Bone – 50% CaCO3 1.56 1.48 5 34 Air 0.0012 0.001 5 3
Table 3 – Bar group properties in section 3 of the image quality phantom Imaging dose.
Visible no. of bar groups Width (mm) Height (mm) Corresponding spatial resolution(lp/mm)
1 7.5 12.0 0.0672 5.0 12.0 0.13 3.3 12.0 0.154 2.5 12.0 0.25 2.0 12.0 0.256 1.67 12.0 0.37 1.25 12.0 0.48 1.0 10.0 0.5
expected and observed position of the beads. In all the threedirections the results were within the tolerance of ±2 mmthroughout the 3 year period.
Table 4 – Results showing the positioning/repositioningaccuracy of the imager.
Marker Mean variation ± standard deviation (mm)
Positioningaccuracy
Repositioningaccuracy
1 0.2 ± 0.3 0.0 ± 0.0
9 0.83
10 0.62
11 0.50
evaluated annually, using a 0.6cc farmer ionisation chamberplaced in the centre of a solid water phantom of dimensions30 × 30 × 30 cm3, with the chamber positioned at the treat-ment isocentre. A pair of orthogonal MV images was acquiredwith 2 MUs for each image and dose from each set-up ver-ification image was measured. MV cone beam images wereacquired with 6, 8 and 15 MU protocols and the accumulateddose for each protocol was measured.
3. Results
3.1. Safety interlock checks
The collision and safety interlocks were checked and veri-fied daily and were found to be functional. All the mechanicalmovements of the machine were restricted with the motionstop interlock activated. The door interlock was functionalwhen interrupted during imaging.
3.2. Mechanical and geometric tests
Imager positioning/repositioning: The positioning accuracy ofthe imager was measured with the variation between theexpected and measured distances of the five markers from theisocentre. The repositioning accuracy was measured with thevariations in the markers positions between the two images
acquired before and after repositioning. The results were aver-aged for 3 years and presented in Table 4. It can be observedthat the imager positioning accuracy and reproducibility waswithin ±1 mm.6.6 0.65.0 0.84.5 1
Imaging and treatment co-ordinate coincidence: Fig. 4 showsthat the misalignment of the MV planar image centre withthe treatment beam isocentre was less than ±1 mm. Themean and standard deviation of misalignment at gantry angle0◦, 90◦, 180◦ and 270◦ were 0.49 ± 0.14 mm, 0.57 ± 0.16 mm,0.46 ± 0.16 mm and 0.54 ± 0.14 mm, respectively for a periodof 3 years.
Image scaling: This test was performed monthly for 3 yearsby imaging the radio-opaque markers at known distancesfrom each other, at different SIDs between 115 and 160 cm. Themean variation between the measured and actual distancewas 0.5 ± 0.6 mm, over a period of 3 years.
Mechanical alignment through full range of imager travel: Fig. 5shows that the flat panel mechanical misalignment waswithin 1 mm along any direction over a period of 3 years.
Geometric accuracy: Fig. 6 shows the variation between the
2 0.1 ± 0.7 0.0 ± 0.13 0.2 ± 0.7 0.1 ± 0.14 0.4 ± 0.5 0.1 ± 0.15 0.1 ± 0.4 0.0 ± 0.1
reports of practical oncology and radiotherapy 2 0 ( 2 0 1 5 ) 188–197 193
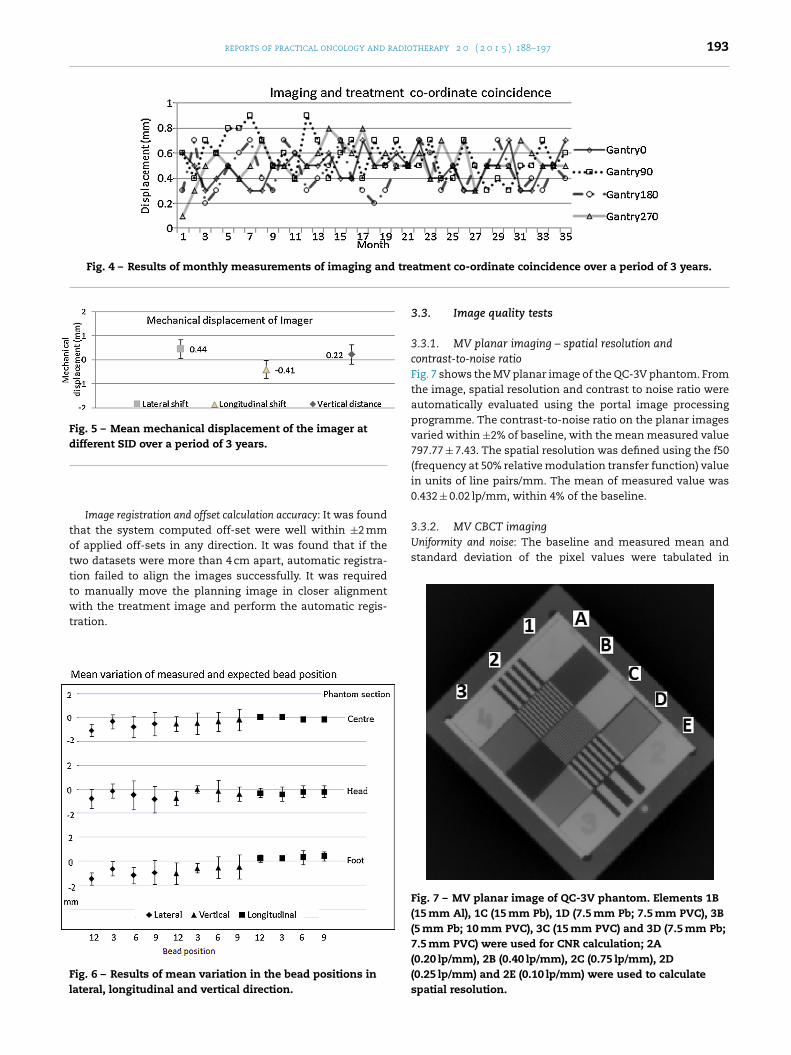
Fig. 4 – Results of monthly measurements of imaging and tre
Fig. 5 – Mean mechanical displacement of the imager atdifferent SID over a period of 3 years.
totttwt
Fl
3.3.2. MV CBCT imagingUniformity and noise: The baseline and measured mean andstandard deviation of the pixel values were tabulated in
Image registration and offset calculation accuracy: It was foundhat the system computed off-set were well within ±2 mmf applied off-sets in any direction. It was found that if thewo datasets were more than 4 cm apart, automatic registra-ion failed to align the images successfully. It was requiredo manually move the planning image in closer alignmentith the treatment image and perform the automatic regis-
ration.
ig. 6 – Results of mean variation in the bead positions inateral, longitudinal and vertical direction.
atment co-ordinate coincidence over a period of 3 years.
3.3. Image quality tests
3.3.1. MV planar imaging – spatial resolution andcontrast-to-noise ratioFig. 7 shows the MV planar image of the QC-3V phantom. Fromthe image, spatial resolution and contrast to noise ratio wereautomatically evaluated using the portal image processingprogramme. The contrast-to-noise ratio on the planar imagesvaried within ±2% of baseline, with the mean measured value797.77 ± 7.43. The spatial resolution was defined using the f50(frequency at 50% relative modulation transfer function) valuein units of line pairs/mm. The mean of measured value was0.432 ± 0.02 lp/mm, within 4% of the baseline.
Fig. 7 – MV planar image of QC-3V phantom. Elements 1B(15 mm Al), 1C (15 mm Pb), 1D (7.5 mm Pb; 7.5 mm PVC), 3B(5 mm Pb; 10 mm PVC), 3C (15 mm PVC) and 3D (7.5 mm Pb;7.5 mm PVC) were used for CNR calculation; 2A(0.20 lp/mm), 2B (0.40 lp/mm), 2C (0.75 lp/mm), 2D(0.25 lp/mm) and 2E (0.10 lp/mm) were used to calculatespatial resolution.

194 reports of practical oncology and radiotherapy 2 0 ( 2 0 1 5 ) 188–197
Table 5 – Results of uniformity and noise measurements for MV CBCT image.
ROI Acceptable range Baseline Measureda
Mean ROIcentre (−30, +42) −15.9 −13.5 ± 1.2SD ROIcentre (−30, +42) 34.2 32.6 ± 2.7Mean ROIperiphery(9 o′clock) − ROIcentre (−80, +80) 10.2 10.9 ± 1.4Mean ROIperiphery(3 o′clock) − ROIcentre (−80, +80) 6.5 5.4 ± 1.5Mean ROIperiphery(6 o′clock) − ROIcentre (−80, +80) 26.7 25.4 ± 2.8
.
Mean ROIperiphery(12 o′clock) − ROIcentre (−80, +80)
a Mean ± standard deviation of measured value for the 3 years period
Table 5. The results show that the measured values are wellwithin the acceptable range specified by the manufacturer.Also there was no visual evidence of artefacts in the image.
Contrast resolution: Fig. 8 shows the low and high contrastsection 2 and 4 axial CBCT images of image quality phantom.The contrast resolution of the MV CBCT images were mea-sured monthly and the visible number of inserts agreed withthe baseline throughout the period of 3 years. The numberof inserts visible and the material densities are tabulated inTable 2. For the clinically used 6, 8 and 15 MU imaging proto-cols, the objects of size less than 2 cm with contrast 1% and3% of background were not visible.
Spatial resolution: Spatial resolution was checked monthlyby counting the number of visible bar groups in the CBCTimage of the phantom section 3, as shown in Fig. 9. Six bargroups were completely visible, which corresponds to spatialresolution of 0.3 lp/mm (line pairs per mm), as given in Table 3and these results were found to match the baseline. Generally,the spatial resolution can be increased by decreasing the pixelsize, but at the cost of increased image reconstruction time.
3.3.3. Imaging doseThe MV planar dose measurements were performed annuallyand compared with the baseline values. The dose accumu-lated at the isocentre from the orthogonal MV images waswithin 3% of the baseline throughout the 3 year period. ForMV CBCT dose measurements, the dose at the isocentre waswithin 3% of the baseline throughout the 3 year period. Themean of the dose measured for the 3 years is tabulated inTable 6.
4. Discussion
In this study, we share our three years’ experience in thedevelopment and implementation of a quality assurance pro-gramme of the MV image guidance system on Siemens Oncor
Table 6 – Imaging dose at isocentre for different imagingprotocols.
Imaging protocol Dose at isocentre (cGy)
Baseline Mean ± SD ofmeasured dose
6 MU protocol 5.05 5.03 ± 0.128 MU protocol 6.14 6.10 ± 0.0815 MU protocol 9.97 10.07 ± 0.15Orthogonal MV
planar – 2 MU each2.99 2.98 ± 0.07
−14.2 −13.9 ± 2.4
Expression linear accelerator. The QA tests include the systemsafety, mechanical and geometrical accuracy, image qualityand dose performed for the MV planar and CBCT system.The tests were performed using the QA equipment suppliedby the manufacturer along with the image guidance systemand using simple methods developed in-house, such that thetests can be performed without further cost for QA equip-ment. Initially the tests were performed more frequently thanspecified by the manufacturer to ensure stable characteris-tics of the imaging system. The data collected from the QAtests in the initial year were used as the basis for establish-ing the tolerance from the baseline value established duringcommissioning.
The system safety interlocks were checked daily for itsfunctionality for safe clinical use. The Flat Panel imagerrequires daily initialisation before use. It was noted that onsome occasions, the system gives collision interlock falsely,needs to be brought back to the home position manuallyand restart the initialisation. In such cases, additional careis required while performing daily mechanical tests to checkfor any misalignments.
Since the mechanical alignment of the imager with treat-ment beam is crucial for evaluating patient set-up errors, themechanical checks are considered the most important amongall tests. During installation of the imager, the machine serviceEngineers aligned the imager within ±1 mm accuracy and theresidual errors were corrected using accurate positional cal-ibration of imager and verified by the Physicist. The imagerpositional calibration data can be stored in any storage mediaand kept as a backup. The imager positioning test and imag-ing and isocentre co-ordinate coincidence test were performeddaily for zero gantry angle and monthly for the other threecardinal gantry angles. Our results show excellent agreement,within ±1 mm with respect to the expected value. During oneof our routine image alignment checks, we found that theimage was misaligned by a small angle of around 0.3◦ while theimaging centre matched with the treatment isocentre. Whenthe imager protective cover was removed to check the physicalalignment, we noticed that the imager was rotated by a smallangle and was then corrected. Special care should be takenwhen working near the imager to avoid any object falling onthe imager accidentally.
The MV CBCT image quality is poorer than the conven-tional kV (kilo voltage) beam image quality, but sufficientto successfully perform automatic image registration within
2 mm accuracy and help visualise soft tissues and bonystructures for the set-up verification and anatomy changesaround the tumour.12 Poor image quality is not intrinsi-cally responsible for errors in patient positioning, but may
reports of practical oncology and radiotherapy 2 0 ( 2 0 1 5 ) 188–197 195
Fig. 8 – (a) Low contrast section 2, (b) high contrast section 4 of the image quality phantom. Each section has inserts of fourdifferent materials: (1) 1% SIG, (2) 3% SIG, (3) brain, (4) liver, (5) inner bone, (6) acrylic, (7) air and (8) CB2 (bone – 50% CaCO3).These material characteristics are given in Table 2. (c) MV CBCT image of section 2 and (d) MV CBCT image of section 4 ofi col.
cpr
rccu
Fp
mage quality phantom, acquired with 15 MU imaging proto
ause misalignments during the image registration betweenlanning and cone beam CT data set in the soft tissueegion.
For optimal image quality performance, the MV systemequires periodic 2D gain calibration, cone beam geometric
alibration and dead pixel map correction. We perform thesealibrations every four weeks as recommended by the man-facturer. It is also important to perform these calibrationig. 9 – (a) Spatial resolution section 3 of the image quality phaner millimetre are inserted in this section. (b) MV CBCT image of
procedures and QA tests after major repairs of the imagingsystem.
We used 15 MU protocol on image quality phantom for test-ing the image quality of MV CBCT images. There was no muchnoticeable difference in the image quality in the low MU (6 or
8 MU) protocols. This is because of smaller phantom size usedfor our tests. Imaging pelvic region requires more MUs thanimaging the head and neck for good image quality because oftom. Eleven bar groups with different numbers of line pairs section 3, acquired with a 15 MU protocol.

d rad
r
1
1
1
1
1
1
1
1
1
1
196 reports of practical oncology an
the variation in off-axis response of the imager detectors.13 Fora good quality image, we require higher MU protocol, whichincreases patient dose. It is possible to incorporate the patientdose into treatment plan to eliminate the extra dose used forhigh quality image guidance.14,15 Since we did not intend touse the CBCT images for dose calculation in treatment plan-ning, we did not perform HU CT calibration for CBCT imagesas part of the quality assurance programme. We suggest per-forming HU calibration monthly to use the CBCT images fordose calculation.
The low dose rate 50 MU/min output and cone beam out-put, which are used for image acquisition, were calibratedmonthly to deliver 1 cGy/MU, for 10 × 10 cm2 field size at depthof maximum dose. The planar and CBCT imaging dose at theisocentre, measured annually with ionisation chamber at thecentre of the 30 × 30 × 30 cm3 slab phantom were within 3%of baseline dose values. We measure this to check the consis-tency in the dose delivered during imaging. In our QA testswe did not intend to measure the dose for patient in eachimaging protocol. The QA programme can be improved bymeasuring patient imaging dose for specific sites such as thehead & neck and pelvis, in anthropomorphic phantom usingionisation chambers, radiochromic films or TLDs.16
There are several clinical applications with the use of imageguidance system. Few examples are: (i) it provides imageguidance to determine the target position with respect totreatment beam17,18; (ii) it is used to estimate the patientpositioning uncertainties and to justify the CTV-PTV marginfor different sites19; (iii) it is used in dose calculation20 andexit dosimetry to predict the dose delivered to the patient ineach fraction21; (iv) it is used to investigate the changes inthe tumour volume and thereby determine the requirementfor adaptive planning22; (v) it provides 3D anatomic informa-tion without artefacts for patients with implanted metallicobjects.23
The periodic calibration and QA of imaging system givesconfidence to apply IGRT clinically.
5. Conclusion
The MV imaging system provides 2D planar and 3D volu-metric cone beam images for radiotherapy patient treatmentsetup verification and inter-fractional anatomy changes in thepatient treatment course. In this study, we have developedand implemented the quality assurance programme for theimage guidance system. We have studied the safety, geomet-ric precision and image quality to use the system clinically.We conclude that the MV image guidance system performanceis adequately accurate to perform IGRT and insist to performperiodic quality assurance tests and calibration for the system.
Conflict of interest
None declared.
Financial disclosure
None declared.
2
iotherapy 2 0 ( 2 0 1 5 ) 188–197
e f e r e n c e s
1. Morin O, Gillis A, Chen J, et al. Megavoltage cone-beam CT:system description and clinical applications. Med Dosim2006;31:51–61.
2. Jaffray DA, Siewerdsen JH, Wong JW, Martinez AA. Flat-panelcone-beam computed tomography for image-guidedradiation therapy. Int J Radiat Oncol Biol Phys 2002;53:1337–49.
3. Lee C, Langen KM, Lu W, et al. Assessment of parotid glanddose changes during head and neck cancer radiotherapyusing daily megavoltage computed tomography anddeformable image registration. Int J Radiat Oncol Biol Phys2008;71:1563–71.
4. Bylund KC, Bayouth JE, Smith MC, et al. Analysis ofinterfraction prostate motion using megavoltage cone beamCT. Int J Radiat Oncol Biol Phys 2008;72:949–56.
5. Klein EE, Hanley J, Bayouth J, et al. Quality assurance ofmedical accelerators: report of AAPM Radiation TherapyCommittee Task Group 142. Med Phys 2009;36:4197–212.
6. Bissonnette J-P. Quality assurance of image-guidancetechnologies. Semin Radiat Oncol 2007;17:278–86.
7. Herman MG, Balter JM, Jaffray DA, et al. Clinical use ofelectronic portal imaging: report of AAPM Radiation TherapyCommittee Task Group 58. Med Phys 2001;28:712–37.
8. MVision Physicist self-led training. Siemens Medicalsolutions, Inc.: Concord, CA.
9. Pouliot J, Bani-Hashemi A, Chen J, et al. Low-dosemegavoltage cone-beam CT for radiation therapy. Int J RadiatOncol Biol Phys 2005;61:552–60.
0. Olivier G, Moyed M. Commissioning and clinicalimplementation of a mega-voltage cone beam CT system fortreatment localization. Med Phys 2007;34:3183–92.
1. Abou-elenein HS, Attalla EM, Ammar H, et al. Megavoltagecone beam computed tomography: commissioning andevaluation of patient dose. J Med Phys 2011;36:205–12.
2. Dabrowska SZ, Kukołowicz PF, Szebek PC, et al. Comparisonof image registration performed with MV cone beam CT andCT on rails and Syngo TM Adaptive Targeting software. RepPract Oncol Radiother 2009;14:122–32.
3. Morin O, Aubry JF, Aubin M, et al. Physical performance andimage optimization of megavoltage cone-beam CT. Med Phys2009;36:1421–32.
4. Morin O, Gillis A, Descovich M, et al. Patient doseconsiderations for routine megavoltage cone-beam CTimaging. Med Phys 2007;35:1819–27.
5. Miften M, Gayou O, Reitz B, et al. IMRT planning and deliveryincorporating daily dose from mega-voltage cone-beamcomputed tomography imaging. Med Phys 2007;34:3760–7.
6. Gayou O, Parda DS, Johnson M, et al. Patient dose and imagequality from mega-voltage cone beam computed tomographyimaging. Med Phys 2007;34:499–506.
7. Packard M, Kirichenko A, Gayou O, et al. Use of implantedgold fiducial markers with MV-CBCT image guided IMRT forpancreatic tumors. Pract Radiat Oncol 2013;3:S14–5.
8. Paluska P, Hanus J, Sefrova J, et al. Utilization of cone-beamCT for offline evaluation of target volume coverage duringprostate image-guided radiotherapy based on bony anatomyalignment. Rep Pract Oncol Radiother 2012;17:134–40.
9. Juan-Senabre XJ, López-Tarjuelo J, Conde-Moreno A, et al.Uncertainties and CTV to PTV margins quantitativeassessment using cone-beam CT technique in clinicalapplication for prostate, and head and neck irradiation
tumours. Clin Transl Oncol 2011;13:819–25.0. Morin O, Chen J, Aubin M, et al. Dose calculation usingmegavoltage cone-beam CT. Int J Radiat Oncol Biol Phys2007;67:1201–10.

radio
2
2
2radiotherapy using mega-voltage cone-beam computed
reports of practical oncology and
1. Chen J, Morin O, Aubin M, et al. Dose-guided radiationtherapy using megavoltage cone-beam CT. Br J Radiol
2006;79:S87–98.2. Foroudi F, Wong J, Haworth A, et al. Offline adaptiveradiotherpy for bladder cancer using cone beam computedtomography. J Med Imag Radiat Oncol 2009;53:226–33.
therapy 2 0 ( 2 0 1 5 ) 188–197 197
3. Hansen EK, Larson DA, Aubin M, et al. Image-guided
tomography for treatment of paraspinous tumors in thepresence of orthopedic hardware. Int J Radiat Oncol Biol Phys2006;66:323–6.