ASSESSMENT AND ACCOUNTABILITY REPORT - Edl · ASSESSMENT AND ACCOUNTABILITY REPORT ... – Base...
93
Educational Services ASSESSMENT AND ACCOUNTABILITY REPORT Educational Services Department September 2011 Standardized Testing and Reporting (STAR)
Transcript of ASSESSMENT AND ACCOUNTABILITY REPORT - Edl · ASSESSMENT AND ACCOUNTABILITY REPORT ... – Base...
Educational Services
ASSESSMENT AND
ACCOUNTABILITY REPORT
Educational Services Department
September 2011
Standardized Testing and Reporting (STAR)
Educational Services
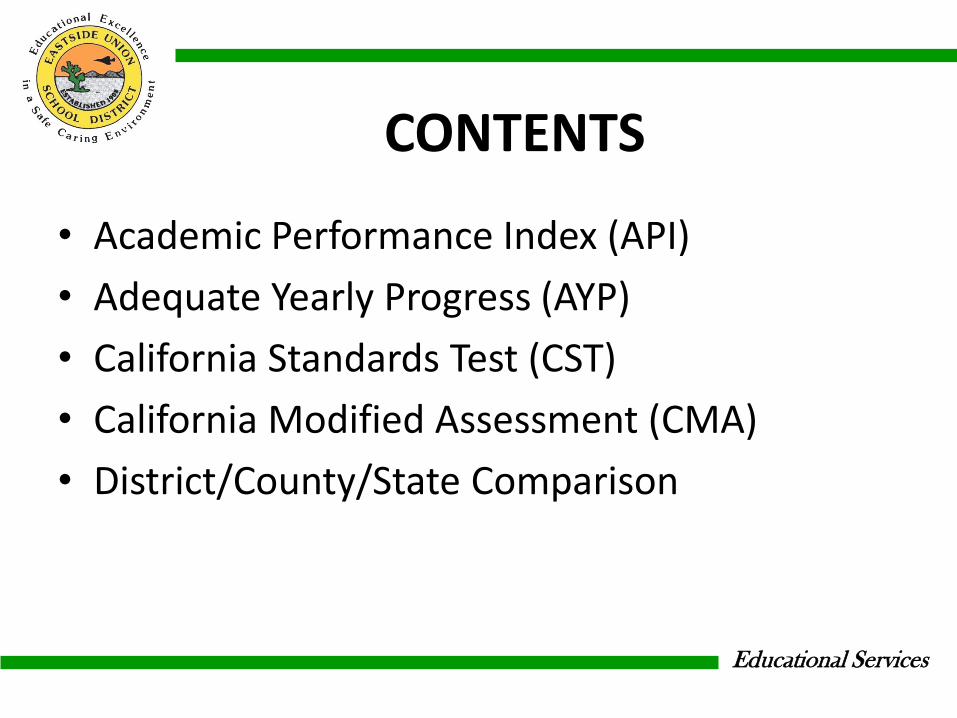
CONTENTS
• Academic Performance Index (API)
• Adequate Yearly Progress (AYP)
• California Standards Test (CST)
• California Modified Assessment (CMA)
• District/County/State Comparison
Educational Services
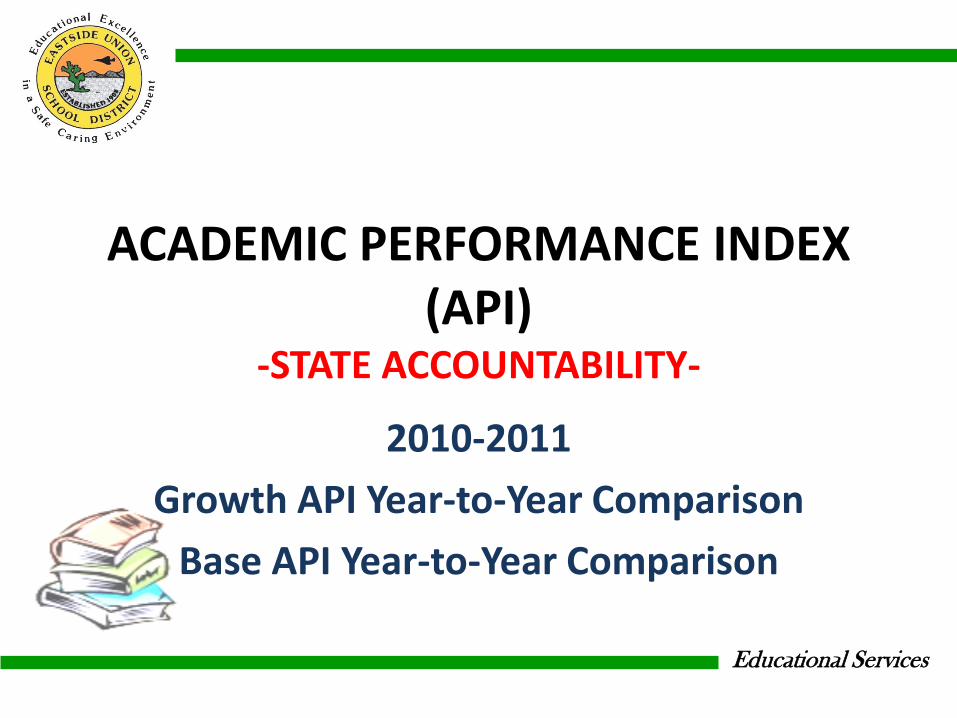
ACADEMIC PERFORMANCE INDEX (API)
-STATE ACCOUNTABILITY-
2010-2011
Growth API Year-to-Year Comparison
Base API Year-to-Year Comparison
Educational Services
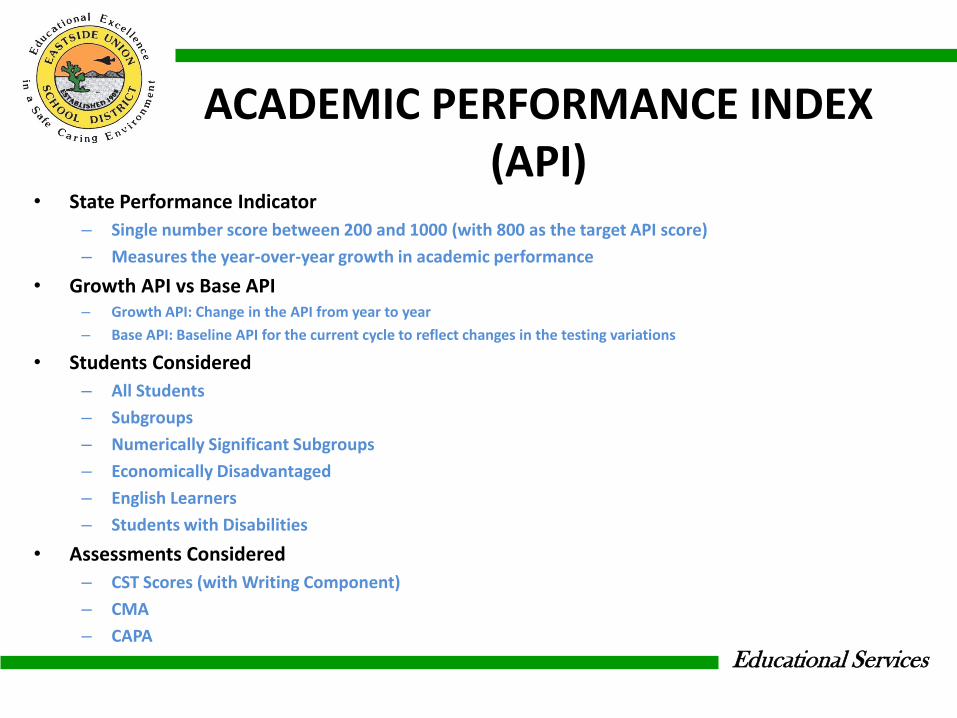
ACADEMIC PERFORMANCE INDEX (API)
• State Performance Indicator
– Single number score between 200 and 1000 (with 800 as the target API score)
– Measures the year-over-year growth in academic performance
• Growth API vs Base API – Growth API: Change in the API from year to year
– Base API: Baseline API for the current cycle to reflect changes in the testing variations
• Students Considered
– All Students
– Subgroups
– Numerically Significant Subgroups
– Economically Disadvantaged
– English Learners
– Students with Disabilities
• Assessments Considered
– CST Scores (with Writing Component)
– CMA
– CAPA
Educational Services
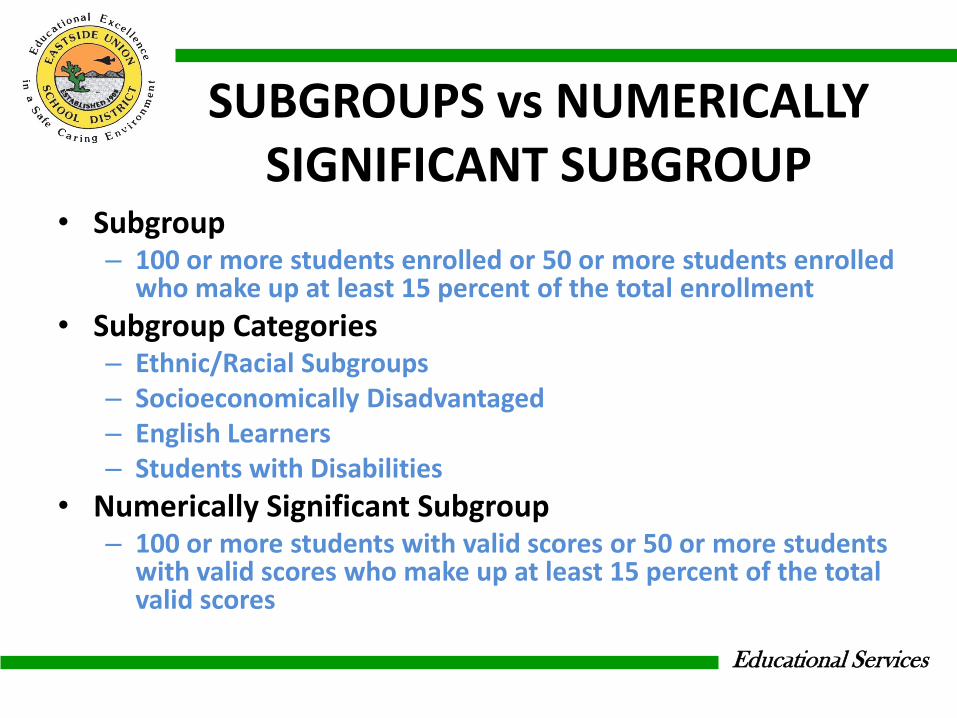
SUBGROUPS vs NUMERICALLY SIGNIFICANT SUBGROUP
• Subgroup – 100 or more students enrolled or 50 or more students enrolled
who make up at least 15 percent of the total enrollment
• Subgroup Categories – Ethnic/Racial Subgroups – Socioeconomically Disadvantaged – English Learners – Students with Disabilities
• Numerically Significant Subgroup – 100 or more students with valid scores or 50 or more students
with valid scores who make up at least 15 percent of the total valid scores
Educational Services
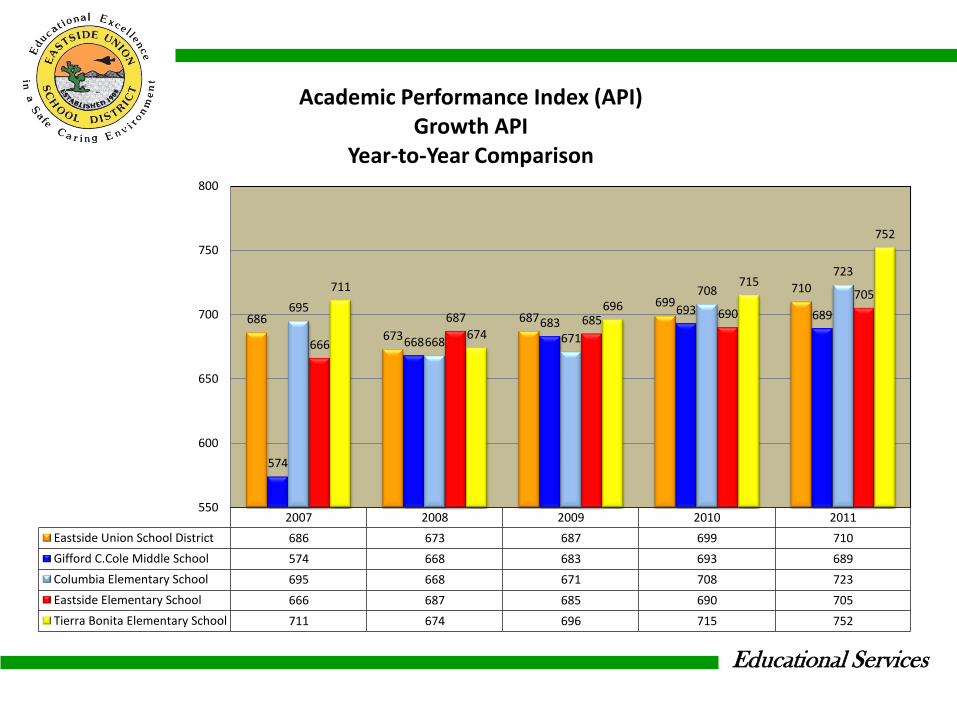
2007 2008 2009 2010 2011
Eastside Union School District 686 673 687 699 710
Gifford C.Cole Middle School 574 668 683 693 689
Columbia Elementary School 695 668 671 708 723
Eastside Elementary School 666 687 685 690 705
Tierra Bonita Elementary School 711 674 696 715 752
686
673
687 699
710
574
668
683 693 689
695
668 671
708
723
666
687 685 690
705 711
674
696
715
752
550
600
650
700
750
800
Academic Performance Index (API) Growth API
Year-to-Year Comparison

Educational Services
2007 2008 2009 2010 2011
Eastside Union School District 683 678 682 700
Gifford C.Cole Middle School 574 688 681 693
Columbia Elementary School 692 666 671 708
Eastside Elementary School 663 681 683 690
Tierra Bonita Elementary School 709 673 695 715
683 678 682
700
574
688 681
693 692
666 671
708
663
681 683 690
709
673
695
715
550
600
650
700
750
800
Academic Performance Index (API) Base API
Year-to-Year Comparison

Educational Services
District Gifford C. Cole Middle School
Columbia Elementary School
Eastside Elementary School
Tierra Bonita Elementary School
2008 622 633 609 618 624
2009 631 646 609 639
2010 655 640 676 672
2011 658 624 683 670 700
622 633
609 618 624
631 646
609
639 655
640
676 672 658
624
683 670
700
560
580
600
620
640
660
680
700
720
Academic Performance Index (Growth API)
Year-to-Year Comparison Numerically Significant Subgroup
Black Students
Educational Services
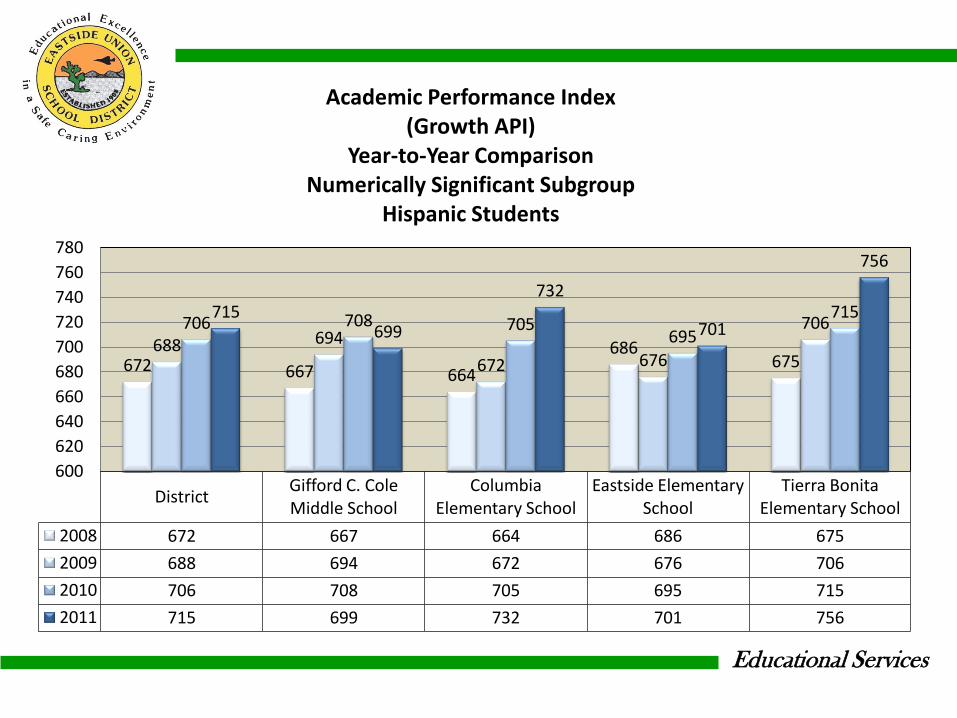
District Gifford C. Cole Middle School
Columbia Elementary School
Eastside Elementary School
Tierra Bonita Elementary School
2008 672 667 664 686 675
2009 688 694 672 676 706
2010 706 708 705 695 715
2011 715 699 732 701 756
672 667 664
686 675
688 694
672 676
706 706 708 705 695
715 715 699
732
701
756
600
620
640
660
680
700
720
740
760
780
Academic Performance Index (Growth API)
Year-to-Year Comparison Numerically Significant Subgroup
Hispanic Students

Educational Services
District Gifford C. Cole Middle School
Columbia Elementary School
Eastside Elementary School
Tierra Bonita Elementary School
2008 740 722 729
2009 752 746 728
2010 742 703
2011 749 751 740 732 801
740 722 729
752 746 728
742
703
749 751 740
732
801
640
660
680
700
720
740
760
780
800
820
Academic Performance Index (Growth API)
Year-to-Year Comparison Numerically Significant Subgroup
White Students
Educational Services
District Gifford C. Cole Middle School
Columbia Elementary School
Eastside Elementary School
Tierra Bonita Elementary School
2008 658 649 653 673 663
2009 676 684 653 677 685
2010 690 690 698 677 699
2011 704 683 720 697 747
658 649 653
673 663
676 684
653
677 685 690 690
698
677
699 704
683
720
697
747
600
620
640
660
680
700
720
740
760
Academic Performance Index (Growth API)
Year-to-Year Comparison Numerically Significant Subgroup
Socio-Economically Students
Educational Services
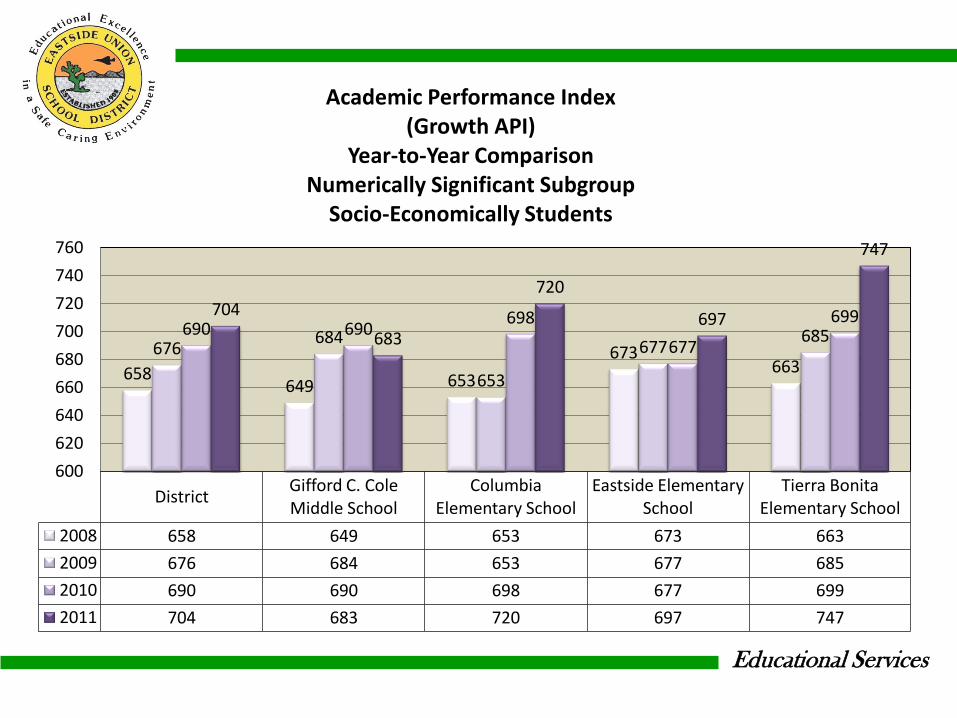
District Gifford C. Cole Middle School
Columbia Elementary School
Eastside Elementary School
Tierra Bonita Elementary School
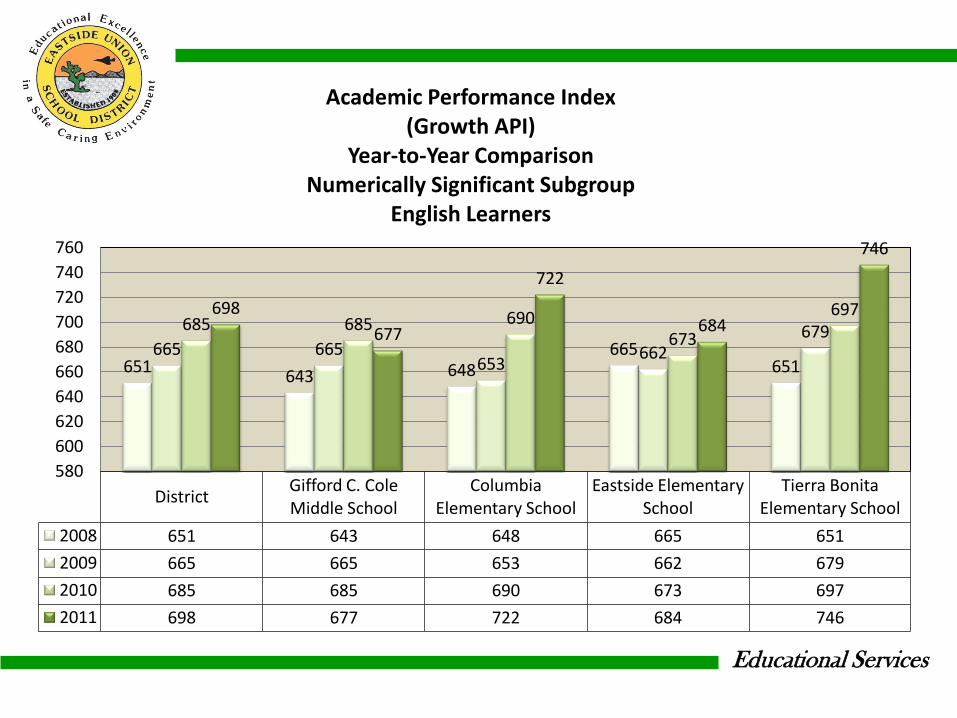
2008 651 643 648 665 651
2009 665 665 653 662 679
2010 685 685 690 673 697
2011 698 677 722 684 746
651 643 648
665 651
665 665 653
662 679 685 685 690
673
697 698
677
722
684
746
580
600
620
640
660
680
700
720
740
760
Academic Performance Index (Growth API)
Year-to-Year Comparison Numerically Significant Subgroup
English Learners
Educational Services
ADEQUATE YEARLY PROGRESS (AYP)
-FEDERAL ACCOUNTABILITY-
2010-2011
Annual Measurable Objectives (AMO)
Academic Performance Index (API)
Educational Services
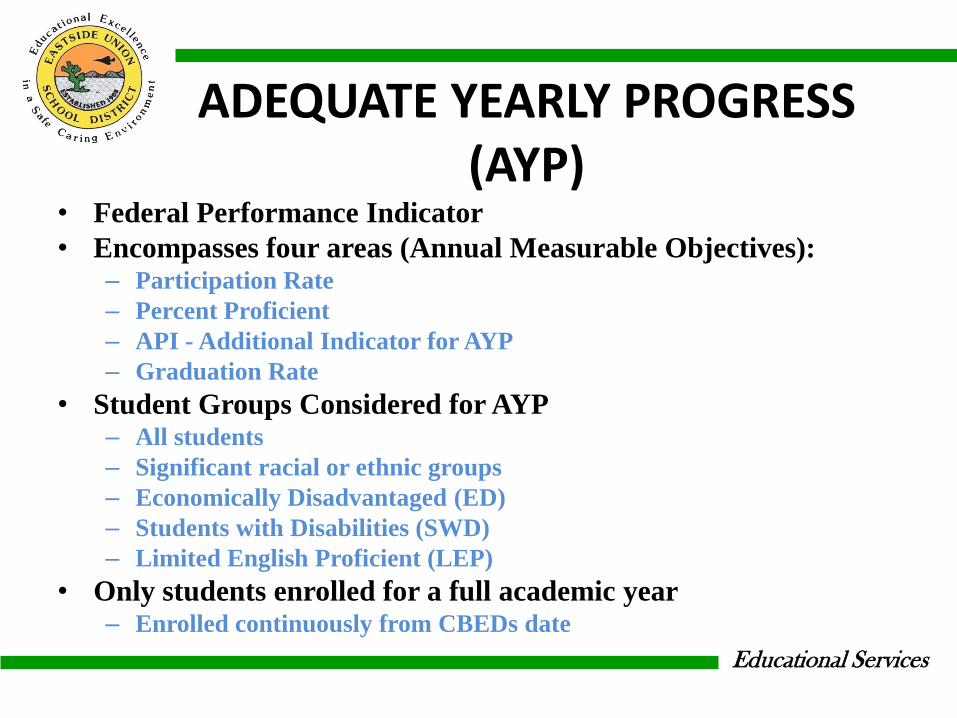
ANNUAL MEASURABLE OBJECTIVES
• AYP is a series of annual academic performance goals
• California’s Definition of AYP
• Under California’s criteria for ESEA, schools and LEAs are required to meet or exceed requirements within each of the following four areas in order to make AYP annually: – Requirement 1: Participation Rate
– Requirement 2: Percent Proficient—Annual Measurable Objectives (AMOs) – CST, CMA, CAPA
– Requirement 3: API as an Additional Indicator
– Requirement 4: Graduation Rate
Educational Services
SAFE HARBOR • Safe Harbor is an alternate method of making the AMOs
without meeting the established statewide targets (for AYP) if an LEA, school, or numerically significant subgroup shows significant growth over the prior year.
• An LEA, school, or numerically significant subgroup must show a decrease in the percentage of students below proficient by 10% over the prior year.
• Safe Harbor includes a confidence interval that is calculated and applied by CDE which is based on the number of valid scores.
• For safe harbor to be applied, the school, LEA, or subgroup must also meet the participation rate and the additional indicators (API and graduation rate).
Educational Services
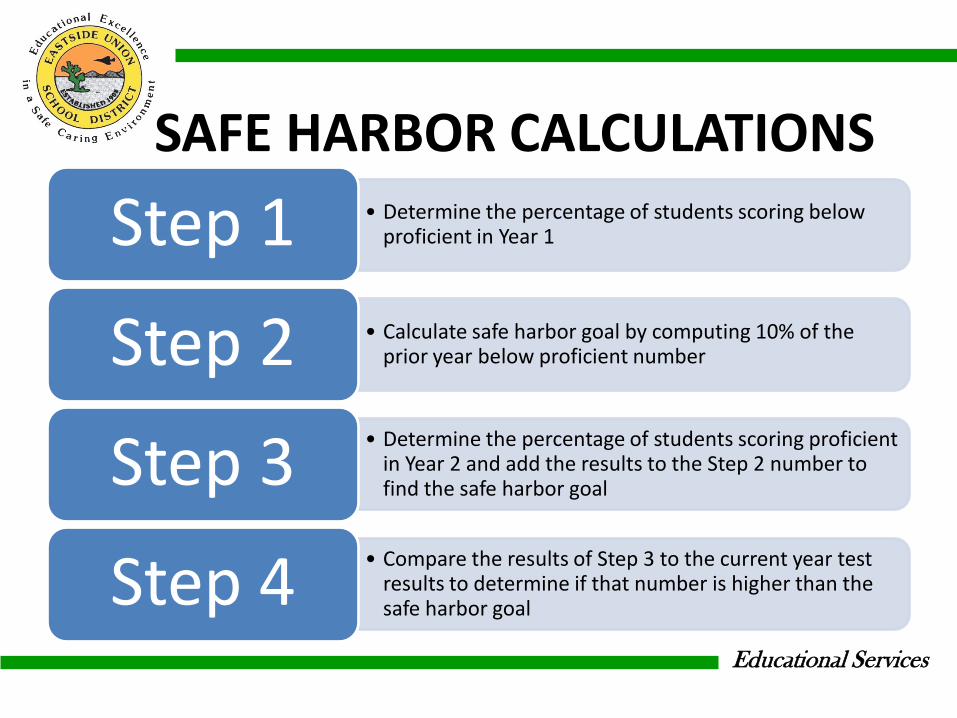
SAFE HARBOR CALCULATIONS • Determine the percentage of students scoring below
proficient in Year 1 Step 1
• Calculate safe harbor goal by computing 10% of the prior year below proficient number Step 2
• Determine the percentage of students scoring proficient in Year 2 and add the results to the Step 2 number to find the safe harbor goal Step 3
• Compare the results of Step 3 to the current year test results to determine if that number is higher than the safe harbor goal Step 4
Educational Services
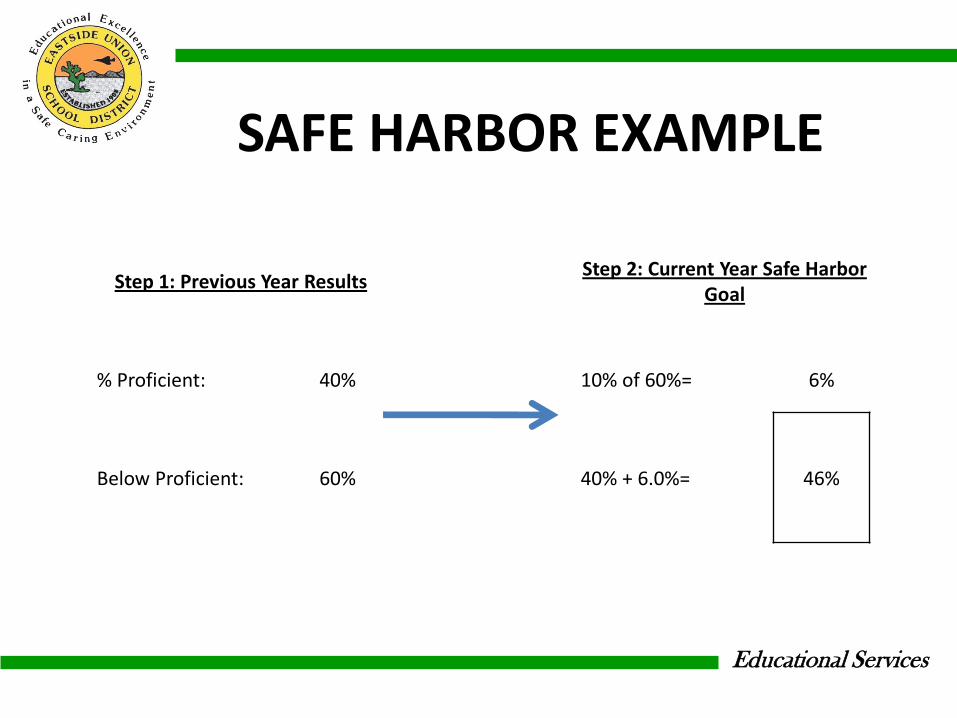
SAFE HARBOR EXAMPLE
Step 1: Previous Year Results Step 2: Current Year Safe Harbor
Goal
% Proficient: 40% 10% of 60%= 6%
Below Proficient: 60% 40% + 6.0%= 46%
Educational Services
ADEQUATE YEARLY PROGRESS (AYP)
• Federal Performance Indicator
• Encompasses four areas (Annual Measurable Objectives): – Participation Rate
– Percent Proficient
– API - Additional Indicator for AYP
– Graduation Rate
• Student Groups Considered for AYP – All students
– Significant racial or ethnic groups
– Economically Disadvantaged (ED)
– Students with Disabilities (SWD)
– Limited English Proficient (LEP)
• Only students enrolled for a full academic year – Enrolled continuously from CBEDs date
Educational Services
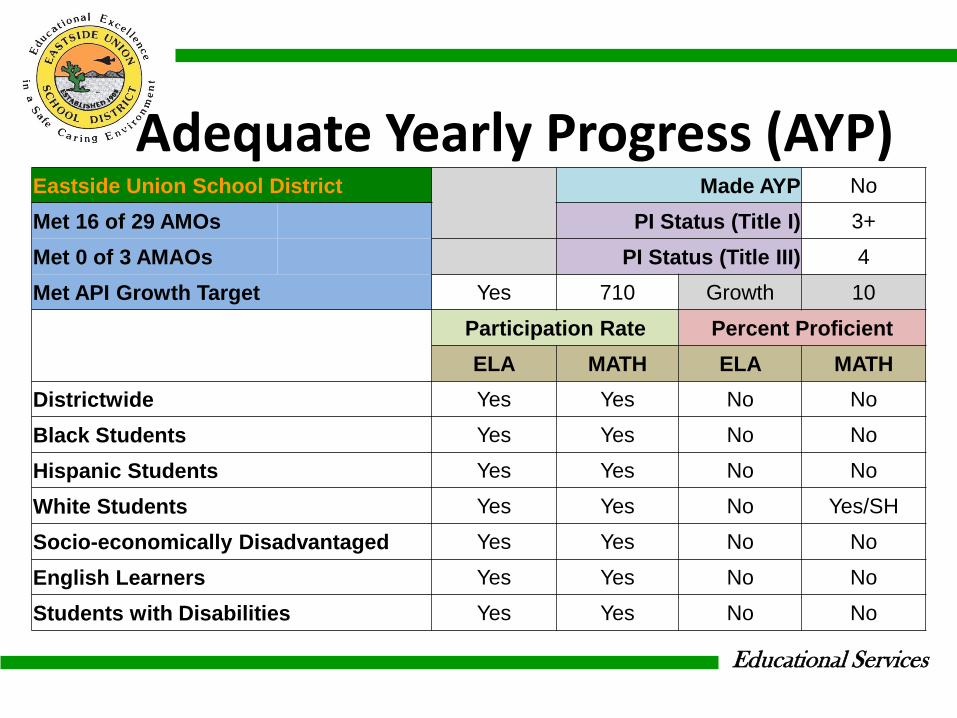
Adequate Yearly Progress (AYP) Eastside Union School District Made AYP No
Met 16 of 29 AMOs PI Status (Title I) 3+
Met 0 of 3 AMAOs PI Status (Title III) 4
Met API Growth Target Yes 710 Growth 10
Participation Rate Percent Proficient
ELA MATH ELA MATH
Districtwide Yes Yes No No
Black Students Yes Yes No No
Hispanic Students Yes Yes No No
White Students Yes Yes No Yes/SH
Socio-economically Disadvantaged Yes Yes No No
English Learners Yes Yes No No
Students with Disabilities Yes Yes No No
Educational Services
Adequate Yearly Progress (AYP)
Gifford C. Cole Middle School Made AYP No
Met 10 of 21 AMOs PI Status 5+
Met API Growth Target No 689 Growth -4
Participation Rate Percent Proficient
ELA MATH ELA MATH
Schoolwide Yes Yes No No
Black Students Yes Yes No No
Hispanic Students Yes Yes No No
White Students* Yes Yes No No
Socio-economically Disadvantaged Yes Yes No No
English Learners Yes Yes No No
Students with Disabilities Yes Yes No No
Educational Services
Adequate Yearly Progress (AYP)
Columbia Elementary School Made AYP No
Met 18 of 21 AMOs PI Status 5
Met API Growth Target Yes 723 Growth 15
Participation Rate Percent Proficient
ELA MATH ELA MATH
Schoolwide Yes Yes No Yes/SH
Black Students Yes Yes No Yes/SH
Hispanic Students Yes Yes Yes/SH Yes/SH
White Students* Yes Yes Yes/SH Yes/SH
Socio-economically Disadvantaged Yes Yes No Yes/SH
English Learners Yes Yes Yes/SH Yes/SH
Students with Disabilities* Yes Yes No No

Educational Services
Adequate Yearly Progress (AYP)
Eastside Elementary School Made AYP No
Met 20 of 25 AMOs PI Status 5+
Met API Growth Target Yes 705 Growth 15
Participation Rate Percent Proficient
ELA MATH ELA MATH
Schoolwide Yes Yes No Yes/SH
Black Students Yes Yes No Yes/SH
Hispanic Students Yes Yes No Yes/SH
White Students Yes Yes Yes/SH Yes/SH
Socio-economically Disadvantaged Yes Yes No Yes/SH
English Learners Yes Yes No Yes/SH
Students with Disabilities* Yes Yes No No

Educational Services
Adequate Yearly Progress (AYP)
Tierra Bonita Elementary School Made AYP No
Met 17 of 21 AMOs PI Status 3
Met API Growth Target Yes 752 Growth 37
Participation Rate Percent Proficient
ELA MATH ELA MATH
Schoolwide Yes Yes No Yes/SH
Black Students Yes Yes Yes/SH Yes/SH
Hispanic Students Yes Yes No Yes/SH
White Students* Yes Yes Yes/SH Yes/SH
Socio-economically Disadvantaged Yes Yes No Yes/SH
English Learners Yes Yes No Yes/SH
Students with Disabilities* Yes Yes Yes/SH Yes/SH
Educational Services
CALIFORNIA STANDARDS TEST (CST)
Educational Services
CALIFORNIA STANDARDS TESTS (CST)
• Subjects
– English–Language Arts (Grades 2-8)
– Mathematics (Grades 2-8)
– Science (Grades 5 and 8)
– History–Social Science (Grade 8)
– Writing (Grades 4 and 7)

Educational Services
STUDENT PROFICIENCY RATINGS • CST results show the level of proficiency a
student demonstrates in each of the subject areas tested.
• Students will receive one of the following five ratings on the tests: – Advanced
– Proficient
– Basic
– Below basic
– Far below basic
Educational Services
Content Area
2010–11 API Test
Weights
K–5 6–8 K–8
CST/CMA/CAPA in ELA 56.5% 51.4% 54.2%
CST/CMA/CAPA in Mathematics 37.6% 34.3% 36.1%
CST/CMA/CAPA in Science, Grades 5 and 8 5.9% 7.1% 6.5%
CST in History–Social Science, Grade 8 N/A 7.1% 3.2%
Educational Services
CST PROFICIENCY BANDS Grade Far Below Basic Below Basic Basic Proficient Advanced
2 150–261 262–299 300–349 350–401 402–600
3 150–258 259–299 300–349 350–401 402–600
4 150–268 269–299 300–349 350–392 393–600
5 150–270 271–299 300–349 350–394 395–600
6 150–267 268–299 300–349 350–393 394–600
7 150–262 263–299 300–349 350–400 401–600
8 150–265 266–299 300–349 350–394 395–600
Grade Far Below Basic Below Basic Basic Proficient Advanced
2 150–235 236–299 300–349 350–413 414–600
3 150–235 236–299 300–349 350–413 414–600
4 150–244 245–299 300–349 350–400 401–600
5 150–247 248–299 300–349 350–429 430–600
6 150–252 253–299 300–349 350–414 415–600
7 150–256 257–299 300–349 350–413 414–600
8 150–256 257–299 300–349 350–413 414–600
Algebra I 150–252 253–299 300–349 350–427 428–600
English Language Arts
Mathematics
Educational Services
CALIFORNIA STANDARDS TEST (CST)
-STATE ACCOUNTABILITY-
2010-2011
Growth Trajectory (Federal)
Percent Proficient or Advanced (State)
Educational Services
13.6% 13.6%
24.4% 24.4% 24.4%
35.2%
46.0%
56.8%
67.6%
78.4%
89.2%
100.0%
21.4% 22.2%
26.9%
31.5% 31.0% 30.3%
34.7% 37.1% 37.9%
2003 2004 2005 2006 2007 2008 2009 2010 2011 2012 2013 2014
AYP Growth Target Trajectory CST-English Language Arts
Percent Proficient or Advanced
GOAL Eastside Union School District

Educational Services
16.0% 16.0%
26.5% 26.5% 26.5%
37.0%
47.5%
58.0%
68.5%
79.0%
89.5%
100.0%
20.1% 19.8%
26.0%
32.0%
37.4%
28.0%
33.2%
37.7% 40.8%
2003 2004 2005 2006 2007 2008 2009 2010 2011 2012 2013 2014
AYP Growth Target Trajectory CST-Mathematics
Percent Proficient or Advanced
GOAL EUSD
Educational Services
0%
5%
10%
15%
20%
25%
30%
35%
6 or more years
5 years 4 years 3 years 2 years 1 year
Advanced 14% 14% 12% 12% 14% 13%
Proficient 30% 20% 22% 26% 23% 26%
Basic 34% 31% 32% 30% 32% 30%
Below Basic 10% 24% 21% 19% 19% 18%
Far Below Basic 12% 11% 12% 13% 13% 13%
Pe
rce
nt
in E
ach
Cat
ego
ry
Performance on the CST By Years Enrolled in the District
Englis-Language Arts 2010-2011

Educational Services
0%
5%
10%
15%
20%
25%
30%
35%
6 or more years
5 years 4 years 3 years 2 years 1 year
Advanced 14% 20% 17% 23% 16% 12%
Proficient 23% 31% 29% 32% 26% 22%
Basic 31% 28% 24% 22% 28% 29%
Below Basic 21% 17% 24% 18% 22% 29%
Far Below Basic 11% 3% 6% 5% 8% 8%
Pe
rce
nt
in E
ach
Cat
ego
ry
Performance on the CST By Years Enrolled in the District
Mathematics 2010-2011

Educational Services
CALIFORNIA STANDARDS TEST (CST)
-STATE ACCOUNTABILITY-
2010-2011
English-Language Arts
Educational Services
2003 2004 2005 2006 2007 2008 2009 2010 2011 2012 2013 2014
GOAL 13.6% 13.6% 24.4% 24.4% 24.4% 35.2% 46.0% 56.8% 67.6% 78.4% 89.2% 100.0%
Eastside Union School District 21.4% 22.2% 26.9% 31.5% 31.0% 30.3% 34.7% 37.1% 37.8%
Gifford C. Cole Middle School 19.7% 22.0% 26.5% 31.6% 0.0% 35.5% 38.7% 38.8% 38.3%
Columbia Elementary School 25.0% 22.4% 24.9% 26.9% 30.8% 25.8% 33.3% 35.2% 38.6%
Eastside Elementary School 24.1% 21.5% 21.2% 31.3% 29.0% 28.1% 32.0% 35.9% 34.8%
Tierra Bonita Elementary School 18.5% 24.0% 40.7% 38.2% 35.1% 29.4% 33.3% 37.8% 40.8%
Eastside Academy
0.0%
10.0%
20.0%
30.0%
40.0%
50.0%
60.0%
70.0%
80.0%
90.0%
100.0%
Pe
rce
nt
Pro
fici
en
t o
r A
dva
nce
d
California Standards Test (CST) Proficiency Rate
English Language Arts Year-to-Year Comparison
Educational Services
2004 2005 2006 2007 2008 2009 2010 2011
Eastside Union School District 0.8% 4.7% 4.6% -0.5% -0.7% 4.4% 2.4% 0.7%
Gifford C. Cole Middle School 2.3% 4.5% 5.1% 0.0% 0.0% 3.2% 0.1% -0.5%
Columbia Elementary School -2.6% 2.5% 2.0% 3.9% -5.0% 7.5% 1.9% 3.4%
Eastside Elementary School -2.6% -0.3% 10.1% -2.3% -0.9% 3.9% 3.9% -1.1%
Tierra Bonita Elementary School 5.5% 16.7% -2.5% -3.1% -5.7% 3.9% 4.5% 3.0%
Eastside Academy 0.0% 0.0% 0.0% 0.0% 0.0% 0.0% 0.0% 0.0%
-20.0%
0.0%
20.0%
40.0%
60.0%
80.0%
100.0%
Pe
rce
nta
ge P
oin
t G
row
th o
ver
Pre
vio
us
Ye
ar
California Standards Test (CST) Percentage Point Growth
English Language Arts Year-to-Year Comparison
Educational Services
2003 2004 2005 2006 2007 2008 2009 2010 2011
Eastside Union School District 7.8% 8.6% 2.5% 7.1% 6.6% -4.9% -11.3% -19.7% -29.8%
Gifford C. Cole Middle School 6.1% 8.4% 2.1% 7.2% 0.3% -7.3% -18.0% -29.3%
Columbia Elementary School 11.4% 8.8% 0.5% 2.5% 6.4% -9.4% -12.7% -21.6% -29.0%
Eastside Elementary School 10.5% 7.9% -3.2% 6.9% 4.6% -7.1% -14.0% -20.9% -32.8%
Tierra Bonita Elementary School 4.9% 10.4% 16.3% 13.8% 10.7% -5.8% -12.7% -19.0% -26.8%
-40.0%
-20.0%
0.0%
20.0%
40.0%
60.0%
80.0%
100.0%
Gap
Be
twe
en
Ach
ive
me
nt
and
Go
al
California Standards Test (CST) Percentage Point Achievement Gap
English Language Arts Year-to-Year Comparison
Educational Services
2003 2004 2005 2006 2007 2008 2009 2010 2011 2012 2013 2014
GOAL 13.6% 13.6% 24.4% 24.4% 24.4% 35.2% 46.0% 56.8% 67.6% 78.4% 89.2% 100.0%
All Students 21% 22% 27% 32% 31% 30% 35% 37% 38%
Black Students 10% 16% 22% 26% 28% 23% 29% 32% 32%
Hispanic Students 18% 18% 24% 28% 29% 29% 33% 36% 36%
White Students 31% 33% 36% 42% 38% 47% 47% 48% 50%
SED 16% 17% 22% 27% 28% 27% 33% 35% 36%
EL 13% 14% 17% 22% 25% 24% 28% 31% 32%
SWD 4% 5% 8% 16% 10% 16% 24% 17% 16%
0.0%
20.0%
40.0%
60.0%
80.0%
100.0%
120.0%
Pe
rce
nt
Pro
fici
en
t o
r A
dva
nce
d
California Standards Test (CST) Proficiency Rate
English Language Arts Year-to-Year Comparison
Educational Services
2004 2005 2006 2007 2008 2009 2010 2011 2012 2013 2014
All Students 1% 5% 5% 0% -1% 4% 2% 1%
Black Students 16% 22% 26% 28% 23% 29% 32% 32%
Hispanic Students -4% 2% 2% -2% -3% 3% 1% -1%
White Students 11% 14% 15% 7% 15% 17% 13% 13%
SED -5% 0% 0% -4% -4% 2% 0% -1%
EL -8% -5% -5% -7% -7% -3% -4% -6%
SWD -17% -15% -11% -21% -16% -7% -18% -21%
-30%
-20%
-10%
0%
10%
20%
30%
40%
Pe
rce
nta
ge P
oin
t G
row
th o
ver
Pre
vio
us
Ye
ar
California Standards Test (CST)
Percentage Point Growth English Language Arts
Year-to-Year Comparison
Educational Services
2003 2004 2005 2006 2007 2008 2009 2010 2011 2012 2013 2014
All Students 8% 9% 3% 7% 7% -5% -11% -20% -30%
Black Students -3% 2% -2% 1% 4% -12% -18% -24% -35%
Hispanic Students 5% 4% -1% 4% 5% -7% -13% -21% -32%
White Students 17% 19% 12% 18% 14% 11% 1% -9% -18%
SED 2% 3% -3% 2% 4% -8% -13% -22% -32%
EL -1% 0% -8% -3% 0% -11% -18% -26% -36%
SWD -10% -9% -17% -9% -14% -20% -23% -40% -52%
-60%
-50%
-40%
-30%
-20%
-10%
0%
10%
20%
30%
Gap
Be
twe
en
Ach
ieve
me
nt
and
Go
al
California Standards Test (CST)
Percentage Point Achievement Gap English Language Arts
Year-to-Year Comparison
Educational Services
All Students Black Students Hispanic Students
White Students SED EL SWD
2010-2011 GOAL 67.6% 67.6% 67.6% 67.6% 67.6% 67.6% 67.6%
EUSD 38% 32% 36% 50% 36% 32% 16%
Gifford C. Cole Middle School 38% 31% 38% 51% 37% 33% 14%
Columbia Elementary School 39% 32% 38% 47% 37% 34% 5%
Eastside Elementary School 35% 33% 31% 48% 32% 26% 20%
Tierra Bonita Elementary School 41% 37% 38% 57% 39% 35% 29%
0.0%
10.0%
20.0%
30.0%
40.0%
50.0%
60.0%
70.0%
80.0%
90.0%
100.0%
Pe
rce
nt
Pro
fici
en
t o
f A
dva
nce
d
California Standards Test (CST) Proficiency Rate
English-Language Arts 2010-2011
Educational Services
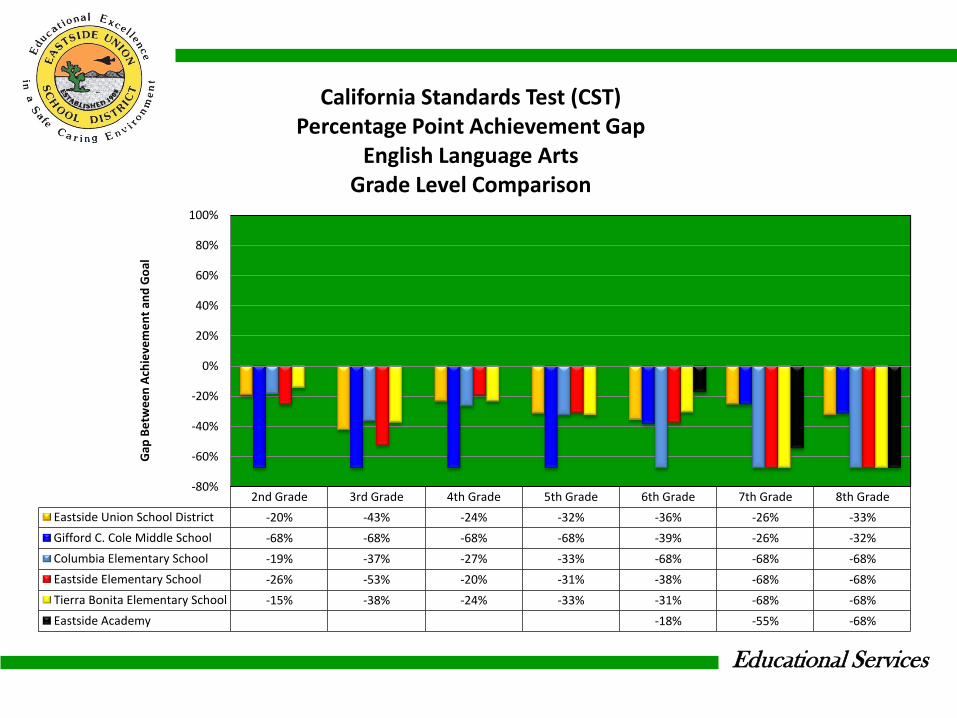
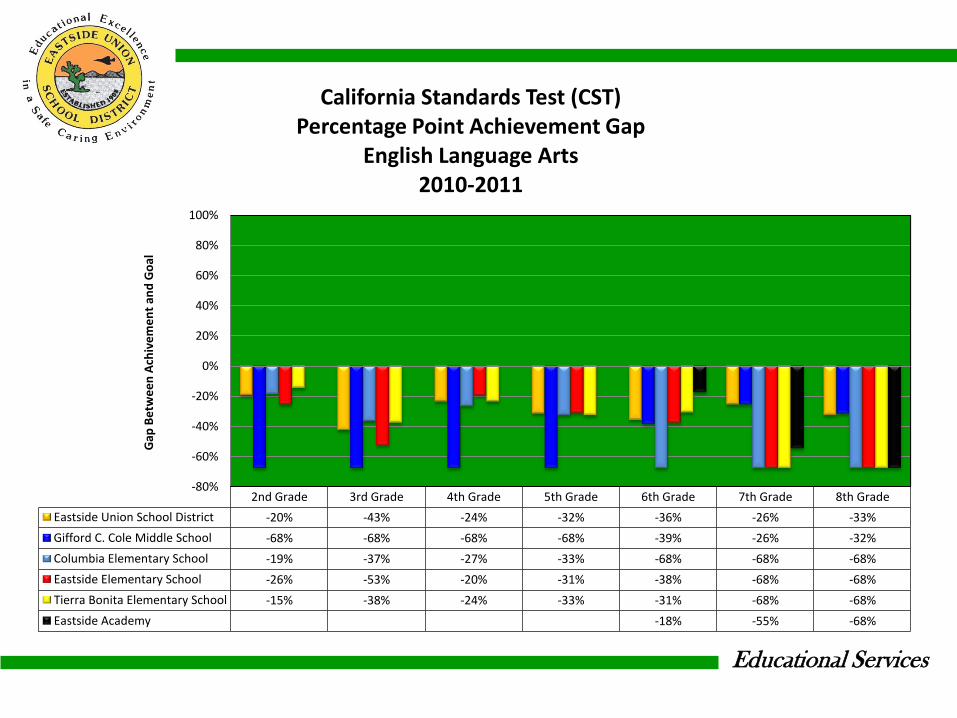
2nd Grade 3rd Grade 4th Grade 5th Grade 6th Grade 7th Grade 8th Grade
Eastside Union School District -20% -43% -24% -32% -36% -26% -33%
Gifford C. Cole Middle School -68% -68% -68% -68% -39% -26% -32%
Columbia Elementary School -19% -37% -27% -33% -68% -68% -68%
Eastside Elementary School -26% -53% -20% -31% -38% -68% -68%
Tierra Bonita Elementary School -15% -38% -24% -33% -31% -68% -68%
Eastside Academy -18% -55% -68%
-80%
-60%
-40%
-20%
0%
20%
40%
60%
80%
100%
Gap
Be
twe
en
Ach
ieve
me
nt
and
Go
al
California Standards Test (CST) Percentage Point Achievement Gap
English Language Arts Grade Level Comparison
Educational Services
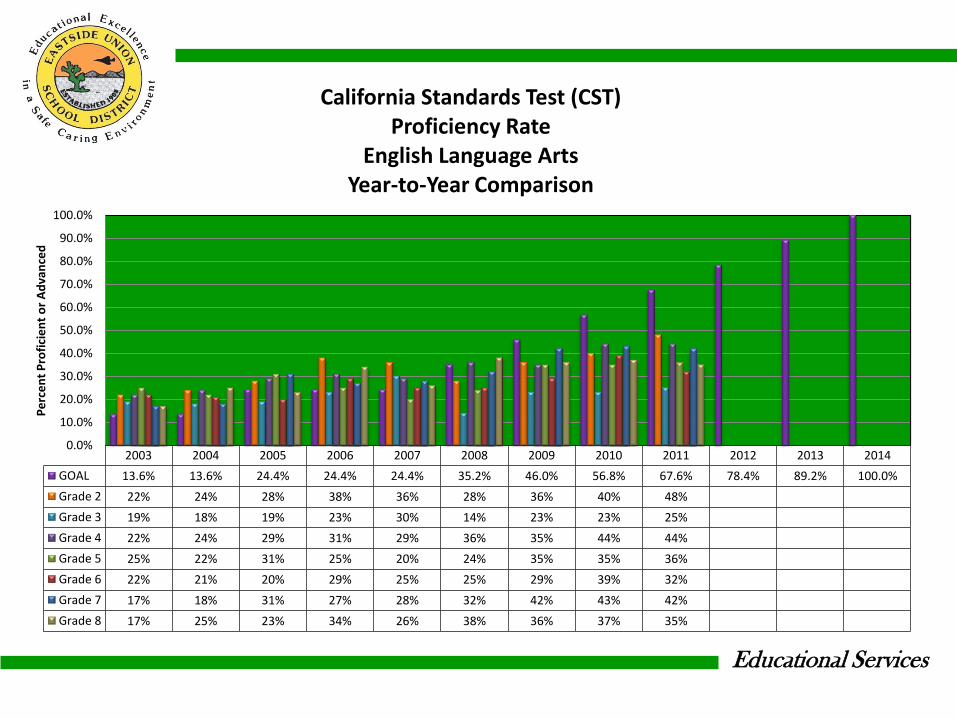
2003 2004 2005 2006 2007 2008 2009 2010 2011 2012 2013 2014
GOAL 13.6% 13.6% 24.4% 24.4% 24.4% 35.2% 46.0% 56.8% 67.6% 78.4% 89.2% 100.0%
Grade 2 22% 24% 28% 38% 36% 28% 36% 40% 48%
Grade 3 19% 18% 19% 23% 30% 14% 23% 23% 25%
Grade 4 22% 24% 29% 31% 29% 36% 35% 44% 44%
Grade 5 25% 22% 31% 25% 20% 24% 35% 35% 36%
Grade 6 22% 21% 20% 29% 25% 25% 29% 39% 32%
Grade 7 17% 18% 31% 27% 28% 32% 42% 43% 42%
Grade 8 17% 25% 23% 34% 26% 38% 36% 37% 35%
0.0%
10.0%
20.0%
30.0%
40.0%
50.0%
60.0%
70.0%
80.0%
90.0%
100.0%
Pe
rce
nt
Pro
fici
en
t o
r A
dva
nce
d
California Standards Test (CST) Proficiency Rate
English Language Arts Year-to-Year Comparison
Educational Services
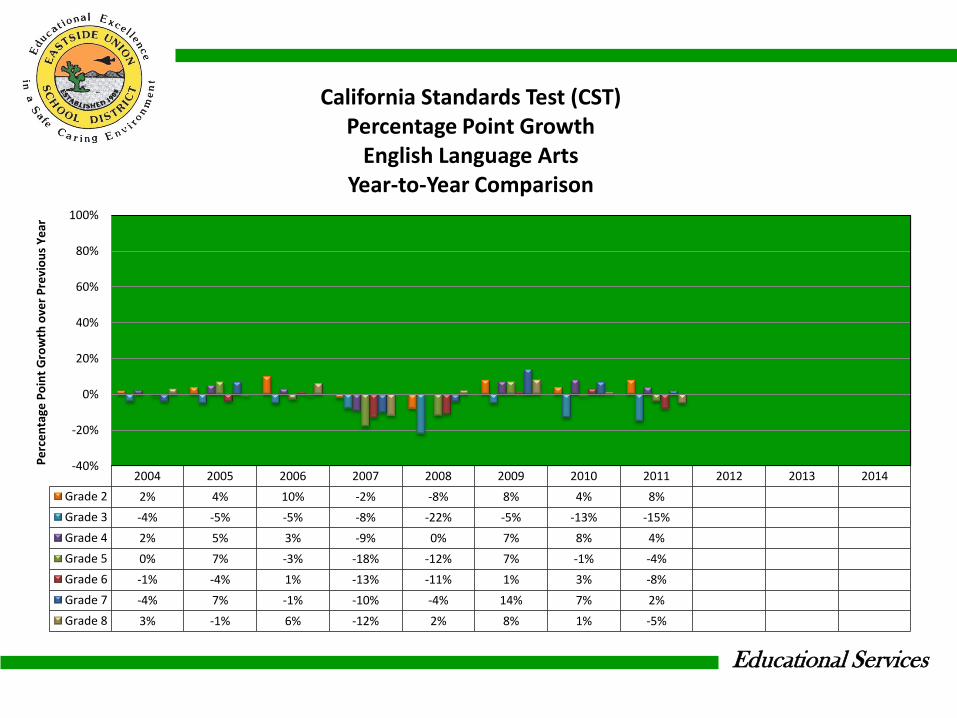
2004 2005 2006 2007 2008 2009 2010 2011 2012 2013 2014
Grade 2 2% 4% 10% -2% -8% 8% 4% 8%
Grade 3 -4% -5% -5% -8% -22% -5% -13% -15%
Grade 4 2% 5% 3% -9% 0% 7% 8% 4%
Grade 5 0% 7% -3% -18% -12% 7% -1% -4%
Grade 6 -1% -4% 1% -13% -11% 1% 3% -8%
Grade 7 -4% 7% -1% -10% -4% 14% 7% 2%
Grade 8 3% -1% 6% -12% 2% 8% 1% -5%
-40%
-20%
0%
20%
40%
60%
80%
100%
Pe
rce
nta
ge P
oin
t G
row
th o
ver
Pre
vio
us
Ye
ar
California Standards Test (CST) Percentage Point Growth
English Language Arts Year-to-Year Comparison
Educational Services
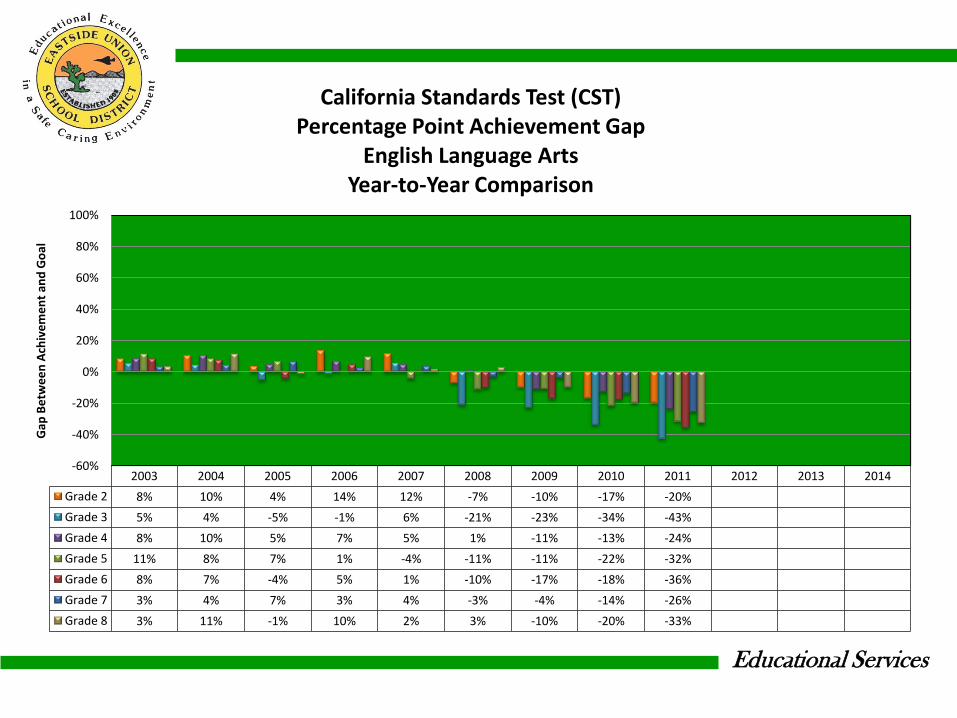
2003 2004 2005 2006 2007 2008 2009 2010 2011 2012 2013 2014
Grade 2 8% 10% 4% 14% 12% -7% -10% -17% -20%
Grade 3 5% 4% -5% -1% 6% -21% -23% -34% -43%
Grade 4 8% 10% 5% 7% 5% 1% -11% -13% -24%
Grade 5 11% 8% 7% 1% -4% -11% -11% -22% -32%
Grade 6 8% 7% -4% 5% 1% -10% -17% -18% -36%
Grade 7 3% 4% 7% 3% 4% -3% -4% -14% -26%
Grade 8 3% 11% -1% 10% 2% 3% -10% -20% -33%
-60%
-40%
-20%
0%
20%
40%
60%
80%
100%
Gap
Be
twe
en
Ach
ive
me
nt
and
Go
al
California Standards Test (CST) Percentage Point Achievement Gap
English Language Arts Year-to-Year Comparison
Educational Services
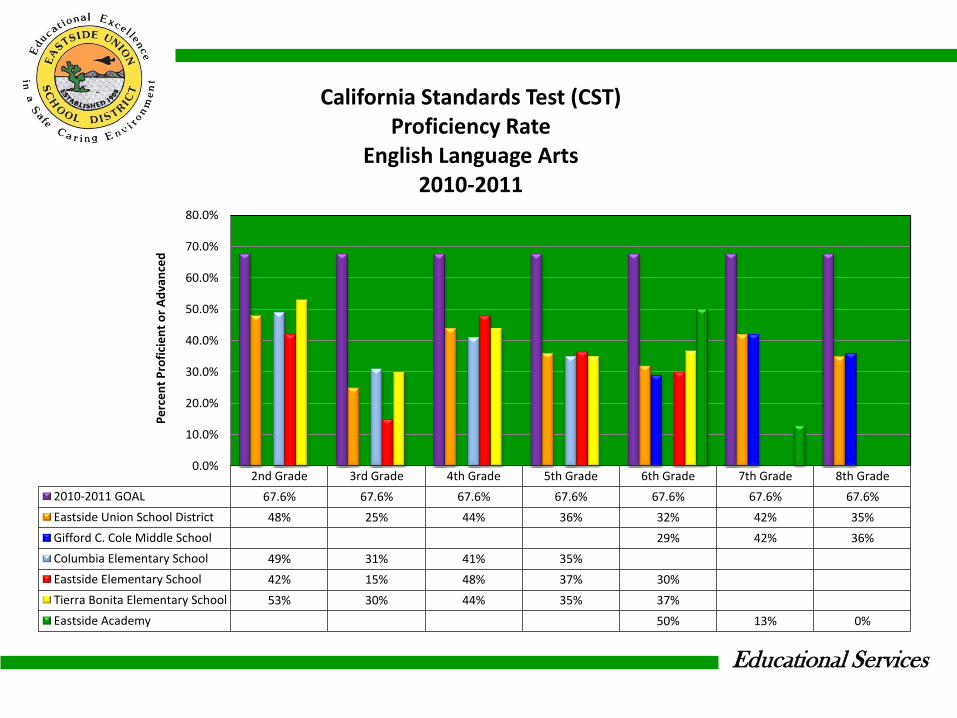
2nd Grade 3rd Grade 4th Grade 5th Grade 6th Grade 7th Grade 8th Grade
2010-2011 GOAL 67.6% 67.6% 67.6% 67.6% 67.6% 67.6% 67.6%
Eastside Union School District 48% 25% 44% 36% 32% 42% 35%
Gifford C. Cole Middle School 29% 42% 36%
Columbia Elementary School 49% 31% 41% 35%
Eastside Elementary School 42% 15% 48% 37% 30%
Tierra Bonita Elementary School 53% 30% 44% 35% 37%
Eastside Academy 50% 13% 0%
0.0%
10.0%
20.0%
30.0%
40.0%
50.0%
60.0%
70.0%
80.0%
Pe
rce
nt
Pro
fici
en
t o
r A
dva
nce
d
California Standards Test (CST) Proficiency Rate
English Language Arts 2010-2011
Educational Services
2nd Grade 3rd Grade 4th Grade 5th Grade 6th Grade 7th Grade 8th Grade
Eastside Union School District -20% -43% -24% -32% -36% -26% -33%
Gifford C. Cole Middle School -68% -68% -68% -68% -39% -26% -32%
Columbia Elementary School -19% -37% -27% -33% -68% -68% -68%
Eastside Elementary School -26% -53% -20% -31% -38% -68% -68%
Tierra Bonita Elementary School -15% -38% -24% -33% -31% -68% -68%
Eastside Academy -18% -55% -68%
-80%
-60%
-40%
-20%
0%
20%
40%
60%
80%
100%
Gap
Be
twe
en
Ach
ive
me
nt
and
Go
al
California Standards Test (CST) Percentage Point Achievement Gap
English Language Arts 2010-2011
Educational Services
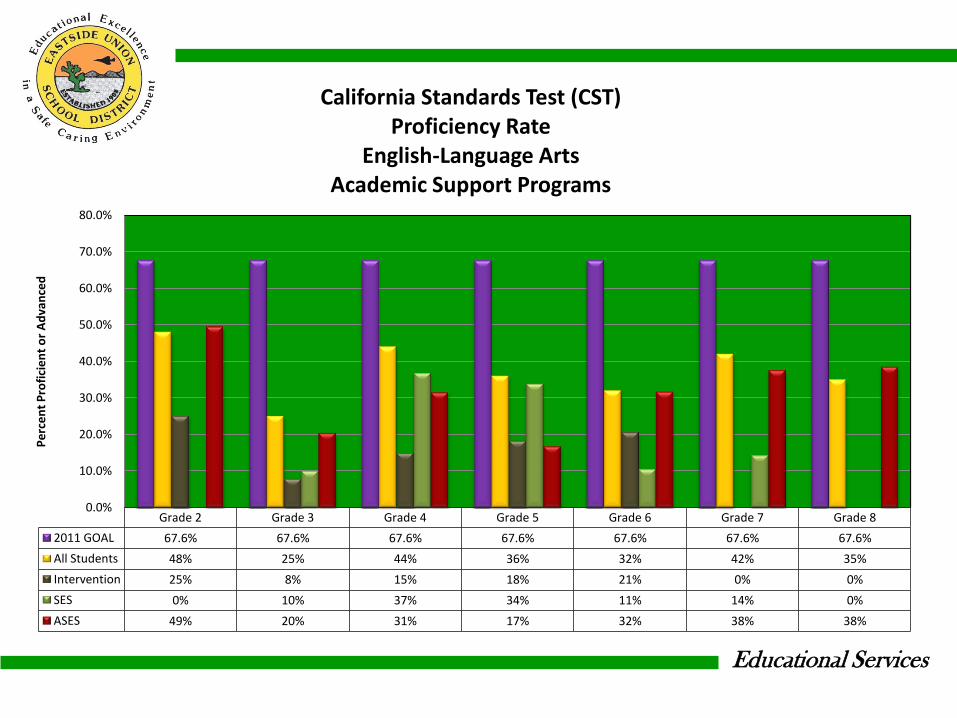
Grade 2 Grade 3 Grade 4 Grade 5 Grade 6 Grade 7 Grade 8
2011 GOAL 67.6% 67.6% 67.6% 67.6% 67.6% 67.6% 67.6%
All Students 48% 25% 44% 36% 32% 42% 35%
Intervention 25% 8% 15% 18% 21% 0% 0%
SES 0% 10% 37% 34% 11% 14% 0%
ASES 49% 20% 31% 17% 32% 38% 38%
0.0%
10.0%
20.0%
30.0%
40.0%
50.0%
60.0%
70.0%
80.0%
Pe
rce
nt
Pro
fici
en
t o
r A
dva
nce
d
California Standards Test (CST) Proficiency Rate
English-Language Arts Academic Support Programs
Educational Services
CALIFORNIA STANDARDS TEST (CST)
-STATE ACCOUNTABILITY-
2010-2011
Mathematics
Educational Services
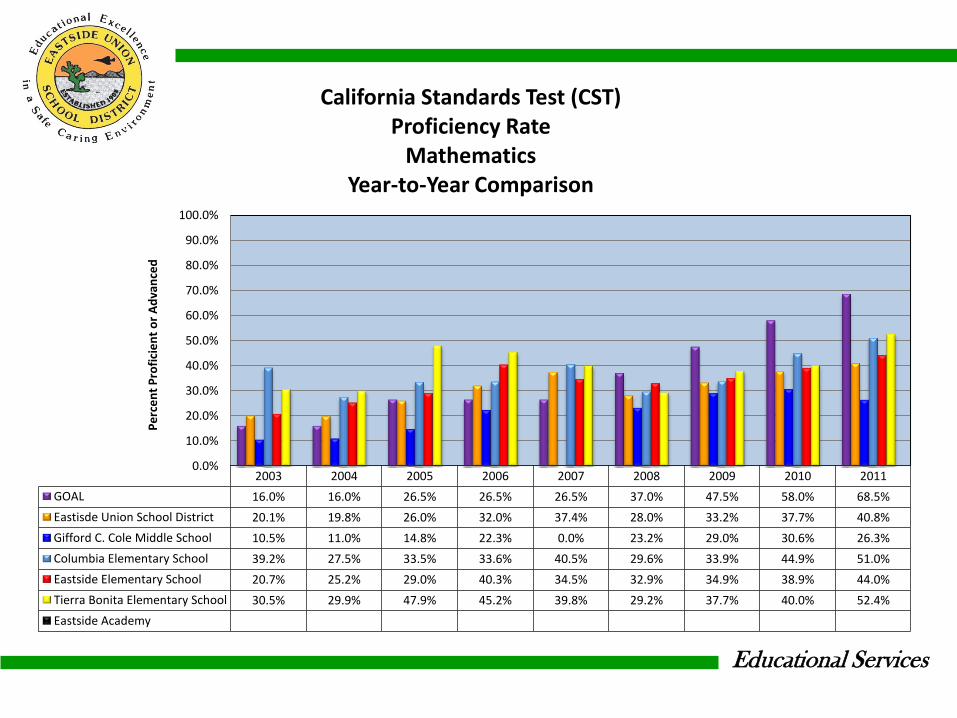
2003 2004 2005 2006 2007 2008 2009 2010 2011
GOAL 16.0% 16.0% 26.5% 26.5% 26.5% 37.0% 47.5% 58.0% 68.5%
Eastisde Union School District 20.1% 19.8% 26.0% 32.0% 37.4% 28.0% 33.2% 37.7% 40.8%
Gifford C. Cole Middle School 10.5% 11.0% 14.8% 22.3% 0.0% 23.2% 29.0% 30.6% 26.3%
Columbia Elementary School 39.2% 27.5% 33.5% 33.6% 40.5% 29.6% 33.9% 44.9% 51.0%
Eastside Elementary School 20.7% 25.2% 29.0% 40.3% 34.5% 32.9% 34.9% 38.9% 44.0%
Tierra Bonita Elementary School 30.5% 29.9% 47.9% 45.2% 39.8% 29.2% 37.7% 40.0% 52.4%
Eastside Academy
0.0%
10.0%
20.0%
30.0%
40.0%
50.0%
60.0%
70.0%
80.0%
90.0%
100.0%
Pe
rce
nt
Pro
fici
en
t o
r A
dva
nce
d
California Standards Test (CST) Proficiency Rate
Mathematics Year-to-Year Comparison
Educational Services
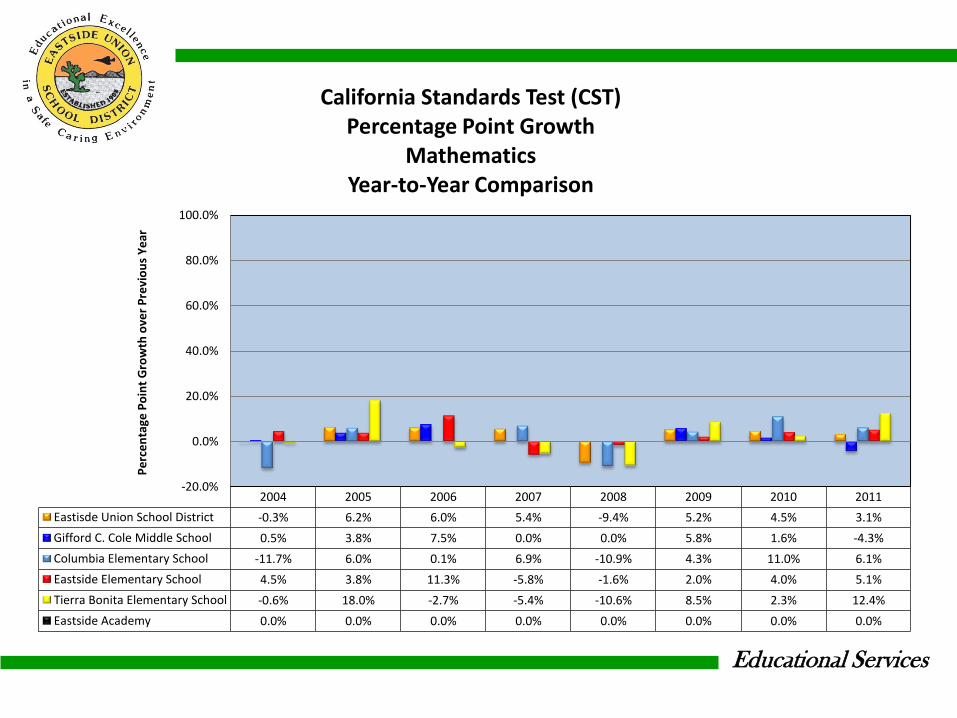
2004 2005 2006 2007 2008 2009 2010 2011
Eastisde Union School District -0.3% 6.2% 6.0% 5.4% -9.4% 5.2% 4.5% 3.1%
Gifford C. Cole Middle School 0.5% 3.8% 7.5% 0.0% 0.0% 5.8% 1.6% -4.3%
Columbia Elementary School -11.7% 6.0% 0.1% 6.9% -10.9% 4.3% 11.0% 6.1%
Eastside Elementary School 4.5% 3.8% 11.3% -5.8% -1.6% 2.0% 4.0% 5.1%
Tierra Bonita Elementary School -0.6% 18.0% -2.7% -5.4% -10.6% 8.5% 2.3% 12.4%
Eastside Academy 0.0% 0.0% 0.0% 0.0% 0.0% 0.0% 0.0% 0.0%
-20.0%
0.0%
20.0%
40.0%
60.0%
80.0%
100.0%
Pe
rce
nta
ge P
oin
t G
row
th o
ver
Pre
vio
us
Ye
ar
California Standards Test (CST) Percentage Point Growth
Mathematics Year-to-Year Comparison
Educational Services
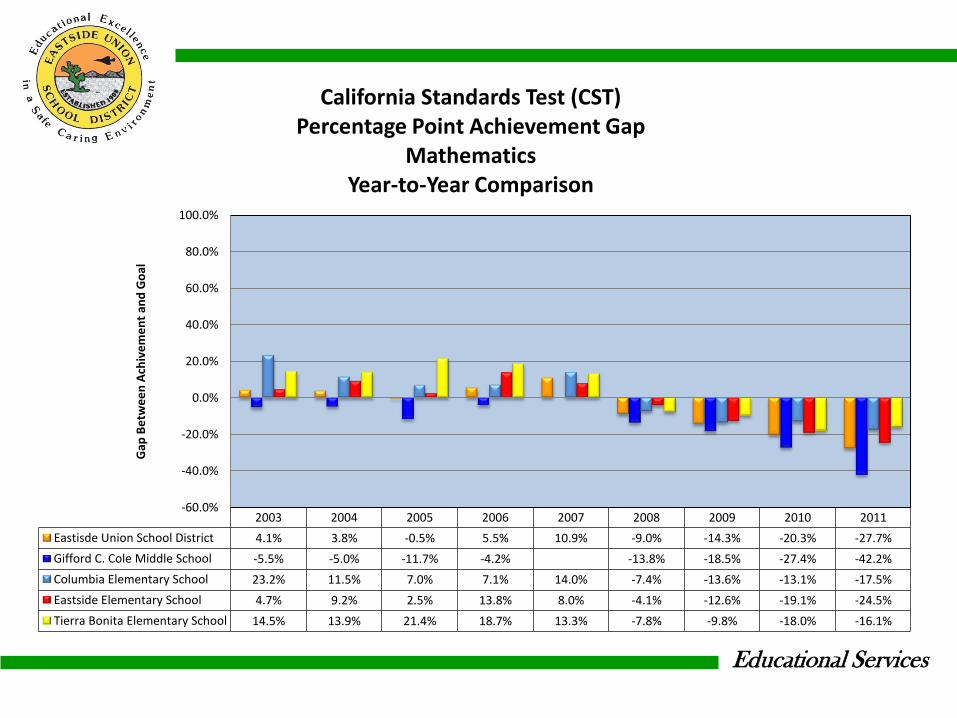
2003 2004 2005 2006 2007 2008 2009 2010 2011
Eastisde Union School District 4.1% 3.8% -0.5% 5.5% 10.9% -9.0% -14.3% -20.3% -27.7%
Gifford C. Cole Middle School -5.5% -5.0% -11.7% -4.2% -13.8% -18.5% -27.4% -42.2%
Columbia Elementary School 23.2% 11.5% 7.0% 7.1% 14.0% -7.4% -13.6% -13.1% -17.5%
Eastside Elementary School 4.7% 9.2% 2.5% 13.8% 8.0% -4.1% -12.6% -19.1% -24.5%
Tierra Bonita Elementary School 14.5% 13.9% 21.4% 18.7% 13.3% -7.8% -9.8% -18.0% -16.1%
-60.0%
-40.0%
-20.0%
0.0%
20.0%
40.0%
60.0%
80.0%
100.0%
Gap
Be
twe
en
Ach
ive
me
nt
and
Go
al
California Standards Test (CST) Percentage Point Achievement Gap
Mathematics Year-to-Year Comparison
Educational Services
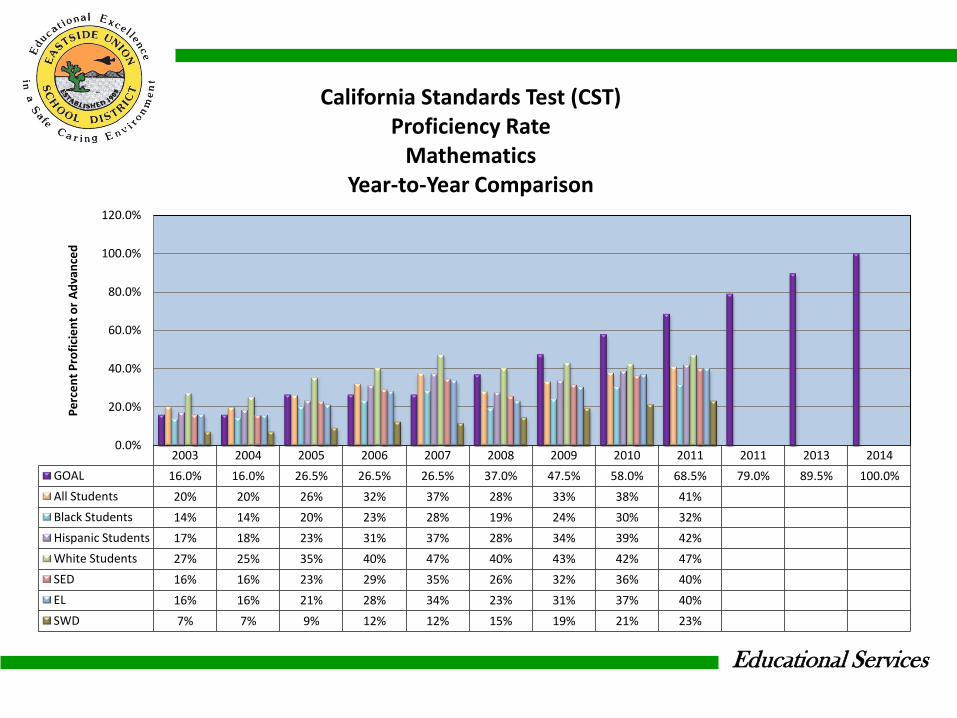
2003 2004 2005 2006 2007 2008 2009 2010 2011 2011 2013 2014
GOAL 16.0% 16.0% 26.5% 26.5% 26.5% 37.0% 47.5% 58.0% 68.5% 79.0% 89.5% 100.0%
All Students 20% 20% 26% 32% 37% 28% 33% 38% 41%
Black Students 14% 14% 20% 23% 28% 19% 24% 30% 32%
Hispanic Students 17% 18% 23% 31% 37% 28% 34% 39% 42%
White Students 27% 25% 35% 40% 47% 40% 43% 42% 47%
SED 16% 16% 23% 29% 35% 26% 32% 36% 40%
EL 16% 16% 21% 28% 34% 23% 31% 37% 40%
SWD 7% 7% 9% 12% 12% 15% 19% 21% 23%
0.0%
20.0%
40.0%
60.0%
80.0%
100.0%
120.0%
Pe
rce
nt
Pro
fici
en
t o
r A
dva
nce
d
California Standards Test (CST) Proficiency Rate
Mathematics Year-to-Year Comparison
Educational Services
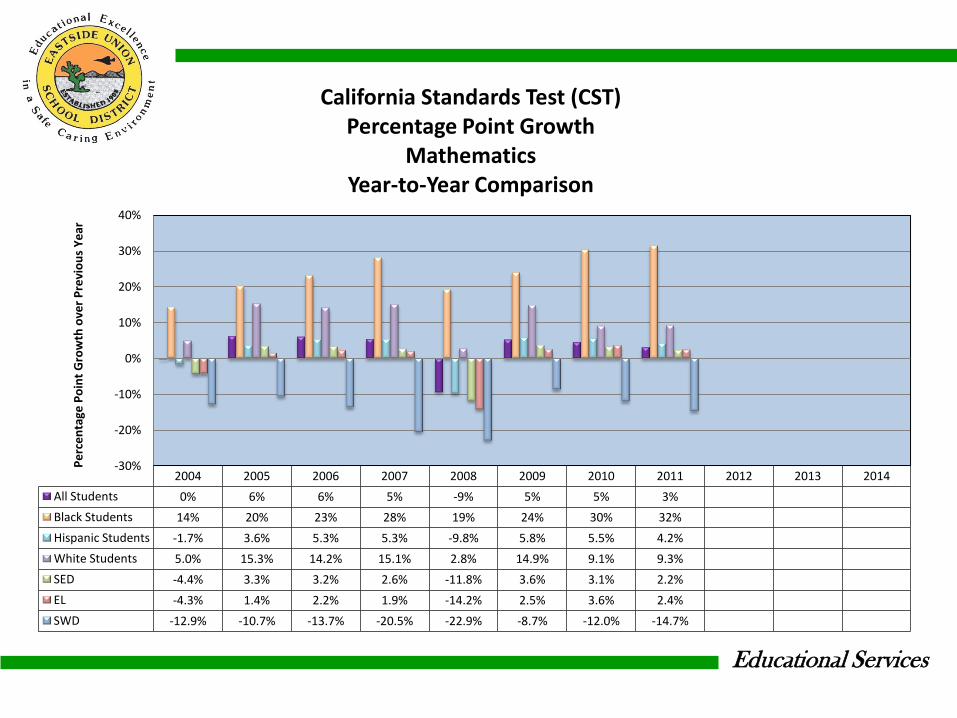
2004 2005 2006 2007 2008 2009 2010 2011 2012 2013 2014
All Students 0% 6% 6% 5% -9% 5% 5% 3%
Black Students 14% 20% 23% 28% 19% 24% 30% 32%
Hispanic Students -1.7% 3.6% 5.3% 5.3% -9.8% 5.8% 5.5% 4.2%
White Students 5.0% 15.3% 14.2% 15.1% 2.8% 14.9% 9.1% 9.3%
SED -4.4% 3.3% 3.2% 2.6% -11.8% 3.6% 3.1% 2.2%
EL -4.3% 1.4% 2.2% 1.9% -14.2% 2.5% 3.6% 2.4%
SWD -12.9% -10.7% -13.7% -20.5% -22.9% -8.7% -12.0% -14.7%
-30%
-20%
-10%
0%
10%
20%
30%
40%
Pe
rce
nta
ge P
oin
t G
row
th o
ver
Pre
vio
us
Ye
ar
California Standards Test (CST)
Percentage Point Growth Mathematics
Year-to-Year Comparison
Educational Services
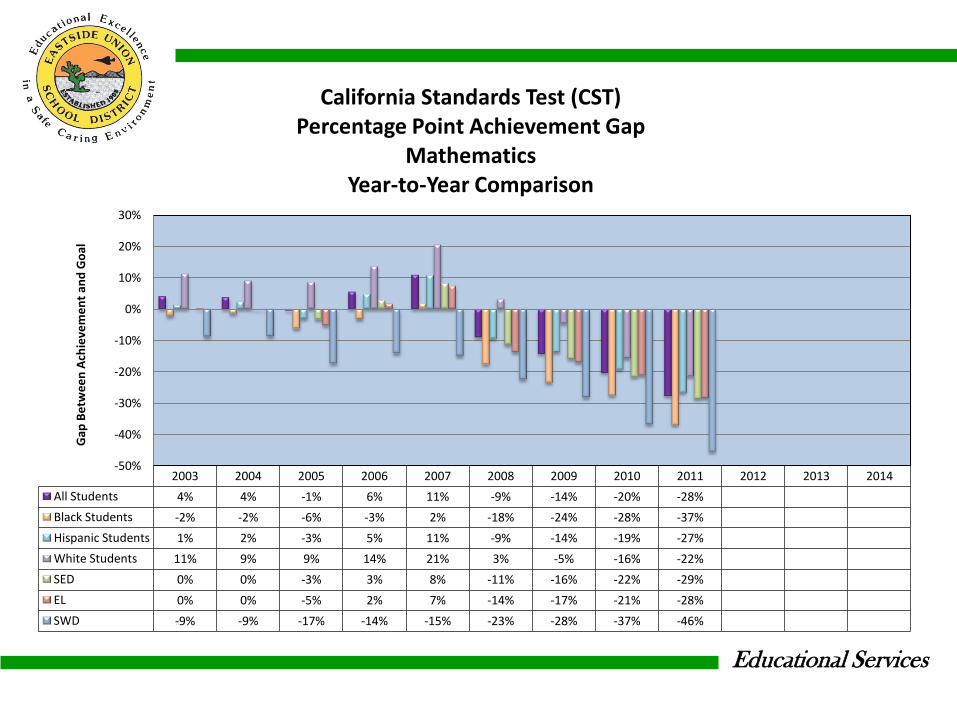
2003 2004 2005 2006 2007 2008 2009 2010 2011 2012 2013 2014
All Students 4% 4% -1% 6% 11% -9% -14% -20% -28%
Black Students -2% -2% -6% -3% 2% -18% -24% -28% -37%
Hispanic Students 1% 2% -3% 5% 11% -9% -14% -19% -27%
White Students 11% 9% 9% 14% 21% 3% -5% -16% -22%
SED 0% 0% -3% 3% 8% -11% -16% -22% -29%
EL 0% 0% -5% 2% 7% -14% -17% -21% -28%
SWD -9% -9% -17% -14% -15% -23% -28% -37% -46%
-50%
-40%
-30%
-20%
-10%
0%
10%
20%
30%
Gap
Be
twe
en
Ach
ieve
me
nt
and
Go
al
California Standards Test (CST)
Percentage Point Achievement Gap Mathematics
Year-to-Year Comparison
Educational Services
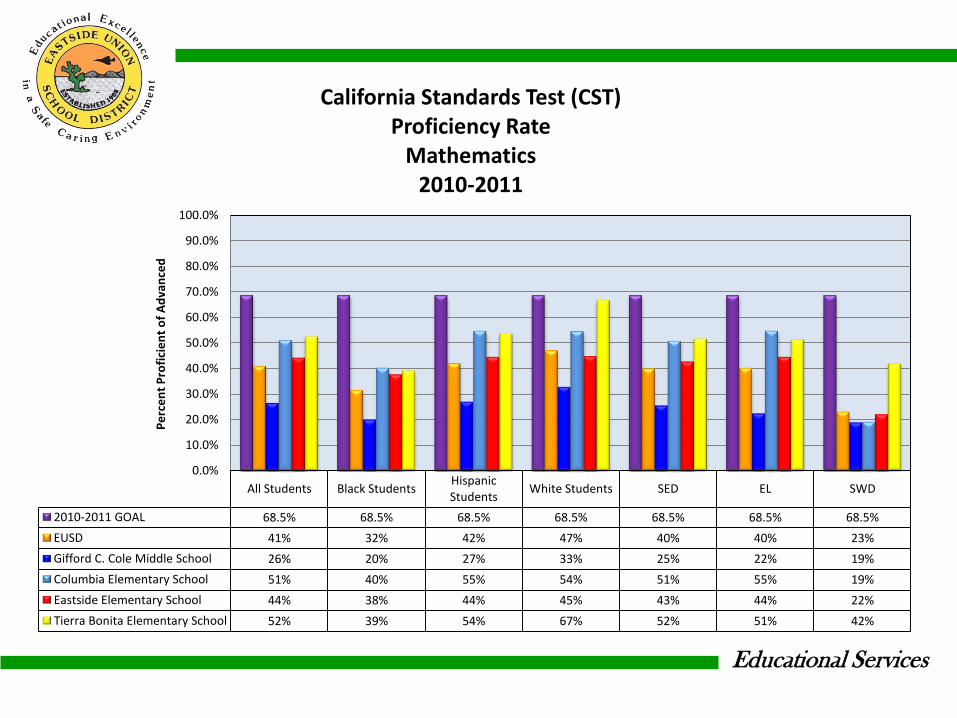
All Students Black Students Hispanic Students
White Students SED EL SWD
2010-2011 GOAL 68.5% 68.5% 68.5% 68.5% 68.5% 68.5% 68.5%
EUSD 41% 32% 42% 47% 40% 40% 23%
Gifford C. Cole Middle School 26% 20% 27% 33% 25% 22% 19%
Columbia Elementary School 51% 40% 55% 54% 51% 55% 19%
Eastside Elementary School 44% 38% 44% 45% 43% 44% 22%
Tierra Bonita Elementary School 52% 39% 54% 67% 52% 51% 42%
0.0%
10.0%
20.0%
30.0%
40.0%
50.0%
60.0%
70.0%
80.0%
90.0%
100.0%
Pe
rce
nt
Pro
fici
en
t o
f A
dva
nce
d
California Standards Test (CST) Proficiency Rate
Mathematics 2010-2011
Educational Services
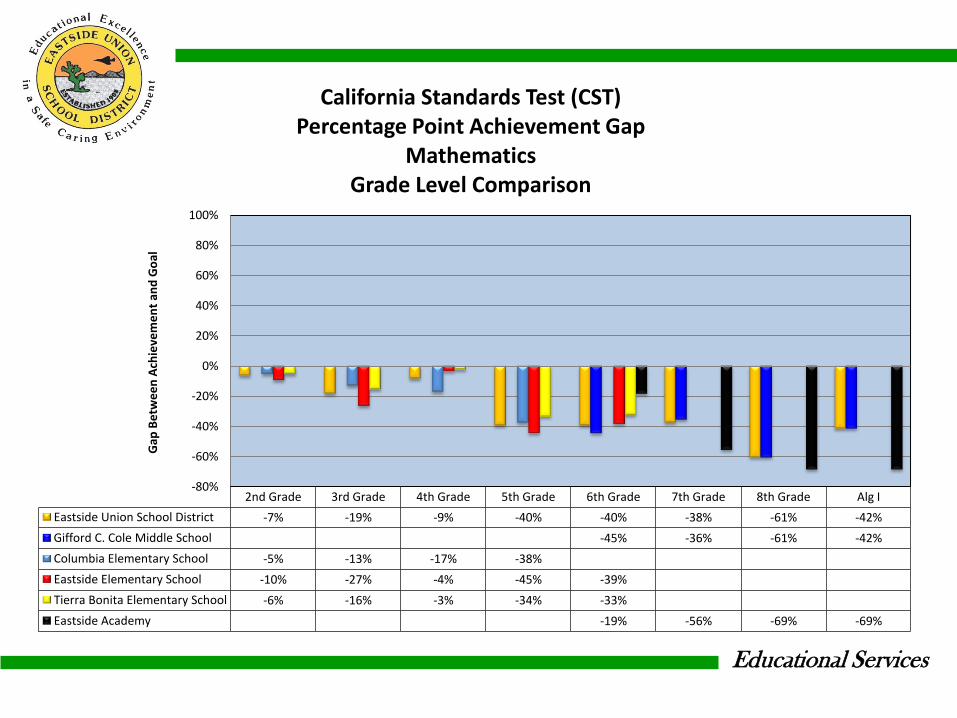
2nd Grade 3rd Grade 4th Grade 5th Grade 6th Grade 7th Grade 8th Grade Alg I
Eastside Union School District -7% -19% -9% -40% -40% -38% -61% -42%
Gifford C. Cole Middle School -45% -36% -61% -42%
Columbia Elementary School -5% -13% -17% -38%
Eastside Elementary School -10% -27% -4% -45% -39%
Tierra Bonita Elementary School -6% -16% -3% -34% -33%
Eastside Academy -19% -56% -69% -69%
-80%
-60%
-40%
-20%
0%
20%
40%
60%
80%
100%
Gap
Be
twe
en
Ach
ieve
me
nt
and
Go
al
California Standards Test (CST) Percentage Point Achievement Gap
Mathematics Grade Level Comparison
Educational Services
2003 2004 2005 2006 2007 2008 2009 2010 2011 2012 2013 2014
GOAL 16.0% 16.0% 26.5% 26.5% 26.5% 37.0% 47.5% 58.0% 68.5% 79.0% 89.5% 100.0%
Grade 2 44% 41% 48% 53% 49% 41% 48% 53% 62%
Grade 3 27% 30% 32% 35% 42% 32% 34% 42% 50%
Grade 4 26% 23% 33% 32% 31% 37% 38% 49% 60%
Grade 5 11% 11% 30% 30% 21% 17% 28% 23% 29%
Grade 6 10% 11% 12% 25% 18% 13% 21% 34% 29%
Grade 7 11% 9% 19% 15% 16% 17% 22% 26% 31%
Grade 8 9% 10% 10% 27% 8% 27% 32% 30% 8%
Algebra I 9% 15% 12% 34% 52% 64% 53% 24% 27%
0.0%
10.0%
20.0%
30.0%
40.0%
50.0%
60.0%
70.0%
80.0%
90.0%
100.0%
Pe
rce
nt
Pro
fici
en
t o
r A
dva
nce
d
California Standards Test (CST) Proficiency Rate
Mathematics Year-to-Year Comparison
Educational Services
2004 2005 2006 2007 2008 2009 2010 2011 2012 2013 2014
Grade 2 -3% 7% 5% -4% -8% 7% 5% 9%
Grade 3 -14% -9% -13% -11% -17% -7% -6% -3%
Grade 4 -21% -8% -16% -22% -12% -3% 1% 7%
Grade 5 -33% -11% -18% -32% -32% -13% -25% -24%
Grade 6 -33% -29% -23% -35% -36% -20% -14% -24%
Grade 7 -35% -22% -33% -37% -32% -19% -22% -22%
Grade 8 -34% -31% -21% -45% -22% -9% -18% -45%
Algebra I -29% -29% -14% -1% 15% 12% -24% -26%
-60%
-40%
-20%
0%
20%
40%
60%
80%
100%
Pe
rce
nta
ge P
oin
t G
row
th o
ver
Pre
vio
us
Ye
ar
California Standards Test (CST) Percentage Point Growth
Mathematics Year-to-Year Comparison

Educational Services
2003 2004 2005 2006 2007 2008 2009 2010 2011 2012 2013 2014
Grade 2 28% 25% 22% 27% 23% 4% 1% -5% -7%
Grade 3 11% 14% 6% 9% 16% -5% -14% -16% -19%
Grade 4 10% 7% 7% 6% 5% 0% -10% -9% -9%
Grade 5 -5% -5% 4% 4% -6% -20% -20% -35% -40%
Grade 6 -6% -5% -15% -2% -9% -24% -27% -24% -40%
Grade 7 -5% -7% -8% -12% -11% -20% -26% -32% -38%
Grade 8 -7% -6% -17% 1% -19% -10% -16% -28% -61%
Algebra I -7% -1% -15% 8% 26% 27% 6% -34% -42%
-80%
-60%
-40%
-20%
0%
20%
40%
60%
80%
100%
Gap
Be
twe
en
Ach
ive
me
nt
and
Go
al
California Standards Test (CST) Percentage Point Achievement Gap
Mathematics Year-to-Year Comparison

Educational Services
2nd Grade 3rd Grade 4th Grade 5th Grade 6th Grade 7th Grade 8th Grade Alg I
2010-2011 GOAL 68.5% 68.5% 68.5% 68.5% 68.5% 68.5% 68.5% 68.5%
Eastside Union School District 62% 50% 60% 29% 29% 31% 8% 27%
Gifford C. Cole Middle School 24% 33% 8% 27%
Columbia Elementary School 63% 55% 51% 31%
Eastside Elementary School 59% 42% 65% 24% 30%
Tierra Bonita Elementary School 63% 53% 66% 35% 36%
Eastside Academy 50% 13% 0%
0.0%
10.0%
20.0%
30.0%
40.0%
50.0%
60.0%
70.0%
80.0%
Pe
rce
nt
Pro
fici
en
t o
r A
dva
nce
d
California Standards Test (CST) Proficiency Rate
Mathematics 2010-2011
Educational Services
2nd Grade 3rd Grade 4th Grade 5th Grade 6th Grade 7th Grade 8th Grade Alg I
Eastside Union School District -7% -19% -9% -40% -40% -38% -61% -42%
Gifford C. Cole Middle School -45% -36% -61% -42%
Columbia Elementary School -5% -13% -17% -38%
Eastside Elementary School -10% -27% -4% -45% -39%
Tierra Bonita Elementary School -6% -16% -3% -34% -33%
Eastside Academy -19% -56% -69% -69%
-80%
-60%
-40%
-20%
0%
20%
40%
60%
80%
100%
Gap
Be
twe
en
Ach
ive
me
nt
and
Go
al
California Standards Test (CST) Percentage Point Achievement Gap
Mathematics 2010-2011
Educational Services
Grade 2 Grade 3 Grade 4 Grade 5 Grade 6 Grade 7 Grade 8
2011 GOAL 68.5% 68.5% 68.5% 68.5% 68.5% 68.5% 68.5%
All Students 62% 50% 60% 29% 29% 31% 8%
Intervention 49% 29% 45% 13% 18% 0% 0%
SES 67% 20% 53% 16% 16% 7% 0%
ASES 61% 51% 49% 28% 30% 38% 20%
0.0%
10.0%
20.0%
30.0%
40.0%
50.0%
60.0%
70.0%
80.0%
Pe
rce
nt
Pro
fici
en
t o
r A
dva
nce
d
California Standards Test (CST) Proficiency Rate
Mathematics Academic Support Programs
Educational Services
CALIFORNIA STANDARDS TEST (CST)
-STATE ACCOUNTABILITY-
2010-2011
Cohort Growth Summary
English-Language Arts
Educational Services
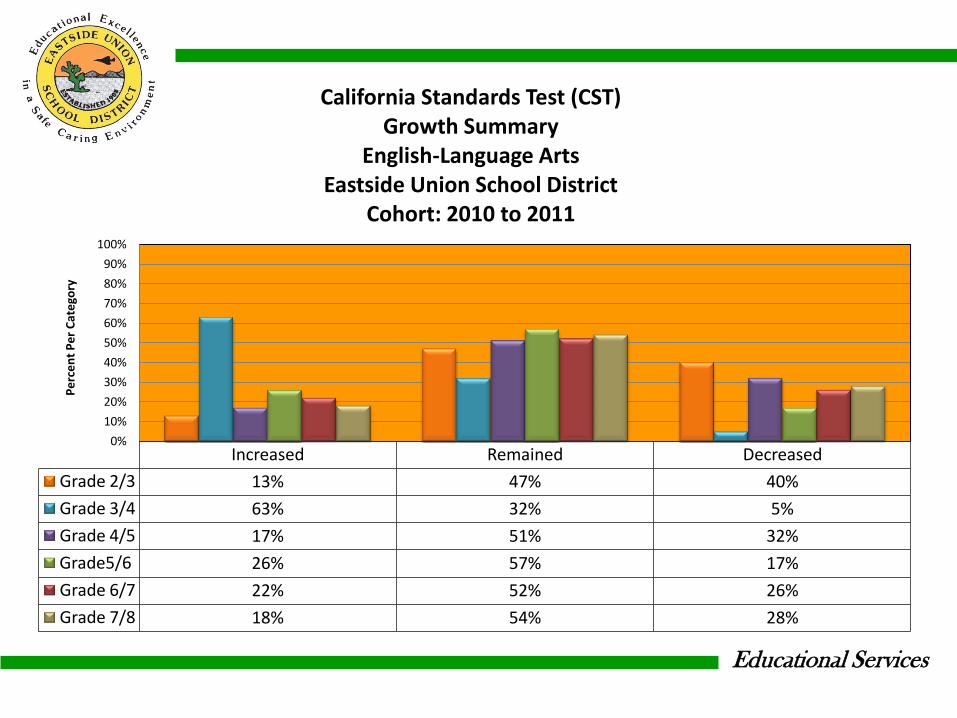
Increased Remained Decreased
Grade 2/3 13% 47% 40%
Grade 3/4 63% 32% 5%
Grade 4/5 17% 51% 32%
Grade5/6 26% 57% 17%
Grade 6/7 22% 52% 26%
Grade 7/8 18% 54% 28%
0%
10%
20%
30%
40%
50%
60%
70%
80%
90%
100%
Pe
rce
nt
Pe
r C
ate
gory
California Standards Test (CST) Growth Summary
English-Language Arts Eastside Union School District
Cohort: 2010 to 2011
Educational Services
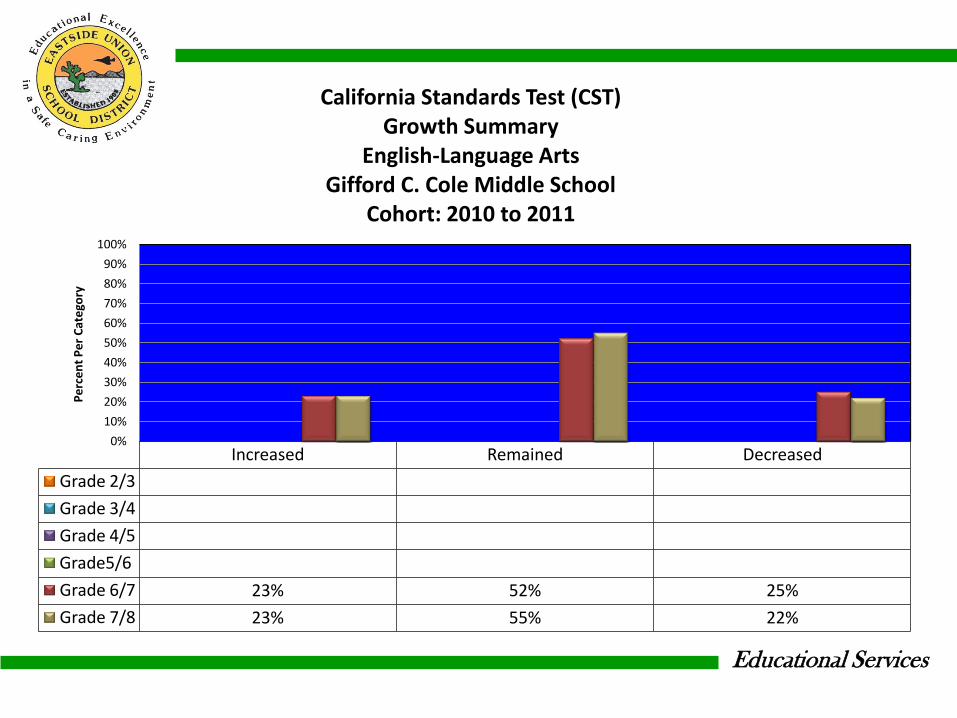
Increased Remained Decreased
Grade 2/3
Grade 3/4
Grade 4/5
Grade5/6
Grade 6/7 23% 52% 25%
Grade 7/8 23% 55% 22%
0%
10%
20%
30%
40%
50%
60%
70%
80%
90%
100%
Pe
rce
nt
Pe
r C
ate
gory
California Standards Test (CST) Growth Summary
English-Language Arts Gifford C. Cole Middle School
Cohort: 2010 to 2011
Educational Services
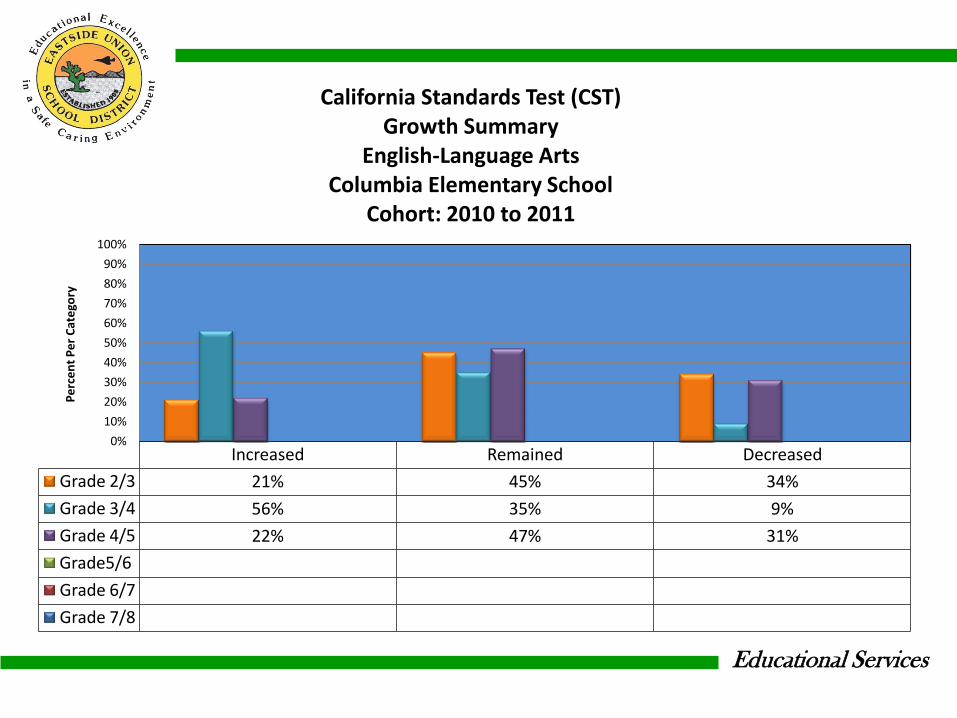
Increased Remained Decreased
Grade 2/3 21% 45% 34%
Grade 3/4 56% 35% 9%
Grade 4/5 22% 47% 31%
Grade5/6
Grade 6/7
Grade 7/8
0%
10%
20%
30%
40%
50%
60%
70%
80%
90%
100%
Pe
rce
nt
Pe
r C
ate
gory
California Standards Test (CST) Growth Summary
English-Language Arts Columbia Elementary School
Cohort: 2010 to 2011
Educational Services
Increased Remained Decreased
Grade 2/3 2% 56% 42%
Grade 3/4 68% 32% 0%
Grade 4/5 12% 52% 36%
Grade5/6 38% 51% 11%
Grade 6/7
Grade 7/8
0%
10%
20%
30%
40%
50%
60%
70%
80%
90%
100%
Pe
rce
nt
Pe
r C
ate
gory
California Standards Test (CST) Growth Summary
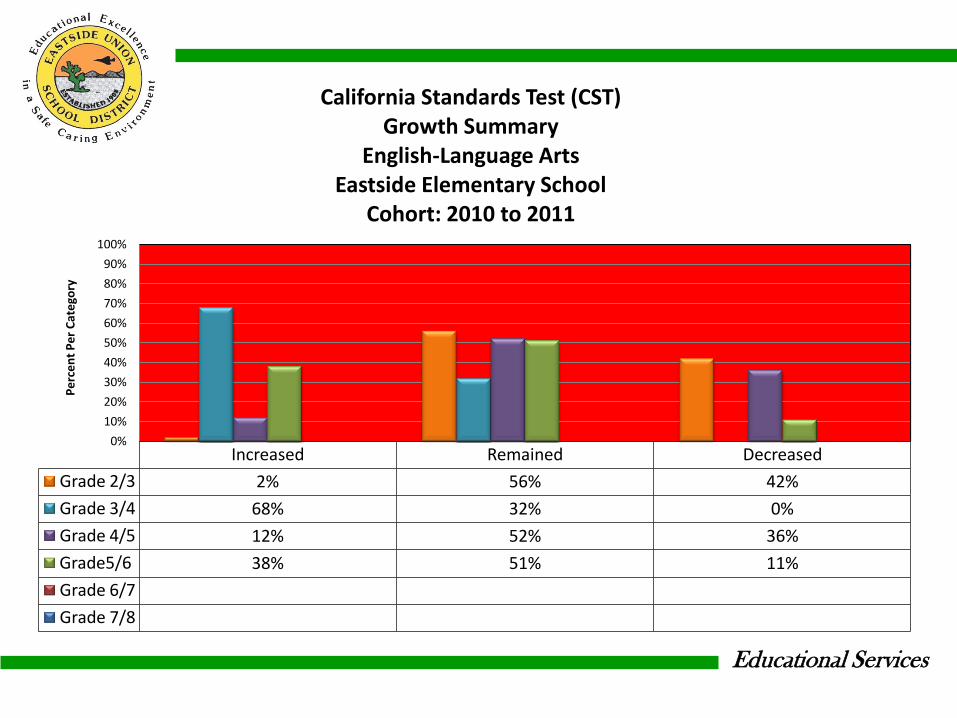
English-Language Arts Eastside Elementary School
Cohort: 2010 to 2011

Educational Services
Increased Remained Decreased
Grade 2/3 13% 38% 49%
Grade 3/4 66% 30% 4%
Grade 4/5 19% 53% 28%
Grade5/6 24% 57% 19%
Grade 6/7
Grade 7/8
0%
10%
20%
30%
40%
50%
60%
70%
80%
90%
100%
Pe
rce
nt
Pe
r C
ateg
ory
California Standards Test (CST) Growth Summary
English-Language Arts Tierra Bonita Elementary School
Cohort: 2010 to 2011
Educational Services
Increased Remained Decreased
Grade 2/3
Grade 3/4
Grade 4/5
Grade5/6
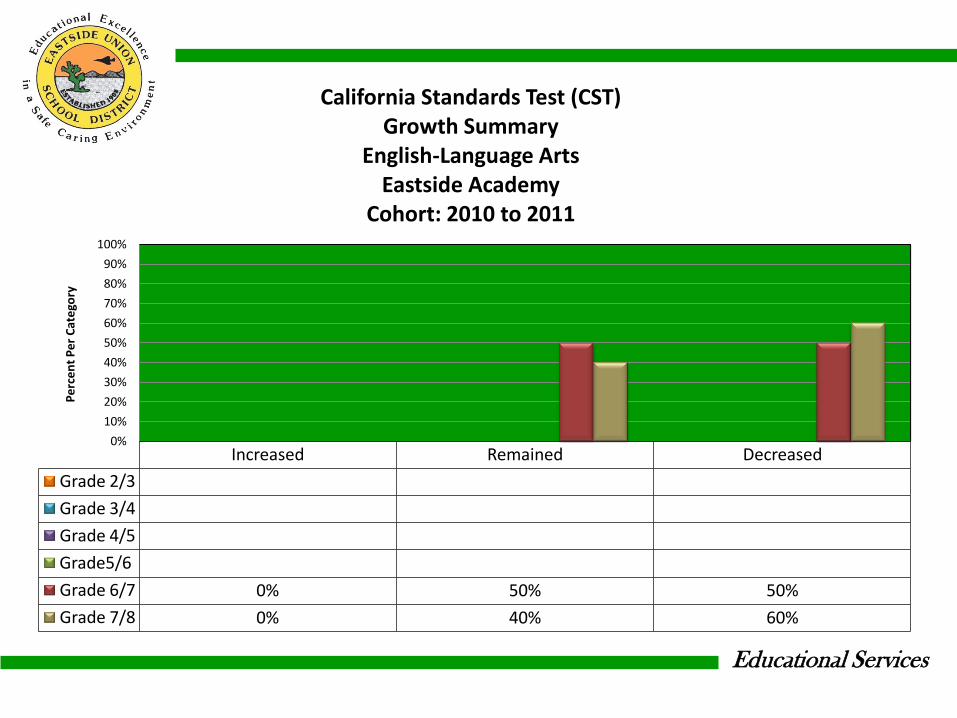
Grade 6/7 0% 50% 50%
Grade 7/8 0% 40% 60%
0%
10%
20%
30%
40%
50%
60%
70%
80%
90%
100%
Pe
rce
nt
Pe
r C
ate
gory
California Standards Test (CST) Growth Summary
English-Language Arts Eastside Academy
Cohort: 2010 to 2011
Educational Services
CALIFORNIA STANDARDS TEST (CST)
-STATE ACCOUNTABILITY-
2010-2011
Cohort Growth Summary
Mathematics

Educational Services
Increased Remained Decreased
Grade 2/3 25% 42% 33%
Grade 3/4 48% 37% 15%
Grade 4/5 9% 43% 48%
Grade5/6 38% 46% 16%
Grade 6/7 24% 56% 20%
Grade 7/8 41% 47% 12%
Grade 7/Alg I 7% 39% 54%
0%
10%
20%
30%
40%
50%
60%
70%
80%
90%
100%
Pe
rce
nt
Pe
r C
ate
gory
California Standards Test (CST) Growth Summary
Mathematics Eastside Union School District
Cohort: 2010 to 2011
Educational Services
Increased Remained Decreased
Grade 2/3
Grade 3/4
Grade 4/5
Grade5/6
Grade 6/7 24% 56% 20%
Grade 7/8 40% 47% 13%
Grade 7/Alg I 8% 38% 54%
0
0.1
0.2
0.3
0.4
0.5
0.6
0.7
0.8
0.9
1
Pe
rce
nt
Pe
r C
ate
gory
California Standards Test (CST) Growth Summary
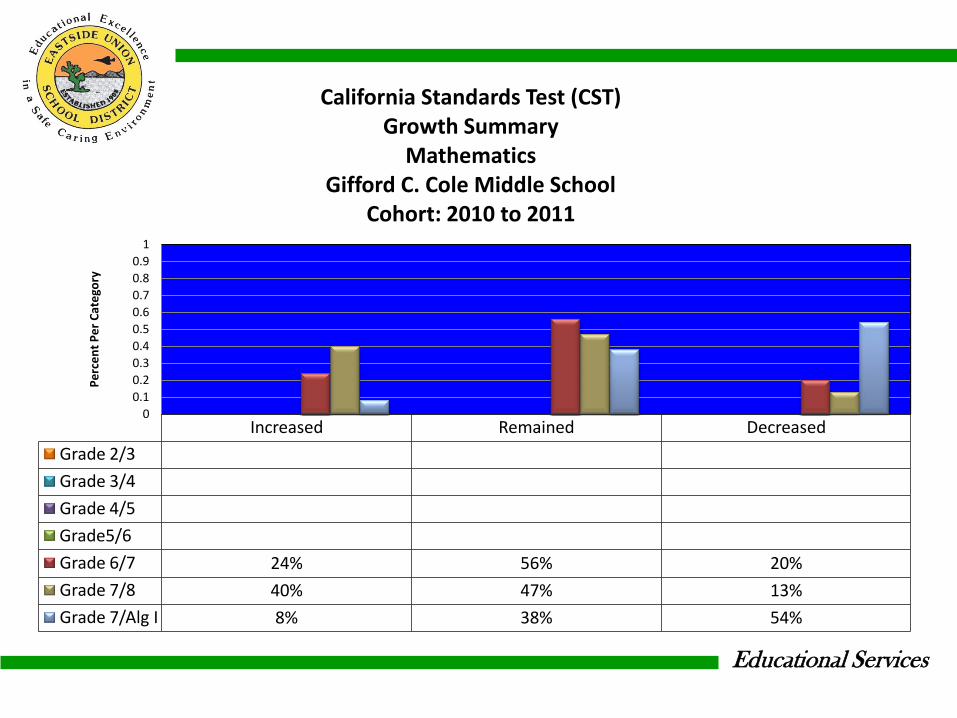
Mathematics Gifford C. Cole Middle School
Cohort: 2010 to 2011

Educational Services
Increased Remained Decreased
Grade 2/3 40% 34% 26%
Grade 3/4 16% 54% 30%
Grade 4/5 13% 40% 47%
Grade5/6
Grade 6/7
Grade 7/8
Grade 7/Alg I
0%
10%
20%
30%
40%
50%
60%
70%
80%
90%
100%
Pe
rce
nt
Pe
r C
ate
gory
California Standards Test (CST) Growth Summary
Mathematics Columbia Elementary School
Cohort: 2010 to 2011
Educational Services
Increased Remained Decreased
Grade 2/3 11% 47% 42%
Grade 3/4 63% 32% 5%
Grade 4/5 5% 37% 58%
Grade5/6 58% 36% 6%
Grade 6/7
Grade 7/8
Grade 7/Alg I
0%
10%
20%
30%
40%
50%
60%
70%
80%
90%
100%
Pe
rce
nt
Pe
r C
ate
gory
California Standards Test (CST) Growth Summary
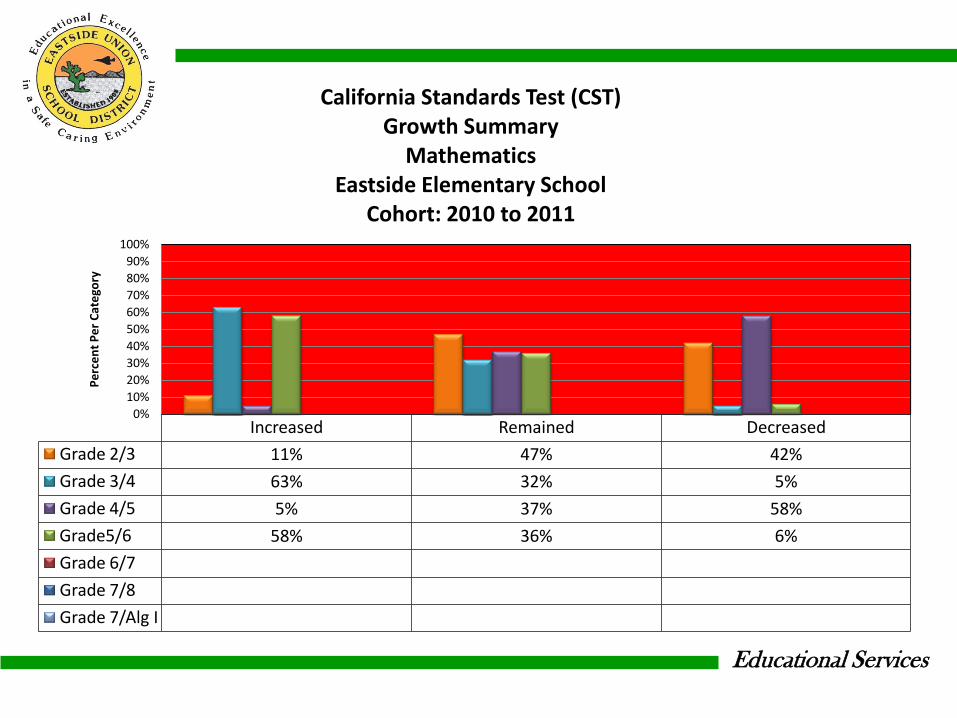
Mathematics Eastside Elementary School
Cohort: 2010 to 2011
Educational Services
Increased Remained Decreased
Grade 2/3 18% 49% 33%
Grade 3/4 69% 23% 8%
Grade 4/5 8% 55% 37%
Grade5/6 36% 48% 16%
Grade 6/7
Grade 7/8
Grade 7/Alg I
0%
10%
20%
30%
40%
50%
60%
70%
80%
90%
100%
Pe
rce
nt
Pe
r C
ateg
ory
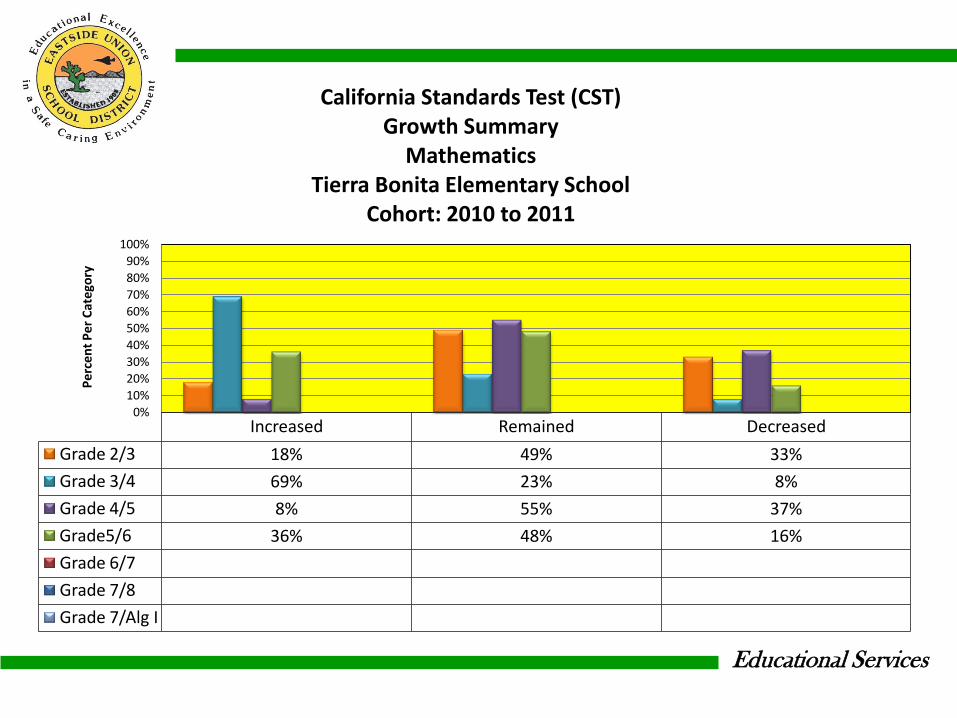
California Standards Test (CST) Growth Summary
Mathematics Tierra Bonita Elementary School
Cohort: 2010 to 2011

Educational Services
Increased Remained Decreased
Grade 2/3
Grade 3/4
Grade 4/5
Grade5/6
Grade 6/7 50% 0% 50%
Grade 7/8 0% 100% 0%
Grade 7/Alg I 50% 0% 50%
0
0.1
0.2
0.3
0.4
0.5
0.6
0.7
0.8
0.9
1
Pe
rce
nt
Pe
r C
ate
gory
California Standards Test (CST) Growth Summary
Mathematics Eastside Academy
Cohort: 2010 to 2011
Educational Services
CALIFORNIA STANDARDS TEST (CST)
-STATE ACCOUNTABILITY-
2010-2011
Cluster Analysis
English-Language Arts

Educational Services
Word Analysis and Vocabulary
Development
Reading Comprehension
Literary Response and Analysis
Written Convention Writing Strategies Writing Applications
Grade 2 66.6% 61.4% 70.3% 63.8% 53.5%
Grade 3 63.0% 54.8% 67.6% 55.4% 48.6%
Grade 4 65.2% 52.4% 56.9% 59.5% 46.9% 56.0%
Grade 5 62.2% 56.2% 59.2% 60.0% 52.6%
Grade 6 60.9% 51.7% 55.8% 59.7% 50.9%
Grade 7 63.4% 60.5% 59.9% 59.1% 52.5% 76.7%
Grade 8 57.0% 59.7% 52.6% 56.3% 54.5%
0.0%
10.0%
20.0%
30.0%
40.0%
50.0%
60.0%
70.0%
80.0%
90.0%
100.0%
% C
orr
ect
California Standards Test (CST) Cluster Analysis
English Language Arts By Grade Level
Educational Services
CALIFORNIA STANDARDS TEST (CST)
-STATE ACCOUNTABILITY-
2010-2011
Cluster Analysis
Mathematics
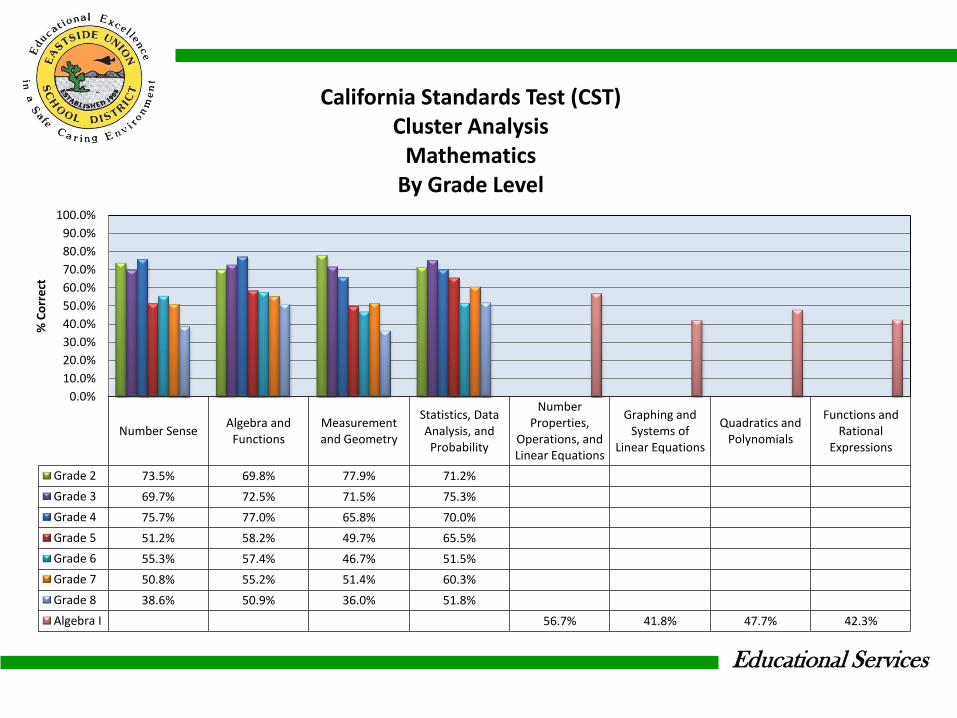
Educational Services
Number Sense Algebra and
Functions Measurement and Geometry
Statistics, Data Analysis, and Probability
Number Properties,
Operations, and Linear Equations
Graphing and Systems of
Linear Equations
Quadratics and Polynomials
Functions and Rational
Expressions
Grade 2 73.5% 69.8% 77.9% 71.2%
Grade 3 69.7% 72.5% 71.5% 75.3%
Grade 4 75.7% 77.0% 65.8% 70.0%
Grade 5 51.2% 58.2% 49.7% 65.5%
Grade 6 55.3% 57.4% 46.7% 51.5%
Grade 7 50.8% 55.2% 51.4% 60.3%
Grade 8 38.6% 50.9% 36.0% 51.8%
Algebra I 56.7% 41.8% 47.7% 42.3%
0.0%
10.0%
20.0%
30.0%
40.0%
50.0%
60.0%
70.0%
80.0%
90.0%
100.0%
% C
orr
ect
California Standards Test (CST) Cluster Analysis
Mathematics By Grade Level
Educational Services
CALIFORNIA MODIFIED ASSESSMENT (CMA)
-STATE ACCOUNTABILITY-
2010-2011
English Language Arts
Educational Services
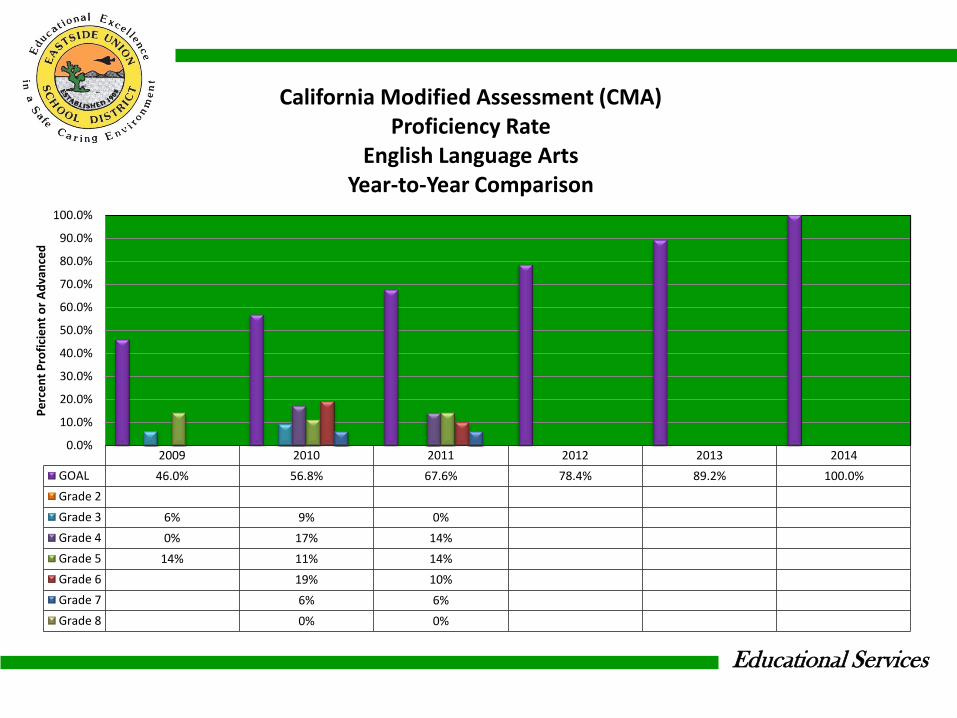
2009 2010 2011 2012 2013 2014
GOAL 46.0% 56.8% 67.6% 78.4% 89.2% 100.0%
Grade 2
Grade 3 6% 9% 0%
Grade 4 0% 17% 14%
Grade 5 14% 11% 14%
Grade 6 19% 10%
Grade 7 6% 6%
Grade 8 0% 0%
0.0%
10.0%
20.0%
30.0%
40.0%
50.0%
60.0%
70.0%
80.0%
90.0%
100.0%
Pe
rce
nt
Pro
fici
en
t o
r A
dva
nce
d
California Modified Assessment (CMA) Proficiency Rate
English Language Arts Year-to-Year Comparison
Educational Services
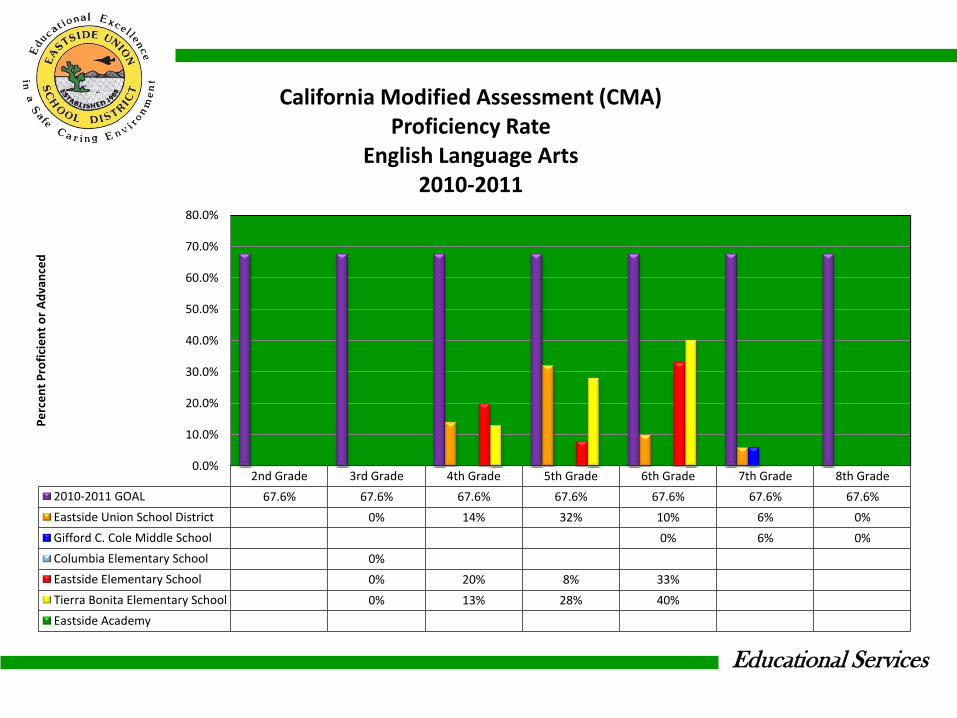
2nd Grade 3rd Grade 4th Grade 5th Grade 6th Grade 7th Grade 8th Grade
2010-2011 GOAL 67.6% 67.6% 67.6% 67.6% 67.6% 67.6% 67.6%
Eastside Union School District 0% 14% 32% 10% 6% 0%
Gifford C. Cole Middle School 0% 6% 0%
Columbia Elementary School 0%
Eastside Elementary School 0% 20% 8% 33%
Tierra Bonita Elementary School 0% 13% 28% 40%
Eastside Academy
0.0%
10.0%
20.0%
30.0%
40.0%
50.0%
60.0%
70.0%
80.0%
Pe
rce
nt
Pro
fici
en
t o
r A
dva
nce
d
California Modified Assessment (CMA) Proficiency Rate
English Language Arts 2010-2011
Educational Services
CALIFORNIA MODIFIED ASSESSMENT (CMA)
-STATE ACCOUNTABILITY-
2010-2011
Mathematics
Educational Services
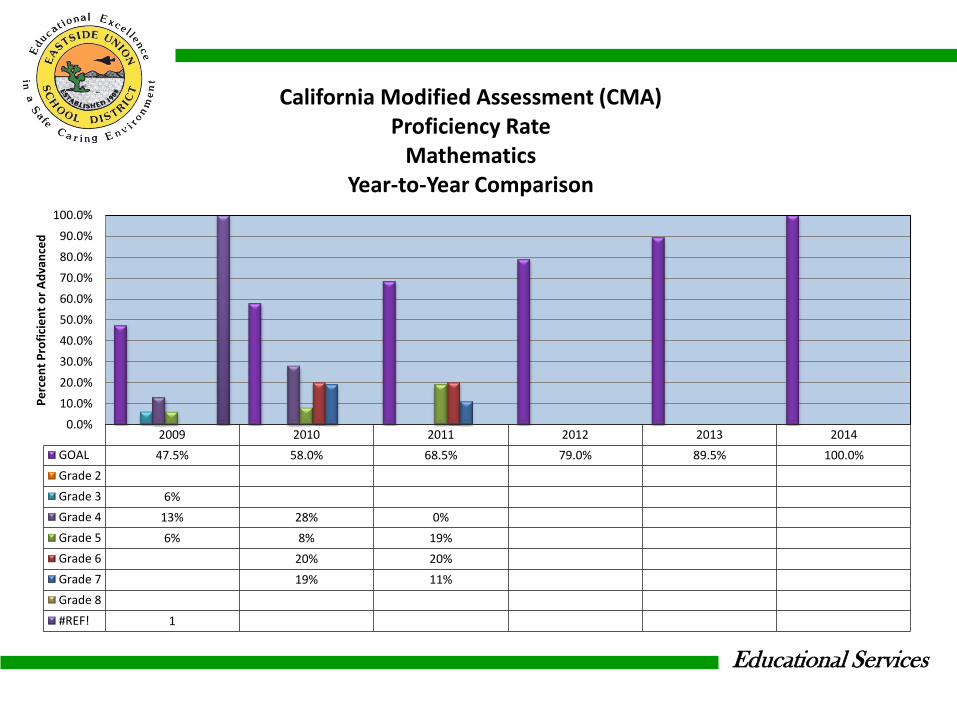
2009 2010 2011 2012 2013 2014
GOAL 47.5% 58.0% 68.5% 79.0% 89.5% 100.0%
Grade 2
Grade 3 6%
Grade 4 13% 28% 0%
Grade 5 6% 8% 19%
Grade 6 20% 20%
Grade 7 19% 11%
Grade 8
#REF! 1
0.0%
10.0%
20.0%
30.0%
40.0%
50.0%
60.0%
70.0%
80.0%
90.0%
100.0%
Pe
rce
nt
Pro
fici
en
t o
r A
dva
nce
d
California Modified Assessment (CMA) Proficiency Rate
Mathematics Year-to-Year Comparison
Educational Services
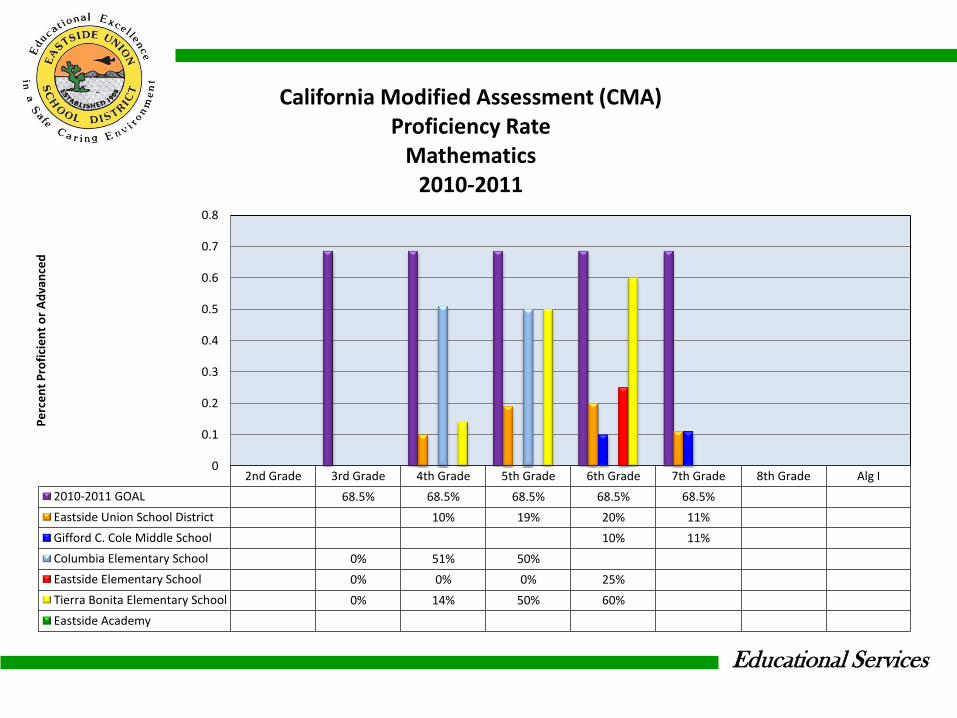
2nd Grade 3rd Grade 4th Grade 5th Grade 6th Grade 7th Grade 8th Grade Alg I
2010-2011 GOAL 68.5% 68.5% 68.5% 68.5% 68.5%
Eastside Union School District 10% 19% 20% 11%
Gifford C. Cole Middle School 10% 11%
Columbia Elementary School 0% 51% 50%
Eastside Elementary School 0% 0% 0% 25%
Tierra Bonita Elementary School 0% 14% 50% 60%
Eastside Academy
0
0.1
0.2
0.3
0.4
0.5
0.6
0.7
0.8
Pe
rce
nt
Pro
fici
en
t o
r A
dva
nce
d
California Modified Assessment (CMA) Proficiency Rate
Mathematics 2010-2011
Educational Services
DISTRICT, COUNTY, STATE COMPARISON
2010-2011
Academic Performance Index (API)
California Standards Test (CST)
Educational Services
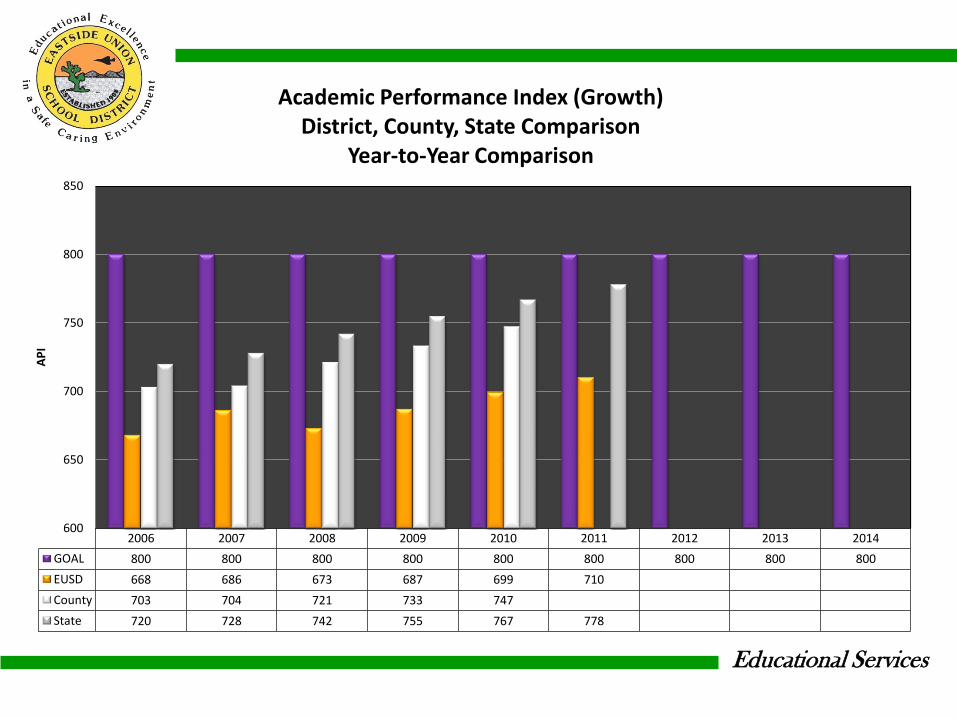
2006 2007 2008 2009 2010 2011 2012 2013 2014
GOAL 800 800 800 800 800 800 800 800 800
EUSD 668 686 673 687 699 710
County 703 704 721 733 747
State 720 728 742 755 767 778
600
650
700
750
800
850
AP
I
Academic Performance Index (Growth) District, County, State Comparison
Year-to-Year Comparison
Educational Services
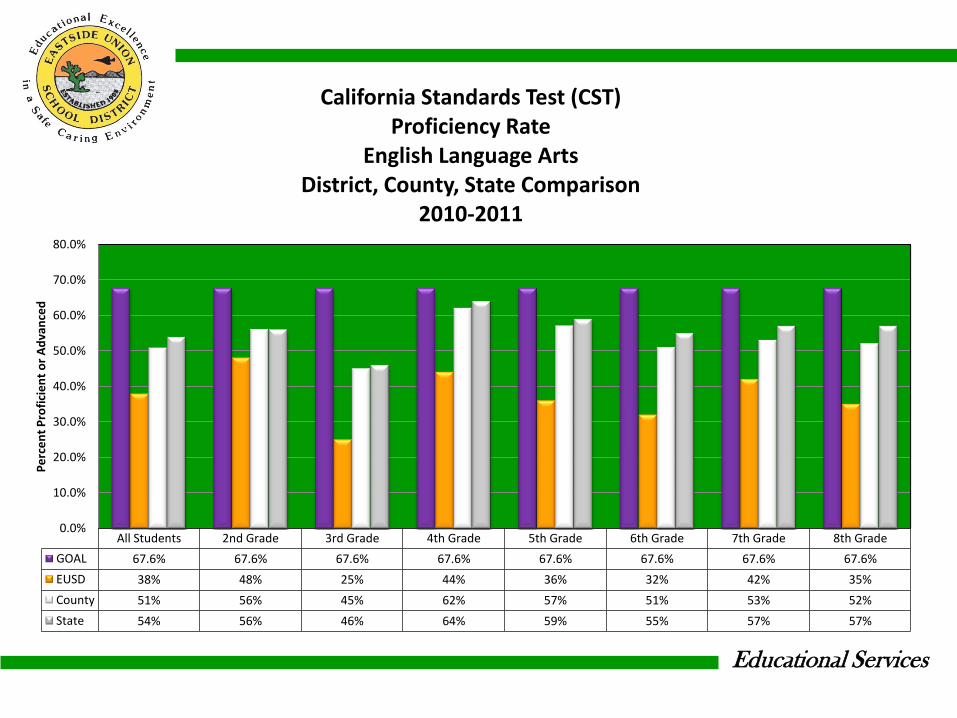
All Students 2nd Grade 3rd Grade 4th Grade 5th Grade 6th Grade 7th Grade 8th Grade
GOAL 67.6% 67.6% 67.6% 67.6% 67.6% 67.6% 67.6% 67.6%
EUSD 38% 48% 25% 44% 36% 32% 42% 35%
County 51% 56% 45% 62% 57% 51% 53% 52%
State 54% 56% 46% 64% 59% 55% 57% 57%
0.0%
10.0%
20.0%
30.0%
40.0%
50.0%
60.0%
70.0%
80.0%
Pe
rce
nt
Pro
fici
en
t o
r A
dva
nce
d
California Standards Test (CST) Proficiency Rate
English Language Arts District, County, State Comparison
2010-2011

Educational Services
GOAL All Students Black Students Hispanic Students White Students SED EL SWD
EUSD 67.6% 37.8% 32% 36% 50% 36% 32% 16%
County 67.6%
State 67.6% 56.2% 43% 45% 72% 44% 39% 34%
Pe
rce
nt
Pro
fici
en
t o
r A
dva
nce
d
California Standards Test (CST) Proficiency Rate
English-Language Arts District, County, State Comparison
2010-2011
Educational Services
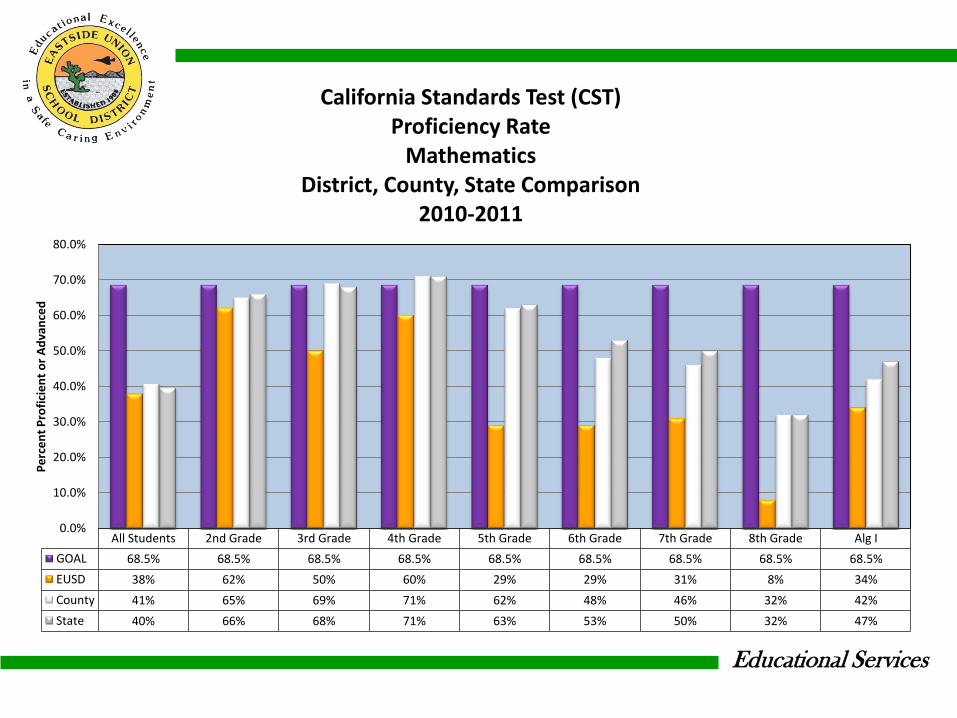
All Students 2nd Grade 3rd Grade 4th Grade 5th Grade 6th Grade 7th Grade 8th Grade Alg I
GOAL 68.5% 68.5% 68.5% 68.5% 68.5% 68.5% 68.5% 68.5% 68.5%
EUSD 38% 62% 50% 60% 29% 29% 31% 8% 34%
County 41% 65% 69% 71% 62% 48% 46% 32% 42%
State 40% 66% 68% 71% 63% 53% 50% 32% 47%
0.0%
10.0%
20.0%
30.0%
40.0%
50.0%
60.0%
70.0%
80.0%
Pe
rce
nt
Pro
fici
en
t o
r A
dva
nce
d
California Standards Test (CST) Proficiency Rate
Mathematics District, County, State Comparison
2010-2011

Educational Services
GOAL All Students Black Students Hispanic Students White Students SED EL SWD
EUSD 68.5% 40.8% 32% 42% 47% 40% 40% 23%
County 68.5%
State 68.5% 58.4% 41% 50% 70% 49% 49% 36%
Pe
rce
nt
Pro
fici
en
t o
r A
dva
nce
d
California Standards Test (CST) Proficiency Rate
Mathematics District, County, State Comparison
2010-2011


![· Caffè Latte [Hot/lce] ñ7x3yî- Café au Lait [Hot/lce] Cappuccino Espresso Hot Chocolate 650 1,000 650 700 700 700 700 700 700 700 700 700 To the guests who have some allergy](https://static.fdocuments.net/doc/165x107/5c674b4309d3f226588ba938/-caffe-latte-hotlce-n7x3yi-cafe-au-lait-hotlce-cappuccino-espresso.jpg)


![ACCOUNTABILITY REPORT 2013 › ... › 01 › EDUCO-ACCOUNTABILITY-REPO… · Accountability report 2013 [3]](https://static.fdocuments.net/doc/165x107/5f03b5847e708231d40a62a8/accountability-report-2013-a-a-01-a-educo-accountability-repo-accountability.jpg)