How To Read A Medical Paper: Part 2, Assessing the Methodological Quality
Upload
john-lewisCategory
view
217download
0
7/29/2019 Assessing Youth Sprint Ability Methodological Issues, Reliability and Performance Data
http://slidepdf.com/reader/full/assessing-youth-sprint-ability-methodological-issues-reliability-and-performance 1/27
Pediatric Exercise Science, 2011, 23, 442-467
© 2011 Human Kinetics, Inc.
review article
Assessing Youth Sprint Ability—Methodological Issues, Reliability
and Performance Data
Michael C. Rumpf and John B. Cronin
University of Technology
Jon L. Oliver and Michael Hughes
University of Wales Institute
The primary purpose of this paper was to provide insight into the methodological
issues and associated reliability of assessments used to quantify running sprint
ability in youth athletes aged 8–18 years. Over-ground sprinting was the most
reliable and common used choice of assessment to measure sprint performance of
youth. In addition, the performance data of those athletes over distances ranging
from 5 to 40 meters was collated from 34 published articles and tabulated with
regards to the athlete’s chronological age. Torque or nonmotorized treadmills have
been used to quantify sprint performance in youth with acceptable reliability, this
technology providing deeper insight into sprint kinetics and kinematics; however
there is limited performance data on youth using the torque and the nonmotorized
treadmill. It is suggested that future research should use this technology in youth
to better understand changes associated with growth, maturation and training.
Sprinting is an essential component in many sports and can distinguish betweengood and better athletes during team sports performance (49). The sprint can be
divided into a number of phases: the start including rst step quickness, acceleration,maximum velocity, and deceleration. First step quickness, dened as the rst 0–5m is usually included in the acceleration phase, particularly characterized by highpropulsion force (39,50), and of extreme importance in many sports (12,19,25). Theacceleration phase can also be dened as the distance needed to attain maximumvelocity. Maximum velocity is the highest speed during the sprint. Decelerationfollows the maximum velocity phase and is characterized by a percentage decreasein velocity until the completion of the sprint. Depending on the sport and position,the phases of the sprint can have different importance. For example the accelerationphase of untrained is shorter (8) compared with professional sprinters who are ableto accelerate until 50–60 m (8,40), whereas professional soccer players use only17–20 m in distance (9).

7/29/2019 Assessing Youth Sprint Ability Methodological Issues, Reliability and Performance Data
http://slidepdf.com/reader/full/assessing-youth-sprint-ability-methodological-issues-reliability-and-performance 2/27
Assessing Youth Sprint Ability 443
Testing and monitoring athletes sprinting speed is important and can havedifferent purposes i.e., comparison between athletes, controlling training efcacy,talent identication and monitoring long-term-athlete development. However, most
of the literature relates to adults, even though more young athletes are becominginvolved in advanced level athletics (23) and long term athlete/player developmentprograms, which suggests the needs for accurate and reliable tests and performancedata in youth. Currently a variety of assessment equipment and techniques can beused to assess the sprint ability of athletes’ e.g., timing lights, torque treadmillsand nonmotorized treadmills. The quantity and quality of the information providedby these technologies varies markedly and the reader needs to be cognizant of theadvantages and limitations as well as the contribution each technology providesin understanding sprint capability, particularly in youth. Given this informationthe aim of this article is to: 1) describe the most common tests used for assessing
sprint running in youth; 2) present the associated reliability for the tests; and, 3)present performance data for each assessment where appropriate.
Methods
To obtain articles for the review, a database search of PubMed, Google Scholar,Sport Discus and Medline was conducted. The search terms used as separate wordsor in combination with each other for “title”, “keywords” and “in-text search” were:“sprint”, “sprinting”, “acceleration”, “velocity”, “running”, “power”, “speed”,“agility”, “ability”, “repeated”, “youth”, “short term power output”, “long termdevelopment”, “physical activity”, “children”, “performance”, “assessment”,“motor”, “competence” and “skills”. The bibliographies of all reviewed articleswere then searched and also reviewed. The search ended on the 18th of November2010. Studies were included if they fullled the following 6 selection criteria:(a) the study clearly detailed the outcome measures of interest (e.g., sprint timeover 30 m) which had to be less than 40 m; (b) the study gave information aboutparticipants characteristics (i.e., number, age); (c) the study clearly outlinedmeasurement procedures (i.e., used equipment, testing procedures); (d) the studypresented group means for the appropriate sample; (e) the study was published in
a peer-reviewed book or as peer-reviewed journal article or abstract; and (f) thestudy had to have been written in the English or German language. The followingcharacteristics were recorded for all articles: Author, year, sample size, gender,training status, age, maturation, testing distance, testing equipment, data analysis,dependent variables and sprint time.
Results
Overground Running Tests
A total of 106 studies were found of which 34 studies were included and 72 excludedin this section. Reasons for exclusion included an insufcient description of the:subject’s characteristics; age range; or assessment procedures i e measurement
7/29/2019 Assessing Youth Sprint Ability Methodological Issues, Reliability and Performance Data
http://slidepdf.com/reader/full/assessing-youth-sprint-ability-methodological-issues-reliability-and-performance 3/27
Table 1 Cross-Sectional Studies That Assessed Overground Sprinting
Performance of Boys
Author (Ref)
Subject Characteristics
Number and genderTraining status
Age/maturation
Babel et al. (1) 17♂
Nonathletic boys
TS 1
8 Caucasian group
11.2 y, 1.41 m
9 Afro-Caribbean group
11.7 y, 1.47 m
Berg et al. (2) 14♂, 11.8 y, 1.54 m, 42.2 kg
Buttifant et al. (4) 21♂ junior national and state representative footballplayers, 16.1 y, 1.75 m, 69.2 kg
Christou et al. (6) 26♂
4.3 y of soccer experience
Experimental 1:
9♂, 13.8 y, 1.62–1.65 m, 52–57.5 kg, TS 4.0–4.3
Experimental 2:
9♂, 13.3 y, 1.63–1.65 m, 54.1–55.3 kg, TS 3.9–4.2
Control:
8♂, 13.3 y, 1.63–1.66 m, 57.4–55.8 kg, 3.8–4.2 TS
Colella et al. (7) 105♂
8–10 y, 9.2 y, maturation measured but no data given
Overweight♂
17♂, 8.4 y, 1.33 m, 42.46 kg
17♂, 9.5 y, 1.40 m, 45.96 kg
18♂, 10.3 y, 1.45 m, 51.66
Not overweight♂
18♂, 8.4 y, 1.29 m, 27.03 kg
17♂, 9.5 y, 1.31 m, 28.13 kg
17♂, 10.3 y, 1.41 m, 35.52 kg
Dourado et al. (10) 100♂U14 soccer players, 1.57 m, 46.12, kg

7/29/2019 Assessing Youth Sprint Ability Methodological Issues, Reliability and Performance Data
http://slidepdf.com/reader/full/assessing-youth-sprint-ability-methodological-issues-reliability-and-performance 4/27
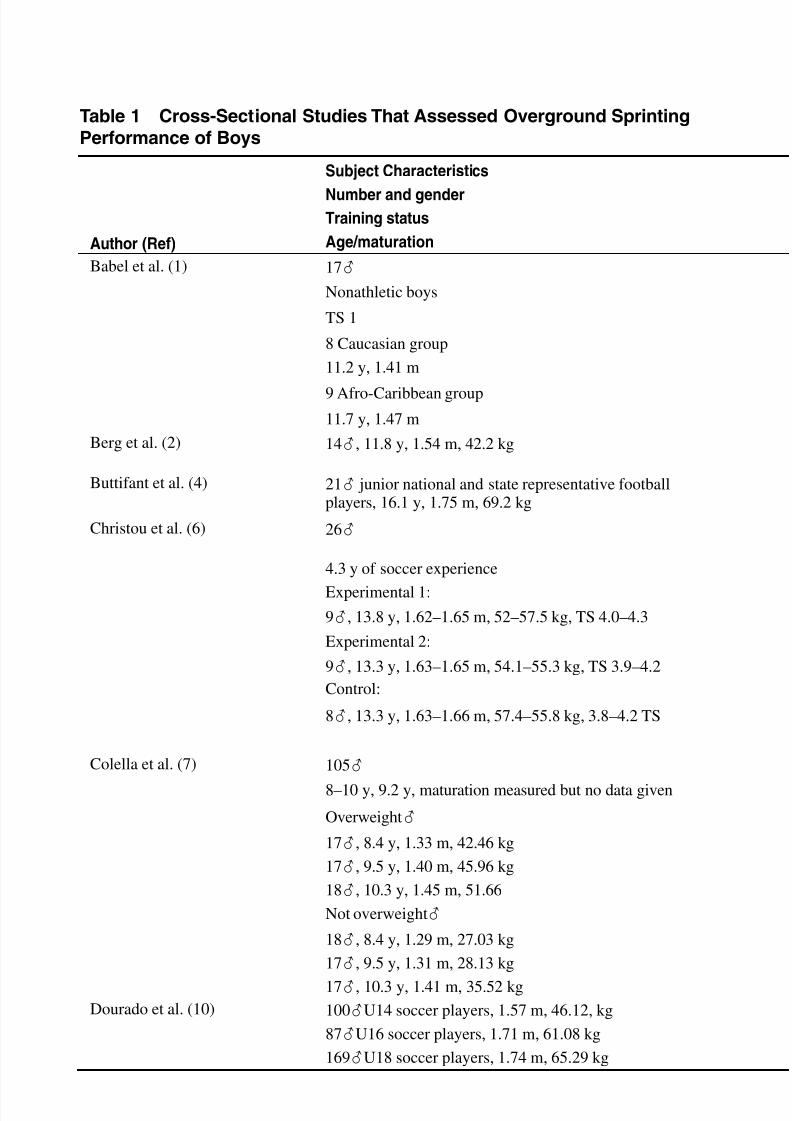
ProceduresEquipment
SurfaceDependentVariables Times
30 m on a synthetic track using photo-electriccells with a start 1 m behind the rst light
30 m time (s)
5.59
5.51
Average over 2 sprints on a grass athletic eld,measured with a hand-held stop watch
30 m time (s) 5.68
2× 20 m sprints on a grass surface, measuredwith timing gates
20 m time (s) 3.01
The fastest out of two 30 m sprints using elec-tronic photo cells placed 50 cm above ground forthe rst gate and on the height of the subjects head
for the following two gates. Subjects had to startsprinting 30 cm behind a line.
Experimental 1 Pretraining, 8weeks, 10 weeks
10 m 2.16, 2.18, 2.09
30 m time 5.07, 5.16, 4.94
Experimental 2
10 m 2.0, 2.04, 1.98
30 m time 4.85, 4.88, 4.85
Control
10 m 2.18, 2.20, 2.11
30 m time 5.20, 5.26, 5.22
Best of two 10 and 20 m sprints from a standing
start measured with a handheld stopwatch
10, 20 m time (s)
Overweight♂
8.4 y 2.61, 4.95
9.5 y 2.47, 4.56
10.3 y 2.31, 4.22
Not overweight♂
8.4 y 2.45, 4.45
9.5 y 2.31, 4.29
10.3 y 2.15, 3.92
40 m sprints using electronic timing system 10, 40 m time (s) 1.78, 6.21

7/29/2019 Assessing Youth Sprint Ability Methodological Issues, Reliability and Performance Data
http://slidepdf.com/reader/full/assessing-youth-sprint-ability-methodological-issues-reliability-and-performance 5/27
Author (Ref)
Subject Characteristics
Number and gender
Training statusAge/maturation
Gabbett (17) 88♂ rugby players
Different amount of playing experience
Forward:
13♂, 12.5 y, 57 kg
7♂, 13.5 y, 67.7 kg
11♂, 14.5 y, 76.5 kg
12♂, 15.4 y, 75.5 kg
Backs:
14♂, 12.3 y, 44.8 kg
10♂, 13.7 y, 52.1 kg
12♂, 14.6 y, 62.1 kg
9♂, 15.6 y, 64.8 kg
Gissis et al. (18) 48♂ football players
18♂ Elite, 16.3 y, 1.69 m, 68.17 kg
18♂ Subelite, 16.4 y, 1.69 m, 67.74 kg
18♂ Recreational, 16.2 y, 1.69 m, 69.87 kg
Hoare (20) 125♂
Participants of Australian U16 basketball championships
125♂, 15.4 y
28♂, 1.78 m, 68.1 kg
25♂, 1.81 m, 71.3 kg
31♂, 1.86 m, 76.4 kg
25♂, 1.91 m, 83.8 kg
16♂, 1.95 m, 84.5 kg
Hoshikawa et al. (22) 24♂ academy youth football players, 17.0 y, 1.72 m,63.7 kg
Kilding et al. (26) 24♂ football players
10.4 y, 4.1 years of playing experience
12♂Experimental
1.32 m, 34.3 kg
Table 1 (continued)
7/29/2019 Assessing Youth Sprint Ability Methodological Issues, Reliability and Performance Data
http://slidepdf.com/reader/full/assessing-youth-sprint-ability-methodological-issues-reliability-and-performance 6/27
Procedures
EquipmentSurface
DependentVariables Times
Fastest out of two 40 m sprints using electronicgates
10, 20, 40 m time(s)
2.6, 4.24, 7.50
Forward: 2.44, 3.99, 7.00
12.5 y 2.25, 3.72, 6.58
13.5 y 2.22, 3.61, 6.17
14.5 y 2.46, 4.04. 7.11
15.4 y 2.24, 3.7, 6.47
Backs: 2.21, 3.62, 6.26
12.3 y 2.17, 3.55, 6.00
13.7 y
14.6 y
15.6 y
10 m sprint using a dual laser beam in connectionwith a digital chronometer. Best out of three trialsfrom a standing position was used for further dataanalysis
10 m time (s)
Elite 1.95
Subelite 2.14Recreational 2.21
Fastest of all split time in three 20 m sprints ona dry grass surface using electronic timing gates,starting with the front foot on the start line
5, 10, 20 time (s)
1.08, 1.83, 3.12
1.10, 1.84, 3.15
1.13, 1.89, 3.21
1.12, 1.88, 3.24
1.10, 1.87, 3.21
20 m sprint on a grass eld measured by photo-cells
5 m time (s) 1.02
10 m time (s) 1.78
15 m time (s) 2.45
20 m time (s) 3.08
Average of three times 20 m sprints using dualelectronic timing gates, 0.75 m above ground
level, 0.5 m behind the starting line
20 m time (s) Pre, Posttest, Average
Experimental 3.60, 3.52, 3.56

7/29/2019 Assessing Youth Sprint Ability Methodological Issues, Reliability and Performance Data
http://slidepdf.com/reader/full/assessing-youth-sprint-ability-methodological-issues-reliability-and-performance 7/27
Author (Ref)
Subject Characteristics
Number and gender
Training status
Age/maturation
Kollath et al. (27) 131♂ football players
11♂, 8.3 y, 1.38 m, 32 kg
9♂, 10.1 y, 1.45 m, 35 kg
10♂, 11.0 y, 1.50 m, 40 kg
16♂, 11.8 y, 1.50 m, 39 kg
13♂, 12.8 y, 1.59 m, 46 kg
17♂, 13.6 y, 1.64 m, 52 kg
13♂, 14.8 y, 1.74 m, 62 kg12♂, 15.6 y, 1.69 m, 57 kg
17♂, 16.7 y, 1.77 m, 71 kg
Kotzamanidis (28) 30♂, nonathletic
Experimental group:
15♂, 11.1, 1.57 m, 49.6 kg
Control group:
15♂, 10.9, 1.54 m, 48.7 kg
Kotzamanidis (30) 35♂
Physical educational student
Combined resistance and speed training (CRST)
12♂, 17 y, 1.78 m, 73.5 kg
Resistance training only (RTO)
11♂, 17.1 y, 1.75 m, 72.5 kg
Control (CO)
12♂, 17.8 y, 1.76 m, 75 kg
Kotzamanidis (29) 30♂
Healthy nonathletic boys
10–11, 1.54–1.56 m, 48.7–49.6 kg, TS 1
Experimental group
15♂, 11.1 y, 1.57 m, 49.6 kg, TS 1
Control group
Table 1 (continued)

7/29/2019 Assessing Youth Sprint Ability Methodological Issues, Reliability and Performance Data
http://slidepdf.com/reader/full/assessing-youth-sprint-ability-methodological-issues-reliability-and-performance 8/27
Procedures
Equipment
SurfaceDependentVariables Times
Best out of three 20 m sprints on an articial turf,from a standing split start position measured bytiming gates
10, 20 m time (s)
8.3 y 2.13, 3.85
10.1 y 2.14, 3.76
11.0 y 2.04, 3.64
11.8 y 2.08, 3.60
12.8 y 2.07, 3.62
13.6 y 1.97, 3.47
14.8 y 1.79, 3.1715.6 y 1.77, 3.10
16.7 y 1.70, 2.98
Best out of two 30 m indoor sprints measuredwith an electronic chronometer connected to opto-reective switches
Time (s) Pre, Posttest, Average
0–10 m 2.19, 2.14, 2.17
0–20 m 3.82, 3.68, 3.75
0–30 m 5.45, 5.27, 5.36
0–10 m 2.29, 2.30, 2.30
0–20 m 4.04, 4.07, 4.06
0–30 m 5.74, 5.77, 5.76
Fastest of two 30 m sprints using photocellsplaced at shoulder height. Start from the standingposition
30 m time (s) Pre, Posttest, Average
CRST 4.34, 4.19, 4.27
RTO 4.33, 4.31, 4.32
CO 4.50, 4.48, 4.49
Fastest of two 30 m sprints on an indoor sporthall, using electronic chronometer connected to 4pairs of opto-reective switches
Experimentalgroup
Pre, Posttest, Average
0–10 time (s) 2.24, 2.19, 2.22
10–20 time (s) 1.71, 1.65, 1.68
20–30 time (s) 1.61, 1.56, 1.59
0–30 m time (s) 5.55, 5.41, 5.48
Control group Pre, Posttest, Average
0–10 time (s) 2.29, 2.30, 2.30
10–20 time (s) 1.75, 1.78, 1.77

7/29/2019 Assessing Youth Sprint Ability Methodological Issues, Reliability and Performance Data
http://slidepdf.com/reader/full/assessing-youth-sprint-ability-methodological-issues-reliability-and-performance 9/27
Author (Ref)
Subject Characteristics
Number and genderTraining status
Age/maturation
Kruger and Pienaar (31) 39♂ talented children
12.1 y, 1.41 m, 34.3 kg, Diverse TS
Kruger and Pienaar (32) 62♂ school children
Experimental group
16♂, 10.92 y
Control group
16♂, 12.38 y
Le Gall (33) 328♂ football players 11–18
10♂, 11–11 1/2 y, 39.8 kg
10♂, 12 y, 41.2 kg
22♂, 12 1/2 y, 42.5 kg
35♂, 13 y, 45.6 kg
31♂, 13 1/2 y, 49.9 kg
57♂, 14 y, 56.6 kg
36♂, 14 1/2 y, 58.2 kg
15♂, 15 y, 59.7 kg
27♂, 15 1/2 y, 62.6 kg
21♂, 16 y, 64.7 kg
44♂, 17 y, 66.3 kg
20♂
, 18 y, 68.1 kg
Table 1 (continued)

7/29/2019 Assessing Youth Sprint Ability Methodological Issues, Reliability and Performance Data
http://slidepdf.com/reader/full/assessing-youth-sprint-ability-methodological-issues-reliability-and-performance 10/27
ProceduresEquipment
SurfaceDependentVariables Times
Fastest of two 100 m sprints using electronictiming lights
0–5 time (s) 1.8
Fastest of two 100 m sprints using electronictiming lights.
Experimentalgroup
Pre, Posttest, Average
0–40 m time (s) 7.41, 7.3, 7.36
Control group Pre, Posttest, Average
0–40 m time (s) 7.44, 7.6, 7.52
Fastest of two 40 m sprints using photoelectriccells
10, 10–20,20–30, 30–40, 40time (s)
11–11 1/2 y 2.01, 1.43, 1.38,1.37, 6.19
12 y 2.01, 1.40, 1.34,
1.33, 6.0812 1/2 y 2.00, 1.40, 1.33,
1.32, 6.05
13 y 1.99, 1.39, 1.32,1.31, 6.01
13 1/2 y 1.96, 1.37, 1.30,1.29, 5.92
14 y 1.94, 1.34, 1.26,1.25, 5.79
14 1/2 y 1.91, 1.31, 1.24,1.24, 5.70
15 y 1.91, 1.30, 1.24,1.23, 5.68
15 1/2 y 1.90, 1.31, 1.23,1.21, 5.65
16 y 1.87, 1.28, 1.20,1.17, 5.52
17 y 1.85, 1.27, 1.19,1.17, 5.48
18 y 1.85, 1.27, 1.19,1.17, 5.48

7/29/2019 Assessing Youth Sprint Ability Methodological Issues, Reliability and Performance Data
http://slidepdf.com/reader/full/assessing-youth-sprint-ability-methodological-issues-reliability-and-performance 11/27
Author (Ref)
Subject Characteristics
Number and genderTraining status
Age/maturation
Lidor et al. (34) 279♂, national trials in handball
U12♂
29
118
U13♂
24109
U14♂
18
42
Luhtanen et al. (36) 106 football players from six First Division clubs
17♂, 18 y
21♂, 16 y
Maio Alves et al. (37) 23♂ football players
17.4 y, 1.75, 70.3 kg
McMillan et al. (38) 11♂ football players, 16.9 y, 1.77 m, 70.6 kg
Meyer et al. (41) 103♂State selection football players
30♂U14, 1.64 m, 53 kg
29♂U15, 1.71 m, 61 kg
22♂U16, 1.75 m, 67 kg
12♂U17, 1.77 m, 69 kg
10♂U18, 1.77 m, 72 kg
Meylan and Malatesta (42) 25♂ football players
14♂U13, 1.60 m, 49.0 kg
11♂U13, 1.64 m, 47.9 kg
Reilly et al. (49) 31♂, 16.4 years
16♂ elite, 1.71 m, 63.1, kg
15♂ subelite, 1.75 m, 66.4 kg
Table 1 (continued)

7/29/2019 Assessing Youth Sprint Ability Methodological Issues, Reliability and Performance Data
http://slidepdf.com/reader/full/assessing-youth-sprint-ability-methodological-issues-reliability-and-performance 12/27
ProceduresEquipment
SurfaceDependentVariables Times
Best of two 20 sprints from a stationary start withthe front foot behind the starting line. Time wasmeasured using a handheld stopwatch
20 m time (s)
Selected 3.66
Nonselected 3.81
Selected 3.55Nonselected 3.67
Selected 3.44
Nonselected 3.54
30 m sprint measured with photocells 30 m time (s)
18 y 4.26
16 y 4.41
Best of two 5 meter sprint measured with photo-electric cells
5 m time (s) Pre, Posttest, Average
Experimental 1 1.09, 0.99, 1.04
Experimental 2 1.13, 1.06, 1.10
Control 1.13, 1.11, 1.12
Average of three 30 m sprint runs, starting behindthe rst gate, on an indoor track, using photocells
10 m time (s) Pre, Posttest, Average
1.96, 1.96, 1.96
Mean time of the best four out of ve 30 m indoorsprints, starting 1 m behind the rst timing gate
5, 10 m time (s)
1.04, 1.82
1.00, 1.75
1.01, 1.75
0.99, 1.71
0.99, 1.70
Better of two 10 meter sprints measured by infra-red photoelectric cells, starting 0.3 m behind therst gate
10 m time (s) Pre, Posttest, Average
1.96, 1.92, 1.94
2.06, 2.01, 2.04
Average of three 30 m sprints measured by elec-
tronic timing gates
5, 30 m time (s)
1.04, 4.31
1.07, 4.46

7/29/2019 Assessing Youth Sprint Ability Methodological Issues, Reliability and Performance Data
http://slidepdf.com/reader/full/assessing-youth-sprint-ability-methodological-issues-reliability-and-performance 13/27
Author (Ref)
Subject Characteristics
Number and genderTraining status
Age/maturation
Tumilty (53) 21♂ U17 national australian football players
Venturelli et al. (55) 16♂ members of a football team involved in the nationalchampionship
11y, 1.50m, 40.5 kg, TS 1
7♂, Sprint training group STG
9♂, Coordination training group CTG
Wong et al. (56) 70♂ U14 regional representative football players
10 GK, 13.4 y, 1.69 m, 54.6 kg
20 DF, 13.3 y, 1.67 m, 56.2 kg,
25 MF, 13.4 y, 1.65 m, 52.2 kg
15 FW, 13.0 y, 1.56 m, 43.9 kg
Wong et al. (57) 62♂, U14 regional representative football players
Experimental
28♂, 13.5 y,, 1.67 m, 52.0 kg
Control
23♂, 13.2 y, 1.64 m, 52.5 kg
Key:♂ = Male, PHV = Peak Height Velocity; TS = Tanner Stage
Table 1 (continued)

7/29/2019 Assessing Youth Sprint Ability Methodological Issues, Reliability and Performance Data
http://slidepdf.com/reader/full/assessing-youth-sprint-ability-methodological-issues-reliability-and-performance 14/27
ProceduresEquipment
SurfaceDependentVariables Times
Three 20 m sprints using dual beam timing gates,starting with the front foot on the starting line atthe rst gate. Best split times from all runs
5 m time (s) 1.11
10 m time (s) 1.85
20 m time (s) 3.12
Best out of three 20 m sprints on a grass turf usingphotoelectric cells
20 m time (s) Pre, Posttest, Average
STG 3.75, 3.66, 3.71
CTG 3.64, 3.56, 3.60
Fastest out of three 30 m spritns using photoelec-tric cells, with split times every 10 m and the frontfoot was placed right behind the starting line
10, 30 m time (s)
10 GK 2.06, 4.92
20 DF 2.09, 4.81
25 MF 2.05, 4.82
15 FW 2.07, 4.96
30 m sprint from a stationary start with the front
foot right behind the starting line, measured withinfrared photoelectric cell. Best out of three trialswas used for analysis
10, 30 m time (s) Pre, Posttest, Average
10 m time (s) 2.05, 1.95, 2.00
30 m time (s) 4.85, 4.74, 4.80
10 m time (s) 2.07, 2.04, 2.06
30 m time (s) 4.95, 5.00, 4.98

7/29/2019 Assessing Youth Sprint Ability Methodological Issues, Reliability and Performance Data
http://slidepdf.com/reader/full/assessing-youth-sprint-ability-methodological-issues-reliability-and-performance 15/27
Table 2 Cross-Sectional Studies That Assessed Overground Sprinting
Performance of Girls
Author (Ref)
Subject CharacteristicsNumber and gender
Training status
Age/maturation
Colella et al. (7) 88♂
8–10 y, 9.2 y, maturation measured but no data given
Overweight♂
17♂, 8.3 y, 1.32 m, 40.35 kg
18♂, 9.5 y, 1.38 m, 44.09 kg18♂, 10.2 y, 1.43 m, 50.49 kg
Not Overweight♀
18♀, 8.3 y, 1.28 m, 27.27 kg
17♀, 9.5 y, 1.32 m, 28.21 kg
17♀, 10.2 y, 1.40 m, 34.47 kg
Ellis et al. (13) 17♀ U18 state level female netball players
Ellis et al. (13) 76♀ U17 female netball players
Ellis et al. (13) 11♀ U17 state level female netball players
Fedotova (15) 141♀
Well-trained young female eld hockey players
16♀, 10 y, 1.39 m, 33.57 kg,
15♀, 11y, 1.43 m, 35.34 kg
20♀, 12y, 1.50 m, 39.07 kg
14♀, 13y, 1.57 m, 43.31 kg
20♀, 14y, 1.60 m, 49.84 kg
15♀, 15y, 1.63 m, 53.99 kg
15♀, 16y, 1.64 m, 57.98 kg
14♀, 17y, 1.65 m, 59.95 kg
12♀, 18y, 1.66 m, 60.59 kg

7/29/2019 Assessing Youth Sprint Ability Methodological Issues, Reliability and Performance Data
http://slidepdf.com/reader/full/assessing-youth-sprint-ability-methodological-issues-reliability-and-performance 16/27
Procedures
Equipment
SurfaceDependentVariables Times
Best of two 10 and 20 m sprints from a standingstart measured with a handheld stopwatch
10, 20 m time (s)
Overweight♀
8.3 y 2.71, 5.11
9.5 y 2.58, 4.7810.2 y 2.50, 4.63
Not Overweight♀
8.3 y 2.64, 4.87
9.5 y 2.5, 4.72
10.2 y 2.41, 4.57
Three 20 m sprints using dual beam timing gates,starting with the front foot on the starting line at therst gate. Best split times from all runs
5 m time (s) 1.19
10 m time (s) 2.01
20 m time (s) 3.47
Three 20 m sprint overground, using double beamtiming gates, starting with the front foot on the start-ing line at the rst gate. Best split times from all runs
5 m time (s) 1.23
10 m time (s) 2.05
20 m time (s) 3.49
Three 20 m sprints, using dual beam timing gates,starting with the front foot on the starting line at therst gate. Best split times from all runs
5 m time (s) 1.18
10 m time (s) 2.09
20 m time (s) 3.41
30 m sprint on a track using stop-watch 30 m time (s)
10 y 5.83
11 y 5.62
12 y 5.42
13 y 5.30
14 y 5.23
15 y 5.11
16 y 4.95
17 y 4.87
18 y 4.79
(continued)

7/29/2019 Assessing Youth Sprint Ability Methodological Issues, Reliability and Performance Data
http://slidepdf.com/reader/full/assessing-youth-sprint-ability-methodological-issues-reliability-and-performance 17/27
Author (Ref)
Subject Characteristics
Number and genderTraining status
Age/maturation
Hoare (20) 123♀
Participants of Australian U16 basketball championships
130♀, 15.2 y
32♀PG, 1.66 m, 57.8 kg
30♀OG, 1.69 m, 61.6 kg
17♀SF, 1.73 m, 64.1 kg
25♀PF, 1.77 m, 69.4 kg
19♀C, 1.81 m, 70.5 kg
Hoare and Warr (21) 17♀ selected football players 15.4 y, 1.64 m, 55.3 kg,
Lidor et al. (34) 126♀, national trials in handball
U12♀
20
54
U13♀
20
51
Luhtanen et al. (36) 35♀ football players from six First Division clubs
17♀, 18 y
18♀, 16 y
Key:♀ = Female, PHV = Peak Height Velocity; TS = Tanner Stage
Table 2 (continued)

7/29/2019 Assessing Youth Sprint Ability Methodological Issues, Reliability and Performance Data
http://slidepdf.com/reader/full/assessing-youth-sprint-ability-methodological-issues-reliability-and-performance 18/27
ProceduresEquipment
SurfaceDependentVariables Times
Fastest of all split time in three 20 m sprints on a drygrass surface using electronic timing gates, startingwith the front foot on the start line
5, 10, 20 time (s)
♀PG 1.18, 1.98, 3.40
♀OG 1.19, 2.01, 3.46
♀SF 1.28, 2.08, 3.56
♀PF 1.25, 2.07, 3.53
♀C 1.19, 2.03, 2.53
Fastest of all split times in three 20 m sprints usingelectronic timing gates, starting with the front footup on the start line, measured on grass surface
5 m time (s) 1.18
10 m time (s) 2.01
20 m time (s) 3.47
Best of two 20 sprints from a stationary start withthe front foot behind the starting line. Time wasmeasured using a handheld stopwatch
20 m time (s)
Selected 3.98
Nonselected 3.90
Selected 3.83
Nonselected 3.94
30 m sprint measured with photocells 30 m time (s)
18 y 4.90
16 y 4.92

7/29/2019 Assessing Youth Sprint Ability Methodological Issues, Reliability and Performance Data
http://slidepdf.com/reader/full/assessing-youth-sprint-ability-methodological-issues-reliability-and-performance 19/27
460 Rumpf et al.
of the studies and 9% used a stopwatch. Twenty-three studies (68%) used thefastest sprint time out of multiple sprints for data analysis, six studies (18%) usedthe average time of multiple sprints and an additional ve studies (15%) did not
mention how the sprint time was selected i.e., data analysis.The total number of subjects from which the performance data were generated
was 2864. Of these 2864, 77% were males and the remaining 23% females. Seventysix percent of the studies included used athletic participants, while the remainderwere categorised as nonathletic (19%) or the training status was not reported (5%).
In terms of the age of the participants, the age range was 8–18 yrs with themean age of 13.95 years for the male sample and a mean age of 13.7 for the females.Only two studies described the maturation of the participants (6,31) and two studiesreported sprinting time in relation to the subjects’ peak height velocity (46,58).
Methodological Issues. As can be observed from Table 1 and Table 2 severalmethodological issues make comparison of the data difcult. Time measurementdevices were single or double beam timing gates, and stop-watches, the greatestmeasurement error associated with the use of stopwatches the least with dualbeam infra red timing light technology. Different starting stances (standing start,split start, three point start, track and eld start), starting distance behind the startline (30 cm—20 m) and different running surfaces will inuence the sprint time.Several studies also did not mention which data (fastest vs. average trial) wereused for data analysis.
Reliability of Overground Sprint Running Assessments. A total of sevenstudies reported the reliability of overground sprinting in youth population(6,11,16,28–30,32). Intra- and interday CVs for sprinting distances of 10, 20,30 and 40 m ranged from 0.83–2.07% (6,16). Intra- and interday ICCs rangedfrom 0.88 and 0.98 for 10–40 m (6,16,29) and Pearson correlation coefcientfrom 0.90–0.97 (28–30,32).
Performance Data of Overground Sprinting. Specic performance data fordifferent populations, distances, gender and assessement methodologies can beobserved in Tables 1 and 2. Figures 1 and 2 summarize this data so as to provideinsight into the trends regarding sprint performance over time (chronological age).
The reader needs to be cognizant of the limitations cited previously when viewingthis data. Average sprint times for male subjects (n = 2864) over 5, 10, 20, 30,and 40 m, calculated from all subjects and age groups, are shown in Figure 1.Average sprint time for boys decreased markedly with age over all distances untilapproximately the age of 15 years, after which the rate in decrease of sprint timeslessened (i.e.,16–18 years).
Average sprint times for female subjects (n = 670) over 5, 10, 20, 30, and 40m, calculated from all subjects and age groups, are shown in Figure 2. It seems thatwhen females are compared with males at the same chronological age, the maletimes were less over all distances. Average sprint time for girls decreased markedly
with age over all distances until approximately the age of 16 years, after which therate in decrease of sprint times lessened (i.e.,17–18 years).

7/29/2019 Assessing Youth Sprint Ability Methodological Issues, Reliability and Performance Data
http://slidepdf.com/reader/full/assessing-youth-sprint-ability-methodological-issues-reliability-and-performance 20/27
Figure 1 — Sprint times over 5–40 m distances for males 8–18 years of age.

7/29/2019 Assessing Youth Sprint Ability Methodological Issues, Reliability and Performance Data
http://slidepdf.com/reader/full/assessing-youth-sprint-ability-methodological-issues-reliability-and-performance 21/27
462 Rumpf et al.
caused by the subjects’ weight, while a harness connected to a strain gauge mea-sures the subjects’ horizontal force, with a goniometer recording the angle at whichhorizontal force was created. Horizontal displacement of the belt is measured by
a sensor system attached to the rear rolling drum (24).
Methodological Issues. Generally, studies which examined single running sprintswith a duration over 10 s were excluded. The highest speed and power duringsprinting on a torque treadmill was achieved within the rst 10 s, and longer testdurations will affect mean power output, trigger different energy systems and testother running qualities/abilities of the participants. Peak power is a measurement of the highest power achieved in a dened period of time and is usually the averagedpeak power of the number of foot strikes in that time period. Methodological issuesalso arise when a rolling or a standing start is used for data collection. Furthermore
the elasticity of the tether will affect horizontal force output.Reliability of Torque Treadmill Sprint Running Assessments. One studyinvestigated the reliability of peak and mean power of pediatric populationperforming a 30-s sprint on a torque treadmill (14). Interday ICC values were 0.80and 0.81 for peak and mean power respectively.
Test-retest reliability using a Pearson correlation of power variables measuredfor a 5-s sprint duration in adults were 0.8–0.89 (24).
Performance Data of Torque Treadmill. Only one study measured single sprintperformance with a duration of less than 10 s using this technology (5). Maximum
velocity, mean power, mean power per kg body weight of 11 male handball players(< 18 years old) during a eight second sprint on a torque treadmill were measured(Table 3). However, a measurement of participant’s maturation was not included.There is a need for further research in this area.
Nonmotorized Treadmill
A nonmotorized treadmill has been used to measure sprint kinetics and kinematicsin youth (3,43–45,47,48,51,54,59). A horizontal load cell, attached with a harnessto the runner, measures the horizontal force. Typically four individual load cells,
Table 3 Cross-Sectional Studies That Accessed Sprinting Performance
Using a Torque Treadmill
Author
(Date)
Subject Characteristics
Number and gender
Training status
Age/maturation
Procedures
Equipment Dependent Variables ResultsChelly andD i (5)
11♂, 16 y, 1.79 m, 68 kg 8 s sprint on at t d ill
Vmax (m/s) 6.1MP (W) 654
7/29/2019 Assessing Youth Sprint Ability Methodological Issues, Reliability and Performance Data
http://slidepdf.com/reader/full/assessing-youth-sprint-ability-methodological-issues-reliability-and-performance 22/27
Assessing Youth Sprint Ability 463
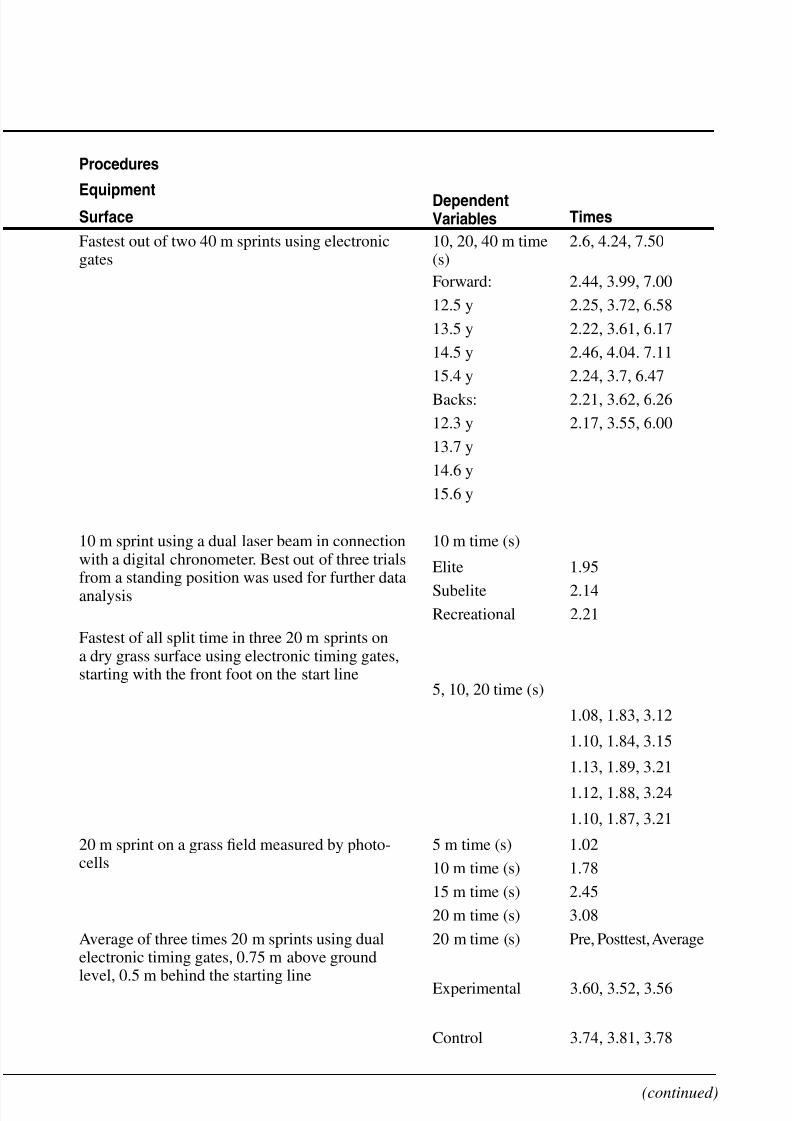
mounted under the running surface, measure the vertical force while running. Therunning speed can be monitored by optical speed photomicrosensors.
Methodological Issues. Considerations about peak and mean power are similarto the torque treadmill. The initial resistance of the belt is another issue that needsto be considered. Studies did not report the initial resistance of the nonmotorizedtreadmill belt, which affects inertia and subsequent sprint kinematics kinetics. Inrelation to the treadmill resistance it can be expected that the weight/strength of the participant would inuence the participant’s ability to overcome the initialresistance of the treadmill and thus lighter/weaker participants at a greaterdisadvantage.
Reliability of Nonmotorized Treadmill Sprint Running Assessments. Thereliability of mean and peak velocity and mean and peak power output have beeninvestigated on a nonmotorized treadmill (45). Interday reliability values for thosevariables were within 2.88 and 8.32%. Sutton et al. (51) presented absolute valuesfor mean (15.3 Watts) and peak (26.6 Watts) power as a coefcient of repeatability.A summary of all reliability values of sprint running assessments can be observedin Table 4.
Reliability values for variables measured on a nonmotorized treadmill duringa single sprint with a duration of 6–10 s including a complete recovery in adults(35,52) were also reported throughout literature. The coefcients of variations(CV) for the variables of interest reported in these studies were 1.3–1.9% for the
speed variables (52), 8.0–9.1% for the force variables (52), and 4.3–9.3% for powervariables (35,52). The ratio limits of agreement (95% LoA) ranged from 1.00–1.05*/÷ 1.03 (52) for speed variables, from 1.01–1.04 */÷ 1.15–1.21 (52) for forcevariables, and 1.02–1.07 */÷ 1.12–1.21 (52) for power variables.
Performance Data of Nonmotorized Treadmill. No study investigated singlesprint performance with a duration of below 10 s using youth participants whichalso including measurement of maturation. There is a need for further research inthis area.
Discussion and ConclusionsMeasuring sprint performance of youth can have various purposes and use differenttechnologies and protocols. Running over-ground is still the easiest, most popularand accurate measurement of youth’s sprint ability. However, the variables of inter-est are typically sprint times between timing lights from which average velocitiescan be calculated. While valuable in terms of monitoring sprint performance, thisinformation is extremely limited in terms of understanding the mechanical deter-minants of sprint performance. In this regard a torque or a nonmotorized treadmillcan provide mechanistic information on sprint kinematics and kinetics in youth.
However, there are a limited number of studies that have used this type of tech-nology in youth and the reliability of many of the variables that can be quantiedfrom these treadmills for the most part have not been established. In addition, the

7/29/2019 Assessing Youth Sprint Ability Methodological Issues, Reliability and Performance Data
http://slidepdf.com/reader/full/assessing-youth-sprint-ability-methodological-issues-reliability-and-performance 23/27
A b s o
l u t e a n d R e l a t i v e R e l i a b i l i t y o f S p r i n t A s s e s s m
e n t s
A b s o
l u t e
R e l a t i v e
C V
P e a
r s o n C o r r e l a t i o n s
I C C
n t
A u t h o r
V a l u e ( V a r i a b l e )
V a l u
e ( V a r i a b l e )
V a l u e ( V a r i a b l e )
M i s c e l l a n e o
u s
d
C h r i s t o u e t a l . ( 6 )
1 . 4
6 % ( 1 0 m )
0 . 8
3 % ( 3 0 m )
0 . 9
6 ( 1 0 m )
0 . 9
8 ( 3 0 m )
I n t r a d a y r e l i a b i l i t y
d
D r i n k w a t e r e t a l . ( 1 1 )
1 . 3
0 % ( 2 0 m )
I n t e r d a y r e l i a b i l i t y
d
G a b b e t t ( 1 7 )
2 . 0
7 % ( 1 0 m )
1 . 5
2 % ( 2 0 m )
1 . 2
5 % ( 4 0 m )
0 . 8
8 ( 1 0 m )
0 . 8
9 ( 2 0 m )
0 . 9
2 ( 4 0 m )
I n t e r d a y r e l i a b i l i t y
d
K o t z a m a n i d i s ( 2 8 )
0 . 9 0
( 1 0 m )
0 . 9 1
( 2 0 m )
0 . 9 3
( 3 0 m )
N o t s t a t e d
d
K o t z a m a n i d i s ( 3 0 )
0 . 9 7
( 3 0 m )
I n t r a d a y r e l i a b i l i t y
d
K o t z a m a n i d i s ( 2 9 )
0 . 9 0
– 0 . 9
6 ( d i v e r s e )
I n t e r d a y r e l i a b i l i t y
d
K r u g e r a n d P i e n a a r ( 3 2 )
0 . 9 5
( 1 0 0 m )
I n t r a d a y r e l i a b i l i t y
d m i l l
F a l k e t a l . ( 1 4 )
0 . 8
0 ( P P )
0 . 8
1 ( M P )
I n t e r d a y r e l i a b i l i t y
z e d
O l i v e r e t a l . ( 4 5 )
2 . 8
8 % ( P V )
2 . 5
9 % ( M V )
8 . 3
2 % ( P P O )
5 . 4
1 % ( M P O )
I n t e r d a y r e l i a b i l i t y
z e d
S u t t o n e t a l . ( 5 1 )
C o e
f c i e n t o f r e p e a t a b i l i t y :
2 6 . 6
W ( P
P )
1 5 . 3
W ( M
P )
I n t r a d a y r e l i a b i l i t y
e f c i e n t o f V a r i a t i o n ,
I C C = I n t r a c l a s s C
o e f c i e n t , P V = P e a k V e l o c i t y , M
V = M e a n V e l o c i t y ,
P P O = P e a k P o w e r O u t p u t , M P O = M e a n P o w
e r O u t p u t ,
w e r , M
P = M e a n P o w e r

7/29/2019 Assessing Youth Sprint Ability Methodological Issues, Reliability and Performance Data
http://slidepdf.com/reader/full/assessing-youth-sprint-ability-methodological-issues-reliability-and-performance 24/27
Assessing Youth Sprint Ability 465
References
1. Babel, K., C. Hertogh, and O. Hue. Inuence of ethnic origin on predictive parameters
of performance in sprint running in prepubertal boys. Int. J. Sports Med. 26:798–802,2005.2. Berg, K., M. Miller, and L. Stephans. Determinants of 30 meter sprint time in pubescent
males. J. Sports Med. 26:225–230, 1986.3. Bloxham, S.R., J.R. Welsman, and N. Armstrong. Ergometer-specifc relationships
between peak oxygen uptake and short-term power output in children. Pediatr. Exerc.Sci. 17:136–148, 2005.
4. Buttifant, D., K. Graham, and K. Cross. Agility and speed in soccer players are twodifferent performance parameters. J Sports Sci. 117:809, 1999.
5. Chelly, S.M., and C. Denis. Leg power and hopping stiffness: relationship with sprintrunning performance. Med. Sci. Sports Exerc. 33:326–333, 2001.
6. Christou, M., I. Smilios, K. Sotiropoulos, K. Volaklis, T. Pilianidis, and S.P. Tokmakidis.Effects of resistance training on the physical capacities of adolescent soccer players.
J. Strength Cond. Res. 20:783–791, 2006.7. Colella, D., M. Morano, C. Robazza, and L. Bortoli. Body image, perceived physical
ability, and motor performance in nonoverweight and overweight Italian children.Percept. Mot. Skills. 108:209–218, 2009.
8. Delecluse, C. Inuence of strength training on sprint running performance. Sports Med. 24:147–156, 1997.
9. Di Salvo, V., R. Baron, H. Tschan, F.J. Calderon Montero, N. Bachl, and F. Pigozzi.Performance characteristics according to playing position in elite soccer. Int. J. Sports
Med. 28:222–227, 2007.
10. Dourado, A.C., L.C. Stanganelli, L. Bobroff Daros, A. Frisselli, A. Montanholi, andR. Osieck. Assessment of anthropometric characteristics and sprint velocity in soccerplayers from 5 different age groups. Presented at World Congress on Science andFootball VI, Antalya, 2007.
11. Drinkwater, E.J., W.G. Hopkins, M.J. McKenna, P.H. Hunt, and D.B. Pyne. Model-ling age and secular differences in tness between basketball players. J Sports Sci. 25:869–878, 2007.
12. Duthie, G.M., D.B. Pyne, D.J. Marsh, and S.L. Hooper. Sprint patterns in rugby unionplayers during competition. J. Strength Cond. Res. 20:208–214, 2006.
13. Ellis, L., P. Gastin, S. Lawrence, et al. Protocols for the physiological assessment of team sport players. In: Physiological tests for elite ahtletes, C.J. Gore (Ed.). Champaign:
Human Kinetics, 2000, pp. 128–144.14. Falk, B., Y. Weinstein, R. Dotan, D.A. Abramson, D. Mann-Segal, and J.R. Hoffman.
A treadmill test of sprint running. Scand J Med Sci Sports. 6:259–264, 1996.15. Fedotova, E. Morphological, functional and tness related characteristics of young
female eld hockey players. Women Sport. & Phys. Act. J. 10:145–168, 2001.16. Gabbett, T.J. Inuence of physiological characteristics on selection in a semi-profes-
sional rst grade rugby league team: a case study. J Sports Sci. 20:399–405, 2002.17. Gabbett, T.J. Physiological characteristics of junior and senior rugby league players.
Br. J. Sports Med. 36:334–339, 2002.18. Gissis, I., C. Papadopoulos, V. Kalapotharakos, A. Sotiropoulos, G. Komsis, and E.
Manolopoulos. Strength and speed characteristics of elite, subelite, and recreationalyoung soccer players. Res. Sports Med. 14:205–214, 2006.
19. Gregson, W., B. Drust, G. Atkinson, and V.D. Salvo. Match-to-match variability of

7/29/2019 Assessing Youth Sprint Ability Methodological Issues, Reliability and Performance Data
http://slidepdf.com/reader/full/assessing-youth-sprint-ability-methodological-issues-reliability-and-performance 25/27
466 Rumpf et al.
22. Hoshikawa, Y., J.M. Campeiz, K. Shibukawa, et al. Differences in muscularity of psoasmajor and thigh muscles in relation to sprint and vertical jump performances in eliteyoung and professional soccer players. Presented at World Congress on Science and
Football VI, Antalya, 2007.23. Inbar, O. Development of anerobic power and local muscular endurance. In: The child and adolescent athlete, O. Bar-Or (Ed.). Berlin: Blackwell Wissenschafts-Verlag GmbH,1996, pp. 42–53.
24. Jaskólski, A., B. Veenstra, P. Goossens, A. Jaskólska, and J.S. Skinner. Optimal resis-tance for maximal power during treadmill running. Sports Med. 7:17–30, 1996.
25. Keane, S., T. Reilly, and M. Hughes. Analysis of work-rates in Gaelic football. Aust. J. Sci. Med. Sport. 25:100–102, 1993.
26. Kilding, A., H. Tunstall, and D. Kuzmic. Suitability of FIFA’s “The 11” trainingprogramme for young football players - impact on physical performance. J. Sci. Med.Sport. 7:320–326, 2008.
27. Kollath, E., G. Merheim, A. Braunfelder, and H. Kleinöder. Sprintschnelligkeit undSprungkraft von jugendlichen Leistungs-Fußballspielern. Leistungssport. 36:3–25,2006.
28. Kotzamanidis, C. The effect of sprint training on running performance and vertical jump in pre-adolescent boys. J Hum Mov Stud. 44:225–240, 2003.
29. Kotzamanidis, C. Effect of plyometric training on running performance and vertical jumping in prebubertal boys. J. Strength Cond. Res. 20:441–445, 2006.
30. Kotzamanidis, C., D. Chatzopoulos, C. Michailidis, G. Papalakovou, and D. Patikas.The effect of a combined high-intensity strength and speed training program on therunning and jumping ability of soccer players. J. Strength Cond. Res. 19:369–375,2005.
31. Kruger, A., and A.E. Pienaar. Anthropometric, physical and motor performance deter-minations of sprinting and long jump in 10-15 year old boys from disadvantaged com-munities in South Africa. S. African J. Res. Sport. Phys. Ed. Rec. 2009:69–81, 2009.
32. Kruger, A., and A.E. Pienaar. The effect of a sport development programme on sprint-ing and long jump abilities in 10-15 year old boys from disadvantaged communitiesin south africa. S. African J. Res. Sport. Phys. Ed. Rec. 31:83–96, 2009.
33. Le Gall, F., J. Beillot, and P. Rochcongar. The improvement in maximal anaerobicpower from soccer player during growth. Sci. Sports. 17:177–188, 2002.
34. Lidor, R., B. Falk, M. Arnon, Y. Cohen, G. Segal, and Y. Lander. Measurement of talentin team handball: the questionable use of motor and physical tests. J. Strength Cond.
Res. 19:318–325, 2005.35. Lim, J.M., and M.Y. Chia. Reliability of power output derived from the nonmotorized
treadmill test. J. Strength Cond. Res. 21:993–996, 2007.36. Luhtanen, P., T. Vänttinen, M. Häyrinen, and E.W. Brown. A comparison of selected
physical, skill and game understanding abilities in Finnish youth soccer players. In:Science and Football IV, W. Spinks, T. Reilly, and A. Murphy (Eds.). Cambridge: TheUniversity Press, 2002, pp. 271–274.
37. Maio Alves, J.M., A.N. Rebelo, C. Abrantes, and J. Sampaio. Short-term effects of complex and contrast training in soccer players’ vertical jump, sprint, and agility abili-ties. J. Strength Cond. Res. 24:936–941, 2010.
38. McMillan, K., J. Helgerud, R. Macdonald, and J. Hoff. Physiological adaptations to
soccer specic endurance training in professional youth soccer players. Br. J. Sports Med. 39:273–277, 2005.39. Mero, A. Force-time characteristics and running velocity of male sprinters during the

7/29/2019 Assessing Youth Sprint Ability Methodological Issues, Reliability and Performance Data
http://slidepdf.com/reader/full/assessing-youth-sprint-ability-methodological-issues-reliability-and-performance 26/27
Assessing Youth Sprint Ability 467
41. Meyer, T., B. Coen, A. Urhausen, P. Wilking, S. Honorio, and W. Kindermann. Athleticabilities in adolescent soccer players. Dtsch. Z. Sportmed. 56:20–25, 2005.
42. Meylan, C., and D. Malatesta. Effects of in-season plyometric training within soccer
practice on explosive actions of young players. J. Strength Cond. Res. 23:2605–2613,2009.43. Oliver, J.L., N. Armstrong, and C.A. Williams. Relationship between brief and prolonged
repeated sprint ability. J. Sci. Med. Sport. 12:238–243, 2009.44. Oliver, J.L., N. Armstrong, and C.A. Williams. Reliability and validity of a soccer-spe-
cic test of prolonged repeated-aprint ability. Int J Sports Physiol Perform. 2:138–149,2007.
45. Oliver, J.L., A.C. Williams, and N. Armstrong. Reliability of a eld and laboratory testof repeated sprint ability. Pediatr. Exerc. Sci. 18:339–350, 2006.
46. Philippaerts, R. M., Vaeyens, T., Janssens, M., Van Renterghem, B. Matthys, D., Craen,R. et al. The relationship between peak height velocity and physical performance in
youth soccer players. J Sports Sci. 24:221–230, 2006.47. Ratel, S., C.A. Williams, J. Oliver, and N. Armstrong. Effects of age and mode of exercise
on power output proles during repeated sprints. Eur. J. Appl. Physiol. 92:204–210,2004.
48. Ratel, S., C.A. Williams, J. Oliver, and N. Armstrong. Effects of age and recoveryduration on performance during mutiple treadmill sprints. Int. J. Sports Med. 27:1–8,2006.
49. Reilly, T., A.M. Williams, A. Nevill, and A. Franks. A multidisciplinary approach totalent identication in soccer. J Sports Sci. 18:695–702, 2000.
50. Sleivert, G., and M. Taingahue. The relationship between maximal jump-squat powerand sprint acceleration in athletes. Eur. J. Appl. Physiol. 91:46–52, 2004.
51. Sutton, N.C., D.J. Childs, O. Bar-Or, and N. Armstrong. A nonmotorized treadmill testto assess children’s short-term power output. Pediatr. Exerc. Sci. 12:91–100, 2000.
52. Tong, R.J., W. Bell, G. Ball, and E.M. Winter. Reliability of power output measurementsduring repeated treadmill sprintin in rugby players. J Sports Sci. 19:289–297, 2001.
53. Tumilty, D. Protocols for the physiological assessment of male and female soccer play-ers. In: Physiological tests for elite athletes, C. Gore (Ed.). Champaign, IL: HumanKinetics, 2000, pp. 356–362.
54. van Praagh, E., M.A. Fargeas, L. Léger, N. Fellmann, and J. Coudert. Short-term poweroutput in children measured on a computerized treadmill ergometer, in: Joint Meeting.Alliston, Ontario: Human Kinetic Publisher, Inc., 1993, p 482.
55. Venturelli, M., D. Bishop, and L. Pettene. Sprint training in preadolescent soccer play-ers. Int. J. Sport. Perf. 3:558–562, 2008.
56. Wong, P-L., K. Chamari, A. Dellal, and U. Wisløff. Relationship between anthropo-metric and physiological characteristics in youth soccer players. J. Strength Cond. Res. 23:1204–1210, 2009.
57. Wong, P.L., K. Chamari, and U. Wisloff. Effects of 12-week on-eld combined strengthand power training on physical performance among U-14 young soccer players. J.Strength Cond. Res. 24:644–652, 2010.
58. Yagüe, P.H., and J.M. De La Fuente. Changes in height and motor performance relativeto peak height velocity: A mixed-longitudinal study of Spanish boys and girls. Am. J.
Hum. Biol. 10:647–660, 1998.
59. Yanagiya, T., H. Kanehisa, M. Kouzaki, Y. Kawakami, and T. Fukunaga. Effect of gender on mechanical power output during repeated bouts of maximal running intrained teenagers. Int. J. Sports Med. 24:304–310, 2003.

7/29/2019 Assessing Youth Sprint Ability Methodological Issues, Reliability and Performance Data
http://slidepdf.com/reader/full/assessing-youth-sprint-ability-methodological-issues-reliability-and-performance 27/27
Copyright of Pediatric Exercise Science is the property of Human Kinetics Publishers, Inc. and its content may
not be copied or emailed to multiple sites or posted to a listserv without the copyright holder's express written
permission. However, users may print, download, or email articles for individual use.