
Assessing water availability and related economic social ... · Assessing water availability and...
138
602 FAO FISHERIES AND AQUACULTURE TECHNICAL PAPER ISSN 2070-7010 Assessing water availability and economic, social and nutritional contributions from inland capture fisheries and aquaculture An indicator-based framework
-
Upload
trinhkhanh -
Category
Documents
-
view
216 -
download
0
Transcript of Assessing water availability and related economic social ... · Assessing water availability and...

This study provides an initial indicator-based framework for understanding the economic, social and nutritional contributions of inland capture fisheries and aquaculture and their links
to available water resources. Fourteen indicators covering environmental, economic, social and nutritional dimensions of inland fisheries and aquaculture are identified and tested in
eighteen African and Asian countries with significant inland fish production. Complexities in defining and estimating the indicators are discussed, and initial results based on currently available data are presented to identify gaps and future steps to improve knowledge. The
study discusses the potential use of these indicators as a baseline for national sectoral planning and management as a means to inform intersectoral water management and, in the face of climate change and changing water availability, as inputs into modelling the potential
economic, social and nutritional losses and opportunities to society stemming through impacts in the inland fisheries sector.
602FA
OA
ssessing water availability and econom
ic, social and nutritional contributions from inland capture fi
sheries and aquaculture – An indicator-based fram
ework
602
FAOFISHERIES ANDAQUACULTURE
TECHNICALPAPER
ISSN 2070-7010
Assessing water availability and economic, social and nutritional contributions from inland capture fisheries and aquaculture An indicator-based framework
I5878E/1/07.16
ISBN 978-92-5-109318-4 ISSN 2070-7010
9 7 8 9 2 5 1 0 9 3 1 8 4

Cover photo credits: Top left: Farm integrated with chicken houses. Rwanda (©FAO). Top right: Tilapia farming in cages of the Lake Harvest Company, Lake Kariba, Zimbabwe (©FAO, M. Reantaso). Bottom left: Farmers selling their products early morning in Vientiane, Laos (©FAO, M. Halwart). Bottom right: A farmer is preparing to feed his fish, Mymensingh, Bangladesh (©FAO, N. Ahmed).
Assessing water availability and economic, social and nutritional contributions from inland capture fisheries and aquaculture An indicator-based framework
by
Daniela OttavianiFAO ConsultantFAO Fisheries and Aquaculture DepartmentRome, Italy
Cassandra De YoungFishery Planning Analyst FAO Fisheries and Aquaculture DepartmentRome, Italy
and Sachiko TsujiSenior Fishery StatisticianFAO Fisheries and Aquaculture DepartmentRome, Italy
FOOD AND AGRICULTURE ORGANIZATION OF THE UNITED NATIONSRome, 2016
FAOFISHERIES ANDAQUACULTURE
TECHNICALPAPER
602
The designations employed and the presentation of material in this information product do not imply the expression of any opinion whatsoever on the part of the Food and Agriculture Organization of the United Nations (FAO) concerning the legal or development status of any country, territory, city or area or of its authorities, or concerning the delimitation of its frontiers or boundaries. The mention of specific companies or products of manufacturers, whether or not these have been patented, does not imply that these have been endorsed or recommended by FAO in preference to others of a similar nature that are not mentioned.
The views expressed in this information product are those of the author(s) and do not necessarily reflect the views or policies of FAO.
ISBN 978-92-5-109318-4
© FAO, 2016
FAO encourages the use, reproduction and dissemination of material in this information product. Except where otherwise indicated, material may be copied, downloaded and printed for private study, research and teaching purposes, or for use in non-commercial products or services, provided that appropriate acknowledgement of FAO as the source and copyright holder is given and that FAO’s endorsement of users’ views, products or services is not implied in any way.
All requests for translation and adaptation rights, and for resale and other commercial use rights should be made via www.fao.org/contact-us/licence-request or addressed to [email protected].
FAO information products are available on the FAO website (www.fao.org/publications) and can be purchased through [email protected].

iii
Preparation of this document
This technical paper was prepared under the auspices of the “Climate Change, Fisheries and Aquaculture: testing a suite of methods for understanding vulnerability, improving adaptability and enabling mitigation (GCP/GLO/322/NOR)” project, supported by the Government of Norway. The report has received inputs from experts in the water and fisheries sectors within the Food and Agriculture Organization of the United Nations (FAO) and beyond.

iv
Abstract
This study provides an indicator-based framework for understanding the economic, social and nutritional contributions of inland capture fisheries and aquaculture and their links to available inland water resources. The framework proposes fourteen initial indicators to represent environmental, economic, social and nutritional dimensions that are based on their ability to be applicable to inland capture fisheries and aquaculture, and that are easy to interpret, robust and applicable at the national as well as regional or local scales.
These indicators have the potential to: (i) measure the current benefits derived from the inland capture fisheries and aquaculture sector from the available natural and artificial inland water areas as a baseline for national sectoral planning and management; (ii) inform intersectoral water management; and (iii) be included, in the face of climate change and changing water availability, as inputs into modelling the potential economic, social and nutritional losses and opportunities to society stemming from impacts in the inland fisheries sector.
The indicator framework has been tested in eighteen African and Asian countries, which are diverse not only in their natural and artificial water resources, but also in their economic, social and cultural contexts. Although the compilation exercise was constrained by a paucity of available information, the results show the type of information, and reliability, that can be obtained in data-poor situations. The results also show how these indicators can support the identification of major data gaps and possible incongruences in available statistics.
This study also describes the methodological approach, including the criteria used to assemble the indicators, the data sources, and the major achievements and constraints encountered in the compilation of the indicators. An overview of the initial indicator values among the eighteen African and Asian countries is provided to show the consistency and efficacy of the indicator-based framework.
The indicator framework is an important initial step towards improved understanding of the contributions to human well-being of inland capture fisheries and aquaculture from freshwater and brackish-water systems. In the face of climate change and other factors impacting water availability, this framework can assist countries in providing a baseline for their fisheries and aquaculture planning and management, in understanding the vulnerability of the sector to climate change, and in supporting the participation of the sector in ever crucial intersectoral water management discussions.
FAO. 2016. Assessing water availability and economic, social and nutritional contributions from inland capture fisheries and aquaculture: an indicator-based framework, by Daniela Ottaviani, Cassandra De Young and Sachiko Tsuji. FAO Fisheries and Aquaculture Technical Paper No. 602. Rome, Italy.
v
Contents
Preparation of this document iiiAbstract ivAcknowledgements viiAbbreviations and acronyms viiiList of tables/figures ixForeword xiExecutive summary xii
1. Introduction 11.1 Climate change and the importance of water management for the
inland fisheries sector 1
1.2 The need for an assessment of water use for the inland fisheries sector 2
2. Analytical framework 52.1 Indicator framework 52.1.1 Approaches for identification and compilation of indicators at the
national level 62.1.2 Environmental dimension 72.1.3 Economic dimension 102.1.4 Social dimension 132.1.5 Nutritional dimension 15
3. Methodology 173.1 Country selection 17
3.2 Environmental dimension 193.2.1 Methodology used for the water availability indicators 193.2.2 Major achievements in developing water availability indicators 203.2.3 Relevant issues not accounted for by the current compilation of water
availability indicators 21
3.3 Economic dimension 213.3.1 Methodology used in the economic indicators 213.3.2 Major achievements in developing the economic indicators 243.3.3 Relevant issues not accounted for by the compiled economic indicators 24
3.4 Social dimension 253.4.1 Methodology used in the social indicators 253.4.2 Major achievements in developing the social indicators 263.4.3 Relevant issues not accounted for by the compiled social indicators 27
3.5 Nutritional dimension 283.5.1 Methodology used in the nutritional indicators 283.5.2 Major achievements in developing nutritional indicators 283.5.3 Relevant issues not accounted for by the compiled nutritional indicators 29
4. Implementation 314.1 Environmental dimension 314.1.1 Overview of the water availability indicators in nine African countries 314.1.2 Overview of the economic indicators in nine African countries 34

vi
4.1.3 Overview of the social indicators in nine African countries 384.1.4 Overview of the nutritional indicators in nine African countries 404.1.5 Description of water availability indicators in nine African countries 414.1.6 Description of economic indicators in nine African countries 444.1.7 Description of social indicators in nine African countries 484.1.8 Description of nutritional indicators in nine African countries 50
4.2 Implementation of compiled indicators for Asian countries 524.2.1 Overview of the water availability indicators in nine Asian countries 524.2.2 Overview of the economic indicators in nine Asian countries 554.2.3 Overview of the social indicators in nine Asian countries 584.2.4 Overview of the nutritional indicators in nine Asian countries 604.2.5 Description of the water availability indicators in nine Asian countries 614.2.6 Description of the economic indicators in nine Asian countries 644.2.7 Description of social indicators in nine Asian countries 674.2.8 Description of nutritional indicators in nine Asian countries 70
5. Further considerations 735.1 Multidimensionality and modularity of the indicator-based
framework for multiple indicators 73
5.2 Benefits related to water use of the inland fisheries sector 74
5.3 Major results achieved through the testing of the indicator-based framework and further steps 78
6 References 81
Appendix 1. Indicator descriptions 91
Appendix 2. Indicator values 115
vii
Acknowledgements
The authors wish to thank all the experts within FAO who have provided insights and inputs to the present study. Since the document conveys results based on several different statistics on water availability, economic, social and nutritional aspects, the compilation of the indicator-based framework has been possible thanks to many different FAO colleagues who generously shared their data knowledge and expertise. In particular, the authors wish to thank Simon Funge-Smith, Luca Garibaldi, Devin Bartley and David Lymer for discussion and inputs on the existing divergence in inland capture fisheries statistics, Xiaowei Zhou for his assistance and for sharing his comprehensive understanding on aquaculture statistics, Gabriella Laurenti and Stefania Vannuccini for fruitful discussion on nutritional indicators and the relationship with FAO food balance sheets, Fernando Jara and Raimon Sfeir for helping with FAO data on employment, Sara Montanaro for her assistance on fisheries statistics and the FishstatJ database, Stefania Vannuccini, Luca Garibaldi and Hassan Mohamad for inputs and discussion on first-sale and farmgate prices, Sergei Khomenko, Jeff Jenness, Mario De Bloise, Laura d’Aietti and Ilaria Rosati for backing on maps and satellite images to derive water areas, Georgia De Santis for assistance on FAOSTAT statistics of inland waters, Armand Gribling and Maria Kalentšits for searching and making available several publications.
Beyond FAO, the authors wish to thank Friday Njaya for feedback on fisheries statistics in Malawi, Ishmael Kosamu, Gabriel Kombozi Limbeya Bolomo for information on aquaculture statistics in the Democratic Republic of the Congo, Yaw Ansah for deriving an estimate for the aquaculture pond area in Ghana, Jayantha Chandrasoma for sharing information on perennial reservoirs in Sri Lanka, Laleye Philippe for feedback on compiled statistics in Benin, the Royal Fish Benin, West African Fish Ltd and Royal Danish Fish in Ghana for sharing data on their aquaculture production, Suresh Chandra and Salim Shyam for sharing information on fish prices in India, and Marian Amu-Mensah in Ghana, and all the authors that promptly shared electronic versions of their papers.
Gratitude to Jennifer Gee and Kristine Sallet for reading and editing earlier versions of the text, and a special acknowledgement to Nagayoshi Hotta for formatting the final bulky version of this document with great patience and dedication. Further, we would like to express our sincere thanks to the editor, Maria Giannini, and to José Luis Castilla Civit for the layout of the report.

viii
Abbreviations and acronyms
CIA Central Intelligence AgencyCNES Centre National d’Etudes SpatialesETM Enhanced Thematic MapperFAO Food and Agriculture Organization of the United NationsFAOSTAT FAO’s information system on water and agricultureGIS Geographic Information SystemGLS Global Land SurveyGlobCover global land cover mapGLWD Global Lakes and Wetlands DatabaseISSCAAP International Standard Statistical Classification of Aquatic
Animals and PlantsLandsat Land Remote-Sensing SatelliteLCCS Land Cover Classification SystemTM Thematic MapperUNCLOS United Nations Convention on the Law of the SeaUS$ United States dollar WCA World Census of Agriculture

ix
List of tables
Table 1 African countries and criteria considered in the country selection 17Table 2 Asian countries and criteria considered in the country selection 18
List of figures
Figure 1 Structure of the analytical multidimensional framework 6Figure 2 “Inland water area” in nine African countries 31Figure 3 “Percentage of inland water over country area” in nine African
countries 32Figure 4 “Percentage of permanent inland water over inland water area” in
nine African countries 33Figure 5 “Inland water area and aquaculture pond area” in nine African
countries 33Figure 6 “Inland fish production – quantity” in nine African countries 34Figure 7 “Inland fish production – value” in nine African countries 35Figure 8 “Aquaculture contribution to inland fish production – quantity” in
nine African countries 36Figure 9 “Aquaculture contribution to inland fish production – value” in
nine African countries 36Figure 10 “Fish-water productivity – quantity” in nine African countries 37Figure 11 “Fish-water productivity – value” in nine African countries 38Figure 12 “Overall number of inland fishers and aquaculture farmers” in
nine African countries 39Figure 13 “Average density of overall inland fishers and aquaculture farmers”
in nine African countries 40Figure 14 “Fish protein supplied by inland fish production” in nine African
countries 40Figure 15 “Fish-protein water productivity” in nine African countries 41Figure 16 Comparison of water availability indicators in nine African countries 42Figure 17 Comparison of economic indicators in nine African countries 45Figure 18 Comparison of social indicators in nine African countrie 48Figure 19 Comparison of nutritional indicators in nine African countries 50Figure 20 “Inland water area” in nine Asian countries 52Figure 21 “Percentage of inland water over country area” in nine Asian
countries 53

x
Figure 22 “Percentage of permanent inland water over inland water area” in nine Asian countries 54
Figure 23 “Inland water area and aquaculture pond area” in the nine Asian countries 54
Figure 24 “Inland fish production – quantity” in nine Asian countries 55Figure 25 “Inland fish production – value” in nine Asian countries 56Figure 26 “Aquaculture contribution to inland fish production – quantity” in
nine Asian countries 56Figure 27 “Aquaculture contribution to inland fish production – value” in nine
Asian countries 57Figure 28 “Fish-water productivity – quantity” in nine Asian countries 58Figure 29 “Fish-water productivity – value” in nine Asian countries 58Figure 30 “Overall number of inland fishers and aquaculture farmers” in nine
Asian countries 59Figure 31 “Average density of overall inland fishers and aquaculture farmers”
in nine Asian countries 59Figure 32 “Fish protein supplied by inland fish production” in nine Asian
countries 60Figure 33 “Fish-protein water productivity” in nine Asian countries 60Figure 34 Comparison of water availability indicators in nine Asian countries 61Figure 35 Comparison of economic indicators in nine Asian countries 65Figure 36 Comparison of social indicators in nine Asian countries 68Figure 37 Comparison of nutritional indicators in nine Asian countries 71Figure 38 Graphical representation of the architecture of the indicator-based
framework 73Figure 39 Comparison of different possible water accounting frameworks
scales 75Figure 40 Hypothetical situation of a comparison of protein water productivity
provided by different sectors 76Figure 41 Possible uses of the indicator-based framework 77

xi
Foreword
When the well is dryWe know the worth of water
– Benjamin Franklin
Water is one of the most politically and institutionally difficult resources to manage in any country, as water is a public resource with multiple values and diverse functions. Climate change is increasing the natural variability of water availability in many countries. Water management is becoming a more and more challenging task, as it requires dealing with increasing levels of uncertainty on water availability on one side and increasing intersectoral pressures and trade-offs on the other.In recent years, it has become increasingly evident that water management problems cannot be addressed singularly by each sector, as water challenges are increasingly interconnected with many development-related issues, such as food security, energy production, tourism and transport. Therefore, every sector should engage in the water policy arena, contributing to the improved accountability of important water resources and to the understanding of present and future impacts of a potential change in water availability.
The aim of this study is to raise attention and awareness on the true and often unrecognized values of freshwater and brackish-water resources for the inland fisheries sector. This study provides an initial indicator-based framework for understanding economic, social and nutritional benefits of inland capture fisheries and aquaculture and how these contributions can be linked directly to available water resources. It is auspicable that the results of this study, by providing a methodology and solid reference material, can encourage further investigation, stimulate intersectoral discussion, strengthen policy agenda and set national priorities for climate change planning.

xii
Executive summary
This study proposes an indicator-based framework, comprising environmental, economic, social and nutritional dimensions, to specify the benefits to society derived from the inland capture fisheries and aquaculture sector to the freshwater and brackish-water resources upon which the sector relies.
Water-dependent sectors are extremely vulnerable to increased climate variability and climate change, as one of the impacts on the global hydrological cycle is the increased variability of the ecological water flows that support freshwater ecosystems. Increased temperatures and evaporation rates and changes in precipitation patterns can impact fish habitats and fish populations by creating changes in water quantity and quality of their habitats. Those impacts can be further aggravated by other sectors, such as crop and livestock production, forestry plantations, industrial use, hydropower generation, tourism activities, and municipal and domestic uses, sharing decreasing water resources.
Vulnerability of the inland capture fisheries and aquaculture sector will depend on its exposure to such changes, as for example: the extent and timing of changes in water availability; its sensitivity to changes such as communities’ dependence on the sector; and its adaptive capacity, which includes its ability to transition to new production systems. Therefore, it is important for governments, sectors and others linked to the inland water resources to document the current and potential benefits deriving from the inland aquatic systems and to understand the potential implications and vulnerabilities arising from changes in water regimes.
For this purpose, an indicator-based framework has been built to represent the environmental, economic, social and nutritional dimensions of the inland fisheries sector, and to identify national-level indicators that are applicable to both inland capture fisheries and aquaculture; that are easy to calculate, easy to understand and interpret; and that are robust and applicable at national as well as subregional and local scales.
The inland fisheries sector, comprising both inland capture fisheries and aquaculture activities, is characterized by a diverse use of water resources. In some cases, such as fishing and cage and pen aquaculture, the sector uses water resources “on-site” as habitat. In other activities, such as pond aquaculture and other aquaculture methods, the sector uses water off-site by abstracting water to artificial structures designed for aquaculture production. In addition, “off-site” aquaculture methods may rely on inland waters for the wild capture of larvae or juveniles to be raised in artificial culture environments (i.e. capture-based aquaculture), and “on-site” inland capture fisheries may benefit from fish stocking of inland aquatic systems (i.e. culture-based capture fisheries). Therefore, it is challenging to provide a unique, combined assessment of water use by the inland fisheries sector. On the other hand, such a combined assessment is often necessary for intersectoral discussions, as inland capture fisheries and aquaculture are often interrelated activities and available statistics are often not disaggregated by fisheries and aquaculture.
In this study, “water use” by inland capture fisheries and aquaculture does not measure water utilization or consumption per se, but assesses the amount of water available to the sector in a country. To this end, different types of water areas are considered: lakes, rivers, artificial reservoirs, lagoons and permanent swamps (i.e. permanent inland waters), aquaculture ponds (i.e. aquaculture pond area) and seasonally flooded areas created by the overflowing of rivers and lakes triggered by intense seasonal precipitations (i.e. seasonally flooded areas). The estimation of the extent of these water

xiii
areas can be considered as the basic assessment that can be carried out at the national level without requiring complex analyses or modelling approaches.
The resulting indicator-based framework is represented by the following fourteen indicators, which should be considered an initial set of indicators needing further improvement as methodologies and data improve:
•Inland water area: assesses the amount of freshwater and brackish-water resources available in a given country and is constituted by the sum of “permanent inland waters” and “seasonally flooded areas”. This indicator is useful in providing a unified assessment of different potential aquatic habitats for fish and other aquatic organisms.
•Percentage of inland water over country area: assesses the relative extent of different habitats for fish and other aquatic organisms in the overall country area. This indicator is useful for cross-country comparisons and in showing the relevance of “inland water area”.
•Percentage of permanent inland water over inland water area: assesses the relative extent of “permanent inland waters” in the overall country area. This indicator is useful for providing indications of climate change impacts and for water management and planning.
•Inland water area and aquaculture pond area: assesses the overall extent of water areas important to maintain inland capture fisheries and aquaculture activities. This indicator is the core element related to the water availability assessment, able to bridge the diversity of activities of the inland fisheries sector.
• Inland fish production – quantity: assesses the overall amount of fish and other aquatic organisms caught or farmed from the available “inland water area and aquaculture pond area”. This indicator is useful in showing the economic importance of water availability for the inland capture fisheries and aquaculture activities.
•Inland fish production – value: assesses the monetary value, expressed in United States dollars, of the “inland fish production – quantity” on the basis of producer prices for species and species groups reported in each analysed country. This indicator is useful in showing the economic importance of water availability for the inland capture fisheries and aquaculture activities.
•Aquaculture contribution to inland fish production – quantity: assesses the share of the average annual quantity of “inland fish production” conveyed by aquaculture. This indicator is useful for cross-country comparison and for monitoring the development of aquaculture over time in a given country.
•Aquaculture contribution to inland fish production – value: assesses the proportion of value of the “inland fish production – value” conveyed by aquaculture. This indicator is useful for cross-country comparison and for monitoring the economic contribution of aquaculture over time in a given country.
•Fish-water productivity – quantity: assesses the average quantity of fish per unit of water resource harvested and/or farmed from the available “inland water area and aquaculture pond area”. This indicator is useful for cross-country comparison and for climate change scenario analysis by showing the average quantity of fish per unit of water resource that could be affected by a potential change in water availability.
•Fish-water productivity – value: assesses the average value of fish per unit of water resource harvested and/or farmed from the available “inland water area and aquaculture pond area”. This indicator is useful for cross-country comparison and for climate change scenario analysis by showing the average value of one hectare of water and potential losses or gains related to a potential change in water availability.
•Overall number of inland fishers and aquaculture farmers: assesses the number of inland fishers and aquaculture farmers in a given country. This indicator is useful

xiv
in showing the social relevance of water availability for the inland capture fisheries and aquaculture activities.
• Average density of overall inland fishers and aquaculture farmers: assesses, on average, how many people per square kilometre rely on fishing and aquaculture. This indicator is useful for cross-country comparison and for climate change scenario analysis by assessing the average number of people that could be affected by a potential change of available water resources.
•Fish protein supplied by inland fish production: assesses the average fish protein content provided annually by inland capture fisheries and aquaculture in a given country. This indicator is useful in showing the importance of nutrition in water made available to inland capture fisheries and aquaculture activities.
•Fish-protein water productivity: assesses the average quantity of fish protein per unit of water resource harvested and/or farmed from the available “inland water area and aquaculture pond area”. This indicator is useful for cross-country comparison and for climate change scenario analysis by showing the average quantity of proteins per unit of water resource that could be gained or lost through a potential change in water availability.
This indicator-based framework has been applied to nine African countries (Benin, Cameroon, Chad, the Congo, the Democratic Republic of the Congo, Ghana, Malawi, Mali and Nigeria) and nine Asian countries (Bangladesh, Cambodia, China (mainland), India, the Lao People’s Democratic Republic, Myanmar, Sri Lanka, Thailand and Viet Nam). These countries are characterized by significant inland fish production, intense seasonal precipitation and major river basins. They also constitute a demanding sample in which to apply the indicator framework considering the complexity and the diversity of their natural and artificial water resources as well as their economic, social and cultural contexts. This innate complexity has been often further complicated by the paucity of available information encountered during the compilation of those indicators that required a substantial data-mining effort. The complete description of information retrieved from the literature or available in online databases used for the implementation of the indicator-based framework in each of the analysed countries is available in the companion report of this document (FAO, 2016a).
The testing of the indicator-based framework shows that the multiplicity (i.e. combined use) of the indicators used is complementary in delivering a stronger picture of the benefits derived from water use of the inland fisheries sector. In general, national-level indicators are, by necessity, oversimplifications and face the challenge of condensing the complexity and uncertainty of the information they represent. Having a diversity of national-level indicators provides a richer understanding of the national contexts, can highlight different aspects and can be used for different purposes. In addition, having a multiplicity of indicators can also be useful to cross-validate information shown by the indicator framework, as coherence in indicator values is expected among interrelated indicators.
The indicator-based framework comprises four indicators that measure the economic, social and nutritional benefits conveyed by water use of the inland fisheries in absolute terms: (i) the amount of fish and other aquatic organisms made available to society (“inland fish production – quantity”); (ii) the monetary value of fish production (“inland fish production – value”); (iii) the total number of people engaged in fishing and aquaculture activities (“overall number of inland fishers and aquaculture farmers”); and (iv) the amount of protein from fish and other aquatic organisms made available to society through inland capture fisheries and aquaculture activities (“fish protein supplied by inland fish production”). In addition to the absolute indicators, the analytical framework includes four additional, indicators of water productivity to measure the relative benefits per unit of water resource delivered through inland capture fisheries and aquaculture, corresponding to: (i) the average amount of fish produced per unit of water

xv
resource (“fish-water productivity – quantity”); (ii) the monetary value of fish produced per unit of water resource (“fish-water productivity – value”); (iii) the average amount of proteins produced per unit of water resources (“fish-protein water productivity”); and (iv) the average number of people engaging in fishing and aquaculture per units of water resource (“average density of overall inland fishers and aquaculture farmers”).
The potential use of these indicators types – absolute and relative – is vast. These indicators can, for example, provide a baseline for development planning and management within the sector. They can also be used to understand vulnerability of the inland fisheries sector to climate variability and climate change. At the national level, the indicators can be used to compare across countries to show the current absolute and relative benefits derived from the inland aquatic systems by the inland fisheries sectors.
As they cover dimensions of relevance to other sectors (e.g. food and nutrition, value, employment), these indicators may also be used to improve the sector’s general visibility, as well as the ability to participate in intersectoral water management discussions. The water productivity indicators expressed in water area are, however, currently limited in their use for cross-sector comparisons, as other sectors, characterized by an off-stream water use, have water productivity indicators expressed in terms of water volumes. But an intersectoral comparison, using both absolute and relative indicators, would be extremely useful to qualitatively and quantitatively analyse potential synergies or trade-offs in the provision of water among sectors and could be pivotal in stimulating further analysis of the sustainability of multiple water uses.


1
1. Introduction
1.1 CLIMATE CHANGE AND THE IMPORTANCE OF wATER MANAGEMENT FOR THE INLAND FISHERIES SECTORIt is now widely accepted that climate change is no longer simply a potential threat, but an ongoing process triggered by the use of fossil fuel combustion and excessive greenhouse gas emissions over the past centuries (Cubasch et al., 2013). As climate change is already observable (IPCC, 2014), there is an urgent need to reduce global emissions of greenhouse gases to slow down the process. At the same time, it is important to integrate climate change adaptation into strategies and planning at all levels to build resilience against current and projected climate change impacts.
An anticipated impact of climate change on the global hydrological cycle is an increased variability in the ecological water flows that support freshwater ecosystems (FAO, 2011a). Increased temperatures will, for example, increase the evaporation rates of shallow waterbodies, while alterations in precipitation patterns will change the patterns of river discharge with consequent effects on the seasonal patterns of river flooding, especially in tropical monsoon climates (FAO, 2007). The increasing or decreasing water flows will impact the functionality of aquatic ecosystems related to increased water temperatures and thermal stratification, increased levels of siltation caused by increased runoff, over-enrichment in nutrients, increased risk of low oxygen levels and increased salinization of coastal brackish waters, etc. (Meaden and Kapensky, 1991).
The impacts of these abiotic changes on fish habitats and fish populations will depend on a wide number of factors, including the species, the geographical area, the type of aquatic habitat, as well as the severity and the rapidity of change of habitat conditions. However, the cascade of potential impacts driven by climate change on inland fish populations and other aquatic organisms is likely to be triggered by an initial increased variability of water flows and the consequent increased seasonality of water availability (FAO, 2007), which could be exacerbated by actions from other sectors sharing decreasing water resources (Welcomme et al., 2010; FAO, 2011a).
The inland fisheries sector, comprising both inland capture fisheries and non-marine aquaculture, requires water resources for its activities. The inland fisheries sector stands in a vulnerable position in the face of climate change. Although it is one of the sectors that has contributed least to the causes of climate change, the sector will be among the first to feel climate change impacts (Cochrane et al., 2009). The specific vulnerability of the inland fisheries sector to changes in water availability will depend on its exposure to such changes (e.g. extent and timing of changes in water availability), its sensitivity to change (e.g. communities’ dependence on the sector), and its adaptive capacity (e.g. its ability to transition to new production systems). In addition, without integrated aquatic systems planning and management, the inland fisheries sector could additionally suffer from water use by other sectors, which directly or indirectly will affect aquatic ecosystems (Cochrane et al., 2009).
The inland fisheries sector, therefore, needs to engage in water management and policy-making together with the other sectors by documenting not only the importance of water resources for its activities, but also the benefits that are conveyed by inland capture fisheries and aquaculture in terms of economic growth, social welfare and nutrition (Arthur et al., 2013; FAO, 2003a; UNEP, 2010; Welcomme et al., 2010). Since water management planning is at the core for the present and future viability and growth potential of the inland capture fisheries and aquaculture sector, a framework

Assessing water availability and economic, social and nutritional contributions from inland capture fisheries and aquaculture2
for assessing water availability for the inland fisheries sector represents a priority for climate change planning (UNEP, 2010).
1.2 THE NEED FOR AN ASSESSMENT OF wATER USE FOR THE INLAND FISHERIES SECTORMany governments and international organizations with an interest in aquatic resources have endorsed indicator-based approaches to assess water security, water management and informed policy dialogues (UN-Water, 2009). Within such indicator-based assessment approaches, there is a clear demand for water-related indicators directly linked to the fisheries sector. National-level indicators currently in use for the fisheries sector include those assessing the state of inland capture fisheries and aquaculture (FAO, 2014; FAO, 2011b), those for sustainable development (FAO, 1999a; OECD, 2002), and those for designing data collection and sharing systems for co-managed fisheries (FAO, 2005). Each of these indicator frameworks incorporates economic, social and nutritional dimensions, but do not directly link these with an assessment of the water resources on which the inland fisheries sector relies. As a consequence, the importance of water resources for fishing and aquaculture has often not been adequately reflected in indicator-based assessments supporting water management decisions.
The UN-Water Task Force on Indicators, Monitoring and Reporting, established in 2008 under the UN-Water inter-agency mechanism, proposed a set of “key indicators” for a rapid assessment of the water sector. Among the eleven proposed indicators, only one (i.e. “change in freshwater fish production”) was specifically identified to measure the benefits conveyed by inland capture fisheries and aquaculture (UN-Water, 2009).
The inland fisheries sector is often marginalized in the debate on water allocation and water use. This partially derives from the difficulty of quantifying the water required for the maintenance of fishing and aquaculture activities, as the inland fisheries sector has both in-stream1 and off-stream2 water uses. Capture fisheries, as well as cage and pen aquaculture, are characterized by an in-stream water use, which means that water is used on-site and not removed. Pond aquaculture and other types of aquaculture, instead, have an off-stream water use, which means that water is abstracted and transported off-site in order to create water areas that are used for aquaculture activities. In-stream water use is usually measured in terms of the water area required for a given purpose, while off-stream water use is measured in terms of water volumes abstracted and consumed and returned to the environment (FAO, 2016b). As a result, the sector, in principle, needs two metrics to measure its water use (water area and water volume), which creates difficulties in conveying a unique, combined assessment of water use by the inland fisheries sector.
Two approaches express water use of the inland fisheries sector in one single metric. In the first approach, the in-stream water use of fishing and aquaculture activities can be expressed in terms of environmental water flow, which enables the use of water volume. This approach allows to express both in-stream and off-stream water use in terms of volume, but needs to be implemented with data at the watershed level and also requires some modelling (FAO, 2016b). The second approach is to measure both in-stream and off-stream water use in terms of water areas.
This document is built upon the second approach of measuring water use of the inland fisheries sector in terms of water areas. Water areas can be used to measure fishing areas and areas occupied by pond or cages used in aquaculture and, consequently, the water resources on which the inland fisheries sector relies. Water areas are usually
1 In-stream water use on-site water use does not remove water from its source, or water is immediately returned with little or no alteration (Kohli, Frenken and Spottorno, 2010).
2 Off-stream water use takes the water out of the water source, reducing the amount of available water left on-site (Kohli, Frenken and Spottorno, 2010).

3Introduction
relatively easier to measure than water volume, as their extent can also be derived from land cover maps using Geographic Information Systems (GIS) or directly through remote sensing, which can be very helpful for data collection in data poor situations.
From a biological perspective, tropical finfish inhabiting tropical ecosystems have, for example, often adapted to live in shallow waters and even in deep lakes and rarely colonize waters below the photic zone (Kapetsky and Barg, no date). In other words, the extent of their suitable habitat is sufficiently reflected by water area. In addition, water areas can be used not only to measure freshwater environments, but also to measure brackish-water environments such as lagoons, estuaries and deltas. Water areas can also be used to measure the variation (expansion or contraction) of inland waters and the extent of seasonally flooded areas, which are often quite shallow in depth and represent key water resources for the regeneration of fish stocks and as important fishing areas (Welcomme, 1979b; Welcomme, 1999).
For this reason, the assessment of water areas can be considered as the simplest approach that can be carried out at the national level, with no demand of complex analysis or modelling. The assessment of water areas available to the inland fisheries sector can, therefore, represent the common denominator to consider the different water uses of the sector and to measure the benefits provided by the sector to society by its use of water.
Climate change is strongly related to potential changes in water availability to fisheries and aquaculture and can be assessed, in part, by measuring variations in the natural and artificial water areas available for inland capture fisheries and aquaculture. In addition, a decrease in available water areas can directly impact the inland fish-water productivity, leading to a reduction of fish production and related economic losses. Serious impacts on society may occur, as a reduction in water availability can directly affect the people and communities relying on fisheries and aquaculture activities for their livelihoods. In many areas, fish constitute an important source of food, protein and micronutrients. Reduced inland fish production could also decrease the amount of animal proteins and nutrients available for food security and healthy diets (HLPE, 2014).
An indicator-based framework, therefore, is presented and tested in this study as a first step toward a multidimensional assessment of the benefits conveyed by the inland fisheries sector and their links to available water resources. Chapter 2 describes the analytical framework and methodology used to determine relevant indicators and the list of proposed indicators. Chapter 3 provides an overview of the methodology used to compile the indicators. Chapter 4 presents a summary of the application of the framework to eighteen countries across Africa and Asia. Chapter 5 concludes with a discussion on the challenges and opportunities facing the implementation of such an indicator-based framework as well as on its potential uses. The use of the indicator-based framework could be highly diversified for inland fisheries and aquaculture management, climate-proofing its development and strengthening the sector’s ability to take part in cross-sectoral water management in the face of climate change.
A companion report of this document (FAO, 2016a) provides the complete description of information retrieved from the literature review or available in online databases used for the implementation of the indicator-based framework in each of the analysed countries.


5
2. Analytical framework
This chapter describes the proposed indicator-based framework with the objective of representing some of the multiple dimensions of the services provided by freshwater systems through the inland fisheries sector, namely environmental, economic, social and nutritional dimensions. An overview of the different descriptive indicators used to represent these dimensions is given together with an explanation of the overarching methodological approach used to estimate and compile national-level indicators.
The chapter continues with four sections related to each dimension, for which major aspects are outlined together with explanations of how these aspects are reflected by the different adopted categories of the selected indicators. Each dimension provides the available data sources for indicator estimation, areas for which a data-mining effort has been undertaken, and a final list of indicators. Further detailed descriptions of the compiled indicators are available in Appendix 1 and values listed in Appendix 2.
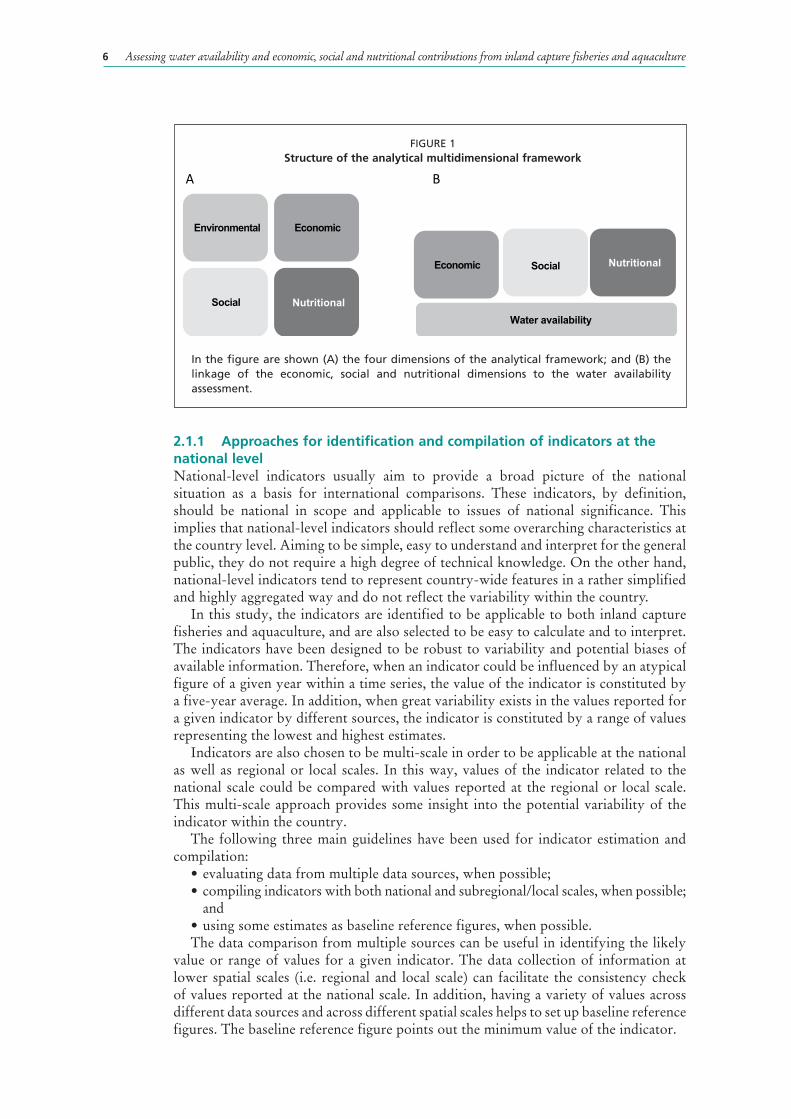
2.1 INDICATOR FRAMEwORkThe analytical framework, designed to represent the benefits derived from water use of the inland fisheries sector, covers three interlinked pillars of sustainable development – environmental, economic and social. In addition, since the activities of the inland fisheries sector are tightly related to ensuring food and nutrition security, the analytical framework includes a separate dimension related to nutrition (Figure 1A).
It should be noted that, in this document, the term “water use” is not used synonymously with water consumption.3 The water use of the fisheries sector is considered to be the amount of water that is presumably needed for the survival and reproduction of fish and other aquatic organisms targeted by the inland fisheries sector and, therefore, is necessary to ensure the economic, social and nutritional contributions the inland fisheries sector provides to society.
Fourteen indicators are proposed within an initial framework to represent environmental, economic, social and nutritional dimensions (Figure 1A). As the four dimensions are highly interconnected, each indicator may be relevant to more than one dimension. It should also be noted that the set of indicators has a descriptive purpose, providing baseline information that is useful for policy analysis, but not specifically related to any policy target. However, different indicators highlight aspects of relevance to decision-making and policy development.
In the proposed indicator-based framework, three typologies of indicators are chosen to provide information on the four dimensions. The first group includes basic physical descriptive indicators relating to water availability and fish production. A second typology of indicators measures the benefits conveyed by the activities of the inland fisheries sector in absolute terms, such as the total amount of fish, value, protein and employment in the primary sector derived through the sector. In addition to the absolute indicators, the framework proposes a third group of indicators related to “water productivity” in order to measure the relative benefits delivered through fisheries and aquaculture per unit of water resource available (Figure 1B). These indicators express a ratio between a derived benefit, constituting an output, and an input of water resources (e.g. average amount of fish per area of water).
3 Water consumption is defined as the proportion of freshwater water withdrawal, which is no longer available (for withdrawal) because it has evaporated, been transpired by plants, incorporated into products or crops, consumed by people or livestock, or otherwise removed from the immediate water environment (Dyson, Bergkamp and Scanlon, 2003).
Assessing water availability and economic, social and nutritional contributions from inland capture fisheries and aquaculture6
2.1.1 Approaches for identification and compilation of indicators at the national levelNational-level indicators usually aim to provide a broad picture of the national situation as a basis for international comparisons. These indicators, by definition, should be national in scope and applicable to issues of national significance. This implies that national-level indicators should reflect some overarching characteristics at the country level. Aiming to be simple, easy to understand and interpret for the general public, they do not require a high degree of technical knowledge. On the other hand, national-level indicators tend to represent country-wide features in a rather simplified and highly aggregated way and do not reflect the variability within the country.
In this study, the indicators are identified to be applicable to both inland capture fisheries and aquaculture, and are also selected to be easy to calculate and to interpret. The indicators have been designed to be robust to variability and potential biases of available information. Therefore, when an indicator could be influenced by an atypical figure of a given year within a time series, the value of the indicator is constituted by a five-year average. In addition, when great variability exists in the values reported for a given indicator by different sources, the indicator is constituted by a range of values representing the lowest and highest estimates.
Indicators are also chosen to be multi-scale in order to be applicable at the national as well as regional or local scales. In this way, values of the indicator related to the national scale could be compared with values reported at the regional or local scale. This multi-scale approach provides some insight into the potential variability of the indicator within the country.
The following three main guidelines have been used for indicator estimation and compilation:
•evaluatingdatafrommultipledatasources,whenpossible;•compilingindicatorswithbothnationalandsubregional/localscales,whenpossible;
and•usingsomeestimatesasbaselinereferencefigures,whenpossible.The data comparison from multiple sources can be useful in identifying the likely
value or range of values for a given indicator. The data collection of information at lower spatial scales (i.e. regional and local scale) can facilitate the consistency check of values reported at the national scale. In addition, having a variety of values across different data sources and across different spatial scales helps to set up baseline reference figures. The baseline reference figure points out the minimum value of the indicator.
Environmental Economic
Social
Economic Social
Nutritional
Nutritional
Water availability
A B
Environmental Economic
Social Nutritional
Economic Social Nutritional
Water availability
A B
FIGURE 1Structure of the analytical multidimensional framework
In the figure are shown (A) the four dimensions of the analytical framework; and (B) the linkage of the economic, social and nutritional dimensions to the water availability assessment.

7Analytical framework
Finally, each indicator value is associated with a qualitative, three-level reliability score (low, medium and high) on the basis of the type of data source, the existence of eventual data gaps, and the coherence among other reported values at the national level and sublevels.
2.1.2 Environmental dimensionMain scope of the environmental dimensionThe main scope of the environmental dimension is to provide an assessment of natural and artificial water areas identified by the “inland water area and aquaculture pond area” indicator comprising three different water categories occurring in a given country.
Water categories“Inland water area” is defined as the sum of “permanent inland waters” and “seasonally flooded areas”. “Permanent inland waters” include the area covered by lakes,4 artificial reservoirs,5 coastal lagoons,6 rivers7 and permanent swamps8; “seasonally flooded areas” are the inundated areas created by seasonal precipitations and consequent
4 Lake: A natural relatively large body of standing water with negligible currents and enclosed by land. It can be regarded as a relatively closed system as most of its hydrology is internal, although it may have substantial inflowing and outflowing rivers (Crespi and Coche, 2008).
5 Artificial reservoir: An artificial lake pond or basin for the collection, storage, regulation and control of water and for its use when required (Crespi and Coche, 2008).
6 Coastal lagoon: A shallow body of water, as a pond or lake, separated from the sea by sandbars, often associated with estuaries, and which may have a shallow, restricted outlet to the sea. They show great seasonal variation in salinity, being fed from associated freshwater rivers for part of the year and from the sea for the remainder (Crespi and Coche, 2008).
7 River: Natural water course from 5–100 m wide, running into another water course or a lake (Crespi and Coche, 2008).
8 Swamp: Type of wetland with water standing permanently or for a considerable period of time and with a dense cover of native vegetation. Swamps may be freshwater or saltwater, and tidal or non-tidal (Crespi and Coche, 2008).
METHODOLOGICAL APPROACH
Criteria in identifying national-level indicators:• applicable to both inland capture fisheries and aquaculture;• easy to calculate;• easy to understand and interpret;• robust; and• applicable at the national and subregional/local scales.
Guidelines for indicator estimation and compilation:• evaluating data from multiple data sources, when available;• compiling indicators with both national and subregional/local scales, when
possible; and• using some estimates as baseline reference figures, when possible.
Each indicator value is compared with:• other indicators compiled for the countries; and• other values of the same indicator among analysed countries.
Each indicator value is ranked with a three-level reliability score:• low; • medium; and • high.
Assessing water availability and economic, social and nutritional contributions from inland capture fisheries and aquaculture8
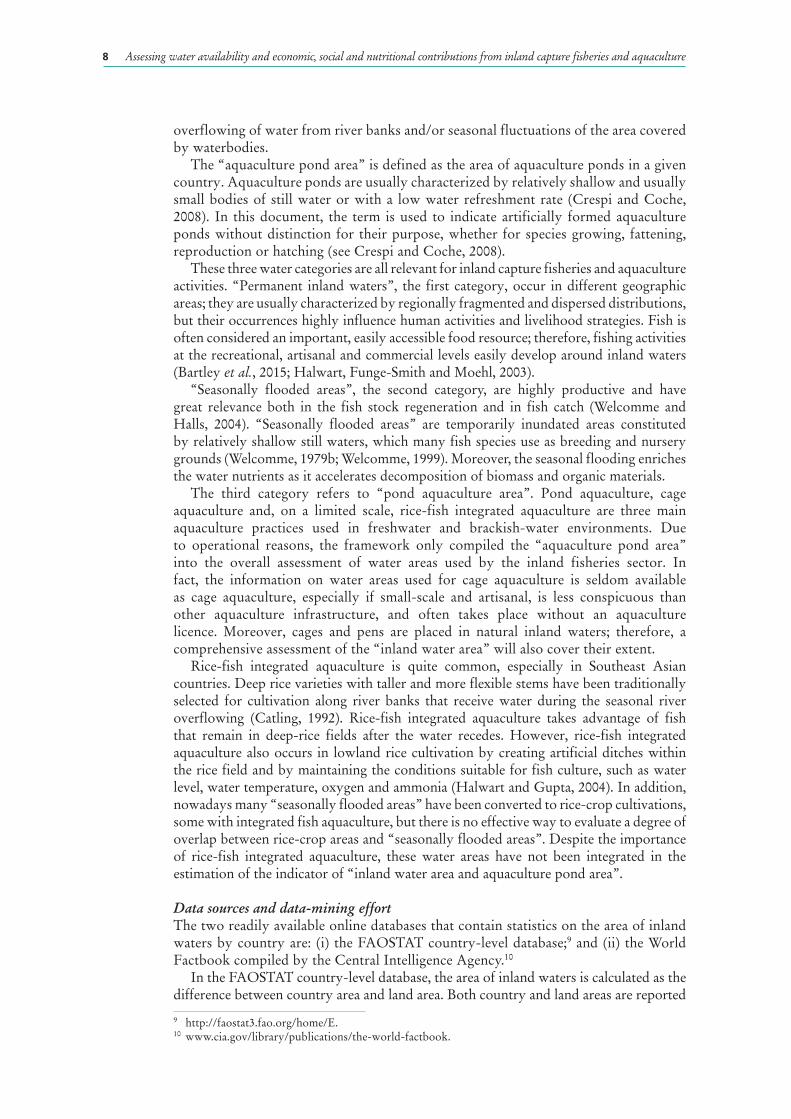
overflowing of water from river banks and/or seasonal fluctuations of the area covered by waterbodies.
The “aquaculture pond area” is defined as the area of aquaculture ponds in a given country. Aquaculture ponds are usually characterized by relatively shallow and usually small bodies of still water or with a low water refreshment rate (Crespi and Coche, 2008). In this document, the term is used to indicate artificially formed aquaculture ponds without distinction for their purpose, whether for species growing, fattening, reproduction or hatching (see Crespi and Coche, 2008).
These three water categories are all relevant for inland capture fisheries and aquaculture activities. “Permanent inland waters”, the first category, occur in different geographic areas; they are usually characterized by regionally fragmented and dispersed distributions, but their occurrences highly influence human activities and livelihood strategies. Fish is often considered an important, easily accessible food resource; therefore, fishing activities at the recreational, artisanal and commercial levels easily develop around inland waters (Bartley et al., 2015; Halwart, Funge-Smith and Moehl, 2003).
“Seasonally flooded areas”, the second category, are highly productive and have great relevance both in the fish stock regeneration and in fish catch (Welcomme and Halls, 2004). “Seasonally flooded areas” are temporarily inundated areas constituted by relatively shallow still waters, which many fish species use as breeding and nursery grounds (Welcomme, 1979b; Welcomme, 1999). Moreover, the seasonal flooding enriches the water nutrients as it accelerates decomposition of biomass and organic materials.
The third category refers to “pond aquaculture area”. Pond aquaculture, cage aquaculture and, on a limited scale, rice-fish integrated aquaculture are three main aquaculture practices used in freshwater and brackish-water environments. Due to operational reasons, the framework only compiled the “aquaculture pond area” into the overall assessment of water areas used by the inland fisheries sector. In fact, the information on water areas used for cage aquaculture is seldom available as cage aquaculture, especially if small-scale and artisanal, is less conspicuous than other aquaculture infrastructure, and often takes place without an aquaculture licence. Moreover, cages and pens are placed in natural inland waters; therefore, a comprehensive assessment of the “inland water area” will also cover their extent.
Rice-fish integrated aquaculture is quite common, especially in Southeast Asian countries. Deep rice varieties with taller and more flexible stems have been traditionally selected for cultivation along river banks that receive water during the seasonal river overflowing (Catling, 1992). Rice-fish integrated aquaculture takes advantage of fish that remain in deep-rice fields after the water recedes. However, rice-fish integrated aquaculture also occurs in lowland rice cultivation by creating artificial ditches within the rice field and by maintaining the conditions suitable for fish culture, such as water level, water temperature, oxygen and ammonia (Halwart and Gupta, 2004). In addition, nowadays many “seasonally flooded areas” have been converted to rice-crop cultivations, some with integrated fish aquaculture, but there is no effective way to evaluate a degree of overlap between rice-crop areas and “seasonally flooded areas”. Despite the importance of rice-fish integrated aquaculture, these water areas have not been integrated in the estimation of the indicator of “inland water area and aquaculture pond area”.
Data sources and data-mining effortThe two readily available online databases that contain statistics on the area of inland waters by country are: (i) the FAOSTAT country-level database;9 and (ii) the World Factbook compiled by the Central Intelligence Agency.10
In the FAOSTAT country-level database, the area of inland waters is calculated as the difference between country area and land area. Both country and land areas are reported
9 http://faostat3.fao.org/home/E.10 www.cia.gov/library/publications/the-world-factbook.
9Analytical framework
to the FAO Statistical Division from the country national statistical offices. In the World Factbook, the total country area is divided in the area occupied by “land” and “water” and the data source is not reported, but in most countries the values published in the World Factbook for water areas coincide with the FAOSTAT statistics.11
However, for the purpose of this analysis, more information is needed in order to compile estimates of “permanent inland waters” and “seasonally flooded areas” in each analysed country. Multiple data sources have been inspected, including estimates derived from existing land cover maps and remote sensing (GIS sources), as well as an extensive literature review of articles and documents on the inland fisheries sector (non-GIS sources). More details on the data sources and data used are provided in Appendix 1).
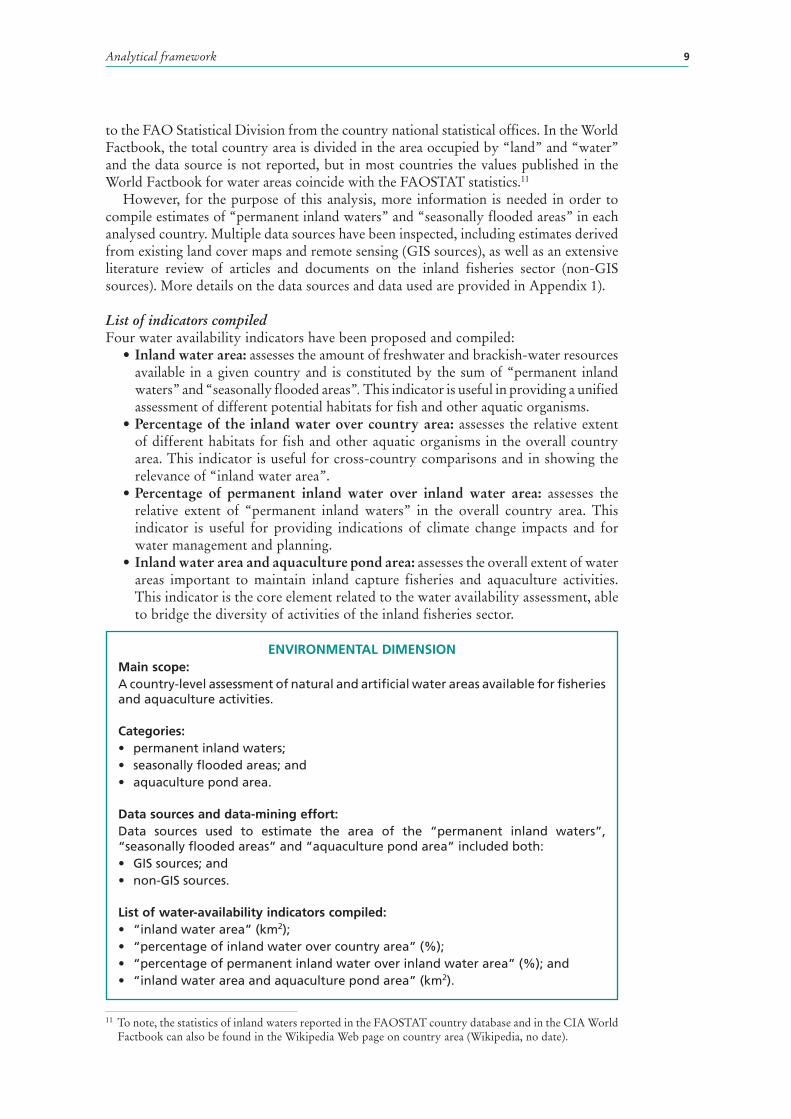
List of indicators compiledFour water availability indicators have been proposed and compiled:
•Inland water area: assesses the amount of freshwater and brackish-water resources available in a given country and is constituted by the sum of “permanent inland waters” and “seasonally flooded areas”. This indicator is useful in providing a unified assessment of different potential habitats for fish and other aquatic organisms.
•Percentage of the inland water over country area: assesses the relative extent of different habitats for fish and other aquatic organisms in the overall country area. This indicator is useful for cross-country comparisons and in showing the relevance of “inland water area”.
•Percentage of permanent inland water over inland water area: assesses the relative extent of “permanent inland waters” in the overall country area. This indicator is useful for providing indications of climate change impacts and for water management and planning.
•Inland water area and aquaculture pond area: assesses the overall extent of water areas important to maintain inland capture fisheries and aquaculture activities. This indicator is the core element related to the water availability assessment, able to bridge the diversity of activities of the inland fisheries sector.
11 To note, the statistics of inland waters reported in the FAOSTAT country database and in the CIA World Factbook can also be found in the Wikipedia Web page on country area (Wikipedia, no date).
ENvIRONMENTAL DIMENSIONMain scope:A country-level assessment of natural and artificial water areas available for fisheries and aquaculture activities.
Categories:• permanentinlandwaters;• seasonallyfloodedareas;and• aquaculturepondarea.
Data sources and data-mining effort: Data sources used to estimate the area of the “permanent inland waters”, “seasonally flooded areas” and “aquaculture pond area” included both:• GISsources;and• non-GISsources.
List of water-availability indicators compiled:• “inlandwaterarea”(km2); • “percentageofinlandwaterovercountryarea”(%);• “percentageofpermanentinlandwateroverinlandwaterarea”(%);and• “inlandwaterareaandaquaculturepondarea”(km2).
Assessing water availability and economic, social and nutritional contributions from inland capture fisheries and aquaculture10
2.1.3 Economic dimensionMain scope of the economic dimensionThe main scope of the economic dimension is to provide an overall assessment of “inland fish production”, both in terms of quantity and value, and to compute an estimate of biomass productivity12 of fish per water units, called “fish-water productivity”, expressed both in quantity and value. “Inland fish production” is defined as the harvest of fish obtained from fishing and aquaculture activities in freshwater and brackish-water areas. A reliable measurement of “inland fish production” has high economic and policy relevance. A large share of the “inland fish production” is often traded through informal channels or for direct household consumption, and thus is not fully reflected in national statistics whose main focus is to monitor economic and commercial activities. This underestimation often contributes to the poor appreciation of the importance of the inland fisheries sector (FAO, 2011b). Consequently, the economic benefits derived from the inland fisheries sectors, as well as the importance of availability and access to water resources for fishing and aquaculture activities, are often not well recognized in policy-making (FAO, 2003a).
CategoriesThe “inland fish production” includes both the inland capture fisheries13 and non-marine aquaculture14 production. Inland capture fisheries production includes fish landings of all type of fisheries (i.e. industrial, small scale/artisanal, subsistence and recreational) in freshwater and brackish-water areas. Non-marine aquaculture production includes fish farming by all types of aquaculture methods (i.e. ponds, cages, raceways, recirculating aquaculture systems) using freshwater and brackish-water resources, excluding mariculture.15 The term “fish” indicates all aquatic species, including freshwater and diadromous fish, crustaceans, molluscs and other aquatic animals.
Data sources and data-mining effortOfficial statistics on “inland fish production” are yearly reported by countries to the FAO Fisheries and Aquaculture Department (Garibaldi, 2012). These official statistics are available online and recorded in the FAO database (FishstatJ), which is designed for statistical time series (FAO, 2006–2016).
The accuracy of officially reported statistics varies among countries according to their national data collection system (Coates, 2002; SEAFDEC, 2005; de Graaf et al., 2011; Lymer and Funge-Smith, 2009). Data collection and compilation of fish catch statistics may be based on direct monitoring at fish landings, self-reporting by vessels, or expert judgement with desktop analysis (SEAFDEC, 2005).
Fisheries surveys are often time-consuming, labour-intensive and expensive (Bazigos, 1974; SEAFDEC, 2005). Nevertheless, given the capillarity and often the occasional or seasonal nature of artisanal and recreational fishing activities, official statistics of inland capture fisheries production do not always adequately reflect the real contribution of small scale and artisanal fisheries to local and national economies (FAO, 2015; Bartley et al., 2015; World Bank, FAO and WorldFish Center, 2010).
12 Biomass productivity is the amount produced in an area during a given period of time (Arntzen and Ritter, 1994, reported in Choudhury and Jansen, 1998).
13 Inland capture fisheries is defined as the extraction of living aquatic organisms from natural or artificial inland waters, but excluding those from aquaculture facilities (FAO, 2010).
14 Aquaculture is defined as the farming of aquatic organisms involving intervention in the rearing process to enhance production and the individual or corporate ownership of the stock being cultivated (FAO, 2010).
15 Mariculture occurs when the cultivation of the end product takes place in seawater, such as fjords, inshore and open waters and inland seas, in which the salinity generally exceeds 20‰. Earlier stages in the life cycle of these aquatic organisms may be spent in brackish water or freshwater (FAO, 1990–2016).

11Analytical framework
Similarly, fish production from small-scale subsistence aquaculture ponds can also be underestimated in official statistics since aquaculture ponds are often spatially scattered and, consequently, national inventories are often incomplete (Halwart, Funge-Smith and Moehl, 2003). The direct survey of fish production either harvested or farmed often does not record a large share of fish production, which is informally traded and consumed for subsistence (Halwart, Funge-Smith and Moehl, 2003; Gee and Tsuji, 2015; Bartley et al., 2015). Therefore, this share of fish production for household consumption is often not recorded at the landing site, at the farm or at initial sale (Needham and Funge-Smith, 2014).
Recognizing that the official statistics may not fully represent the actual situation, in particular the contribution of small-scale activities, the document takes into account both the official and non-official information when available: (i) official statistics of “inland fish production”; and (ii) non-official estimates of “inland fish production”.
Official national statistics (i.e. official estimate) are considered as the primary reference to compile the “inland fish production” indicator. In addition, in a few countries, the indicator of “inland fish production” is constituted by a range of values to reflect the divergence between official and non-official available estimates. The divergence between official and non-official estimates can reach from severalfolds to even one order of magnitude. Official and non-official estimates are derived using different methodological approaches and assumptions, which makes it inappropriate to combine such different values. On the contrary, a range of values can help the data user to become aware of the divergence of opinions and provides an indication of the level of uncertainty on “inland fish production” estimates.
The analytical framework also includes an assessment of the value of “inland fish production” by country. The assessment is first made separately for both the inland capture fisheries production and the non-marine aquaculture production, and then these outputs are summed together to obtain the “inland fish production – value”. The assessment of “inland fish production – value” is based on:
• first-sale prices by species or species group related to inland capture fisheriesproduction; and
• farmgate prices by species or species group related to non-marine aquacultureproduction.
First-sale prices and farmgate prices are producer prices,16 as they refer to the prices recorded at the first point of sale. For each analysed country, some information related to farmgate prices by species or species group is available through questionnaires on aquaculture statistics reported by countries to the FAO Fisheries and Aquaculture Department and by several publications of the Southeast Asian Fisheries Development Center. The major data-mining effort has been carried out to collect information on the first-sale prices at which fishers sell their landings. It is evident that the first-sale and the farmgate prices, even for the same species, can vary significantly in space and time. Given the sparse information and lack of systematic price surveys, it is hard to identify a representative species price at the country level. For this reason, a price range for each species or species group is selected on the basis of information collected and used to calculate the “value using lowest unit price” and “value using highest unit price”.
The compilation of the “inland fish production”, both in terms of quantity and value, is also used to estimate the annual fish-water productivity, defined as kilograms or United States dollars of fresh fish produced per hectare of water. At the national level, the “fish-water productivity” is calculated by dividing the “inland fish production” in quantity or value by the “inland water area and aquaculture pond
16 Producer prices are received by farmers (and fishers) when they participate in their capacity as sellers of their own products at the farmgate or first point of sale (FAO, 2013).
Assessing water availability and economic, social and nutritional contributions from inland capture fisheries and aquaculture12
area”. This computation assumes that the whole “inland water area” is used for fishing or aquaculture activities. This assumption might not be operationally true. However, from an ecosystem point of view, even if only a portion of surface waters is used for fishing and aquaculture activities, the system of inland waters as a whole provides the suitable conditions for survival and reproduction of fish populations. In addition, since the analysed countries are mainly located in tropical areas with high population density, there is a high likelihood of having a large share of “inland water area” utilized for fishing and aquaculture activities. The “fish-water productivity” indicator provides a rough measurement of the importance of water resources for the inland fisheries sector, expressed in terms of the average quantity of fish produced per unit of water area and its corresponding economic value, which provides important information to enable discussion on water management with other sectors.
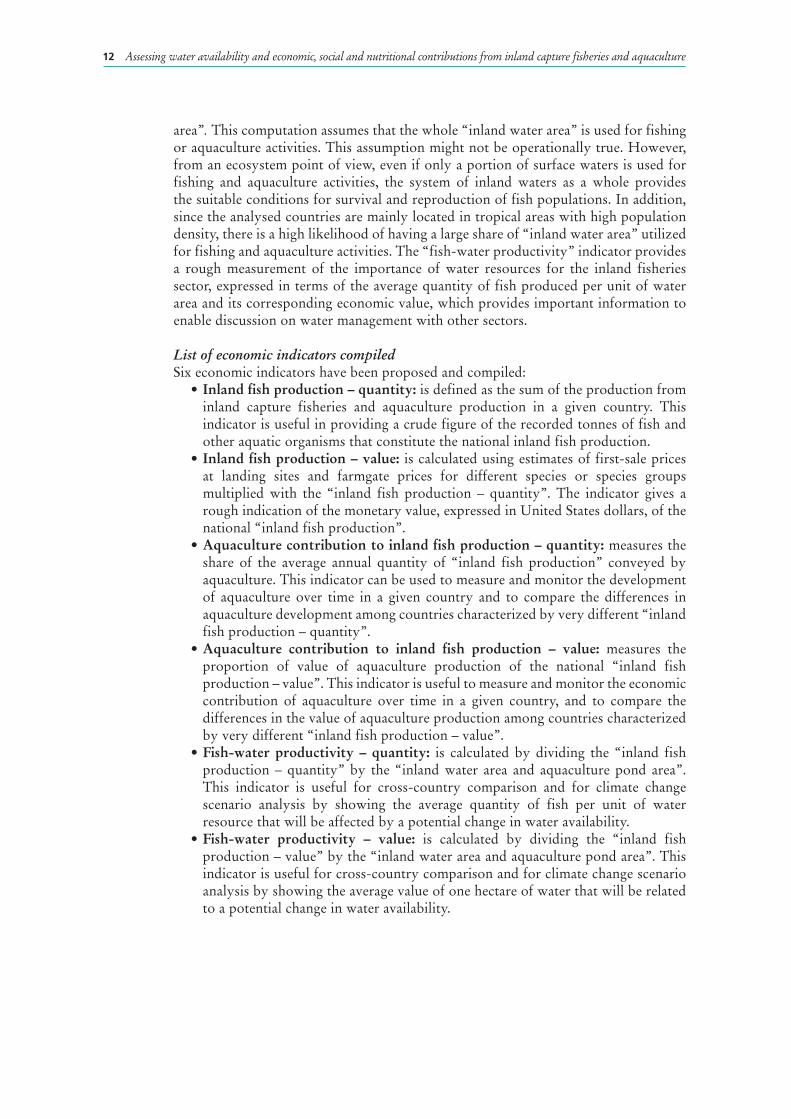
List of economic indicators compiledSix economic indicators have been proposed and compiled:
•Inland fish production – quantity: is defined as the sum of the production from inland capture fisheries and aquaculture production in a given country. This indicator is useful in providing a crude figure of the recorded tonnes of fish and other aquatic organisms that constitute the national inland fish production.
•Inland fish production – value: is calculated using estimates of first-sale prices at landing sites and farmgate prices for different species or species groups multiplied with the “inland fish production – quantity”. The indicator gives a rough indication of the monetary value, expressed in United States dollars, of the national “inland fish production”.
•Aquaculture contribution to inland fish production – quantity: measures the share of the average annual quantity of “inland fish production” conveyed by aquaculture. This indicator can be used to measure and monitor the development of aquaculture over time in a given country and to compare the differences in aquaculture development among countries characterized by very different “inland fish production – quantity”.
•Aquaculture contribution to inland fish production – value: measures the proportion of value of aquaculture production of the national “inland fish production – value”. This indicator is useful to measure and monitor the economic contribution of aquaculture over time in a given country, and to compare the differences in the value of aquaculture production among countries characterized by very different “inland fish production – value”.
•Fish-water productivity – quantity: is calculated by dividing the “inland fish production – quantity” by the “inland water area and aquaculture pond area”. This indicator is useful for cross-country comparison and for climate change scenario analysis by showing the average quantity of fish per unit of water resource that will be affected by a potential change in water availability.
•Fish-water productivity – value: is calculated by dividing the “inland fish production – value” by the “inland water area and aquaculture pond area”. This indicator is useful for cross-country comparison and for climate change scenario analysis by showing the average value of one hectare of water that will be related to a potential change in water availability.

13Analytical framework
2.1.4 Social dimensionMain scope of the social dimensionThe main scope of the social dimension is to provide a country-level assessment of the number of people engaged in inland capture fisheries and aquaculture activities and the average density in freshwater and brackish-water areas. These indicators aim to assess the importance of the inland fisheries sector in providing employment and supporting livelihoods and to show livelihood dependency on water resources.
CategoriesIn this study, the number of inland fishers and aquaculture farmers is considered without making any distinction in the degree of engagement (full-time17, part-time,18 or occasional19).
The distinction among engagement categories can be rather blurred. In inland waters, fishing activities tend to be quite seasonal. In fact, especially in areas affected by intense seasonal precipitations, fishing activities are concurrent with the establishment
17 Full-time: Individuals receiving at least 90 percent of their livelihood from farming, or spending at least 90 percent of their working time in that occupation (World Bank, FAO and WorldFish Center, 2010).
18 Part-time: Individuals receiving at least 30 percent but less than 90 percent of their livelihood from farming, or spending at least 30 percent but less than 90 percent of their working time in that occupation (World Bank, FAO and WorldFish Center, 2010).
19 Occasional: Individuals receiving under 30 percent of their livelihood from farming, or spending under 30 percent of their working time in that occupation (World Bank, FAO and WorldFish Center, 2010).
ECONOMIC DIMENSION
Main scope:A country-level assessment of “inland fish production” in quantity and value comprising inland capture fisheries and aquaculture activities and “fish-water productivity” to support water management and climate scenario analysis.
Categories:Inland fish production includes:• “national inland capture fisheries production”; and• “national non-marine aquaculture production”.
Fish categories are:• freshwater and diadromous fish species;• crustaceans;• molluscs; and• other aquatic animals.
Data sources and data-mining effort:• official statistics of inland fish production;• non-official estimates of inland fish production; and• estimates of first-sale and farmgate prices by species or species group by country.
List of economic indicators compiled:• “inland fish production – quantity” (tonnes);• “inland fish production – value” (US$);• “aquaculturecontributiontoinlandfishproduction–quantity”(%);• “aquaculturecontributiontoinlandfishproduction–value”(%);• “fish-water productivity – quantity” (kg/ha); and• “fish-water productivity – value” (US$/ha).

Assessing water availability and economic, social and nutritional contributions from inland capture fisheries and aquaculture14
of seasonal flooded areas and the concurrent season of fish migrations. Even full-time fishers are unlikely to fish throughout the year at any one location; usually fishers move according to the availability and increased catchability of fish stock in certain areas (Béné et al., 2012). Aquaculture farmers can also engage in aquaculture activities on a full-time, part-time or occasional basis. If fish are raised with an extensive aquaculture method, using low fish density and limited inputs, then the maintenance of appropriate living conditions for farmed fish stock is also less labour intensive. Occasional engagement in aquaculture is less common than occasional fishing given the relative larger investment required in aquaculture facilities (Smith, Khoa and Lorenzen, 2005).
Data sources and data-mining effortOfficial statistics related to the number of inland fishers and aquaculture farmers are yearly reported by countries to the FAO Fishery and Aquaculture Department. This study utilizes the statistics that are not currently disseminated to the public.20 The accuracy of officially reported statistics can vary among countries according to the system of data collection in place for statistics compilation (Coates, 2002). The number of fishers and aquaculture farmers operating in freshwater and brackish waters can be estimated using a household survey or administrative information, including vessel registries, fishing licences and aquaculture licences. As in the economic dimension, official statistics often tend to under-represent the contribution of small-scale, occasional, seasonal and subsistence activities, which are common among inland fisheries and aquaculture operations. In addition, obtaining information on fishing and aquaculture activities at the household level is usually very expensive and time-consuming, and is likely to be acquired only through a national census that includes specific modules on fishery and aquaculture (Béné et al., 2012; Gee and Tsuji, 2015). In most instances, subsistence artisanal fisheries or extensive household aquaculture are carried out on an occasional basis, or require a limited time budget and can be masked by other livelihood activities involving greater use of labour and resources. As a result, official statistics tend to be underestimated and can show large fluctuations in the time series related to the number of inland fishers and aquaculture farmers.
Taking this into account, the document examined the information on both: (i) the official statistics on the number of inland fishers and aquaculture farmers; and (ii) the non-official estimates on the number of inland fishers and aquaculture farmers, when available.
Official national statistics on the number of inland fishers and aquaculture farmers are considered to be the primary data source (i.e. official estimate) for compiling the “overall number of inland fishers and aquaculture farmers” indicator. However, when there are alternative estimates on the number of inland fishers and aquaculture farmers (non-official estimate), both official and non-official estimates have been reported as a range of values, which provide a general indication of the potential uncertainty in the available information.
This study also calculated a theoretical number of inland fishers that would be expected in the country on the basis of the extent of different inland waters (FAO, 2016a). The values are obtained by multiplying the area of different type of inland waters (such as lakes, coastal lagoons, reservoirs, flooded areas) occurring in a country by the median and maximum density of inland fishers in Africa or Asia estimated in these different types of inland waters, as reported in FAO (1995). These figures were only used as baseline reference figures, whose order of magnitude is compared with the estimates available for the number of inland fishers and aquaculture farmers as an additional indication to evaluate their reliability.
20 Further information on the dissemination process can be obtained by contacting [email protected].

15Analytical framework
List of social indicators compiledTwo social indicators have been proposed and compiled:
•Overall number of inland fishers and aquaculture farmers: assesses the number of inland fishers and aquaculture farmers in a given country. This indicator is useful in showing the social relevance of water availability for the inland capture fisheries and aquaculture activities.
• Average density of overall inland fishers and aquaculture farmers: assesses, on average, how many people per square kilometre rely on fishing and aquaculture. This indicator is useful for cross-country comparison and for climate change scenario analysis by assessing the average number of people that could be affected by a potential change of available water resources.
2.1.5 Nutritional dimensionMain scope under the nutritional dimensionThe main scope of the nutritional dimension is to provide an assessment on the quantity of animal proteins supplied by fish and other aquatic organisms through fishing and aquaculture activities in freshwater and brackish-water areas.
CategoriesThis study takes into account the fish protein supplied from inland capture fisheries and non-marine aquaculture production in freshwater and brackish-water resources and considers the proteins derived from the production of freshwater and diadrodomus fish, crustaceans, molluscs and other aquatic animals.
Data sources and data-mining effortThe fish protein supply provided by “inland fish production” has been assessed by breaking down the “inland fish production – quantity”, in terms of the amount of freshwater and diadromous fish, crustaceans, molluscs and other aquatic animals, and multiplying these quantities by the average protein content reported for these four species groups. The average values of protein content per species groups are extracted from FAO food balance sheet. These average values are food composition factors, which refer to the “fresh” commodity category (FAO, 2014a). Because the FAO food
SOCIAL DIMENSION
Main scope:A country-level assessment of the number of people engaged in inland fisheries and aquaculture and the average density in freshwater and brackish-water areas.
Categories:• fishers (full-time, part-time or occasional practitioners) operating in freshwater
and brackish waters; and • aquaculture farmers (full-time, part-time or occasional practitioners) operating
in freshwater and brackish waters.
Data sources and data-mining effort:• official statistics on the number of inland fishers and aquaculture farmers; and• non-official estimates on the number of inland fishers and aquaculture farmers.
List of social indicators compiled:• “overall number of inland fishers and aquaculture farmers” (people); and• “average density of overall inland fishers and aquaculture farmers” (people/km2).

Assessing water availability and economic, social and nutritional contributions from inland capture fisheries and aquaculture16
balance sheet uses a standardized methodology to represent the pattern of a country’s food supply during a specified reference period, no further data-mining effort has been undertaken to find alternative estimates of average protein content for these groups of species.
List of nutritional indicators compiledTwo nutritional indicators have been proposed and compiled:•Fish protein supplied by inland fish production: assesses the average fish protein
content provided annually by inland capture fisheries and aquaculture in a given country. This indicator is useful in showing the importance of nutrition in water made available to inland capture fisheries and aquaculture activities.
•Fish-protein water productivity: assesses the average quantity of fish protein per unit of water resource harvested and/or farmed from the available “inland water area and aquaculture pond area”. This indicator is useful for cross-country comparison and for climate change scenario analysis by showing the average quantity of proteins per unit of water resource that could be gained or lost through a potential change in water availability.
NUTRITIONAL DIMENSION
Main scope:An assessment on the quantity of proteins supplied by fish and other aquatic organisms through fishing and aquaculture activities in freshwater and brackish-water areas.
Categories:• “fish protein supplied by inland capture fishery production”; and• “fish protein supplied by non-marine aquaculture production”.
Data sources:• average protein content from the FAO food balance sheet (FAO, 2014a).
List of nutritional indicators compiled:• “fish protein supplied by inland fish production” (tonnes); and• “fish protein-water productivity” (kg/ha).
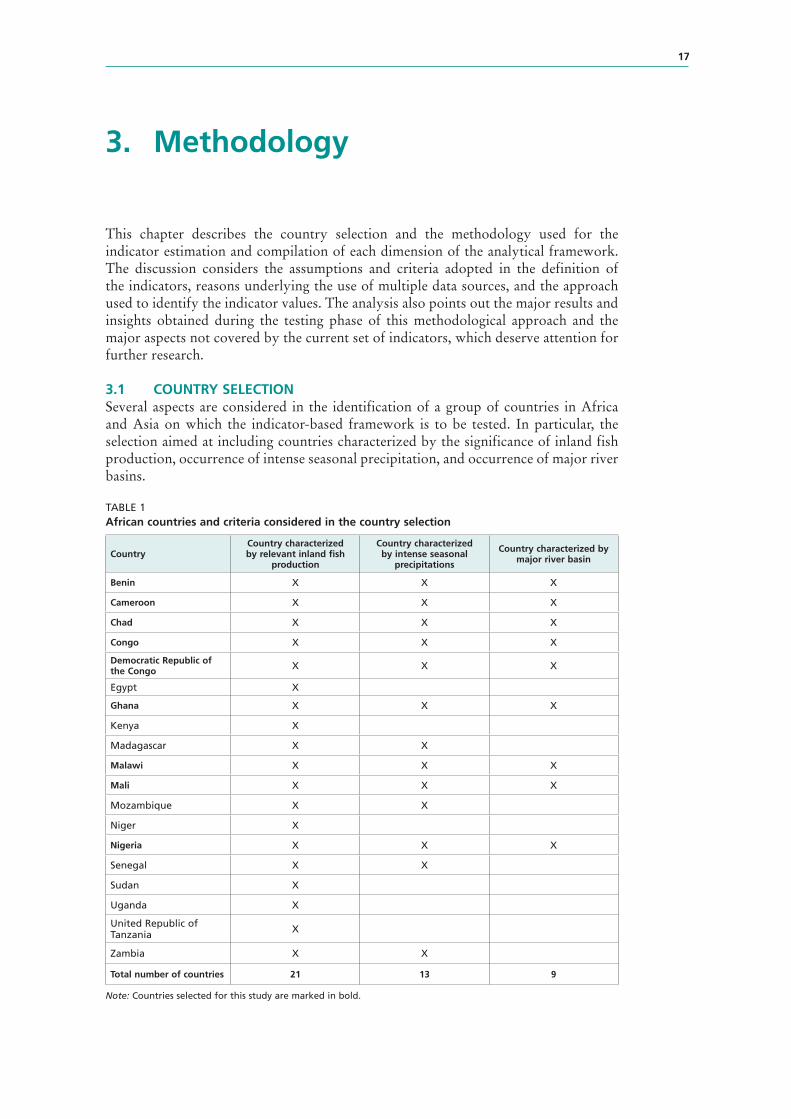
17
3. Methodology
This chapter describes the country selection and the methodology used for the indicator estimation and compilation of each dimension of the analytical framework. The discussion considers the assumptions and criteria adopted in the definition of the indicators, reasons underlying the use of multiple data sources, and the approach used to identify the indicator values. The analysis also points out the major results and insights obtained during the testing phase of this methodological approach and the major aspects not covered by the current set of indicators, which deserve attention for further research.
3.1 COUNTRy SELECTIONSeveral aspects are considered in the identification of a group of countries in Africa and Asia on which the indicator-based framework is to be tested. In particular, the selection aimed at including countries characterized by the significance of inland fish production, occurrence of intense seasonal precipitation, and occurrence of major river basins.
TABLE 1African countries and criteria considered in the country selection
CountryCountry characterized by relevant inland fish
production
Country characterized by intense seasonal
precipitations
Country characterized by major river basin
Benin X X X
Cameroon X X X
Chad X X X
Congo X X X
Democratic Republic of the Congo X X X
Egypt X
Ghana X X X
Kenya X
Madagascar X X
Malawi X X X
Mali X X X
Mozambique X X
Niger X
Nigeria X X X
Senegal X X
Sudan X
Uganda X
United Republic of Tanzania X
Zambia X X
Total number of countries 21 13 9
Note: Countries selected for this study are marked in bold.
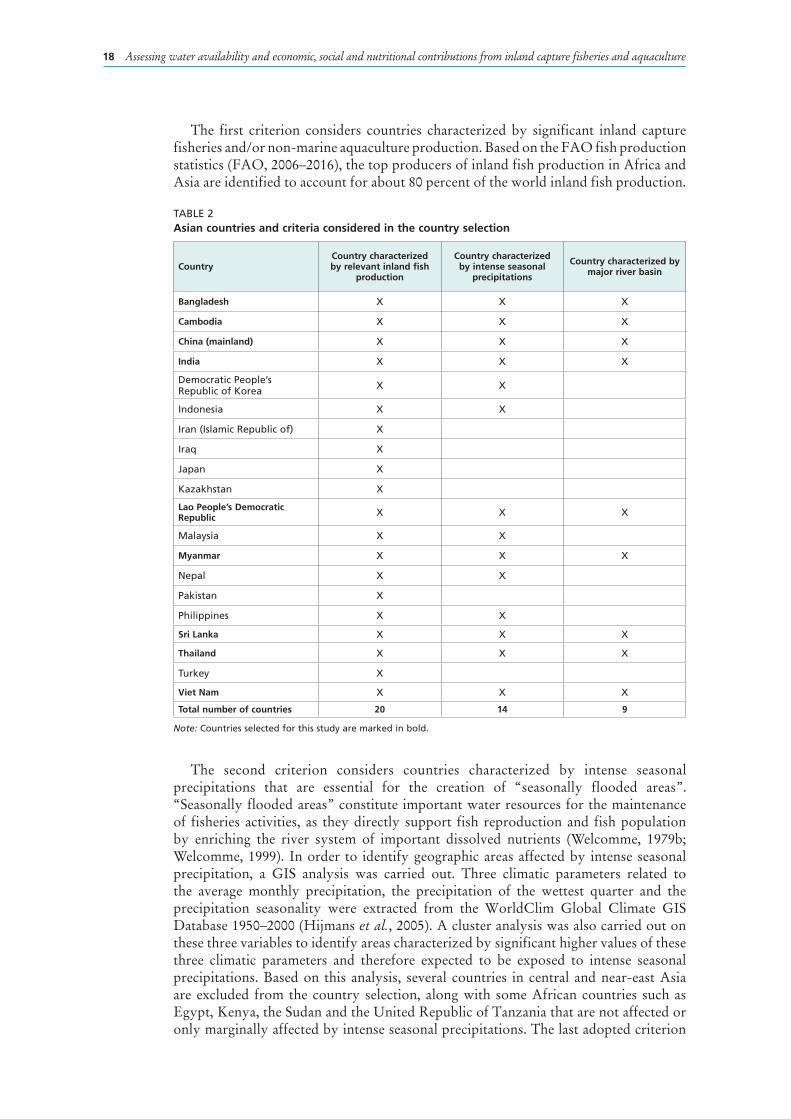
Assessing water availability and economic, social and nutritional contributions from inland capture fisheries and aquaculture18
The first criterion considers countries characterized by significant inland capture fisheries and/or non-marine aquaculture production. Based on the FAO fish production statistics (FAO, 2006–2016), the top producers of inland fish production in Africa and Asia are identified to account for about 80 percent of the world inland fish production.
TABLE 2Asian countries and criteria considered in the country selection
CountryCountry characterized by relevant inland fish
production
Country characterized by intense seasonal
precipitations
Country characterized by major river basin
Bangladesh X X X
Cambodia X X X
China (mainland) X X X
India X X X
Democratic People’s Republic of Korea X X
Indonesia X X
Iran (Islamic Republic of) X
Iraq X
Japan X
Kazakhstan X
Lao People’s Democratic Republic X X X
Malaysia X X
Myanmar X X X
Nepal X X
Pakistan X
Philippines X X
Sri Lanka X X X
Thailand X X X
Turkey X
viet Nam X X X
Total number of countries 20 14 9
Note: Countries selected for this study are marked in bold.
The second criterion considers countries characterized by intense seasonal precipitations that are essential for the creation of “seasonally flooded areas”. “Seasonally flooded areas” constitute important water resources for the maintenance of fisheries activities, as they directly support fish reproduction and fish population by enriching the river system of important dissolved nutrients (Welcomme, 1979b; Welcomme, 1999). In order to identify geographic areas affected by intense seasonal precipitation, a GIS analysis was carried out. Three climatic parameters related to the average monthly precipitation, the precipitation of the wettest quarter and the precipitation seasonality were extracted from the WorldClim Global Climate GIS Database 1950–2000 (Hijmans et al., 2005). A cluster analysis was also carried out on these three variables to identify areas characterized by significant higher values of these three climatic parameters and therefore expected to be exposed to intense seasonal precipitations. Based on this analysis, several countries in central and near-east Asia are excluded from the country selection, along with some African countries such as Egypt, Kenya, the Sudan and the United Republic of Tanzania that are not affected or only marginally affected by intense seasonal precipitations. The last adopted criterion

19Methodology
selects countries in Africa and Asia characterized by major river basin, possibly shared among different countries. This choice is aimed at verifying the ability of the indicator framework to differentiate among countries otherwise characterized by similar geographical and ecological features. Therefore, the selection includes countries sharing large river basins, such as the Niger, the Congo, the Zambezi and Volta Rivers in Africa, and the Mekong River and Ganges and Brahmaputra Rivers in Asia.
The final selection includes Benin, Cameroon, Chad, the Democratic Republic of the Congo, the Congo, Ghana, Malawi, Mali and Nigeria in Africa, and Bangladesh, Cambodia, China (mainland), India, the Lao People’s Democratic Republic, Myanmar, Sri Lanka, Thailand and Viet Nam in Asia (Table 1 and Table 2). However, in future it would be valuable to also apply the indicator-based framework to other countries to obtain a larger and more comprehensive world coverage.
3.2 ENvIRONMENTAL DIMENSION 3.2.1 Methodology used for the water availability indicatorsDefinition of “inland water area”“Inland water area” (km2) has been defined to include “permanent inland waters” and “seasonally flooded areas”. The underlying methodological assumption is that “seasonally flooded areas” include both the river open-water areas and their seasonal expansion in forming “seasonally flooded areas”. The area of “permanent inland waters” alone may largely underestimate the resulting “inland water area”, in particular in the countries with regular seasonal flooding and/or in river-rich countries.
The combined value of “permanent inland waters” and “seasonally flooded areas” theoretically could overestimate “inland water area” if the extent of rivers is accounted within each of the two subcomponents. However, testing of the indicator-based framework in the analysed countries has shown that this situation is unlikely to occur. The river network, often presented as the linear cartographic feature, is frequently excluded from land cover maps as well as by compiled statistics.
Distinction between inland and coastal watersAnother methodological assumption made in the compilation of the “inland water area” refers to the distinction between inland and coastal waters. Such distinction is cartographically difficult to delineate as there is a gradual transition of inland freshwater resources flowing in the coastal areas. The criterion that is adopted for this study considers coastal lagoons, deltas and estuaries as part of the “inland water area”, but excludes swampy coastal areas covered by mangroves. In fact, lagoons, deltas and estuaries can be considered part of the river network, while swampy coastal mangrove areas, growing in the intertidal zone and being above water at low tide and under water at high tide, usually mark the interface between the terrestrial and the marine environment (Di Gregorio, 2005).
This criterion has been useful for a practical distinction of inland and coastal waters. It excludes large stretches of coastal areas, which would have caused an overestimate of the “inland water area”. At the same time, if any portion of coastal mangrove areas is used for aquaculture purposes (Spalding, Kainuma and Collins, 2010), these specific areas are accounted for within the “aquaculture pond area”.
Use and comparison of multiple data sources The three guidelines used for the indicator compilation – the use of different data sources, the compilation at multiple scales (national versus regional/local) and the use of some estimates as baseline reference figures for indicator compilation – are very useful for compiling indicators of the environmental dimension. The comparison among data values reported by different data sources is facilitated by the fact that information, when available, is collected also on the single water subcomponents

Assessing water availability and economic, social and nutritional contributions from inland capture fisheries and aquaculture20
(i.e. area covered by lakes, rivers, reservoirs and permanent swamps). The breakdown has also facilitated the comparison of the water resources coverage provided by the different estimates available for “permanent inland waters” and to gain insight on the reasons for their potential divergence.
Information on the area of a few major waterbodies or major flooded areas at the regional or local level is also useful in understanding how comprehensive the available estimates are of the “permanent inland waters” and “seasonally flooded areas” at the national level.
For most analysed countries, GIS maps are available at low resolution and, consequently, they are only useful in establishing baseline reference figures for which the estimates of “permanent inland waters” and “seasonally flooded areas” at national level should be identified. When the GIS sources are available at high resolution, they have been used as the preferential data source for the compilation of indicators on water availability. The quality of the estimates of “permanent inland waters” is mostly determined by the availability of information on rivers that are usually represented both in GIS and non-GIS sources. The technical difficulties in assessing the extent of river networks in terms of water areas often resulted in an underestimation of the “permanent inland waters”.
Approach to identify values of water availability indicatorsA flexible approach has been used to identify the values of the water availability indicators depending on data availability and their quality.
The approach can be useful in avoiding errors, which would occur if a given data source for indicator compilation is a priori selected. For example, the areas of rivers and “seasonally flooded areas” are often not well represented in FAOSTAT data and low resolution GIS maps. Using them as reference data sources for “permanent inland waters” would cause possible underestimation for river-rich countries and for countries with regular occurrence of seasonal flooding. Low resolution GIS sources tend to cause an underestimate of the flooded areas due to the map resolution, but in some cases the low resolution can also determine an overestimate of flooded areas when flooded areas are identified by large polygons drawn with low accuracy. For this reason, to estimate “seasonally flooded areas” at the national level, it is particularly useful to have baseline reference figures at the subnational level of the major flooded regions in the analysed country.
3.2.2 Major achievements in developing water availability indicatorsThe compilation of the “inland water area” indicator constitutes a first assessment of available information on water availability in the analysed countries. The reliability of the estimate of “permanent inland waters” could be further improved with a more comprehensive inventory of lakes, reservoirs, coastal lagoons, rivers and permanent swamps and their sizes.
During the compilation of the “inland water area” indicator for different countries, it became evident that the figures reported in the FAOSTAT country-level database21 and CIA World Factbook22 tend to account only for large lakes and reservoirs. The estimate of “inland water area” of the analysed countries is always significantly larger than the estimate reported in the FAOSTAT country-level database and CIA World Factbook. The discrepancy is also due to the fact that this study makes a more comprehensive assessment of the “permanent inland waters”, which includes an assessment of “seasonally flooded areas” in the estimate of the “inland water area”.
21 FAO FAOSTAT Web site section Input-inland waters (http://faostat3.fao.org/home/E).22 See www.cia.gov/library/publications/the-world-factbook.
21Methodology
The choice of including “seasonally flooded areas” within the “inland water area” determines that the overall water resources estimated by the “inland water area” are not all available on a year-round basis. However, since the aim of compiling information on water availability is to refer it to the inland fisheries sector, considering the “seasonally flooded areas” within the “inland water area” is important besides this temporal misalignment. In fact, statistics on fishing activities generally refer to the whole year, and thus include fish caught during the dry and the wet season, when fishing activities operate predominately on “permanent inland waters” and “seasonally flooded areas”, respectively.
Another important outcome of this study is the compilation of the “inland water area and aquaculture pond area” indicator. This indicator provides a combined measurement of water areas important for both inland capture fisheries and aquaculture. Assessing the overall extent of “inland water area and aquaculture pond area” is extremely important given that other statistics (e.g. “inland fish production”) do not allow a clear separation between capture fisheries and aquaculture activities.
3.2.3 Relevant issues not accounted for by the current compilation of water availability indicatorsThe water availability indicators could be improved with increased data availability on the area of “permanent inland waters” and “seasonally flooded areas” and their monitoring over time. Currently, the available information used to compile the “inland water area” indicator is too scarce to temporally align data. Available information on “permanent inland waters” and “seasonally flooded areas” is often not clearly associated with a given year. Information on water seasonality in also scarce. In several countries, some information is available for the seasonal variation of “seasonally flooded areas”, but very little information is available on the long-term variation of “permanent inland waters”. A further development of these indicators would be extremely valuable to show if water seasonality is affected by increased climate variability and climate change and, consequently, to point out increased vulnerability of the inland fisheries sector.
The analysis on the water areas associated with fish-rice culture requires further information. The attempt to collect information on deep-water rice cultivation and lowland rice cultivation revealed that the information available is not suitable for estimating the extent of fish-rice culture. In fact, there is a huge gap between the “deep-water rice cultivation area” and the “lowland rice cultivation area” (FAO, 2016a); therefore, it would be difficult to derive even extremely rough estimates of fish-rice culture within such a wide value range.
Water quality and water connectivity are the important issues that this study has not addressed. Key parameters such as oxygen, PH, ammonia, carbon dioxide, nitrates, phosphates and suspended sediments determine the quality and suitability of water for fish life and, consequently, the sustainability for fishing and aquaculture activities (Meaden and Kapensky, 1991). A national-level assessment of water quality requires a more rigorous sampling design given that these parameters are likely to fluctuate over time and space and that there is a methodological challenge in scaling up information from the local level to the national level. Further development of indicators related to water quality and water connectivity is expected to complement the current indicator-based framework.
3.3 ECONOMIC DIMENSION3.3.1 Methodology used in the economic indicatorsDefinition of “inland fish production”This study defines “inland fish production” to include the contributions of both the inland capture fisheries and the non-marine aquaculture. There are several reasons underlying this choice. Indicators of “inland fish production” in terms of quantity

Assessing water availability and economic, social and nutritional contributions from inland capture fisheries and aquaculture22
(tonnes) and value in United States dollars can monitor the status and trends in the fisheries sector at the national level. Inland capture fisheries and aquaculture are very different in many aspects, and they often are considered separate activities (Bostock et al., 2010). On the contrary, there are a number of important system linkages that connect these two forms of aquatic production (Bostock et al., 2010; De Silva et al., 2003). Household surveys might not adequately distinguish fish production from fishing activities and cage aquaculture occurring in the same water area (Gee and Tsuji, 2015). In addition, aquaculture can also be used to provide fingerlings for restocking fishing areas; the resulting enhanced fisheries should be recorded as capture fisheries, but is often reported as aquaculture (Welcomme and Lymer, 2012). Furthermore, there is no way to separate the origins of capture fisheries and aquaculture at market and consequently at the consumption level. Therefore, combining them together provides an overarching and robust assessment of the inland fisheries sector, in particular for the use of cross-sectoral comparison.
This study seeks to obtain a combined indicator for “inland fish production” as a whole, but also examines, for analytical purposes, the contributions made respectively by inland capture fisheries and aquaculture.
Cage aquaculture assessment Cage aquaculture is usually characterized by intensive farming and therefore can influence the value of the “fish-water productivity – quantity” indicator. Currently, the compilation of the “fish-water productivity – quantity” indicator considers the whole “inland fish production” divided by the “inland water area and aquaculture pond area”, but this ratio does not take into account in the denominator the area occupied by cages, as there is no cage inventory available at the country level for the selected countries (FAO, 2016a).
Nevertheless, the compiled value “fish-water productivity – quantity” indicator is unlikely to be affected by this data gap since the “inland water area” is disproportionately larger than the area occupied by aquaculture cages.
The “fish-water productivity − quantity” indicator is one of the indicators in the framework showing major discrepancies between the two subcomponents related to inland capture fisheries and aquaculture. Therefore, the data user might be interested in compiling the indicator separately for inland capture fisheries and aquaculture. In this situation, when a country has an extensive cage culture, it is critical to assess if cage culture is recorded within aquaculture production statistics or erroneously clumped with the inland capture fisheries statistics. In the first case, the subcomponent of the “fish-water productivity – quantity” indicator related to aquaculture is expected to be significantly larger than the subcomponent of the “fish-water productivity – quantity” indicator related to inland capture fisheries production. In the second case, the “fish-water productivity – quantity” indicator related to aquaculture will be underestimated, while the “fish-water productivity – quantity” indicator related to inland capture fisheries will be inflated.
In the lack of information and how cage production is accounted for within national statistics and cage inventories, the “fish water productivity – quantity” related to the whole “inland fish production” will be more robust and comparable across countries than are separate values of fish-water productivity for capture fisheries and aquaculture activities.
Criteria to identify fish prices There are some technical difficulties and major data gaps in conducting a comprehensive assessment of the “inland fish production – value”. Many factors influence fish prices, including fish species, size, freshness of and types of processing as well as the season and market location. Price variations also occur between captured and farmed, and between fish mainly used for household consumption and fish sold to business facilities.

23Methodology
A major effort of data compilation has been placed in figuring out indicative fish unit prices that could be used to make a coarse assessment of “inland fish production – value”.
Information has been collected on the price of fresh fish (not processed) recorded at landings for inland fisheries and the farmgate price for aquaculture production (i.e. producer prices). Prices have been compiled at the level of species group, such as freshwater and diadromous fish species, crustaceans, molluscs and other aquatic animals, as well as at the level of species when available.
When prices are attributed to the species group level, they attempt to reflect the price variability by species within the group. In particular, it is important to ensure that the price of the species group reflects the overall species composition of fish production, and to avoid situations in which identified unit price is dominated by either only high-value species or only low-value species.
In order to determine baseline fish prices per species or species group, it is useful to collect information also on market and export prices as well as the prices of processed products (e.g. dry, smoked or salted fish). In fact, fresh fish prices are expected to be lower than the prices of processed fish, and first-sale or farmgate prices are expected to be lower than prices found further along the supply market chain.
Use and comparison of multiple data sourcesIn the compilation of the economic indicator, it is particularly useful to have information on fish production at multiple scales (national versus regional or local). In particular, the information collected about fish production from the major inland fishing areas in the country has been used to set some baseline reference figures against which to compare the available information on national estimates of inland capture fisheries production.
National statistics of fish catch should be based on the recording of fish landings from all fishing areas in the country. However, in some cases, the data collection on the indicator compilation suggested that national statistics are comprehensive only on the reported landings from a few major fishing areas. Similarly for aquaculture production, in a few cases obtaining data on fish production from the major commercial aquaculture enterprises in the country revealed that national statistics did not include aquaculture production from other traditional farming practices (FAO, 2016a).
Therefore, having information on fish production at the regional or local scale was useful in highlighting a likely underestimation in the national official statistics.
Approach to identify values for economic indicatorsOfficial estimates used in the compilation of the “inland fish production” indicators are computed as five-year averages of the values yearly reported by official statistics. This approach has been previously used and recommended (FAO, 2011b; Grainger and Garcia, 1996). The approach is successful: (i) to avoid that an indicator value could be biased by an atypical figure referred to a particular year; (ii) to smooth out short-term fluctuations and highlight longer-term trends; and (iii) to allow a data search on fish prices in a wider temporal window (2008–2012).
The second approach adopted in the compilation of “inland fish production – value” is to use a range of prices reflecting a great variability in the prices reported by different sources. This solution can be useful because it provides the data user with all the available information as well as the divergence of estimates and level of uncertainty around the indicator value. It should be noted that the choice of a particular range of prices (US$/kg) affects the range of values reported by the “inland fish production – value”, but also by the “aquaculture contribution to inland fish production” and the “fish-water productivity – value” indicators.
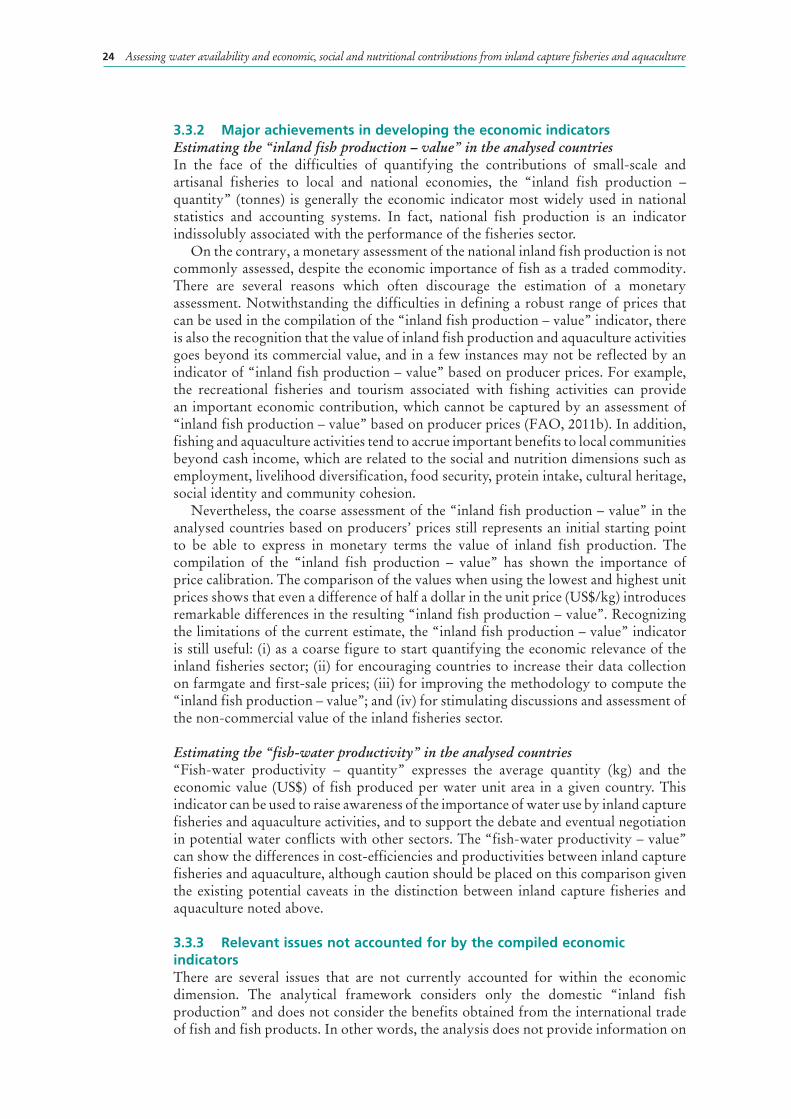
Assessing water availability and economic, social and nutritional contributions from inland capture fisheries and aquaculture24
3.3.2 Major achievements in developing the economic indicatorsEstimating the “inland fish production – value” in the analysed countriesIn the face of the difficulties of quantifying the contributions of small-scale and artisanal fisheries to local and national economies, the “inland fish production – quantity” (tonnes) is generally the economic indicator most widely used in national statistics and accounting systems. In fact, national fish production is an indicator indissolubly associated with the performance of the fisheries sector.
On the contrary, a monetary assessment of the national inland fish production is not commonly assessed, despite the economic importance of fish as a traded commodity. There are several reasons which often discourage the estimation of a monetary assessment. Notwithstanding the difficulties in defining a robust range of prices that can be used in the compilation of the “inland fish production – value” indicator, there is also the recognition that the value of inland fish production and aquaculture activities goes beyond its commercial value, and in a few instances may not be reflected by an indicator of “inland fish production – value” based on producer prices. For example, the recreational fisheries and tourism associated with fishing activities can provide an important economic contribution, which cannot be captured by an assessment of “inland fish production – value” based on producer prices (FAO, 2011b). In addition, fishing and aquaculture activities tend to accrue important benefits to local communities beyond cash income, which are related to the social and nutrition dimensions such as employment, livelihood diversification, food security, protein intake, cultural heritage, social identity and community cohesion.
Nevertheless, the coarse assessment of the “inland fish production – value” in the analysed countries based on producers’ prices still represents an initial starting point to be able to express in monetary terms the value of inland fish production. The compilation of the “inland fish production – value” has shown the importance of price calibration. The comparison of the values when using the lowest and highest unit prices shows that even a difference of half a dollar in the unit price (US$/kg) introduces remarkable differences in the resulting “inland fish production – value”. Recognizing the limitations of the current estimate, the “inland fish production – value” indicator is still useful: (i) as a coarse figure to start quantifying the economic relevance of the inland fisheries sector; (ii) for encouraging countries to increase their data collection on farmgate and first-sale prices; (iii) for improving the methodology to compute the “inland fish production – value”; and (iv) for stimulating discussions and assessment of the non-commercial value of the inland fisheries sector.
Estimating the “fish-water productivity” in the analysed countries“Fish-water productivity – quantity” expresses the average quantity (kg) and the economic value (US$) of fish produced per water unit area in a given country. This indicator can be used to raise awareness of the importance of water use by inland capture fisheries and aquaculture activities, and to support the debate and eventual negotiation in potential water conflicts with other sectors. The “fish-water productivity – value” can show the differences in cost-efficiencies and productivities between inland capture fisheries and aquaculture, although caution should be placed on this comparison given the existing potential caveats in the distinction between inland capture fisheries and aquaculture noted above.
3.3.3 Relevant issues not accounted for by the compiled economic indicatorsThere are several issues that are not currently accounted for within the economic dimension. The analytical framework considers only the domestic “inland fish production” and does not consider the benefits obtained from the international trade of fish and fish products. In other words, the analysis does not provide information on
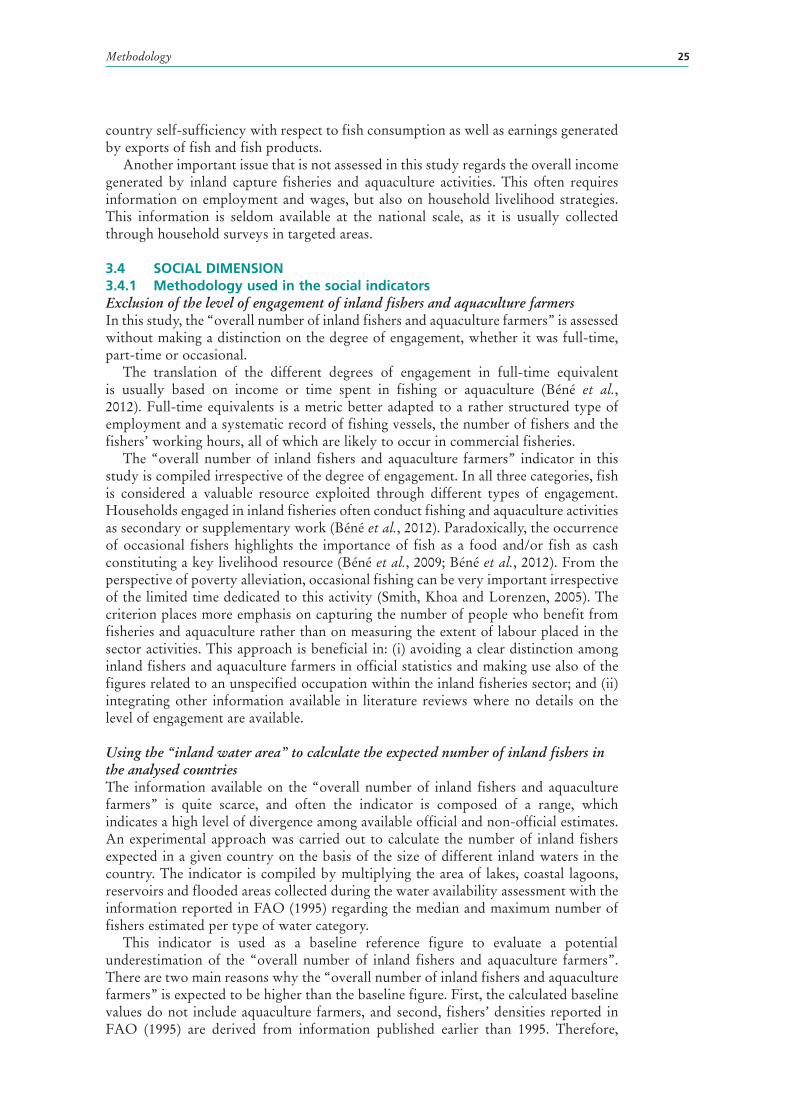
25Methodology
country self-sufficiency with respect to fish consumption as well as earnings generated by exports of fish and fish products.
Another important issue that is not assessed in this study regards the overall income generated by inland capture fisheries and aquaculture activities. This often requires information on employment and wages, but also on household livelihood strategies. This information is seldom available at the national scale, as it is usually collected through household surveys in targeted areas.
3.4 SOCIAL DIMENSION3.4.1 Methodology used in the social indicatorsExclusion of the level of engagement of inland fishers and aquaculture farmersIn this study, the “overall number of inland fishers and aquaculture farmers” is assessed without making a distinction on the degree of engagement, whether it was full-time, part-time or occasional.
The translation of the different degrees of engagement in full-time equivalent is usually based on income or time spent in fishing or aquaculture (Béné et al., 2012). Full-time equivalents is a metric better adapted to a rather structured type of employment and a systematic record of fishing vessels, the number of fishers and the fishers’ working hours, all of which are likely to occur in commercial fisheries.
The “overall number of inland fishers and aquaculture farmers” indicator in this study is compiled irrespective of the degree of engagement. In all three categories, fish is considered a valuable resource exploited through different types of engagement. Households engaged in inland fisheries often conduct fishing and aquaculture activities as secondary or supplementary work (Béné et al., 2012). Paradoxically, the occurrence of occasional fishers highlights the importance of fish as a food and/or fish as cash constituting a key livelihood resource (Béné et al., 2009; Béné et al., 2012). From the perspective of poverty alleviation, occasional fishing can be very important irrespective of the limited time dedicated to this activity (Smith, Khoa and Lorenzen, 2005). The criterion places more emphasis on capturing the number of people who benefit from fisheries and aquaculture rather than on measuring the extent of labour placed in the sector activities. This approach is beneficial in: (i) avoiding a clear distinction among inland fishers and aquaculture farmers in official statistics and making use also of the figures related to an unspecified occupation within the inland fisheries sector; and (ii) integrating other information available in literature reviews where no details on the level of engagement are available.
Using the “inland water area” to calculate the expected number of inland fishers in the analysed countriesThe information available on the “overall number of inland fishers and aquaculture farmers” is quite scarce, and often the indicator is composed of a range, which indicates a high level of divergence among available official and non-official estimates. An experimental approach was carried out to calculate the number of inland fishers expected in a given country on the basis of the size of different inland waters in the country. The indicator is compiled by multiplying the area of lakes, coastal lagoons, reservoirs and flooded areas collected during the water availability assessment with the information reported in FAO (1995) regarding the median and maximum number of fishers estimated per type of water category.
This indicator is used as a baseline reference figure to evaluate a potential underestimation of the “overall number of inland fishers and aquaculture farmers”. There are two main reasons why the “overall number of inland fishers and aquaculture farmers” is expected to be higher than the baseline figure. First, the calculated baseline values do not include aquaculture farmers, and second, fishers’ densities reported in FAO (1995) are derived from information published earlier than 1995. Therefore,
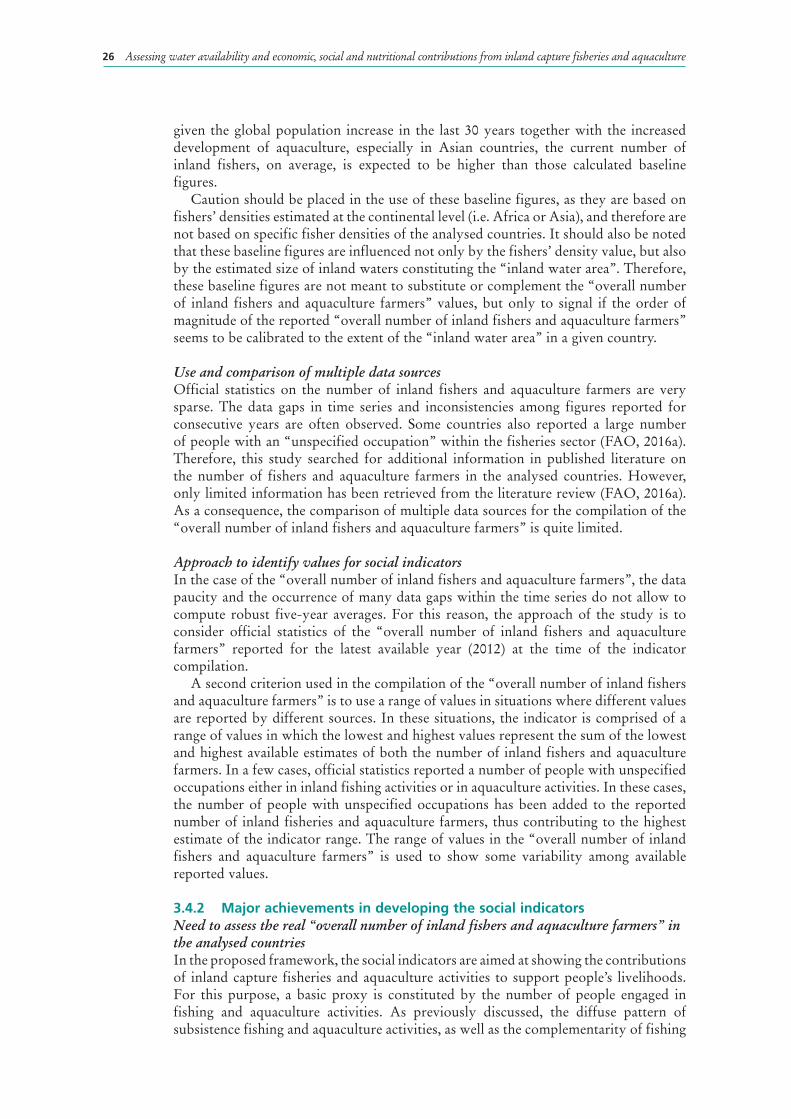
Assessing water availability and economic, social and nutritional contributions from inland capture fisheries and aquaculture26
given the global population increase in the last 30 years together with the increased development of aquaculture, especially in Asian countries, the current number of inland fishers, on average, is expected to be higher than those calculated baseline figures.
Caution should be placed in the use of these baseline figures, as they are based on fishers’ densities estimated at the continental level (i.e. Africa or Asia), and therefore are not based on specific fisher densities of the analysed countries. It should also be noted that these baseline figures are influenced not only by the fishers’ density value, but also by the estimated size of inland waters constituting the “inland water area”. Therefore, these baseline figures are not meant to substitute or complement the “overall number of inland fishers and aquaculture farmers” values, but only to signal if the order of magnitude of the reported “overall number of inland fishers and aquaculture farmers” seems to be calibrated to the extent of the “inland water area” in a given country.
Use and comparison of multiple data sourcesOfficial statistics on the number of inland fishers and aquaculture farmers are very sparse. The data gaps in time series and inconsistencies among figures reported for consecutive years are often observed. Some countries also reported a large number of people with an “unspecified occupation” within the fisheries sector (FAO, 2016a). Therefore, this study searched for additional information in published literature on the number of fishers and aquaculture farmers in the analysed countries. However, only limited information has been retrieved from the literature review (FAO, 2016a). As a consequence, the comparison of multiple data sources for the compilation of the “overall number of inland fishers and aquaculture farmers” is quite limited.
Approach to identify values for social indicatorsIn the case of the “overall number of inland fishers and aquaculture farmers”, the data paucity and the occurrence of many data gaps within the time series do not allow to compute robust five-year averages. For this reason, the approach of the study is to consider official statistics of the “overall number of inland fishers and aquaculture farmers” reported for the latest available year (2012) at the time of the indicator compilation.
A second criterion used in the compilation of the “overall number of inland fishers and aquaculture farmers” is to use a range of values in situations where different values are reported by different sources. In these situations, the indicator is comprised of a range of values in which the lowest and highest values represent the sum of the lowest and highest available estimates of both the number of inland fishers and aquaculture farmers. In a few cases, official statistics reported a number of people with unspecified occupations either in inland fishing activities or in aquaculture activities. In these cases, the number of people with unspecified occupations has been added to the reported number of inland fisheries and aquaculture farmers, thus contributing to the highest estimate of the indicator range. The range of values in the “overall number of inland fishers and aquaculture farmers” is used to show some variability among available reported values.
3.4.2 Major achievements in developing the social indicatorsNeed to assess the real “overall number of inland fishers and aquaculture farmers” in the analysed countriesIn the proposed framework, the social indicators are aimed at showing the contributions of inland capture fisheries and aquaculture activities to support people’s livelihoods. For this purpose, a basic proxy is constituted by the number of people engaged in fishing and aquaculture activities. As previously discussed, the diffuse pattern of subsistence fishing and aquaculture activities, as well as the complementarity of fishing

27Methodology
and aquaculture with other activities, often causes poor data coverage in official national statistics. Therefore, this study points out the urgent need to strengthen the capacity in the analysed countries of using censuses in agriculture, population censuses and other national survey programmes that include screening questions related to household members engaged in fishing, aquaculture and post-harvest activities (Gee and Tsuji, 2015). The occurrence of such data gaps is highly detrimental and can have serious social consequences. Often policy-makers do not have adequate and accurate information on the number of people relying on fishing and aquaculture activities for their livelihood (Gee and Tsuji, 2015). Consequently, adequate measures might not be allocated to the inland fisheries sector or might be diverted to other more conspicuous economic sectors. The “overall number of inland fishers and aquaculture farmers” constitutes basic information to assess the consequences of any national policy affecting the inland fisheries sector whether directly or indirectly.
Estimate of the “average density of overall inland fishers and aquaculture farmers” in the analysed countriesFreshwater and brackish surface waters are vital natural resources for the livelihoods of many rural communities, whose livelihoods are supported by fishing or aquaculture activities. Freshwater and brackish-water resources are often easily accessible and require relatively few assets to be exploited. Providing an estimate of the “average density of overall inland fishers and aquaculture farmers” measures, on average, how many people per square kilometre of available water resources rely on fishing and aquaculture activities. This national-level indicator is not intended to describe local densities, which are likely to be affected by high spatial variability, but to show the contribution that the inland fisheries sector provides in terms of employment and livelihoods. It also gives a coarse assessment on how many people in a country can be directly affected by a decrease of water resources available to the inland fisheries sector.
3.4.3 Relevant issues not accounted for by the compiled social indicatorsSeveral issues are not accounted for by the compiled social indicators, such as the secondary employment in the inland fisheries sector and the gender issues in primary and secondary employment.
Post-harvest handling and processing of fish and fish products are an important source of secondary employment provided by the inland fisheries sector, for which statistics are less likely to be available as they are usually not routinely maintained by fisheries authorities (Halls et al., 2005). This is a feature for which greater consideration and increased data collection should be allocated. Employment in primary and secondary activities is often used to assess the contribution to the national economy made by different sectors; thus, the role of the fisheries sector should be fully represented with the contributions of both primary and secondary employment.
Another relevant social feature is related to the gender dimension of fishing and aquaculture activities. Although the fisheries sector has long been considered a male domain, women often have an important role in pre- and post-harvest activities as well as in trading fish and fish products (Weeratunge and Snyder, 2010), and they can also play an active role in fishing and aquaculture production (FAO, 2011c; Smith, Khoa and Lorenzen, 2005). Gender disaggregated data are not routinely collected and, consequently, key gender issues related to the primary and secondary fishery sectors are often inadequately reflected by indicator frameworks (FAO, 2011c; de Pryck, 2013). However, this is a priority for further refinement of the present set of indicators, given that current disparities between women and men engaged in fishing and aquaculture activities are likely to be exacerbated by increased household vulnerability because of climate change (Brody, Demetraides, and Esplen, 2008; UNPF and WEDO, 2008).
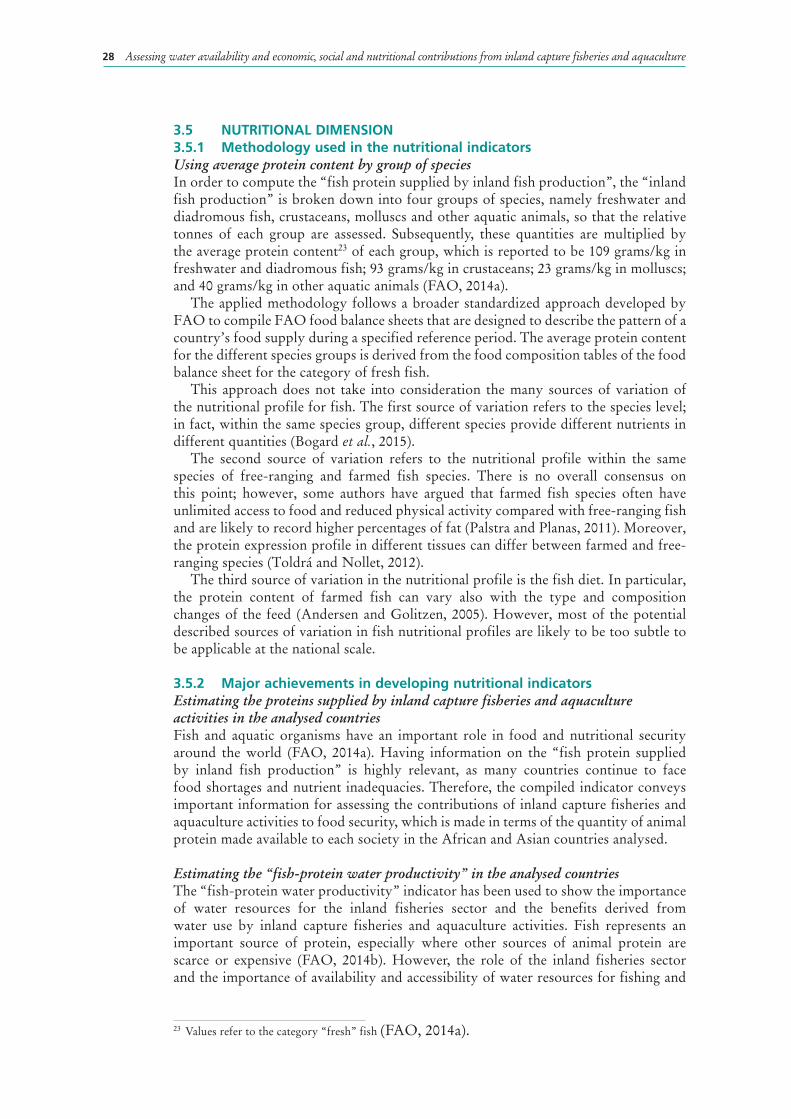
Assessing water availability and economic, social and nutritional contributions from inland capture fisheries and aquaculture28
3.5 NUTRITIONAL DIMENSION3.5.1 Methodology used in the nutritional indicatorsUsing average protein content by group of species In order to compute the “fish protein supplied by inland fish production”, the “inland fish production” is broken down into four groups of species, namely freshwater and diadromous fish, crustaceans, molluscs and other aquatic animals, so that the relative tonnes of each group are assessed. Subsequently, these quantities are multiplied by the average protein content23 of each group, which is reported to be 109 grams/kg in freshwater and diadromous fish; 93 grams/kg in crustaceans; 23 grams/kg in molluscs; and 40 grams/kg in other aquatic animals (FAO, 2014a).
The applied methodology follows a broader standardized approach developed by FAO to compile FAO food balance sheets that are designed to describe the pattern of a country’s food supply during a specified reference period. The average protein content for the different species groups is derived from the food composition tables of the food balance sheet for the category of fresh fish.
This approach does not take into consideration the many sources of variation of the nutritional profile for fish. The first source of variation refers to the species level; in fact, within the same species group, different species provide different nutrients in different quantities (Bogard et al., 2015).
The second source of variation refers to the nutritional profile within the same species of free-ranging and farmed fish species. There is no overall consensus on this point; however, some authors have argued that farmed fish species often have unlimited access to food and reduced physical activity compared with free-ranging fish and are likely to record higher percentages of fat (Palstra and Planas, 2011). Moreover, the protein expression profile in different tissues can differ between farmed and free-ranging species (Toldrá and Nollet, 2012).
The third source of variation in the nutritional profile is the fish diet. In particular, the protein content of farmed fish can vary also with the type and composition changes of the feed (Andersen and Golitzen, 2005). However, most of the potential described sources of variation in fish nutritional profiles are likely to be too subtle to be applicable at the national scale.
3.5.2 Major achievements in developing nutritional indicatorsEstimating the proteins supplied by inland capture fisheries and aquaculture activities in the analysed countriesFish and aquatic organisms have an important role in food and nutritional security around the world (FAO, 2014a). Having information on the “fish protein supplied by inland fish production” is highly relevant, as many countries continue to face food shortages and nutrient inadequacies. Therefore, the compiled indicator conveys important information for assessing the contributions of inland capture fisheries and aquaculture activities to food security, which is made in terms of the quantity of animal protein made available to each society in the African and Asian countries analysed.
Estimating the “fish-protein water productivity” in the analysed countriesThe “fish-protein water productivity” indicator has been used to show the importance of water resources for the inland fisheries sector and the benefits derived from water use by inland capture fisheries and aquaculture activities. Fish represents an important source of protein, especially where other sources of animal protein are scarce or expensive (FAO, 2014b). However, the role of the inland fisheries sector and the importance of availability and accessibility of water resources for fishing and
23 Values refer to the category “fresh” fish (FAO, 2014a).
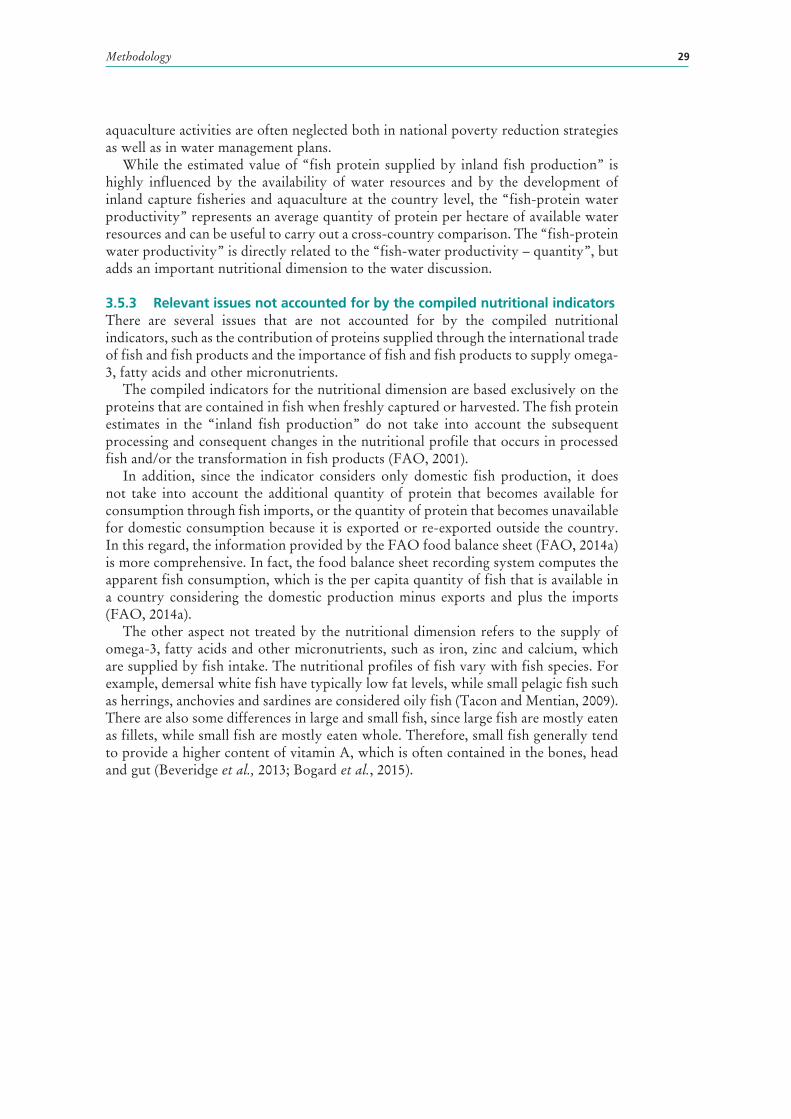
29Methodology
aquaculture activities are often neglected both in national poverty reduction strategies as well as in water management plans.
While the estimated value of “fish protein supplied by inland fish production” is highly influenced by the availability of water resources and by the development of inland capture fisheries and aquaculture at the country level, the “fish-protein water productivity” represents an average quantity of protein per hectare of available water resources and can be useful to carry out a cross-country comparison. The “fish-protein water productivity” is directly related to the “fish-water productivity – quantity”, but adds an important nutritional dimension to the water discussion.
3.5.3 Relevant issues not accounted for by the compiled nutritional indicatorsThere are several issues that are not accounted for by the compiled nutritional indicators, such as the contribution of proteins supplied through the international trade of fish and fish products and the importance of fish and fish products to supply omega-3, fatty acids and other micronutrients.
The compiled indicators for the nutritional dimension are based exclusively on the proteins that are contained in fish when freshly captured or harvested. The fish protein estimates in the “inland fish production” do not take into account the subsequent processing and consequent changes in the nutritional profile that occurs in processed fish and/or the transformation in fish products (FAO, 2001).
In addition, since the indicator considers only domestic fish production, it does not take into account the additional quantity of protein that becomes available for consumption through fish imports, or the quantity of protein that becomes unavailable for domestic consumption because it is exported or re-exported outside the country. In this regard, the information provided by the FAO food balance sheet (FAO, 2014a) is more comprehensive. In fact, the food balance sheet recording system computes the apparent fish consumption, which is the per capita quantity of fish that is available in a country considering the domestic production minus exports and plus the imports (FAO, 2014a).
The other aspect not treated by the nutritional dimension refers to the supply of omega-3, fatty acids and other micronutrients, such as iron, zinc and calcium, which are supplied by fish intake. The nutritional profiles of fish vary with fish species. For example, demersal white fish have typically low fat levels, while small pelagic fish such as herrings, anchovies and sardines are considered oily fish (Tacon and Mentian, 2009). There are also some differences in large and small fish, since large fish are mostly eaten as fillets, while small fish are mostly eaten whole. Therefore, small fish generally tend to provide a higher content of vitamin A, which is often contained in the bones, head and gut (Beveridge et al., 2013; Bogard et al., 2015).


31
4. Implementation
4.1 IMPLEMENTATION OF COMPILED INDICATORS FOR AFRICAN COUNTRIES4.1.1 Overview of the water availability indicators in nine African countriesIn the African countries, the value of the “inland water area” indicator varies by several orders of magnitude (Figure 2). The country with the most prominent value of “inland water area” is the Democratic Republic of the Congo. This country shares with the Congo the vast Congo River Basin, which is characterized by an impressive network of tributaries of the Congo River and the associated large flooded areas. Chad is another country that shows a high value of the “inland water area” indicator. The estimate of the “inland water area” in Chad includes an updated figure of the current area of Lake Chad, but has no updated information on the current extent of “seasonally flooded areas”. Because reduced precipitations and river runoffs have caused a severe reduction of the lake, a similar contraction is likely to have occurred in the associated “seasonally flooded areas”. Therefore, the current value of the “inland water area” assessed for Chad could be overestimating the real area of surface waters in the country. Nigeria is also characterized by the occurrence of Lake Chad, but what mainly influences the value of the “inland water area” indicator are the several flooded areas reported in the country, especially around the delta of the Niger River. The countries with the lowest values of the “inland water area” are Benin, Cameroon and Ghana. These countries have very limited information available on the water area occupied by the river network (FAO, 2016a). However, the compiled values of the “inland water area” also include “seasonally flooded areas”, which should partially compensate for this data gap.
A second indicator, the “percentage of inland water over country area”, is useful for comparing the relative importance of “inland water area” across countries (Figure 3). Country size varies greatly among the nine analysed African countries. Benin and Malawi are the countries with the smallest country area of about 110 000–120 000 km2
(United Nations, 2011).The country areas of Ghana, the Congo and Cameroon are approximately two,
three and four times that of Benin and Malawi. In the Niger River Basin, Nigeria, Chad and Mali have a country size between 9 and 11 times that of Benin and Malawi. The largest country is the Democratic Republic of the Congo with the size of over 2 million km2, about 21 times larger than that of Benin (United Nations, 2011). The
FIGURE 2 “Inland water area” in nine African countries
0
100
200
300
400
Benin Cameroon Chad Congo Democratic Republic of the Congo
Ghana Malawi Mali Nigeria
Thousand km2
Available estimate

Assessing water availability and economic, social and nutritional contributions from inland capture fisheries and aquaculture32
“percentage of inland water over country area” indicates a strikingly different picture on the importance of inland waters from that shown by the “inland water area” indicator (Figure 2). Malawi, despite its smallest country area, shows the highest “percentage of inland water over country area” among the analysed countries. On the other hand, in the Democratic Republic of the Congo, the high value represented by the “inland water area” becomes less outstanding when considering its huge territory size, though still indicating a country rich in water resources.
The low values of the “percentage of inland water over country area” of Cameroon and Mali are expected because of the arid and semi-arid areas in the northern parts of these countries. Benin shows the lowest value of the “percentage of inland water over country area” among the nine African countries examined, which is likely to be affected by an underestimation of the “inland water area” related to the river network (FAO, 2016a).
A third indicator of water availability is the “percentage of permanent inland water over inland water area”. High values of this indicator are determined by a predominance of “permanent inland waters”, which are expected to function as water storage systems and thus to provide more resilience to climate change. On the contrary, low values in this indicator are determined by a predominance of “seasonally flooded areas”, on which the effects of increased temperatures and variation in rainfall patterns can be more marked, indicating a potential higher vulnerability to climate change (FAO, 2007).
Among the analysed African countries, the highest value of this indicator is recorded in Malawi (Figure 4) where Lake Malawi, with an extent of over 24 000 km2, is considered the country’s most prominent physical feature. Ghana is also characterized by the occurrence of Lake Volta, which is the largest artificial lake in the world with a surface area of over 3 000 km2. The lowest value of “percentage of permanent inland water over inland water area” is recorded in Chad. This value reflects the shrinking of Lake Chad (Nwafili and Gao, 2007), whose open waters in 2013 appeared to be shared between Cameroon and Nigeria on the basis of a Land Remote-Sensing Satellite (Landsat) composite image (FAO, 2016a). Mali is reported to have over 100 lakes and is also crossed by the Niger River, which is considered the lifeline for large parts of the Sahelian region. However, the “percentage of permanent inland water over inland water area” is relatively low because of the occurrence of the Inner Niger Delta, a vast seasonal floodplain that becomes flooded by the Niger River during the wet season. A similar pattern is found in the Democratic Republic of the Congo, which is characterized by large areas of transboundary lakes as well as by seasonally flooded areas in the Congo River Basin. This explains the highest “percentage of permanent inland water over inland water area” recorded in the Democratic Republic of the Congo compared with the Congo. Since the “inland water area” includes both
FIGURE 3“Percentage of inland water over country area” in nine African countries
0
10
20
30
40
Benin Cameroon Chad Congo Democratic Republic of the Congo
Ghana Malawi Mali Nigeria
Percentage
Available estimate

33Implementation
freshwater and brackish-water areas, the occurrence of wide coastal lagoons determines the relatively high “percentage of permanent inland water over inland water area” of Benin, as well as Cameroon and Nigeria.
A fourth indicator is the “inland water area and aquaculture pond area”. However, in the nine analysed African countries, information on the “aquaculture pond area” is often scarce. Therefore, the “inland water area and aquaculture pond area” indicator (Figure 5) greatly overlaps with the “inland water area” indicator (Figure 2). This is partly due to the lack of information on the extent of aquaculture ponds and partly due to the dominance of small ponds that have negligible effects on the compilation of the “inland water area and aquaculture pond area”. The lack of information is often caused by the occurrence of subsistence and small-scale aquaculture, which would require a systematic inventory of aquaculture facilities at the household level (Halwart, Funge-Smith and Moehl, 2003). In addition, in several analysed African countries, the number of active, inactive and rehabilitated aquaculture ponds has fluctuated over time according to the investment funds in place and the overall political and economic situation (Balarin, 1985; Toguyen, 2004).
In Benin, Cameroon, the Democratic Republic of the Congo and Mali, there are traditional aquaculture systems called “whedos”24 or “mares”25, which consist of ditch-like depressions in connection to the river network that are seasonally flooded and remain filled with water when the flooded area recedes.
24 Whedos are ditch-like ponds that are found in connection to the river network where fingerlings are trapped, raised and then harvested (Hauber, Bierbach and Linsenmair, 2011).
25 Mares are seasonally flooded depressions that remain filled with water also during the dry season when the flooded areas recede (Russell et al., 2010).
FIGURE 4“Percentage of permanent inland water over inland water area” in nine African countries
0
25
50
75
100
Benin Cameroon Chad Congo Democratic Republic of the Congo
Ghana Malawi Mali Nigeria
Percentage
Available estimate
FIGURE 5“Inland water area and aquaculture pond area” in nine African countries
0
100
200
300
400
Benin Cameroon Chad Congo Democratic Republic of the Congo
Ghana Malawi Mali Nigeria
Thousand km2
Available estimate

Assessing water availability and economic, social and nutritional contributions from inland capture fisheries and aquaculture34
In the approach used in this study, the areas occupied by whedos and mares are assumed to be covered by the “seasonally flooded areas”. Another traditional aquaculture method called “acadjas”26 uses poles and branches to create enclosures in lakes and lagoons where fish are raised. This aquaculture system is in fact an artisanal cage culture; however, the areas covered by acadjas are unlikely to be recorded as water areas used for aquaculture production. Therefore, a joint assessment of “inland water area and aquaculture pond area” is expected to be more robust in representing the water resources available to the whole inland fisheries sector.
4.1.2 Overview of the economic indicators in nine African countriesThe basic economic indicator is the “inland fish production – quantity”, which includes both the average “national inland capture fisheries production” and the average “national non-marine aquaculture production” recorded between 2008 and 2012.
For most analysed African countries, the “inland fish production – quantity” indicator (Figure 6) is constituted by a single value based on official national statistics. In the case of Mali and Ghana, non-official estimates of inland capture fisheries production are available in addition to official statistics. Therefore, in these two countries, “inland fish production – quantity” is constituted by a range of values.
Nigeria has substantial aquaculture production, which is consistent with the high value of the “inland fish production – quantity”, while in the other analysed countries the values of this indicator are substantially driven by the inland capture fisheries production.
Each analysed country is characterized by the occurrence of major fishing areas, which often represents a considerable share of the overall “inland fish production – quantity”. Examples include the coastal lagoons and Lake Nokué in Benin, Lake Volta in Ghana, the Waza-Logone flooded areas and Lake Chad in Cameroon, the Inner Niger Delta in Mali, and the four major waterbodies (Lake Malawi, Lake Malombe, Lake Chilwa and Lake Chiuta) and the flooded areas of the Shire River in Malawi (FAO, 2016a).
Another relevant economic indicator is the “inland fish production – value”, which estimates the value of the “inland fish production” based on producer prices (Figure 7). The “inland fish production – value” is important for multiple reasons, including the
26 Acadjas are brush parks of various designs traditionally used in Benin, West Africa, for habitat enhancement in shallow coastal lagoons. They are areas of a shallow lake or coastal lagoon where wooden branches and sticks or bamboo are piled up to provide refuge to local fish as well as to increase the natural food available to them (Crespi and Coche, 2008).
FIGURE 6“Inland fish production – quantity” in nine African countries
0
125
250
375
500
Benin Cameroon Chad Congo Democratic Republic of the Congo
Ghana Malawi Mali Nigeria
Thousand tonnes
Non-official estimate Official estimate

35Implementation
use of the monetary unit27 of measurement that is easily comparable across sectors. The “inland fish production – value” is based on reported and/or estimated first-sale prices at landing sites and farmgate prices at aquaculture farms or at the first point of sale. The indicator is compiled using the lowest estimate and the highest estimate and, consequently, the indicator is constituted by a range of values. In the nine analysed African countries, available information on fish prices is scant, and the compilation of this indicator required a substantial data-mining effort. In Ghana and Mali, the variability caused by the price range used in the “inland fish production – value” is added to the variability of the reported quantity of the “inland fish production – quantity”. In all other countries, the range in the “inland fish production – value” is driven only by the price variability. In Chad and the Democratic Republic of the Congo, the little available information on prices has allowed only the use of a single value.
Most of the analysed African countries do not report information on the composition of the “inland fish production – quantity” at the species level (FAO, 2016a). Therefore, one major challenge in the compilation of the “inland fish production – value” indicator is to identify a price range that could be used to capture the potential diversity of species found within the “inland fish production – quantity”.
The assessment of the value for aquaculture production is easier given that in the analysed African countries aquaculture is mainly focused on a few species, such as catfish, tilapia and African bony tongue (FAO, 2016a). In the analysed African countries, reported prices of aquaculture species are higher than those of captured species. Prices can also change locally according to different cultures and taste preferences. For example, in Cameroon, Ghana, Mali and the Democratic Republic of the Congo, catfish is more prized than tilapia, but in Benin and Malawi the opposite occurs (FAO, 2016a).
Within the economic dimension, another aspect that has been considered is the “aquaculture contribution to inland fish production” in terms of quantity and value.
In most analysed nine African countries, aquaculture is still poorly developed and often provides only a very minor contribution to the “inland fish production – quantity” (Figure 8). The only exception is Nigeria, which has the largest volume of aquaculture production in Africa. There is no information related to aquaculture production in Chad, and the amount reported in the Congo is extremely limited. In Benin, Cameroon, Mali and the Democratic Republic of the Congo, aquaculture represents between 1 and 2 percent of the total “inland fish production” despite the
27 In United States dollars (US$).
FIGURE 7“Inland fish production – value” in nine African countries
0
325
650
975
1 300
Benin Cameroon Chad Congo Democratic Republic of the Congo
Ghana Malawi Mali Nigeria
Thousand US$
Highest estimate Lowest estimate
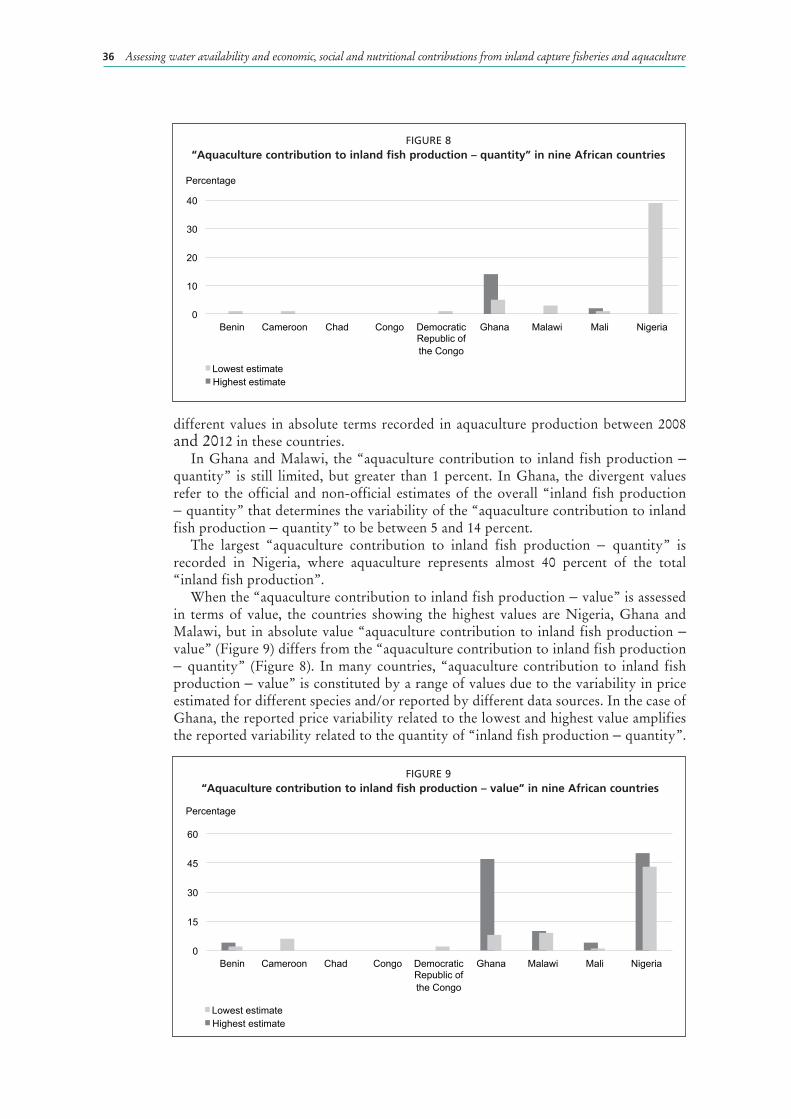
Assessing water availability and economic, social and nutritional contributions from inland capture fisheries and aquaculture36
different values in absolute terms recorded in aquaculture production between 2008 and 2012 in these countries.
In Ghana and Malawi, the “aquaculture contribution to inland fish production – quantity” is still limited, but greater than 1 percent. In Ghana, the divergent values refer to the official and non-official estimates of the overall “inland fish production – quantity” that determines the variability of the “aquaculture contribution to inland fish production – quantity” to be between 5 and 14 percent.
The largest “aquaculture contribution to inland fish production – quantity” is recorded in Nigeria, where aquaculture represents almost 40 percent of the total “inland fish production”.
When the “aquaculture contribution to inland fish production – value” is assessed in terms of value, the countries showing the highest values are Nigeria, Ghana and Malawi, but in absolute value “aquaculture contribution to inland fish production – value” (Figure 9) differs from the “aquaculture contribution to inland fish production – quantity” (Figure 8). In many countries, “aquaculture contribution to inland fish production – value” is constituted by a range of values due to the variability in price estimated for different species and/or reported by different data sources. In the case of Ghana, the reported price variability related to the lowest and highest value amplifies the reported variability related to the quantity of “inland fish production – quantity”.
FIGURE 8“Aquaculture contribution to inland fish production – quantity” in nine African countries
0
10
20
30
40
Benin Cameroon Chad Congo Democratic Republic of the Congo
Ghana Malawi Mali Nigeria
Percentage
Highest estimate Lowest estimate
FIGURE 9 “Aquaculture contribution to inland fish production – value” in nine African countries
0
15
30
45
60
Benin Cameroon Chad Congo Democratic Republic of the Congo
Ghana Malawi Mali Nigeria
Percentage
Highest estimate Lowest estimate

37Implementation
It is also interesting to note that the ranking order of Benin, Cameroon, Mali and the Democratic Republic of the Congo is different when comparing the “aquaculture contribution to inland fish production – value” and the “aquaculture contribution to inland fish production – quantity”. In fact, on the basis of available price information, Benin and Cameroon show a relatively higher “aquaculture contribution to inland fish production – value” compared with Mali and the Democratic Republic of the Congo.
The “fish-water productivity – quantity” is a useful economic indicator to highlight the importance and the conveyed benefits of water use by the inland fisheries sector. This indicator expresses, on average, the amount of fish per unit of water area; such an estimate can be useful in cross-sectoral management discussions and in climate change scenarios discussions. In most African countries, except Nigeria, limited aquaculture development and “aquaculture pond area” determine that the value of “fish-water productivity – quantity” is mostly driven by inland capture fisheries production and the assessment of the extent of the “inland water area”. The Congo, the Democratic Republic of the Congo, and Chad are characterized by low values of “fish-water productivity – quantity”, not exceeding 10 kg/ha per year (Figure 10). These values are clearly influenced by the large values of “inland water area”, but also suggest a potential underestimate of “inland fish production” reported by official statistics. In the case of Lake Chad, a potential underestimate of “inland fish production – quantity” adds to the current likely overestimate of the “inland water area”. Mali, Malawi and Cameroon are characterized by average values of “fish-water productivity – quantity” of about 27 and 54 kg/ha per year. These are still relatively low “fish-water productivity – quantity”, and likely occur in water areas with low fish-water productivity such as large reservoirs and large waterbodies. Ghana, Nigeria and Benin are characterized by an average “fish-water productivity – quantity” between 70 and 90 kg/ha per year. In this case, the high values recorded in Ghana and Nigeria are likely to be influenced by the fact that these countries have relevant aquaculture production. The high “fish-water productivity – quantity” recorded by Benin, instead, is probably influenced by different concomitant factors such as the natural high fish-water productivity of its coastal lagoons, the occurrence of traditional aquaculture systems such as acadjas in natural inland waters, and by the potential underestimate of the “inland water area” (FAO, 2016a).
The “fish-water productivity – value” estimates the average value, based on producer prices, of one hectare of surface water available to the inland fisheries sector in a given country. Therefore, the value of this indicator is affected by the recorded
FIGURE 10“Fish-water productivity – quantity” in nine African countries
0
50
100
150
200
Benin Cameroon Chad Congo Democratic Republic of the Congo
Ghana Malawi Mali Nigeria
Kg/ha
Highest estimate Lowest estimate
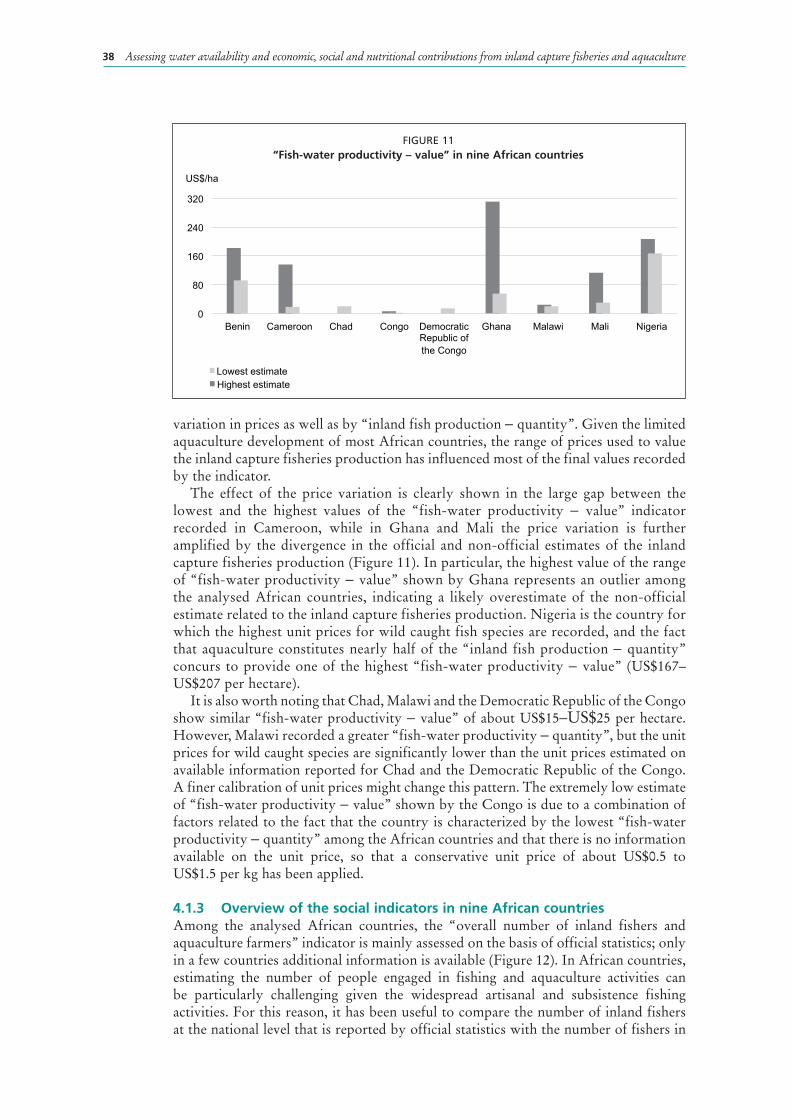
Assessing water availability and economic, social and nutritional contributions from inland capture fisheries and aquaculture38
variation in prices as well as by “inland fish production – quantity”. Given the limited aquaculture development of most African countries, the range of prices used to value the inland capture fisheries production has influenced most of the final values recorded by the indicator.
The effect of the price variation is clearly shown in the large gap between the lowest and the highest values of the “fish-water productivity – value” indicator recorded in Cameroon, while in Ghana and Mali the price variation is further amplified by the divergence in the official and non-official estimates of the inland capture fisheries production (Figure 11). In particular, the highest value of the range of “fish-water productivity – value” shown by Ghana represents an outlier among the analysed African countries, indicating a likely overestimate of the non-official estimate related to the inland capture fisheries production. Nigeria is the country for which the highest unit prices for wild caught fish species are recorded, and the fact that aquaculture constitutes nearly half of the “inland fish production – quantity” concurs to provide one of the highest “fish-water productivity – value” (US$167–US$207 per hectare).
It is also worth noting that Chad, Malawi and the Democratic Republic of the Congo show similar “fish-water productivity – value” of about US$15–US$25 per hectare. However, Malawi recorded a greater “fish-water productivity – quantity”, but the unit prices for wild caught species are significantly lower than the unit prices estimated on available information reported for Chad and the Democratic Republic of the Congo. A finer calibration of unit prices might change this pattern. The extremely low estimate of “fish-water productivity – value” shown by the Congo is due to a combination of factors related to the fact that the country is characterized by the lowest “fish-water productivity – quantity” among the African countries and that there is no information available on the unit price, so that a conservative unit price of about US$0.5 to US$1.5 per kg has been applied.
4.1.3 Overview of the social indicators in nine African countries Among the analysed African countries, the “overall number of inland fishers and aquaculture farmers” indicator is mainly assessed on the basis of official statistics; only in a few countries additional information is available (Figure 12). In African countries, estimating the number of people engaged in fishing and aquaculture activities can be particularly challenging given the widespread artisanal and subsistence fishing activities. For this reason, it has been useful to compare the number of inland fishers at the national level that is reported by official statistics with the number of fishers in
FIGURE 11“Fish-water productivity – value” in nine African countries
0
80
160
240
320
Benin Cameroon Chad Congo Democratic Republic of the Congo
Ghana Malawi Mali Nigeria
US$/ha
Highest estimate Lowest estimate
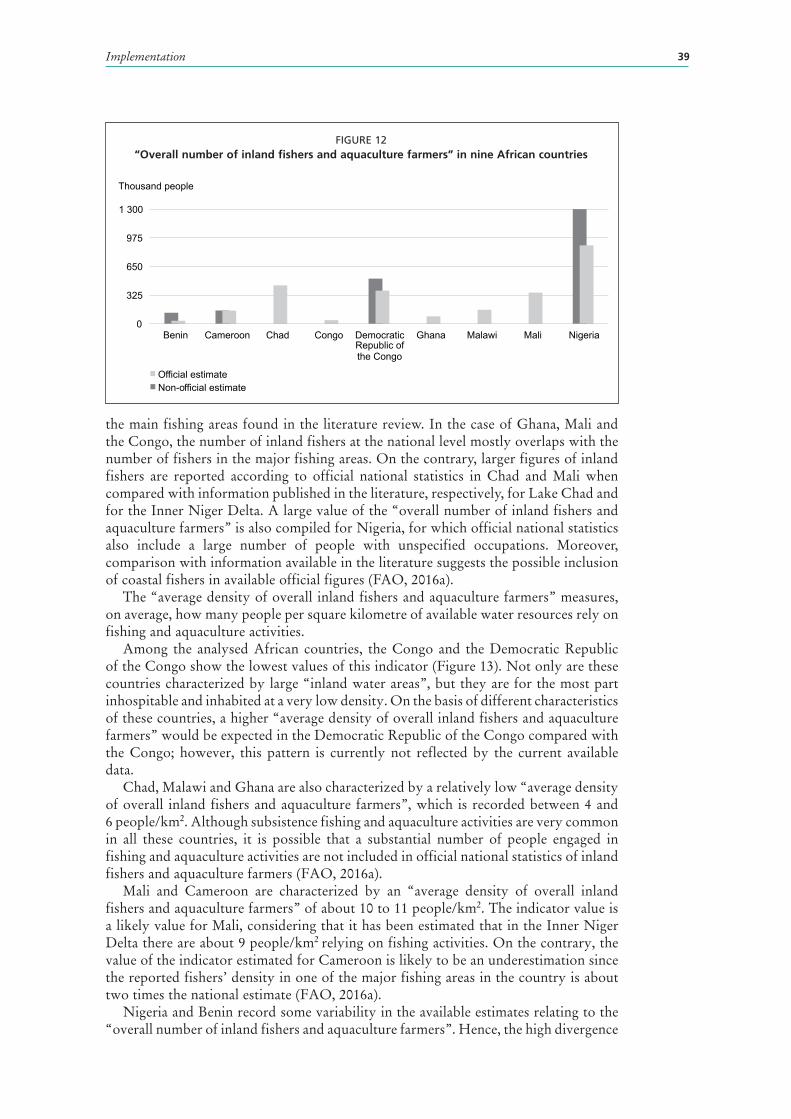
39Implementation
the main fishing areas found in the literature review. In the case of Ghana, Mali and the Congo, the number of inland fishers at the national level mostly overlaps with the number of fishers in the major fishing areas. On the contrary, larger figures of inland fishers are reported according to official national statistics in Chad and Mali when compared with information published in the literature, respectively, for Lake Chad and for the Inner Niger Delta. A large value of the “overall number of inland fishers and aquaculture farmers” is also compiled for Nigeria, for which official national statistics also include a large number of people with unspecified occupations. Moreover, comparison with information available in the literature suggests the possible inclusion of coastal fishers in available official figures (FAO, 2016a).
The “average density of overall inland fishers and aquaculture farmers” measures, on average, how many people per square kilometre of available water resources rely on fishing and aquaculture activities.
Among the analysed African countries, the Congo and the Democratic Republic of the Congo show the lowest values of this indicator (Figure 13). Not only are these countries characterized by large “inland water areas”, but they are for the most part inhospitable and inhabited at a very low density. On the basis of different characteristics of these countries, a higher “average density of overall inland fishers and aquaculture farmers” would be expected in the Democratic Republic of the Congo compared with the Congo; however, this pattern is currently not reflected by the current available data.
Chad, Malawi and Ghana are also characterized by a relatively low “average density of overall inland fishers and aquaculture farmers”, which is recorded between 4 and 6 people/km2. Although subsistence fishing and aquaculture activities are very common in all these countries, it is possible that a substantial number of people engaged in fishing and aquaculture activities are not included in official national statistics of inland fishers and aquaculture farmers (FAO, 2016a).
Mali and Cameroon are characterized by an “average density of overall inland fishers and aquaculture farmers” of about 10 to 11 people/km2. The indicator value is a likely value for Mali, considering that it has been estimated that in the Inner Niger Delta there are about 9 people/km2 relying on fishing activities. On the contrary, the value of the indicator estimated for Cameroon is likely to be an underestimation since the reported fishers’ density in one of the major fishing areas in the country is about two times the national estimate (FAO, 2016a).
Nigeria and Benin record some variability in the available estimates relating to the “overall number of inland fishers and aquaculture farmers”. Hence, the high divergence
FIGURE 12“Overall number of inland fishers and aquaculture farmers” in nine African countries
0
325
650
975
1 300
Benin Cameroon Chad Congo Democratic Republic of the Congo
Ghana Malawi Mali Nigeria
Thousand people
Non-official estimate Official estimate

Assessing water availability and economic, social and nutritional contributions from inland capture fisheries and aquaculture40
in the “average density of overall inland fishers and aquaculture farmers” pinpoints the need for additional information.
All analysed African countries are affected by scarce information regarding the “overall number of inland fishers and aquaculture farmers”; therefore, this indicator is likely to change with improved statistics concerning the degree to which fishing and aquaculture activities provide employment and support livelihoods.
4.1.4 Overview of the nutritional indicators in nine African countriesIn the analysed African countries, the recorded values of “fish protein supplied by inland fish production” (Figure 14) are similar to the “inland fish production – quantity” and show a similar pattern and ranking among countries. The “fish protein supplied by inland fish production” is almost exclusively constituted by the fish catch of freshwater and diadromous fish species, as there is no information reported on the share of the “inland fish production” constituted by crustaceans, molluscs and other aquatic animals. Except for Nigeria, and to a smaller extent Ghana, the largest contribution to the fish proteins produced is currently provided by inland capture fisheries.
The “fish-protein water productivity” is one useful nutritional indicator to highlight the importance of water resources for the inland fisheries sector and the benefits
FIGURE 13“Average density of overall inland fishers and aquaculture farmers” in nine African countries
0
10
20
30
40
Benin Cameroon Chad Congo Democratic Republic of the Congo
Ghana Malawi Mali Nigeria
People/km2
Highest estimate Lowest estimate
FIGURE 14“Fish protein supplied by inland fish production” in nine African countries
0
15
30
45
60
Benin Cameroon Chad Congo Democratic Republic of the Congo
Ghana Malawi Mali Nigeria
Thousand tonnes
Non-official estimate Official estimate

41Implementation
derived from water use made by inland capture fisheries and aquaculture activities in terms of food security in units common across sectors. In the analysed African countries, except for Nigeria and to some extent Ghana, the “fish-protein water productivity” is mostly influenced by the recorded values of “national inland capture fisheries production” and “inland water area”. The recorded values of “fish-protein water productivity” (Figure 15) are similar to the “fish-water productivity – quantity”. This is expected since “fish-protein water productivity” is primarily influenced by “inland fish production”. The indicator varies between 1 kg and 10 kg per hectare of surface water in most of the analysed African countries (Figure 15). The relatively narrow range of this indicator recorded in most countries suggests a likely overestimate in the non-official estimate of inland capture fisheries production in Ghana, which stands as an outlier in the pattern shown by the other analysed African countries.
4.1.5 Description of water availability indicators in nine African countriesThis section presents the estimated values of four water availability indicators compiled for the nine African countries (Figure 16) and discusses major data issues. The section also provides a brief overview on how these indicators can complement each other and improve our understanding of the water resources available for inland capture fisheries and aquaculture activities.
In Benin, the “inland water area” is estimated to cover an area of 3 000 km2. Benin is characterized by the Niger River flowing in its northern country boundary and by the Ouémé River flowing in the central and southern area of the country with associated seasonally flooded areas and coastal lagoons (Vanden Bossche and Bernacsek, 1990a). It is estimated that 12 percent of the “inland water area” in Benin is constituted by “permanent inland waters”, and its vast coastal lagoons contribute to this value. The “percentage of inland water over country area” is estimated to be 3 percent, but it should be noted that, according to expert opinion, the “seasonally flooded areas” should cover an area larger than what is assessed in this study on the basis of current available data (Laleye, personal communication).
In Cameroon, the “inland water area” is estimated to cover an area of about 14 000 km2, which is about 3 percent of the country area. The estimate of the “permanent inland waters” mainly included the remaining extent of Lake Chad, several large dam reservoirs and the river network.
The area covered by the river networks, which are estimated at around 1 000 km2, might be partially underestimated considering that the Ouémé River alone, which is the longest river in Cameroon, has a total length of 950 km. However, the major
FIGURE 15“Fish-protein water productivity” in nine African countries
0
5
10
15
20
Benin Cameroon Chad Congo Democratic Republic of the Congo
Ghana Malawi Mali Nigeria
Kg/ha
Non-official estimate Official estimate
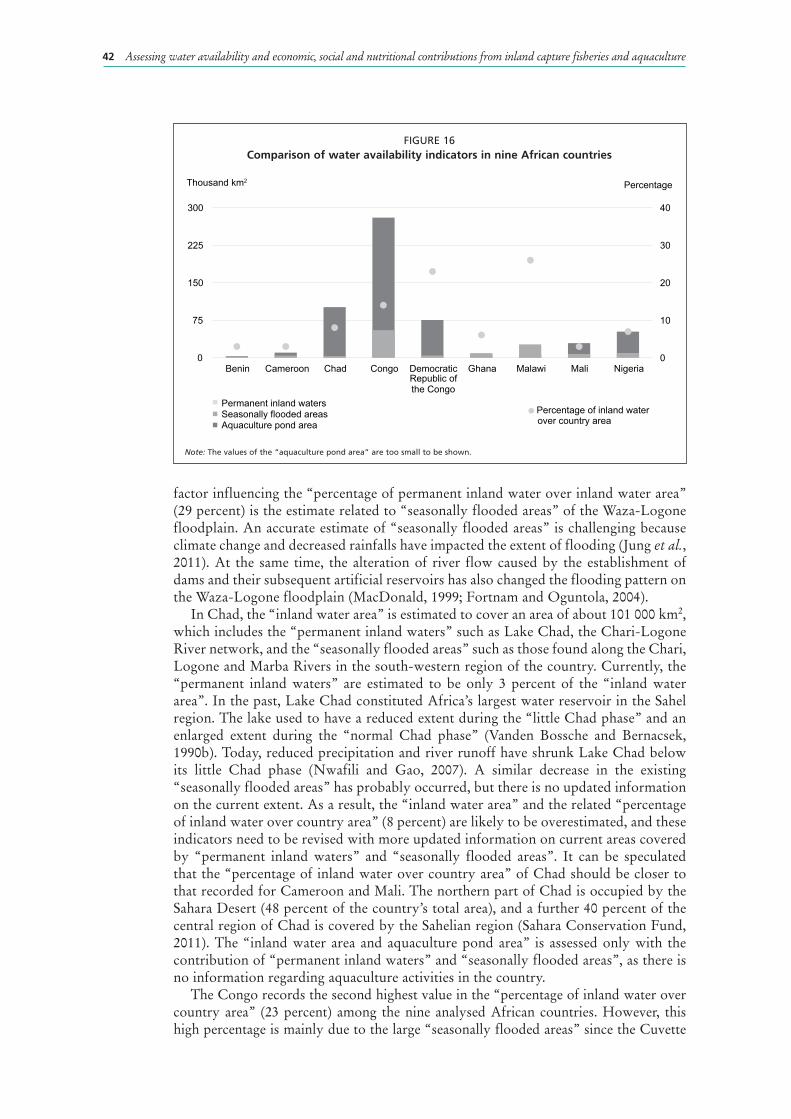
Assessing water availability and economic, social and nutritional contributions from inland capture fisheries and aquaculture42
factor influencing the “percentage of permanent inland water over inland water area” (29 percent) is the estimate related to “seasonally flooded areas” of the Waza-Logone floodplain. An accurate estimate of “seasonally flooded areas” is challenging because climate change and decreased rainfalls have impacted the extent of flooding (Jung et al., 2011). At the same time, the alteration of river flow caused by the establishment of dams and their subsequent artificial reservoirs has also changed the flooding pattern on the Waza-Logone floodplain (MacDonald, 1999; Fortnam and Oguntola, 2004).
In Chad, the “inland water area” is estimated to cover an area of about 101 000 km2, which includes the “permanent inland waters” such as Lake Chad, the Chari-Logone River network, and the “seasonally flooded areas” such as those found along the Chari, Logone and Marba Rivers in the south-western region of the country. Currently, the “permanent inland waters” are estimated to be only 3 percent of the “inland water area”. In the past, Lake Chad constituted Africa’s largest water reservoir in the Sahel region. The lake used to have a reduced extent during the “little Chad phase” and an enlarged extent during the “normal Chad phase” (Vanden Bossche and Bernacsek, 1990b). Today, reduced precipitation and river runoff have shrunk Lake Chad below its little Chad phase (Nwafili and Gao, 2007). A similar decrease in the existing “seasonally flooded areas” has probably occurred, but there is no updated information on the current extent. As a result, the “inland water area” and the related “percentage of inland water over country area” (8 percent) are likely to be overestimated, and these indicators need to be revised with more updated information on current areas covered by “permanent inland waters” and “seasonally flooded areas”. It can be speculated that the “percentage of inland water over country area” of Chad should be closer to that recorded for Cameroon and Mali. The northern part of Chad is occupied by the Sahara Desert (48 percent of the country’s total area), and a further 40 percent of the central region of Chad is covered by the Sahelian region (Sahara Conservation Fund, 2011). The “inland water area and aquaculture pond area” is assessed only with the contribution of “permanent inland waters” and “seasonally flooded areas”, as there is no information regarding aquaculture activities in the country.
The Congo records the second highest value in the “percentage of inland water over country area” (23 percent) among the nine analysed African countries. However, this high percentage is mainly due to the large “seasonally flooded areas” since the Cuvette
FIGURE 16Comparison of water availability indicators in nine African countries
0
10
20
30
40
0
75
150
225
300
Benin Cameroon Chad Congo Democratic Republic of the Congo
Ghana Malawi Mali Nigeria
Percentage Thousand km2
Seasonally flooded areas Aquaculture pond area
Permanent inland waters Percentage of inland water over country area
Note: The values of the “aquaculture pond area” are too small to be shown.
43Implementation
Congolese lies in the Congo for about one-third of its area. The “permanent inland waters” in the Congo are mainly constituted by the river network of the Congo Basin, by the occurrence of one transboundary lake (Pool Malebo) with an area of 330 km2, and other minor lakes (Vanden Bossche and Bernacsek, 1990b). The “percentage of permanent inland water over inland water area” is estimated to be only 5 percent. However, it should be noted that the water area of the existing river network is underestimated, as it has been derived from a map at coarse resolution. Therefore, an underestimation of the “permanent inland waters” is likely, and the “inland water area” is expected to be more robust, as by taking into account also the “seasonally flooded areas” provides a more comprehensive assessment of the area covered by the river network. The “inland water area and aquaculture pond area” has been assessed only with the contribution of “permanent inland waters” and “seasonally flooded areas” because there is no information about the extent of the “aquaculture pond area” in the country.
The Democratic Republic of the Congo shows the largest estimate of “inland water area”, of nearly 335 000 km2, and one of the highest “percentage of inland water over country area” (14 percent) among the nine analysed African countries. In fact, the Democratic Republic of the Congo is characterized by the occurrence of large transboundary waterbodies extending in the country for about 24 000 km2 and by the
“Cuvette Congolese”, which is well known for its flooded areas and which extends for two-thirds of its area, about 190 000 km2, in the country (Welcomme and Lymer, 2012). The difference between the area of “permanent inland waters” and “seasonally flooded areas” is reflected by the relatively low “percentage of permanent inland water over inland water area” (14 percent). There is scant information regarding the “aquaculture pond area” in the country.
In Ghana, the “inland water area” is estimated to cover an area of 15 000 km2, which
is about 6 percent of the country area. Ghana is characterized by the occurrence of Lake Volta, which is the largest artificial reservoir in Africa (Schmidt-Kallert, 1990), and determines a very high “percentage of permanent inland water over inland water area” (60 percent). Information on the area occupied by the river network is limited within the “permanent inland waters”, but the relatively high estimate of “seasonally flooded areas” refers to the main tributaries draining into Lake Volta and around the Volta River Delta. Considering that Ghana is located in the equatorial zone, the “percentage of inland water over country area” (6 percent) is probably a reasonable estimate for the country.
In Malawi, the “inland water area” is estimated to cover an area of about 31 000 km2. Malawi is extremely rich in surface waters and consequently shows the highest “percentage of permanent inland water over inland water area” (26 percent) among analysed African countries. Malawi is renowned for the occurrence of Lake Malawi, which alone covers an area of about 24 000 km2, and other important water resources such as Lake Malombe (390 km2), Lake Chiuta (750 km2), Lake Chilwa (160 km2), and the riverine network (Vanden Bossche and Bernacsek, 1990b). The “seasonally flooded areas” are limited and mainly associated with the last section of the Shire River, flowing in the country for about 450 km from Lake Malawi to Mozambique (Shela, 2000; Kosamu et al., 2012). For these reasons, the “percentage of permanent inland water over inland water area” (86 percent) is the highest among analysed countries.
In Mali, the “inland water area” is estimated to cover an area of 36 000 km2, which
is about 3 percent of the country area. This outcome is expected given that a large part of the country is occupied by arid and semi-arid areas. However, the “percentage of permanent inland water over inland water area” is higher than in Nigeria (20 versus 15 percent), although both Mali and Nigeria include the same share (about 30 percent) of the whole area of the Niger River Basin (Andersen and Golitzen, 2005). In Mali, the Niger and Senegal Rivers create a network with a length of about 4 000 km (Vanden Bossche and Bernacsek, 1990c), and the reported estimate of the river area is about

Assessing water availability and economic, social and nutritional contributions from inland capture fisheries and aquaculture44
3 000 km2 (Lehner and Doll, 2004). Consequently, the riverine component accounted within the “inland water area” is likely to be underestimated, but probably to a lesser degree than in Nigeria.
In Nigeria, the “inland water area” is estimated to cover an area of 61 000 km2, which is about 7 percent of the country area. Estimating the riverine component is very challenging, as Nigeria has an impressive river network created by the Niger and Benué Rivers and their twenty tributaries (Andersen and Golitzen, 2005). Nigeria contains about 28 percent (424 500 km2) of the Niger River Basin, and more than half of Nigeria’s rivers are drained by this large water basin (Andersen and Golitzen, 2005). The available estimate of “seasonally flooded areas” covers an extensive area of about 52 000 km2, which determined the relatively low “percentage of permanent inland water over inland water area” (15 percent). However, despite the wide extent of the “seasonally flooded areas”, the overall “inland water area” might still be underestimated and not fully represent the river network flowing in the country for a length of nearly 9 000 km.
4.1.6 Description of economic indicators in nine African countriesThis section presents the estimated values of six economic indicators compiled for the nine African countries (Figure 17) and discusses major data issues. The section provides a brief overview on how these indicators can complement each other and improve our understanding of the economic contributions of water use by inland capture fisheries and aquaculture activities.
In Benin, “inland fish production” supplies about 27 000 tonnes/year with an estimated value between approximately US$28 million and US$55 million. The low “aquaculture contribution to inland fish production – quantity” (1 percent) is mainly related to the fact that official statistics of aquaculture production are likely to report only the production from the main commercial aquaculture enterprise in the country (Royal Fish Benin) and do not include fish cultured with traditional extensive aquaculture methods such as acadjas and whedos (FAO, 2016a). “Aquaculture contribution to inland fish production” in terms of value is estimated to be between 2 and 4 percent. The high annual “fish-water productivity – quantity” (91 kg/ha) shown by Benin is likely to have been influenced by different factors, such as the natural, high fish-water productivity of its coastal lagoons, the occurrence of traditional aquaculture systems such as acadjas in natural inland waters, as well as by a potential underestimate of the “inland water area”. It should be noted that in three major coastal lagoons in Benin, recorded annual fish-water productivity values have been reported to be between 300 and 1 430 kg/ha (Direction de pêches, 1997; Jenness et al., 2007; Lorenzen et al., 2001). On the basis of the unit prices and the quantity of fish captured or cultured in the estimated “inland water area and aquaculture pond area”, the value of one hectare of water area available to the inland fisheries sector in Benin varies between US$92 and US$182.
In Cameroon, the “inland fish production” supplies about 76 000 tonnes/year with an estimated value between US$26 million and US$189 million. Aquaculture production is quite limited, and between 2008 and 2012 it had not reached 1 000 tonnes/year (FAO, 2006–2016). Therefore, the “aquaculture contribution to inland fish production” represents only 1 percent of total “inland fish production – quantity” and between 1 and 6 percent of the “inland fish production – value”. The annual “fish-water productivity – quantity” estimate of 54 kg/ha seems to be a reasonable estimate at the national level. In fact, about one-sixth of the national inland fish production is reported to come from the Yaéré floodplain; the local annual fish-water productivity recorded for this floodplain varies between 25 and 60 kg/ha (Welcomme, 1979a; De Iongh, Hamling and Zuiderwijk, 1998). On the basis of the unit prices and the quantity of fish captured or cultured in the estimated “inland water area and aquaculture pond
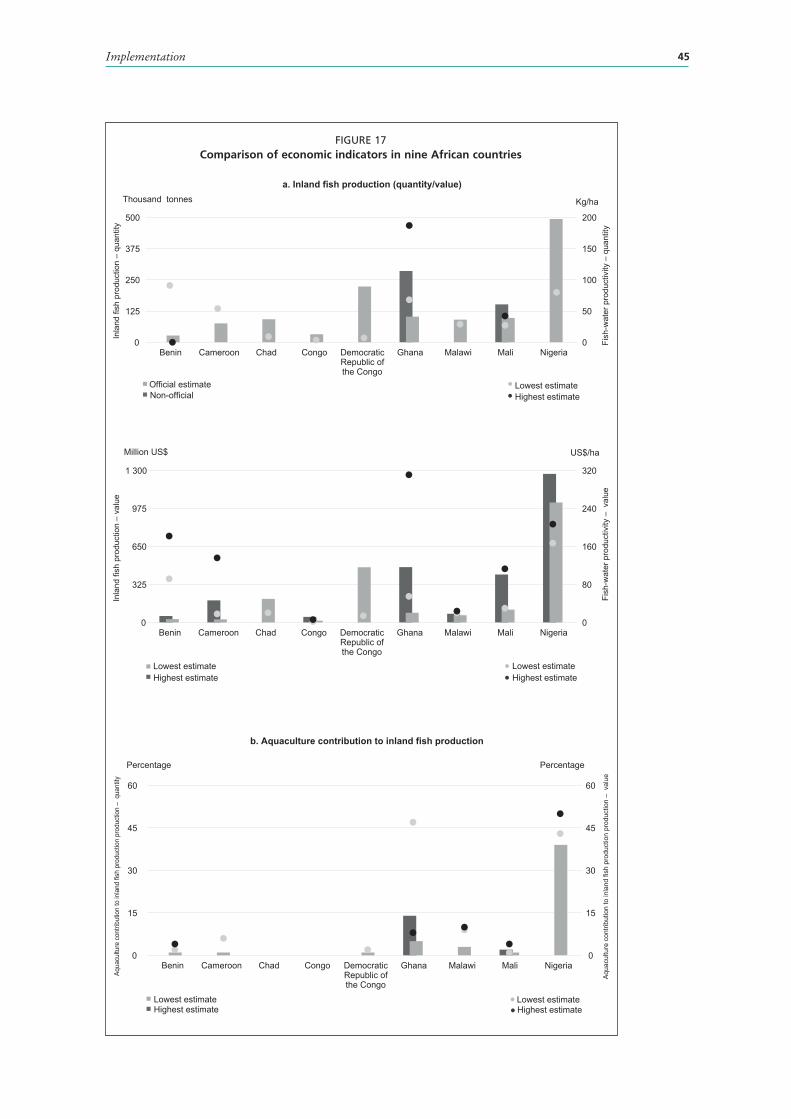
45Implementation
FIGURE 17Comparison of economic indicators in nine African countries
0
50
100
150
200
0
125
250
375
500
Benin Cameroon Chad Congo Democratic Republic of the Congo
Ghana Malawi Mali Nigeria
Kg/ha Thousand tonnes
a. Inland fish production (quantity/value)
b. Aquaculture contribution to inland fish production
Non-official Official estimate Lowest estimate
Highest estimate
0
80
160
240
320
0
325
650
975
1 300
Benin Cameroon Chad Congo Democratic Republic of the Congo
Ghana Malawi Mali Nigeria
US$/ha Million US$
Highest estimate Lowest estimate Lowest estimate
Highest estimate
0
15
30
45
60
0
15
30
45
60
Benin Cameroon Chad Congo Democratic Republic of the Congo
Ghana Malawi Mali Nigeria
Percentage Percentage
Highest estimate Lowest estimate Lowest estimate
Highest estimate
Inla
nd fi
sh p
rodu
ctio
n –
quan
tity
Inla
nd fi
sh p
rodu
ctio
n –
valu
eAq
uacu
lture
con
tribu
tion
to in
land
fish
pro
duct
ion
prod
uctio
n –
qua
ntity
Fish
-wat
er p
rodu
ctiv
ity –
qua
ntity
Fish
-wat
er p
rodu
ctiv
ity –
val
ueAq
uacu
lture
con
tribu
tion
to in
land
fish
pro
duct
ion
prod
uctio
n –
val
ue

Assessing water availability and economic, social and nutritional contributions from inland capture fisheries and aquaculture46
area”, the value of one hectare of water area available to the inland fisheries sector in Cameroon varies between US$18 and US$136.
In Chad, the annual “inland fish production” is estimated at about 92 000 tonnes with an estimated value of approximately US$202 million. There are no official statistics related to aquaculture production between 2008 and 2012; therefore, the “aquaculture contribution to inland fish production” could not be assessed. The estimated annual “fish-water productivity” is rather low both in terms of quantity (9 kg/ha) and value (US$20/ha). These values constitute one of the lowest among the analysed nine African countries and are likely to be influenced by a potentially underestimated “inland fish production” added to the likely overestimated extent of the “inland water area”. In addition, it appears that official national statistics may have only accounted for fish production from Lake Chad and did not include fish production from the “seasonally flooded areas” in the Chari-Logone River floodplain (FAO, 2016a). At the same time, the assessment of the “inland water area” might have included “seasonally flooded areas” that are no longer formed in the country due to the substantial reduction in precipitation and in runoff from the river flowing in the country.
In the Congo, the annual “inland fish production” is estimated at 32 000 tonnes with an estimated value between approximately US$16 million to US$48 million. Between 2008 and 2012, aquaculture production was limited to approximately 200 tonnes/year (Toguyen, 2004). Therefore, the “aquaculture contribution to inland fish production” quantity and value are not significant. The “fish-water productivity – quantity” is the lowest among all analysed African countries. Since there is no available information on fish producer prices, a conservative unit price range of US$0.5 to US$1.5 per kilogram is used to calculate the annual “fish-water productivity – value” (from US$2 to US$6 per hectare) (FAO, 2016a). The outcome highlights a large discrepancy between the Congo and the rest of the analysed African countries. The low values of “fish-water productivity” both in terms of quantity and value are influenced by the wide extent of “inland water area” compared with the relatively low amount of “inland fish production” reported in national statistics. It should be noted that the annual “fish-water productivity – quantity” of 4 kg/ha and 7 kg/ha reported, respectively, for the Congo and the Democratic Republic of the Congo is even lower than the very conservative estimate of fish-water productivity of 15–25 kg/ha reported for the Cuvette Congolese by Vanden Bossche and Bernacsek (1990b). The compiled economic indicators of this study provided additional indications that, as pointed out by Welcomme and Lymer (2012), the official national statistics of “inland fish production” in the Congo might be severely underreported.
In the Democratic Republic of the Congo, the “inland fish production” is estimated at 223 000 tonnes/year with an estimated value approximately of US$472 million. “Aquaculture contribution to inland fish production” is limited and estimated at 1 percent of total “inland fish production” in terms of quantity and 2 percent in terms of value. Similar to the Congo, the annual “fish-water productivity” is rather low both in quantity (7 kg/ha) and value (US$14/ha). However, as for the Congo, more accurate information to estimate the “inland fish production” might significantly change the current values of the compiled economic indicators.
In Ghana, the “inland fish production” supplies between 103 000 and 285 000 tonnes/year according to official and non-official estimates, respectively, with an estimated value between approximately US$83 million and 473 million. The variability of the “inland fish production – quantity” is caused by divergent estimates on the fish production of Lake Volta. Assessing the fish production from this large reservoir is difficult due to the natural variability of the lake’s ecosystem, the large size and the difficulty to access some parts of the shorelines. Aquaculture production between 2008 and 2012 is reported to be below 14 000 tonnes/year. Therefore, the “aquaculture contribution to inland fish production” varies between 5 and 14 percent of the total “inland fish
47Implementation
production” in terms of quantity, but between 8 and 47 percent in terms of value. The wide range of quantity values of the “aquaculture contribution to inland fish production” is due to divergent estimates of “inland fish production”. In the estimate of the “aquaculture contribution to inland fish production – value”, this wide range is further amplified by price variability. The annual “fish-water productivity – quantity” estimated at the national level varies between 68 and 187 kg/ha. The upper value of the range is similar to the fish-water productivity estimated for Lake Volta (180–240 kg/ha) by de Graaf and Ofori-Danson (1997). On the basis of the unit prices and the quantity of fish captured or cultured in the estimated “inland water area and aquaculture pond area”, the value of one hectare of water area available to the inland fisheries sector in Ghana varies between US$55 and US$311.
In Malawi, the “inland fish production” supplies about 91 000 tonnes/year with an estimated value between approximately US$62 million and US$74 million. Aquaculture production during the 2008–2012 period is reported to be below 3 000 tonnes/year. Therefore, the “aquaculture contribution to inland fish production” represented only 3 percent of the total “inland fish production” in quantity, but between 9 and 10 percent in value given the significantly higher prices of farmed species compared with capture species. The majority of fish catch (50–75 percent) is reported to come from Lake Malawi; 14–20 percent from Lake Chilwa; 1–13 percent from Lake Malombe; 2 percent from Lake Chiuta; and 4–10 percent from the lower Shire River (Halle and Burgess, 2006; FAO, 2005). The annual “fish-water productivity – quantity” estimated at the national level is rather low (29 kg/ha) considering that the “seasonally flooded areas” around the Shire River recorded fish-water productivity values between 60 and 160 kg/ha (ICLARM and GTZ, 1991; Kosamu et al., 2012; Mapila, 1998), while Lake Chilwa recorded a fish-water productivity of about 160 kg/ha (Phiri et al., 2013). The value of the indicator at the national level has been driven by the relatively low fish-water productivity of Lake Malawi caused by its large surface area. On the basis of the unit prices and the quantity of fish captured or cultured in the estimated “inland water area and aquaculture pond area”, the value of one hectare of water area available to the inland fisheries sector in Malawi ranges between US$20 and US$24.
In Mali, the “inland fish production” varies from 97 000 to 152 000 tonnes/year according to official and non-official estimates, respectively, with total annual values ranging from US$110 million to US$410 million. The time series of official statistics on inland capture fisheries included several data gaps, especially in the most recent years (2008–2012); thus, substantial uncertainty exists on the compiled estimates. The amount of “inland fish production” is highly dependent on the fish production from the Inner Niger Delta, which is the major fishing area in the country, and varies annually according to rainfall pattern and seasonal flooding. Some authors have warned that official statistics are likely to overreport fish production from the Inner Niger Delta, which might be experiencing a decline in fish production. A negative trend has been assessed during a survey between 1997 and 2002 (Zwarts and Diallo, 2005) and should be confirmed with more recent data. Mali is characterized by extensive family-based aquaculture, which represents only 1 to 2 percent of the overall “inland fish production” in terms of quantity and 1 to 4 percent in terms of value. The annual “fish-water productivity – quantity” estimated at the national level (27–42 kg/ha) is similar to the fish-water productivity recorded in the reservoirs (with the exception of the Sélingué Reservoir) and in the Inner Niger Delta (Diarra, Kuper and Mahé, 2004). On the basis of the unit prices and the quantity of fish captured or cultured in the estimated “inland water area and aquaculture pond area”, the value of one hectare of water area available to the inland fisheries sector in Mali is estimated to be between US$30 and US$113.
In Nigeria, the “inland fish production” supplies about 494 000 tonnes/year with an estimated value between approximately US$1 billion and 1.3 billion. Among the
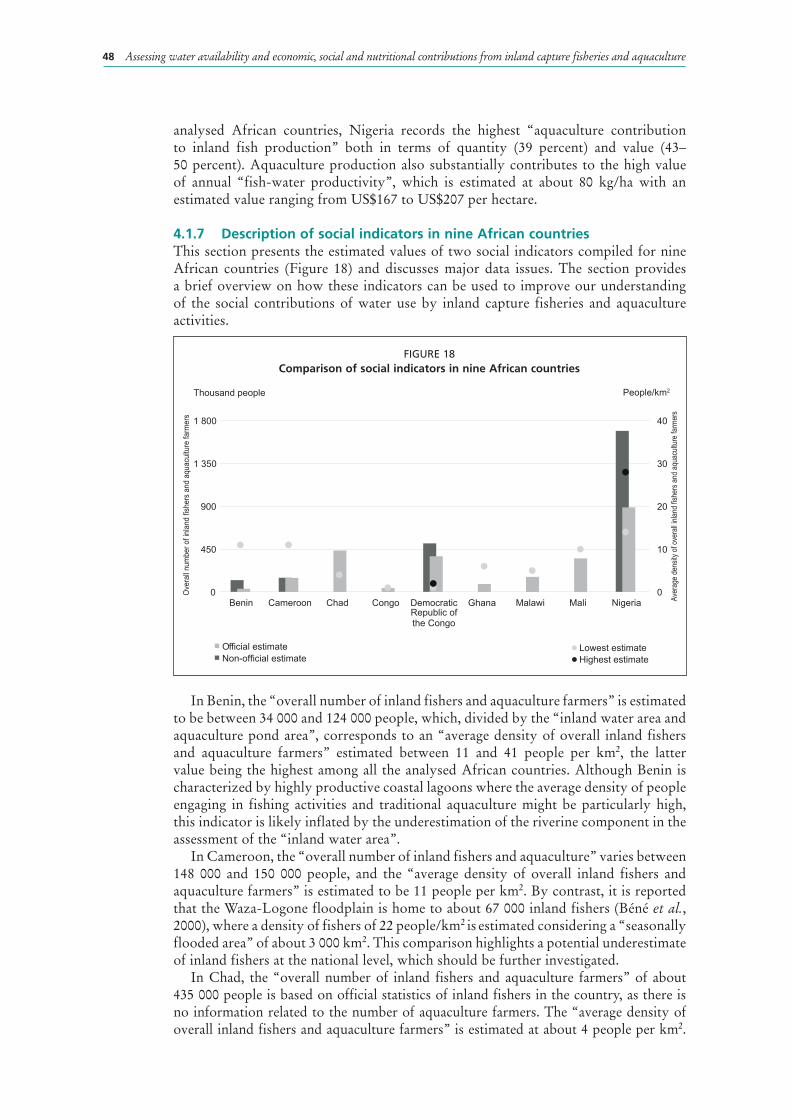
Assessing water availability and economic, social and nutritional contributions from inland capture fisheries and aquaculture48
analysed African countries, Nigeria records the highest “aquaculture contribution to inland fish production” both in terms of quantity (39 percent) and value (43–50 percent). Aquaculture production also substantially contributes to the high value of annual “fish-water productivity”, which is estimated at about 80 kg/ha with an estimated value ranging from US$167 to US$207 per hectare.
4.1.7 Description of social indicators in nine African countriesThis section presents the estimated values of two social indicators compiled for nine African countries (Figure 18) and discusses major data issues. The section provides a brief overview on how these indicators can be used to improve our understanding of the social contributions of water use by inland capture fisheries and aquaculture activities.
In Benin, the “overall number of inland fishers and aquaculture farmers” is estimated to be between 34 000 and 124 000 people, which, divided by the “inland water area and aquaculture pond area”, corresponds to an “average density of overall inland fishers and aquaculture farmers” estimated between 11 and 41 people per km2, the latter value being the highest among all the analysed African countries. Although Benin is characterized by highly productive coastal lagoons where the average density of people engaging in fishing activities and traditional aquaculture might be particularly high, this indicator is likely inflated by the underestimation of the riverine component in the assessment of the “inland water area”.
In Cameroon, the “overall number of inland fishers and aquaculture” varies between 148 000 and 150 000 people, and the “average density of overall inland fishers and aquaculture farmers” is estimated to be 11 people per km2. By contrast, it is reported that the Waza-Logone floodplain is home to about 67 000 inland fishers (Béné et al., 2000), where a density of fishers of 22 people/km2 is estimated considering a “seasonally flooded area” of about 3 000 km2. This comparison highlights a potential underestimate of inland fishers at the national level, which should be further investigated.
In Chad, the “overall number of inland fishers and aquaculture farmers” of about 435 000 people is based on official statistics of inland fishers in the country, as there is no information related to the number of aquaculture farmers. The “average density of overall inland fishers and aquaculture farmers” is estimated at about 4 people per km2.
FIGURE 18Comparison of social indicators in nine African countries
0
10
20
30
40
0
450
900
1 350
1 800
Benin Cameroon Chad Congo Democratic Republic of the Congo
Ghana Malawi Mali Nigeria
People/km2Thousand people
Non-official estimate Official estimate Lowest estimate
Highest estimate
Ove
rall n
umbe
r of i
nlan
d fis
hers
and
aqu
acul
ture
farm
ers
Aver
age
dens
ity o
f ove
rall i
nland
fishe
rs a
nd a
quac
ultur
e fa
rmer
s
49Implementation
It is difficult to estimate the number of inland fishers in Lake Chad due to the remote location of many fishing villages, and the fact that people living around the lake engage in farming activities most of the year and thus tend to consider themselves as farmers rather than fishers (Sarch and Birkett, 2000). However, it is interesting to note that if the historical extent of Lake Chad in its large phase (estimated at about 10 700 km2, from Lehner and Doll, 2004) is used for this theoretical calculation, a number of 530 000 inland fishers is obtained (FAO, 2016a). However, without additional information, it remains difficult to assess the accuracy of the current reported official figure of inland fishers.
In the Congo, the “overall number of inland fishers and aquaculture farmers” is estimated at about 41 000 people and, considering the “inland water area and aquaculture pond area”, the resulting “average density of overall inland fishers and aquaculture farmers” is estimated at 1 person per km2. This is the lowest density recorded among the analysed African countries. However, it should be considered that this low density is influenced by the wide flooded area of the Congo River Basin, which has remote areas that for the most part are inhospitable and inhabited only at very low densities. Welcomme (1979a) estimated that in the Cuvette Centrale, the population density is about 1.1 inhabitants/km2. If the estimate by Welcomme (1979a) in the late 1970s is still valid, it would agree with this estimate of the “average density of overall inland fishers and aquaculture farmers” at the national level.
In the Democratic Republic of the Congo, the “overall number of inland fishers and aquaculture farmers” is estimated to be between 375 000 and 511 000 people, which corresponds to an “average density of overall inland fishers and aquaculture farmers” of 1–2 people per km2 of the estimated “inland water area and aquaculture pond area”. There are uncertainties in this estimate, as the value is similar to that of the Congo; the Democratic Republic of Congo is characterized by large transboundary lakes and an overall population density about three times higher than the population density recorded in the Congo (United Nations, 2011).
In Ghana, the “overall number of inland fishers and aquaculture farmers” is estimated at about 84 000 people. However, the number of inland fishers reported in official national statistics is likely to refer to a survey carried out in 1998 by the Ministry of Fisheries on Lake Volta (MOFA, 2003). It should be noted that the estimated “overall number of inland fishers and aquaculture farmers” based on official statistics is less than half of the highest estimate related to the number of fishers in the country calculated on the basis of the size of different inland waters (FAO, 2016a). In addition, the relatively low “average density of overall inland fishers and aquaculture farmers” (6 people/km2) contrasts with the high population density recorded in the country. These indications suggest a potential underreporting of the official national statistics related to the “overall number of inland fishers and aquaculture” and should be further investigated.
In Malawi, the “overall number of inland fishers and aquaculture farmers” is based on official statistics; the majority are inland fishers (about 150 000 people) and a minority of aquaculture farmers (about 8 000 people). The “overall number of inland fishers and aquaculture farmers”, when divided by the “inland water area and aquaculture pond area”, gives an “average density of overall inland fishers and aquaculture farmers” of 5 people/km2. This low density value is driven by the large size of Lake Malawi. However, a potential underreporting in the official number of part-time and occasional fishers and aquaculture farmers cannot be ruled out given the importance of fishing activities in the country and the population size of about 13 million people (United Nations, 2011).
In Mali, the “overall number of inland fishers and aquaculture farmers’ is estimated at about 353 000 people, and the “average density of overall inland fishers and aquaculture farmers” (10 people/km2) is similar to both the overall population density (12 people/km2 of the whole country area) (United Nations, 2011) and to the local

Assessing water availability and economic, social and nutritional contributions from inland capture fisheries and aquaculture50
density of fishers in the Inner Niger Delta. In fact, about 250 000 inland fishers are estimated to be in the Inner Niger Delta (WorldFish Center, 2010), where a local density of fishers of 9 people/km2 can be estimated considering the area of the Inner Niger Delta covers about 29 000 km2.
In Nigeria, the “overall number of inland fishers and aquaculture farmers” is estimated to be between 889 000 and 1.7 million people. This wide range is due to the fact that official statistics include 879 000 inland fishers, 14 000 aquaculture farmers and an additional 803 000 people with an unspecified occupation. By taking into consideration the “inland water area and aquaculture pond area”, the “average density of overall inland fishers and aquaculture farmers” records one of the highest values (14–28 people/ km2) among the analysed African countries. The estimated “overall number of inland fishers and aquaculture farmers” is similar to an estimate of inland fishers in 2004 reported by Nwafili and Gao (2007), which considers also coastal fishers operating within 5 nautical miles from the coast. Therefore, further information might be required to clarify if coastal fishers are also reported within the official national statistics used for the compilation of social indicators.
4.1.8 Description of nutritional indicators in nine African countriesThis section presents the estimated values of two nutritional indicators compiled for nine African countries (Figure 19) and discusses major data issues. The section provides a brief overview on how these indicators can be used to improve our understanding of the nutritional contributions of water use by inland capture fisheries and aquaculture activities.
Benin records the lowest value of “fish protein supplied by inland fish production” at about 3 000 tonnes/year, but the highest value in “fish-protein water productivity” (10 kg/ha) among the analysed African countries. The “fish-protein water productivity” is likely to be inflated by an underestimation of the “inland water area and aquaculture pond area”, which also has influenced a likely overestimation in other economic and social indicators.
In Cameroon, the “fish protein supplied by inland fish production” is estimated at about 8 000 tonnes/year. Currently, in Cameroon, aquaculture is little developed and
FIGURE 19Comparison of nutritional indicators in nine African countries
0
5
10
15
20
0
15
30
45
60
Benin Cameroon Chad Congo Democratic Republic of the Congo
Ghana Malawi Mali Nigeria
Kg/ha Thousand tonnes
Official estimate Non-official
Lowest estimate Highest estimate
Ffis
h pr
otei
n su
pplie
d by
inla
nd fi
sh p
rodu
ctio
n
Fish
-pro
tein
wat
er p
rodu
ctiv
ity
51Implementation
provides only a small contribution to this overall protein supply. The “fish-protein water productivity” is estimated at about 6 kg of proteins per hectare of water and is mainly provided through inland capture fisheries production.
In Chad, the “fish protein supplied by inland fish production” of 10 000 tonnes/year only represents inland capture fisheries production since there are no official statistics on aquaculture production. The “fish-protein water productivity” of 1 kg of proteins per hectare of water is as low as that recorded for the Congo and the Democratic Republic of the Congo. However, for the Democratic Republic of the Congo, the “fish-protein water productivity” could have been affected by both an underestimate of the inland capture fisheries production, which likely does not fully take into account fish production from the Chari-Logone floodplain, and an overestimate of the “seasonally flooded areas” within the “inland water area”.
The Congo shows one of the lowest estimates of both the “fish protein supplied by inland fish production” (4 000 tonnes) and the “fish-protein water productivity” (less than 1 kg/ha) among the analysed African countries. The Congo seems an outlier in the group of analysed African countries when considering the large extent of available surface waters and the relatively low amount of fish extracted by these waters. This could be due in part to the relatively low recorded number of inland fishers in the country, but given the importance of fishing activities for subsistence it is more likely that, as also suggested by Welcomme and Lymer (2012), there has been a large underreporting in the official statistics related to inland capture fisheries production.
The Democratic Republic of the Congo is characterized by an estimated “inland water area and aquaculture pond area” four times higher than that estimated for the Congo, while the “fish protein supplied by inland fish production” of about 24 000 tonnes is seven times higher than that estimated for the Congo. The difference in the amount of proteins can be due to both a higher inland capture fisheries production and a higher average density of fishers and aquaculture farmers in the Democratic Republic of the Congo compared with the Congo. Despite this difference, the “fish-protein water productivity” of the Democratic Republic of the Congo is about 1 kg of proteins per hectare of water. As in the case of the Congo, this low value seems likely to be driven by an underreporting in the official statistics related to inland capture fisheries production.
Ghana shows a large discrepancy between the official statistics and non-official estimates of inland capture fisheries production: non-official estimates are about three times the official statistics of capture fisheries production. This variability is also reflected in the “fish protein supplied by inland fish production”, whose estimates span between 11 000 and 31 000 tonnes. Similarly, the “fish-protein water productivity” is estimated to be between 7 and 20 kg of proteins per hectare of water; the highest value is questioned given the large difference in value from all other analysed African countries.
In Malawi, the “fish protein supplied by inland fish production” is estimated at nearly 10 000 tonnes/year. The corresponding “fish-protein water productivity” is about 3 kg of proteins per hectare of water. In Malawi, the assessment of the “inland water area and aquaculture pond area” and the official statistics of “inland fish production” are considered quite accurate. Therefore, the low “fish-protein water productivity” is mainly due to the fact that the country is characterized by large lakes and dominated by the huge water area covered by Lake Malawi. As in the case of “fish water productivity – quantity”, the “fish-protein water productivity” is a national average figure, which particularly in Malawi, is not likely to be representative of the fish-water productivity values recorded at the local level.
In Mali, the “fish protein supplied by inland fish production” is estimated to be between 11 000 and 17 000 tonnes/year. The range of values of this indicator is

Assessing water availability and economic, social and nutritional contributions from inland capture fisheries and aquaculture52
determined by the variability between official statistics and non-official estimates of the “inland fish production”. The “fish-protein water productivity” is estimated to be between 3 and 5 kg of proteins per hectare of water and this value is similar to that estimated for Cameroon.
Nigeria shows the highest value in the “fish protein supplied by inland fish production”, estimated at nearly 54 000 tonnes/year. The estimated “fish-protein water productivity” is estimated at about 9 kg of proteins per hectare of water, one of the highest values among the analysed African countries. This pattern is expected given the significant aquaculture production in Nigeria and the high value of “fish-water productivity – quantity” compared with other analysed African countries.
4.2 IMPLEMENTATION OF COMPILED INDICATORS FOR ASIAN COUNTRIES4.2.1 Overview of the water availability indicators in nine Asian countriesThe assessment of the “inland water area” varies greatly among the analysed Asian countries due to the great diversity and size of water resources that characterizes the different countries (Figure 20).
In absolute terms, China, Myanmar and India are characterized by values of the “inland water area” indicator that are notably higher than Bangladesh, Viet Nam, Thailand and Cambodia; the Lao People’s Democratic Republic and Sri Lanka record the lowest “inland water area” values.
China has the largest country area and is noted for its tremendous climatic diversity, in which massive water resources are unevenly distributed and mostly concentrated in the southern and eastern part of the country. The inventory of water resources over such a huge country area is challenging, and therefore is likely that only major surface waters are reflected in available statistics used to compile the “inland water indicator”. A similar problem affects the assessment of water resources in India, which is endowed with varied topographical and climatic zones, ranging from the Northern Mountains comprising the Himalayan ranges, to the Central Highlands consisting of a wide hilly area, to the Great Plains traversed by the Indus, Ganga and Brahmaputra river systems. Bangladesh is characterized by less climatic and topographic diversity since it is basically constituted by the alluvial delta of the Ganges-Padma, Meghna and Jamuna-Brahmaputra Rivers and their tributaries. Myanmar, Cambodia, the Lao People’s Democratic Republic and Viet Nam belong to the Mekong River Basin, which represents the longest river in southeastern Asia renowned for its seasonal flow fluctuations, a diversity of associated inundated wetlands and a vast delta forming before its waters flow into the South China Sea. Sri Lanka is a tropical island
FIGURE 20“Inland water area” in nine Asian countries
0
100
200
300
400
Bangladesh Cambodia China India Lao People's
Democratic Republic
Myanmar Sri Lanka Thailand Viet Nam
Thousand km2
Available estimate
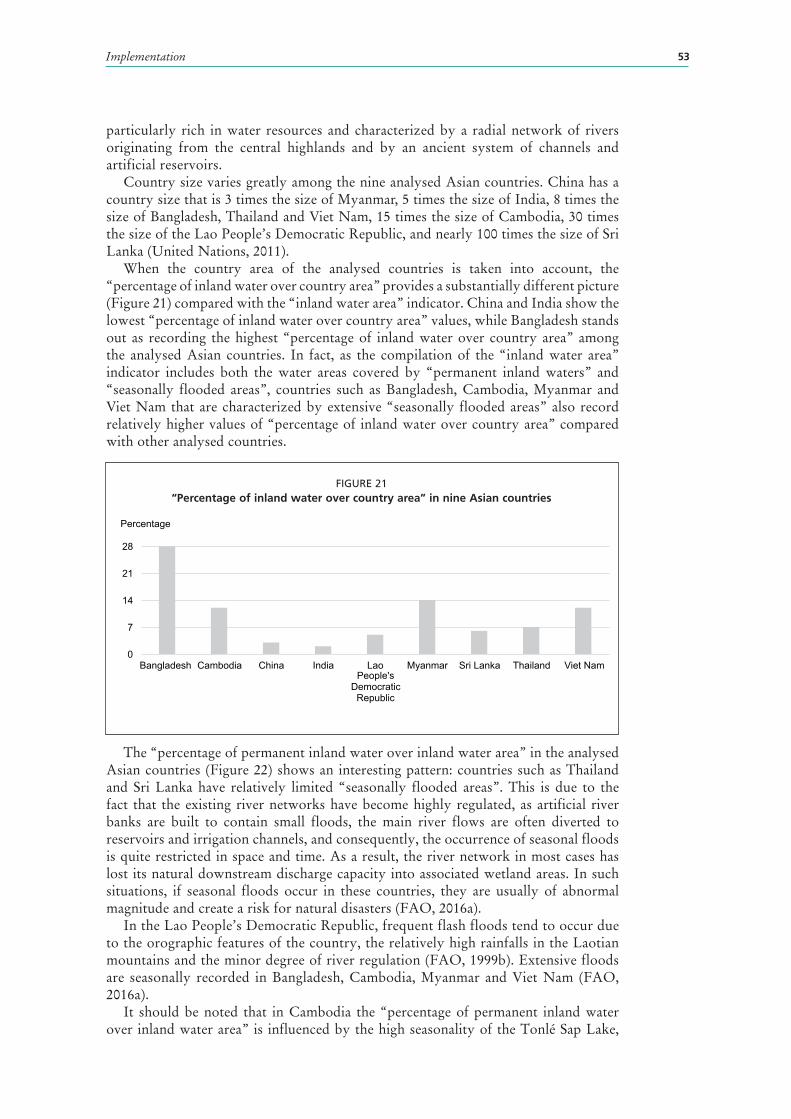
53Implementation
particularly rich in water resources and characterized by a radial network of rivers originating from the central highlands and by an ancient system of channels and artificial reservoirs.
Country size varies greatly among the nine analysed Asian countries. China has a country size that is 3 times the size of Myanmar, 5 times the size of India, 8 times the size of Bangladesh, Thailand and Viet Nam, 15 times the size of Cambodia, 30 times the size of the Lao People’s Democratic Republic, and nearly 100 times the size of Sri Lanka (United Nations, 2011).
When the country area of the analysed countries is taken into account, the “percentage of inland water over country area” provides a substantially different picture (Figure 21) compared with the “inland water area” indicator. China and India show the lowest “percentage of inland water over country area” values, while Bangladesh stands out as recording the highest “percentage of inland water over country area” among the analysed Asian countries. In fact, as the compilation of the “inland water area” indicator includes both the water areas covered by “permanent inland waters” and “seasonally flooded areas”, countries such as Bangladesh, Cambodia, Myanmar and Viet Nam that are characterized by extensive “seasonally flooded areas” also record relatively higher values of “percentage of inland water over country area” compared with other analysed countries.
The “percentage of permanent inland water over inland water area” in the analysed Asian countries (Figure 22) shows an interesting pattern: countries such as Thailand and Sri Lanka have relatively limited “seasonally flooded areas”. This is due to the fact that the existing river networks have become highly regulated, as artificial river banks are built to contain small floods, the main river flows are often diverted to reservoirs and irrigation channels, and consequently, the occurrence of seasonal floods is quite restricted in space and time. As a result, the river network in most cases has lost its natural downstream discharge capacity into associated wetland areas. In such situations, if seasonal floods occur in these countries, they are usually of abnormal magnitude and create a risk for natural disasters (FAO, 2016a).
In the Lao People’s Democratic Republic, frequent flash floods tend to occur due to the orographic features of the country, the relatively high rainfalls in the Laotian mountains and the minor degree of river regulation (FAO, 1999b). Extensive floods are seasonally recorded in Bangladesh, Cambodia, Myanmar and Viet Nam (FAO, 2016a).
It should be noted that in Cambodia the “percentage of permanent inland water over inland water area” is influenced by the high seasonality of the Tonlé Sap Lake,
FIGURE 21“Percentage of inland water over country area” in nine Asian countries
0
7
14
21
28
Bangladesh Cambodia China India Lao People's
Democratic Republic
Myanmar Sri Lanka Thailand Viet Nam
Percentage
Available estimate
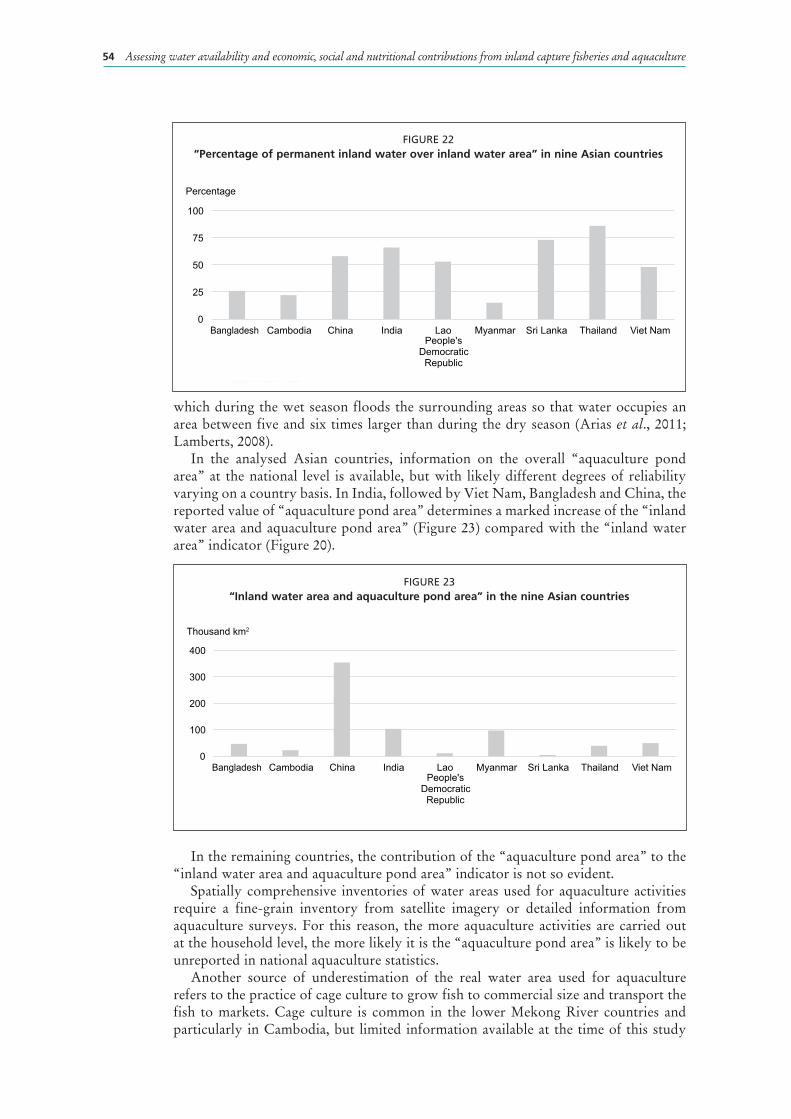
Assessing water availability and economic, social and nutritional contributions from inland capture fisheries and aquaculture54
which during the wet season floods the surrounding areas so that water occupies an area between five and six times larger than during the dry season (Arias et al., 2011; Lamberts, 2008).
In the analysed Asian countries, information on the overall “aquaculture pond area” at the national level is available, but with likely different degrees of reliability varying on a country basis. In India, followed by Viet Nam, Bangladesh and China, the reported value of “aquaculture pond area” determines a marked increase of the “inland water area and aquaculture pond area” (Figure 23) compared with the “inland water area” indicator (Figure 20).
In the remaining countries, the contribution of the “aquaculture pond area” to the “inland water area and aquaculture pond area” indicator is not so evident.
Spatially comprehensive inventories of water areas used for aquaculture activities require a fine-grain inventory from satellite imagery or detailed information from aquaculture surveys. For this reason, the more aquaculture activities are carried out at the household level, the more likely it is the “aquaculture pond area” is likely to be unreported in national aquaculture statistics.
Another source of underestimation of the real water area used for aquaculture refers to the practice of cage culture to grow fish to commercial size and transport the fish to markets. Cage culture is common in the lower Mekong River countries and particularly in Cambodia, but limited information available at the time of this study
FIGURE 22“Percentage of permanent inland water over inland water area” in nine Asian countries
0
25
50
75
100
Bangladesh Cambodia China India Lao People's
Democratic Republic
Myanmar Sri Lanka Thailand Viet Nam
Percentage
Available estimate
FIGURE 23“Inland water area and aquaculture pond area” in the nine Asian countries
0
100
200
300
400
Bangladesh Cambodia China India Lao People's
Democratic Republic
Myanmar Sri Lanka Thailand Viet Nam
Thousand km2
Available estimate
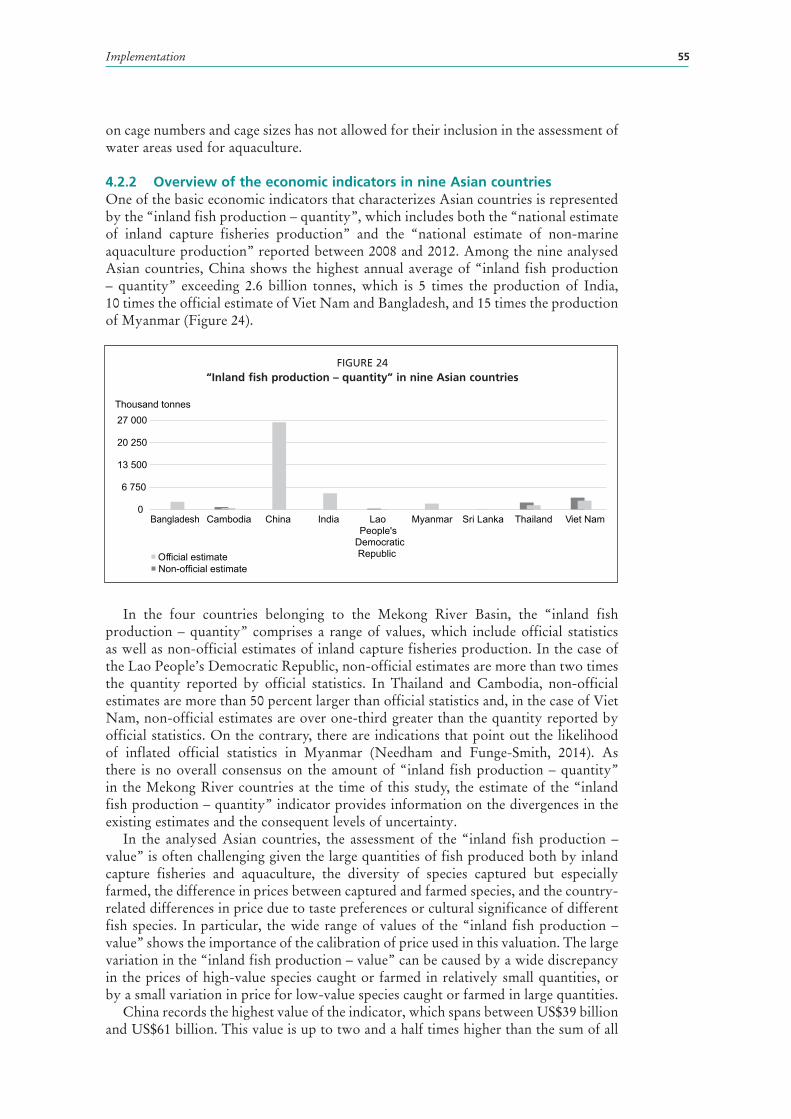
55Implementation
on cage numbers and cage sizes has not allowed for their inclusion in the assessment of water areas used for aquaculture.
4.2.2 Overview of the economic indicators in nine Asian countriesOne of the basic economic indicators that characterizes Asian countries is represented by the “inland fish production – quantity”, which includes both the “national estimate of inland capture fisheries production” and the “national estimate of non-marine aquaculture production” reported between 2008 and 2012. Among the nine analysed Asian countries, China shows the highest annual average of “inland fish production – quantity” exceeding 2.6 billion tonnes, which is 5 times the production of India, 10 times the official estimate of Viet Nam and Bangladesh, and 15 times the production of Myanmar (Figure 24).
In the four countries belonging to the Mekong River Basin, the “inland fish production – quantity” comprises a range of values, which include official statistics as well as non-official estimates of inland capture fisheries production. In the case of the Lao People’s Democratic Republic, non-official estimates are more than two times the quantity reported by official statistics. In Thailand and Cambodia, non-official estimates are more than 50 percent larger than official statistics and, in the case of Viet Nam, non-official estimates are over one-third greater than the quantity reported by official statistics. On the contrary, there are indications that point out the likelihood of inflated official statistics in Myanmar (Needham and Funge-Smith, 2014). As there is no overall consensus on the amount of “inland fish production – quantity” in the Mekong River countries at the time of this study, the estimate of the “inland fish production – quantity” indicator provides information on the divergences in the existing estimates and the consequent levels of uncertainty.
In the analysed Asian countries, the assessment of the “inland fish production – value” is often challenging given the large quantities of fish produced both by inland capture fisheries and aquaculture, the diversity of species captured but especially farmed, the difference in prices between captured and farmed species, and the country-related differences in price due to taste preferences or cultural significance of different fish species. In particular, the wide range of values of the “inland fish production – value” shows the importance of the calibration of price used in this valuation. The large variation in the “inland fish production – value” can be caused by a wide discrepancy in the prices of high-value species caught or farmed in relatively small quantities, or by a small variation in price for low-value species caught or farmed in large quantities.
China records the highest value of the indicator, which spans between US$39 billion and US$61 billion. This value is up to two and a half times higher than the sum of all
FIGURE 24“Inland fish production – quantity” in nine Asian countries
0
6 750
13 500
20 250
27 000
Bangladesh Cambodia China India Lao People's
DemocraticRepublic
Myanmar Sri Lanka Thailand Viet Nam
Thousand tonnes
Non-official estimate Official estimate
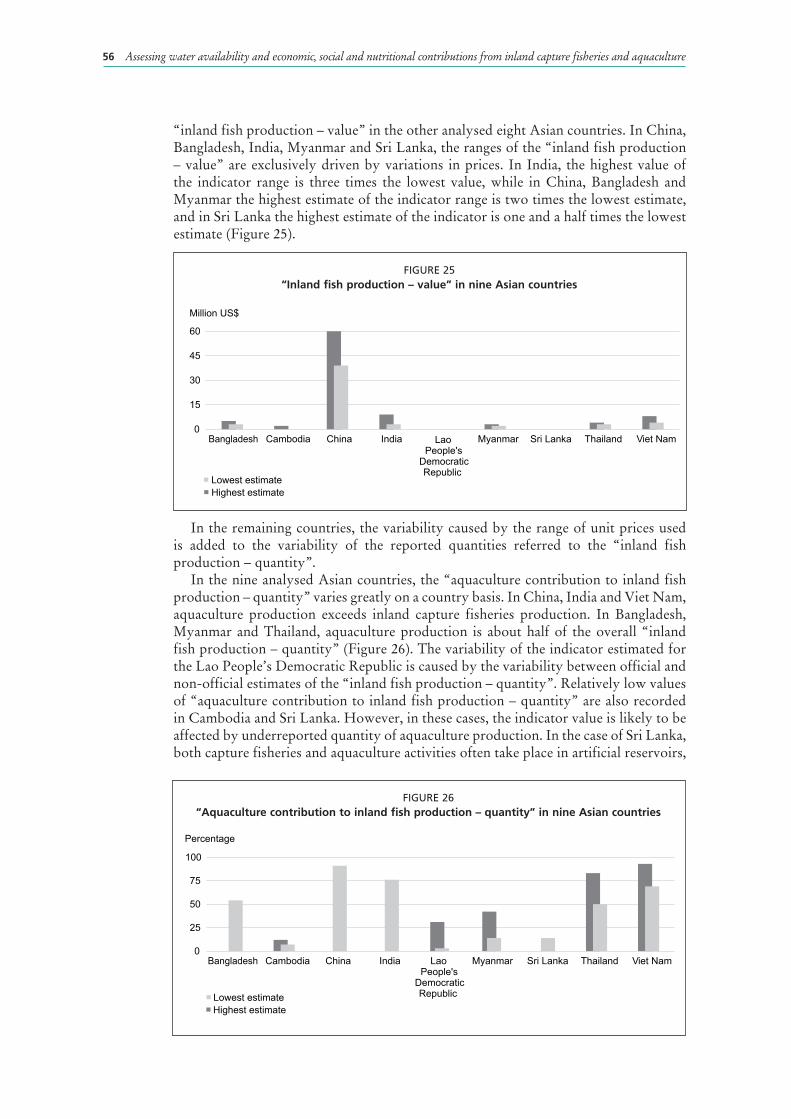
Assessing water availability and economic, social and nutritional contributions from inland capture fisheries and aquaculture56
“inland fish production – value” in the other analysed eight Asian countries. In China, Bangladesh, India, Myanmar and Sri Lanka, the ranges of the “inland fish production – value” are exclusively driven by variations in prices. In India, the highest value of the indicator range is three times the lowest value, while in China, Bangladesh and Myanmar the highest estimate of the indicator range is two times the lowest estimate, and in Sri Lanka the highest estimate of the indicator is one and a half times the lowest estimate (Figure 25).
In the remaining countries, the variability caused by the range of unit prices used is added to the variability of the reported quantities referred to the “inland fish production – quantity”.
In the nine analysed Asian countries, the “aquaculture contribution to inland fish production – quantity” varies greatly on a country basis. In China, India and Viet Nam, aquaculture production exceeds inland capture fisheries production. In Bangladesh, Myanmar and Thailand, aquaculture production is about half of the overall “inland fish production – quantity” (Figure 26). The variability of the indicator estimated for the Lao People’s Democratic Republic is caused by the variability between official and non-official estimates of the “inland fish production – quantity”. Relatively low values of “aquaculture contribution to inland fish production – quantity” are also recorded in Cambodia and Sri Lanka. However, in these cases, the indicator value is likely to be affected by underreported quantity of aquaculture production. In the case of Sri Lanka, both capture fisheries and aquaculture activities often take place in artificial reservoirs,
FIGURE 25“Inland fish production – value” in nine Asian countries
0
15
30
45
60
Bangladesh Cambodia China India Myanmar Sri Lanka Thailand Viet Nam
Million US$
Highest estimate Lowest estimate
LaoPeople's
DemocraticRepublic
FIGURE 26“Aquaculture contribution to inland fish production – quantity” in nine Asian countries
0
25
50
75
100
Bangladesh Cambodia China India LaoPeople's
DemocraticRepublic
Myanmar Sri Lanka Thailand Viet Nam
Percentage
Highest estimate Lowest estimate

57Implementation
which could hamper a clear distinction on the source of fish production in official statistics. Similarly, in Cambodia, a proportion of aquaculture production from cages and pens is likely to be unreported and/or accounted within inland capture fisheries production.
The assessment of the “aquaculture contribution to inland fish production – value” includes both the quantity of aquaculture production and the prices of the farmed species. In China, Cambodia and Myanmar, wild caught fish species have higher prices than farmed fish species. In the other analysed countries, this price trend seems reversed, as high-value species are constituted by shrimps, crabs and prawns and other fish species with high commercial value, which are often farmed in significant quantities (FAO, 2016a).
In Bangladesh, China, India, Myanmar and Sri Lanka, the range of values of the “aquaculture contribution to inland fish production – value” is driven by variations in prices. In Myanmar and Sri Lanka, the difference between the lowest estimate and the highest estimate of the “aquaculture contribution to inland fish production – quantity” varies, respectively, between 7 and 10 percent. Among the nine Asian countries, the largest variations in “aquaculture contribution to inland fish production – value” occur in Cambodia and in the Lao People’s Democratic Republic, where the divergence in the estimates of the “aquaculture contribution to inland fish production – quantity” is further amplified by the variations in prices (Figure 27).
Among the Asian countries, higher values of “fish-water productivity – quantity” are recorded in countries such as China, Viet Nam, Bangladesh and India (Figure 28), which also show the highest estimates for the “aquaculture contribution to inland fish production”. The slightly lower value of “fish-water productivity – quantity” in India, compared with Bangladesh and Viet Nam (lowest estimate), is likely to be influenced by a more accurate assessment of the “aquaculture pond area” in India. Countries of the Lower Mekong Basin, for which the “inland fish production – quantity” estimates contain a range of values, also have a range of values constituting the “fish-water productivity” indicators. By considering the non-official estimate of the “inland fish production – quantity”, the resulting “fish-water productivity – quantity” of Viet Nam equals that of China and the “fish-water productivity” of Thailand equals that of Bangladesh.
In the analysed Asian countries, China and Viet Nam record the highest “fish-water productivity – value” estimates due to the production of high quantities of farmed species with high commercial value (Figure 29). The estimated “fish-water productivity – value” in China is significantly higher than that in India. This pattern is influenced
FIGURE 27“Aquaculture contribution to inland fish production – value” in nine Asian countries
0
25
50
75
100
Bangladesh Cambodia China India Myanmar Sri Lanka Thailand Viet Nam
Percentage
Highest estimate Lowest estimate
LaoPeople's
DemocraticRepublic

Assessing water availability and economic, social and nutritional contributions from inland capture fisheries and aquaculture58
by the higher “fish-water productivity – quantity” shown by China compared with that of India, but also by the higher unit prices reported for China compared with those reported for India. On the other hand, the Lao People’s Democratic Republic, Myanmar and Sri Lanka are characterized by low “fish-water productivity” quantities and relatively low unit prices, resulting in the lower “fish-water productivity – value”. The current estimates of “fish-water productivity – value” point out the need to confirm these trends with more finely calibrated unit prices in all analysed Asian countries, but particularly in China and Thailand.
4.2.3 Overview of the social indicators in nine Asian countriesThe comprehensiveness of the information related to the “overall number of inland fishers and aquaculture farmers” varies on a country basis. In most analysed Asian countries, official statistics are sparse and, therefore, the indicator is compiled with available information often comprised of a range of values including official statistics and non-official estimates. The highest estimates of “overall number of inland fishers and aquaculture farmers” are recorded in China and India, followed by Bangladesh and then the Lower Mekong countries (Figure 30). The value of this indicator could be improved with increased data availability from national surveys, assessing employment along the fisheries and aquaculture value chains in the analysed Asian countries.
The “average density of overall inland fishers and aquaculture farmers” measures, on average, how many people per square kilometre of available water resources rely on primary production through fishing and aquaculture activities (Figure 31). In most analysed Asian countries, the indicator comprises a range of values referring to
FIGURE 28“Fish-water productivity – quantity” in nine Asian countries
0
200
400
600
800
Bangladesh Cambodia China India Myanmar Sri Lanka Thailand Viet Nam
Kg/ha
Highest estimate Lowest estimate
LaoPeople's
DemocraticRepublic
FIGURE 29“Fish-water productivity – value” in nine Asian countries
0
450
900
1 350
1 800
Bangladesh Cambodia China India Myanmar Sri Lanka Thailand Viet Nam
US$/ha
Highest estimate Lowest estimate
LaoPeople's
DemocraticRepublic

59Implementation
official statistics and non-official estimates of the “overall number of inland fishers and aquaculture farmers”. The widest value range of the indicator is recorded in the Lao People’s Democratic Republic, where the widest discrepancy on available estimates occurs. In fact, since 1990, the official statistics of the “overall number of inland fishers and aquaculture farmers” have reported the same figure, which, therefore, is not likely to represent a current value; the non-official estimate seems to provide an anomalous high value of “average density of overall inland fishers and aquaculture farmers” compared with other countries. The indicator shows higher densities recorded in India, Bangladesh, Thailand and Viet Nam compared with the rest of the analysed countries. In Cambodia, given the area of the Tonlé Sap system, the “average density of overall inland fishers and aquaculture farmers” seems an anomalous value. Considering the high fish-water productivity of Tonlé Sap, one would expect a large share of the population to rely on fishing activities for their livelihoods and, hence, a higher estimate of the “average density of overall inland fishers and aquaculture farmers”. Similarly, the “average density of overall inland fishers and aquaculture farmers” for China appears quite low given high population densities and the popularity of fishing and aquaculture activities in the country.
FIGURE 30“Overall number of inland fishers and aquaculture farmers” in nine Asian countries
0
3 250
6 500
9 750
13 000
Bangladesh Cambodia China India Lao People's
Democratic Republic
Myanmar Sri Lanka Thailand Viet Nam
Thousand people
Highest estimateLowest estimate
0
40
80
120
160
Bangladesh Cambodia China India Lao People's
Democratic Republic
Myanmar Sri Lanka Thailand Viet Nam
People/km2
Highest estimate Lowest estimate
FIGURE 31“Average density of overall inland fishers and aquaculture farmers” in nine Asian countries

Assessing water availability and economic, social and nutritional contributions from inland capture fisheries and aquaculture60
4.2.4 Overview of the nutritional indicators in nine Asian countries In the analysed nine Asian countries, both inland capture fisheries and aquaculture production contribute significantly to the “fish protein supplied by inland fish production”, but in different proportions according to the country considered. Aquaculture provides a major contribution to the “fish protein supplied by inland fish production” in Bangladesh, China, India, Thailand and Viet Nam. In most analysed Asian countries, information on the composition of “inland fish production” in terms of freshwater and diadromous fish, crustaceans and molluscs is available and this has allowed to consider the protein supply by group of species and, ultimately, to provide a more accurate assessment of the “fish protein supplied by inland fish production” indicator (Figure 32).
Among the analysed nine Asian countries, the annual “fish-protein water productivity” is estimated to be between 11 and 78 kg per hectare (Figure 33). The amount of “fish-protein water productivity” is directly related to the “fish-water productivity” and shows a similar pattern and a similar ranking among countries. However, the narrow range of this indicator and the cross-country comparison suggest that the anomalously high value of “fish-protein water productivity” shown by Thailand could be the result of an overestimate of the non-official estimate of the “inland fish production – quantity”. On the contrary, the highest value of the range
0
700
1 400
2 100
2 800
Bangladesh Cambodia China India MyanmarLaoPeople's
DemocraticRepublic
Sri Lanka Thailand Viet Nam
Thousand tonnes
Highest estimateLowest estimate
FIGURE 32“Fish protein supplied by inland fish production” in nine Asian countries
0
20
40
60
80
Bangladesh Cambodia China India Lao People's
Democratic Republic
Myanmar Sri Lanka Thailand Viet Nam
Kg/ha
Highest estimate Lowest estimate
FIGURE 33“Fish-protein water productivity” in nine Asian countries
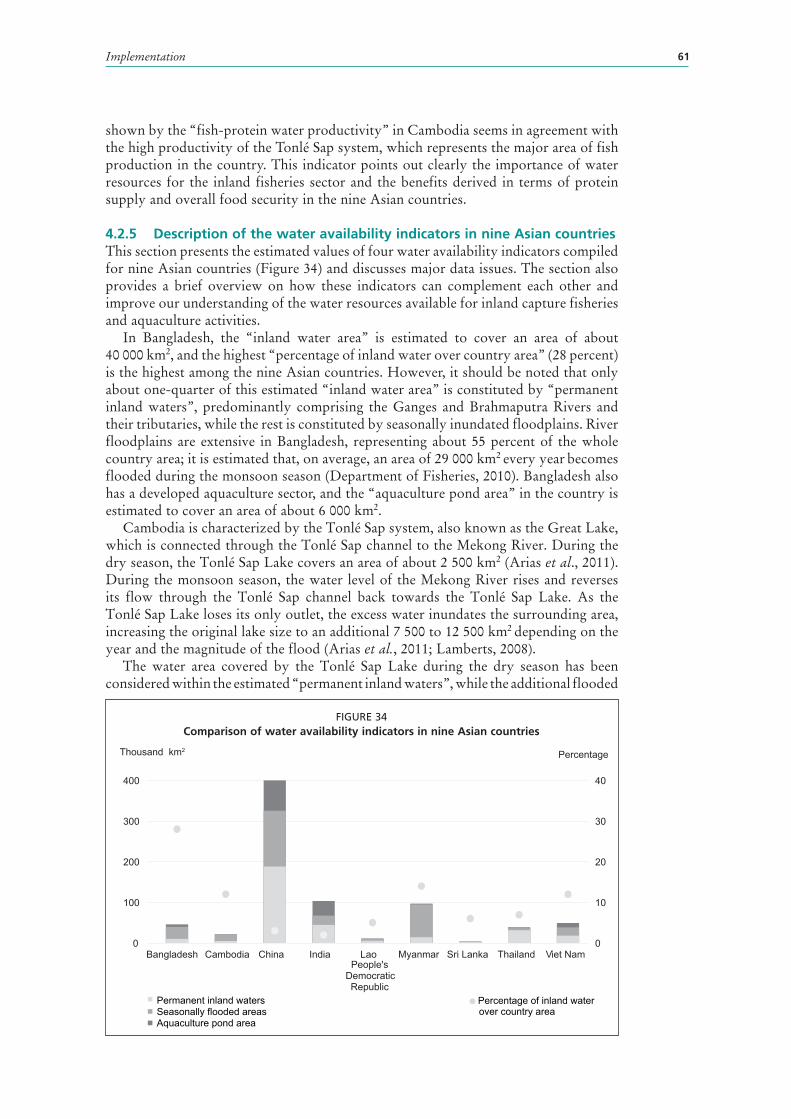
61Implementation
shown by the “fish-protein water productivity” in Cambodia seems in agreement with the high productivity of the Tonlé Sap system, which represents the major area of fish production in the country. This indicator points out clearly the importance of water resources for the inland fisheries sector and the benefits derived in terms of protein supply and overall food security in the nine Asian countries.
4.2.5 Description of the water availability indicators in nine Asian countriesThis section presents the estimated values of four water availability indicators compiled for nine Asian countries (Figure 34) and discusses major data issues. The section also provides a brief overview on how these indicators can complement each other and improve our understanding of the water resources available for inland capture fisheries and aquaculture activities.
In Bangladesh, the “inland water area” is estimated to cover an area of about 40 000 km2, and the highest “percentage of inland water over country area” (28 percent) is the highest among the nine Asian countries. However, it should be noted that only about one-quarter of this estimated “inland water area” is constituted by “permanent inland waters”, predominantly comprising the Ganges and Brahmaputra Rivers and their tributaries, while the rest is constituted by seasonally inundated floodplains. River floodplains are extensive in Bangladesh, representing about 55 percent of the whole country area; it is estimated that, on average, an area of 29 000 km2 every year becomes flooded during the monsoon season (Department of Fisheries, 2010). Bangladesh also has a developed aquaculture sector, and the “aquaculture pond area” in the country is estimated to cover an area of about 6 000 km2.
Cambodia is characterized by the Tonlé Sap system, also known as the Great Lake, which is connected through the Tonlé Sap channel to the Mekong River. During the dry season, the Tonlé Sap Lake covers an area of about 2 500 km2 (Arias et al., 2011). During the monsoon season, the water level of the Mekong River rises and reverses its flow through the Tonlé Sap channel back towards the Tonlé Sap Lake. As the Tonlé Sap Lake loses its only outlet, the excess water inundates the surrounding area, increasing the original lake size to an additional 7 500 to 12 500 km2 depending on the year and the magnitude of the flood (Arias et al., 2011; Lamberts, 2008).
The water area covered by the Tonlé Sap Lake during the dry season has been considered within the estimated “permanent inland waters”, while the additional flooded
0
10
20
30
40
0
100
200
300
400
Bangladesh Cambodia China India Lao People's
Democratic Republic
Myanmar Sri Lanka Thailand Viet Nam
Percentage Thousand km2
Seasonally flooded areas Aquaculture pond area
Permanent inland waters Percentage of inland water over country area
FIGURE 34Comparison of water availability indicators in nine Asian countries

Assessing water availability and economic, social and nutritional contributions from inland capture fisheries and aquaculture62
extent during the monsoon season within the estimated “seasonally flooded areas” (FAO, 2016a). The overall “inland water area” is estimated to cover comprehensively an area of about 22 000 km2, which is 12 percent of the country area. The “percentage of permanent inland water over inland water area” shows that only 22 percent of the recorded “inland water area’ is constituted by “permanent inland waters”.
The “aquaculture pond area” is estimated to be less than 100 km2, and thus has no significant influence on the “inland water area and aquaculture pond area” indicator. However, official national statistics of areas used by aquaculture could be highly underestimated considering that in 2009 the number of aquaculture ponds was reported to be about 56 000 (Joffre et al., 2013). Cage aquaculture is also very common in Cambodia; in fact, in 2004 it was estimated that about 4 500 cages were in the Tonlé Sap area (So et al., 2005).
In China, the estimation of “inland water area” is very challenging due to the large country area (i.e. greater than 9.5 million km2). Despite the fact that the estimate of “inland water area” (325 000 km2) is one order of magnitude larger than the “inland water area” recorded in the other analysed Asian countries, the “percentage of inland water over country area” (3 percent) is among the lowest recorded values. This outcome accords with the fact that the vast part of China is occupied by arid rangelands, especially in the north of China and in the Qinghai-Tibetan Plateau.
China is characterized by impressive water resources, such as 22 rivers with a length of over 1 000 km and 2 800 lakes with a surface area above 1 km2 (Chen, Li and Wang, 2010), which are likely to be accounted for in the reported statistics used for the compilation of the “inland water area”. There are also 50 000 rivers with watershed areas exceeding 100 km2 and a vast number of waterbodies (Chen, Li and Wang, 2010), as China is considered the country with the highest number of lakes. However, it is not known to what extent the minor water resources are reflected in the available official statistics reported by the National Bureau of Statistics of China (2012) that have been used to estimate the “permanent inland waters” and that consequently influence the estimate of the “inland water area” and other related indicators.
In India, the “inland water area” is estimated to cover an area of 67 500 km2, which constitutes only a minor portion of the country area (2 percent). Despite the occurrence of dry areas in the western part of the country, the value assessed for the “inland water area” indicator is likely to be underestimated. The major source of this underestimation is determined by the river component, which, by using a GIS source at low spatial resolution maps an area of 10 700 km2 (Lehner and Doll, 2004). However, this extent is unlikely to represent the existing network of river and canals characterized by a length of 29 000 km and 173 290 km, respectively (Sugunan, 1997; Sugunan, 2010). Substantial uncertainty also exists regarding the estimate of “seasonally flooded areas”, as the flood-prone areas of 23 000 km2 along the Ganges and Brahmaputra Rivers reported by Tockner and Standford (2002) need to be confirmed.
The Lao People’s Democratic Republic is characterized by the occurrence of the Mekong River, which flows in the country for about 1 900 km, and for about 1 200 km delimitates the border with Thailand and Myanmar (Phonvisay, 2013). Given the predominance of rivers, the “permanent inland waters” indicator is likely to be underestimated. Both “permanent inland waters” and “seasonally flooded areas” are estimated on the basis of available GIS data sources at low spatial resolution (Lehner and Doll, 2004), and the likely underestimation probably concurs in determining a low value of the “inland water area” (11 000 km2) as well as the “percentage of inland water over country area” (5 percent).
Myanmar is characterized by vast river networks: while the Mekong River flows for about 5 000 km at the borders between Myanmar and the Lao People’s Democratic Republic, the Ayeyarwady River crosses the country for its whole length creating the major riverine floodplain in the country. The estimate of the “inland water area”

63Implementation
(95 200 km2) is impressive in absolute terms, but represents only 14 percent of the country area as Myanmar is the largest country within the Mekong River Basin (a slightly larger area than Thailand, two times the country area of Viet Nam, three times that of the Lao People’s Democratic Republic and four times that of Cambodia) (United Nations, 2011). Moreover, the “percentage of permanent inland water over inland water area” is the smallest (15 percent) among all analysed Asian countries. This is due to the fact that the largest share (85 percent) of “inland water area” is constituted by “seasonally flooded areas”, which are particularly found within the Ayeyarwady floodplain.
In Myanmar, it is reported that more than 60 000 km2 of floodplains usually remain inundated four to five months every year (Oo, 2002). This impressive flooding pattern has created a system of lease fisheries, where fenced fishing grounds are found particularly along the banks of the Ayeyarwady River and leaseholders have exclusive fishing rights to their own fishing ground (Coates, 2002).
Sri Lanka is characterized by the occurrence of more than 100 rivers, an ancient system of reservoirs built for irrigation and some lagoons and estuaries on the coast (National Aquaculture Development Authority of Sri Lanka, 2010). Considering that Sri Lanka is an island, it is relatively rich in freshwater and brackish-water resources. The “percentage of inland water over country area” of about 6 percent is considered to be among one of the largest land-water ratios recorded in terms of an island (Joseph, 2004). Moreover, it should be noted that the current assessment of “inland water area” does not include the river component for which there is no estimate on the extent of open waters. Similarly, there is no information on “seasonally flooded areas” besides the area of 40 km2 of vegetated land areas (“villus”) in connection to the main river and seasonally saturated with water (FAO, 2016a). Consequently, the “percentage of permanent inland water over inland water area” is one of the highest among the analysed countries.
In Thailand, the “inland water area” is estimated to cover an area of about 37 000 km2, which includes a predominance (86 percent) of “permanent inland waters”. In Thailand, there are 13 major lakes and 47 major rivers, which have been diverted to create an impressive network of canals in connection with a very high number of reservoirs of different sizes (Lymer et al., 2008). Thus, the river network has been highly regulated and, consequently, seasonal floods are often controlled and are quite restricted in space and time. In addition, the Central Plains region, mainly formed by the Chao Phraya River and its tributaries, is made up of marshy alluvial floodplains, which would be naturally constituted by wetlands or seasonally flooded areas, but over time have been mainly transformed into cultivated areas.
Floods still occur in the Central Plains, but their natural occurrence and connection with the fisheries activities is limited and restricted to some specific areas, such as along the Songkhram River Basin (Blake, 2006). On the contrary, when major floods occur in the Central Plains, despite the hydrological regulating system in place, floods usually result in natural catastrophes creating major damages and losses. It should be noted that the available information used to estimate the “inland water area” indicator referred to a survey carried out in 1996–1999 (OEPP, 1999). A further increase in the area covered by reservoirs and further reduction of “seasonally flooded areas” might have occurred in the country.
Viet Nam is characterized by the occurrence of nine major river systems, including the Mekong River, with a catchment size exceeding 10 000 km2 (An, Le Ahn and Binh, 2006). The assessment of the open waters of river systems might have been underestimated in reported available figures of inland waters. In fact, the “inland water area” is estimated to cover an area of 39 000 km2, which includes a significant component of “aquaculture pond area” (about 11 000 km2). However, the “percentage of permanent inland water over inland water area” (47 percent) is relatively low when considering the large size of these nine river catchments. The major “seasonally flooded

Assessing water availability and economic, social and nutritional contributions from inland capture fisheries and aquaculture64
areas” are reported along the Mekong and Red Rivers and their deltas. Their estimation is complicated by the fact that the hydrological regimes of both the Mekong River and the Red River have been severely altered by the dense network of canals built for agriculture.
4.2.6 Description of the economic indicators in nine Asian countriesThis section presents the estimated values of six economic indicators compiled for nine Asian countries (Figure 35) and discusses major data issues. The section also provides a brief overview on how these indicators can complement each other and improve our understanding of the economic contributions of water use by inland capture fisheries and aquaculture activities.
In Bangladesh, the “inland fish production – quantity” is estimated at over 2 million tonnes per year with an estimated value between US$3 billion and US$5 billion. Aquaculture contributes about half of the “inland fish production” in quantity (54 percent) and in value (from 58 to 60 percent). Aquaculture is mainly pond-based polyculture and the official “aquaculture pond area” is estimated to be about 6 100 km2, but aquaculture is also carried out in large reservoirs, such as Kaptai Lake and in the oxbow lakes, especially in southwest Bangladesh. The estimated “fish-water productivity – quantity” is within the range of the annual fish-water productivity recorded in natural floodplains (215–618 kg/ha), and also within the same order of magnitude of the “fish-water productivity” characterizing extensive aquaculture (410–770 kg/ha) (Rahaman et al., 2012) and oxbow lakes (780 kg/ha) (FAO, 2005–2016a). The wide range of values estimated for “fish-water productivity – value” (ranging from US$682 to US$1 058 per hectare) is also influenced by the use of unit prices of species with both low and high economic values.
In Cambodia, the “inland fish production – quantity” is estimated to be between 467 000 and 762 000 tonnes. The wide range of the indicator values is due to the divergence between official statistics and non-official estimates of “inland fish production”. Official statistics reported an average inland capture fisheries production of about 411 000 tonnes/year between 2008 and 2012, although van Zalinge (2002) argued that in 2000 national inland capture fisheries production was about 705 000 tonnes. Among the Lower Mekong River Basin countries, Cambodia aquaculture has contributed the least to total inland fish production quantity (from 7 to 12 percent) and value (from 3 to 31 percent).
In Cambodia, the Tonlé Sap system is renowned for its high fish-water productivity between 139–230 kg/ha (Nagabhatla and van Brakel, 2010). The “fish-water productivity” estimates vary from 212 to 345 kg/ha and from US$137 to US$934 per hectare, and are higher than those estimated for the Lao People’s Democratic Republic and Myanmar and lower than those estimated for Thailand and Viet Nam.
In China, the annual “inland fish production” is estimated at over 26 million tonnes with an estimated value between approximately US$39 billion and US$61 billion. China, which represents the number one aquaculture producer worldwide, shows one of the highest “aquaculture contribution to inland fish production” values in the countries analysed, which accounts for 91 percent of the overall “inland fish production – quantity”, as the average annual non-marine aquaculture production (24 million tonnes) is twelve times the inland capture fisheries production (2 million tonnes).
The “aquaculture pond area” is estimated to be about 29 000 km2 based on official statistics of 2011. This figure might be underestimated considering that pond culture is the most popular and most important farming system in China, and that canals and rice fields are also commonly used for aquaculture by rural farmers (FAO, 2005–2016b). As a basis for comparison, Hall et al. (2011) have estimated that carp production, which in 2008 amounted to 3 million tonnes, has occurred mainly in extensive aquaculture systems with an average annual intensity of 500 kg/ha. Should this assessment be

65Implementation
FIGURE 35Comparison of economic indicators in nine Asian countries
0
450
900
1 350
1 800
0
15
30
45
60
Bangladesh Cambodia China India Lao People's
Democratic Republic
Myanmar Sri Lanka Thailand Viet Nam
US$/ha Million US$
Highest estimate Lowest estimate
Highest estimate Lowest estimate
0
20
40
60
80
100
Bangladesh Cambodia China India Lao People's
Democratic Republic
Myanmar Sri Lanka Thailand Viet Nam
Percentage Percentage
Highest estimate Lowest estimate Lowest estimate
Highest estimate
0
50
100
0
7 000
14 000
21 000
28 000
Bangladesh Cambodia China India Lao People's
Democratic Republic
Myanmar Sri Lanka Thailand Viet Nam
Kg/ha Thousand tonnes
Non-official estimate Oficial estimate Lowest estimate
Highest estimate
Inla
nd fi
sh p
rodu
ctio
n –
valu
e
Inla
nd fi
sh w
ater
pro
duct
ivity
– v
alue
Aqua
cultu
re c
ontri
butio
n to
inla
nd fi
sh p
rodu
ctio
n –
quan
tity
Aqua
cultu
re c
ontri
butio
n to
inla
nd fi
sh p
rodu
ctio
n –
valu
e
Inla
nd fi
sh p
rodu
ctio
n –
quan
tity
Fish
-wat
er p
rodu
ctiv
ity –
qua
ntity
Assessing water availability and economic, social and nutritional contributions from inland capture fisheries and aquaculture66
correct, the resulting “aquaculture pond area” for the culture of carp would be about 67 000 km2, thus representing a doubling of current official statistics. The available estimate of “aquaculture pond area” in China is reported to be lower than the estimate for India. Therefore, the likely underestimate of the “inland water area and aquaculture ponds” has underpinned the high estimates of “fish-water productivity” of 746 kg/ha in quantity and between US$1 091 and US$1 718 per hectare in value. It should also be noted that relatively high producer prices have been used to compile the “fish-water productivity – value”. Therefore, a finer calibration of prices could partially decrease the current discrepancy of the “fish-water productivity – value” indicator between China and the rest of the analysed Asian countries.
In India, the annual “inland fish production” is estimated at almost 5 million tonnes with an estimated value between US$3 billion and US$9 billion. Aquaculture production contributes significantly to the “inland fish production” in terms of quantity (76 percent) and in value (73–81 percent), and the estimate of the average annual non-marine aquaculture production recorded between 2008 and 2012 is almost four times greater than the average annual inland capture fisheries production of about 1.1 million tonnes. In addition, among the nine Asian countries, India has the most detailed information available to estimate the “aquaculture pond area”, which in 2009 was reported to cover an area of about 36 000 km2 (FAO, 2016a). The “fish-water productivity” in terms of quantity (475 kg/ha) is similar to that of Bangladesh, while the “fish-water productivity” in terms of value (from US$294 to US$874 per hectare) is similar to the value range estimated for Cambodia. The reason for the relatively low “fish-water productivity – value” in India may stem from the fact that available information on the first-sale price of wild caught species is quite low (US$0.5–US$1 per kg) compared with prices reported for other Asian countries, in particular when compared with China (US$0.7–US$2.6 per kg).
In the Lao People’s Democratic Republic, the annual “inland fish production” is estimated to be between 115 000 and 267 000 tonnes with an estimated value between US$101 million and US$345 million. “Aquaculture contribution to inland fish production” varies widely, between 31 and 73 percent in quantity and between 36 and 84 percent in value. As in the case of Thailand, this discrepancy is mainly due to the divergence between official statistics and the non-official estimate of “inland fish production – quantity” and points to the need for additional information to confirm the actual “inland fish production” for the country.
More information is also needed to confirm the estimate of the “inland water area and aquaculture pond area” as this estimate influences the values of the “fish-water productivity” indicator, which varies from 102 to 236 kg/ha in quantity and from US$89 to US$305 per hectare in value, producing results similar to the “fish-water productivity” values estimated for Sri Lanka.
In Myanmar, the annual “inland fish production” is estimated at nearly 2 million tonnes with an estimated value between US$1.5 billion and US$3 billion. Aquaculture production has been rapidly growing since the late 1990s and includes the culture of Rohu (Labeo rohita) as well as tilapia, carps and barbs and other native species (Soe, 2008); it is estimated to contribute 42 percent of the overall “inland fish production” in terms of quantity and from 37 to 54 percent in terms of value. Due to the assessment of “inland water area”, which includes a large component of “seasonally flooded areas”, the estimated annual “fish-water productivity” is one of the lowest values within the analysed Asian countries, both in terms of quantity (182 kg/ha) and value (between US$159 and US$302 per hectare).
In Thailand, the annual “inland fish production” is estimated to be between 1 and 2 million tonnes with an estimated value between US$3 and US$4 billion. The “aquaculture contribution to inland fish production” is estimated to be between 50 and 83 percent in terms of quantity and between 68 and 90 percent in terms of value. The

67Implementation
wide range of these indicators is mainly due to the divergence between official statistics and non-official estimates of “inland fish production”. Official statistics reported a fairly stable inland capture fisheries production between 200 000 and 220 000 tonnes. However, according to different authors, official statistics are likely to represent only inland capture fisheries production from reservoirs (Coates, 2002; Lymer et al., 2008; van Zalinge et al., 2004). Therefore, Lymer et al. (2008) have suggested an estimate of inland capture fisheries production of 1 million tonnes/year, which is one order of magnitude higher than official statistics. The derived economic indicators compiled for Thailand are highly influenced by this divergence.
The estimated annual “fish-water productivity – quantity” of 325–542 kg/ha is lower than the estimate for Viet Nam, although the “fish-water productivity – value” (US$775–US$1 050/kg) of Thailand is similar to that of Viet Nam. This pattern is influenced by higher unit prices reported in Thailand compared with Viet Nam.
In Sri Lanka, the annual “inland fish production” is estimated at about 63 000 tonnes with an estimated value between US$66 and US$90 million. In Sri Lanka, making a distinction between inland capture fisheries and aquaculture activities is challenging, as the great majority of the water resources accounted for in the “inland water area” comprised reservoirs. Reservoirs are often characterized by their multiple use, in which also fishing and aquaculture activities take place. Usually large (over 800 ha) and medium sized (200–800 ha) reservoirs are used for capture fisheries, while small (1–200 ha) irrigation reservoirs are used for culture-based fisheries (Nissanka, Amarasinghe and De Silva, 2000). Seasonal tanks, which hold water for 6–8 months a year, are also often used for aquaculture activities (Rackowe, Amondakoon and Varley, 2009).
The annual “fish-water productivity – quantity” estimate of 159 kg/ha is significantly lower than the fish-water productivity recorded at the local level in many reservoirs (283 kg/ha per year), which are known to be quite high and higher than the fish-water productivity of reservoirs recorded in India (Sugunan, 1997). This unexpected relatively low “fish-water productivity – quantity” raises the question of a possible underreporting in the current official statistics of both inland capture fisheries and aquaculture production.
In Viet Nam, the annual “inland fish production” is estimated to be between 3 and 4 million tonnes with an estimated value between US$4 and US$8 billion. The average annual aquaculture production is reported to be about 2.5 million tonnes during the period 2008–2012 and is similar to that of India. Different estimates for inland capture fisheries production are available based on official statistics and non-official estimates: official statistics report figures of about 197 000 tonnes/year, while non-official estimates, assuming an annual fish consumption level of 49 kg/capita, estimate that the annual inland capture fisheries production should be over 1 million tonnes per year. The discrepancy is about one order of magnitude and underlines the variability recorded in the “aquaculture contribution to inland fish production” both in terms of quantity (69–93 percent) and value (71–96 percent).
Among the analysed Asian countries, Viet Nam records one of the highest values of annual “fish-water productivity”, both in terms of quantity (545–735 kg/ha) and value (US$762–US$1 604/kg). These values are also influenced by the estimate of the “inland water area and aquaculture pond area”. In this respect, Hall et al. (2011) have estimated that, in 2008, the culture of shrimp and catfish alone occured in an estimated aquaculture pond area of almost 12 000 km2, suggesting that the current official statistics related to “aquaculture pond area” could be partially underestimated.
4.2.7 Description of social indicators in nine Asian countriesThis section presents the estimated values of two social indicators compiled for nine Asian countries (Figure 36) and discusses major data issues. The section also provides a brief overview on how these indicators can complement each other and improve our

Assessing water availability and economic, social and nutritional contributions from inland capture fisheries and aquaculture68
understanding of the social contributions of water use by inland capture fisheries and aquaculture activities.
In Bangladesh, the “overall number of inland fishers and aquaculture farmers” is estimated to be about 4 million people, which is constituted by 1 million inland fishers and 3 million aquaculture farmers. While the number of aquaculture farmers has only been reported recently (since 2006), the same figure, related to the number of inland fishers, has been reported since 1987. It should be noted that the number of fishers, calculated on the basis of the extent of different inland waters and the average density of inland fishers in Asia, is from three to five times higher than the reported “overall number of inland fishers and aquaculture farmers” (FAO, 2016a). Moreover, the “average density of overall inland fishers and aquaculture farmers” in the country (93 people/km2) is lower than the value estimated in India (101-106 people/km2). These indications suggest a possible underestimation of the official value for the “overall number of inland fishers and aquaculture farmers”, and indicates the need of confirming the number of inland fishers in the country.
In Cambodia, the “overall number of inland fishers and aquaculture farmers” is based on official statistics and estimated between 774 000 and 853 000 people, of which inland fishers are reported to be about 580 000 people.
The reported number of inland fishers in the country is larger than the regional estimate of 496 000 inland fishers in the Tonlé Sap system, which includes both the Tonlé Sap Lake and the Mekong River (World Bank, FAO and WorldFish Center, 2010). However, in Cambodia, and especially around the Tonlé Sap system during the wet season, given the high fish-water productivity of seasonally flooded areas, the majority of households engage in fishing activity to support or supplement their livelihoods (van Zalinge, Thuok and Nuov, 2001). A household survey carried out in 1995–1996 in the Tonlé Sap area concluded that about 1.2 million people depended on fishing for their livelihoods (van Zalinge, Thuok and Nuov, 2001); at the national level, it is estimated that about 6 million people, representing 50 percent of the country population, depended on fishing for their livelihoods (FAO, 2011d).
The potential underestimation of the number of fishers is also suggested by the fact that the number of fishers, calculated on the basis of the extent of different inland waters and the average density of inland fishers in Asia, is from two to four times higher than the reported “overall number of inland fishers and aquaculture farmers” (FAO, 2016a).
0
40
80
120
160
0
3 250
6 500
9 750
13 000
Bangladesh Cambodia China India Lao People's
Democratic Republic
Myanmar Sri Lanka Thailand Viet Nam
People/km2Thousand people
Non-official estimate Official estimate Lowest estimate
Highest estimate
Ove
rall
num
ber o
f inl
and
fishe
rs a
nd a
quac
ultu
re fa
rmer
s
Aver
age
dens
ity o
f ove
rall
inla
nd fi
sher
s an
d aq
uacu
lture
farm
ers
FIGURE 36Comparison of social indicators in nine Asian countries
69Implementation
In addition, the estimated “average density of overall inland fishers and aquaculture farmers” (35 to 39 people/km2) is lower than the values estimated for the Lao People’s Democratic Republic, Thailand and Viet Nam. On the basis of these different indications, it can be speculated that the effective “overall number of inland fishers and aquaculture farmers”, which should factor in not only full-time but also part-time and occasional fishers and aquaculture farmers, is likely to be higher than currently reported.
In China, the “overall number of inland fishers and aquaculture farmers” is estimated to be between approximately 11 and 12 million people, and the “average density of overall inland fishers and aquaculture farmers” is estimated to be between 31 and 34 people/km2, representing one of the lowest values among the analysed Asian countries. A potential underestimation of the number of fishers should be further investigated considering also that the number of fishers, calculated on the basis of the extent of different inland waters and the average density of inland fishers in Asia, is about three times higher than the reported “overall number of inland fishers and aquaculture farmers” (FAO, 2016a). In addition, a great disparity in the “average density of overall inland fishers and aquaculture farmers” is strangely recorded between China and India; therefore, figures referred to the “overall number of inland fishers and aquaculture farmers” should be further confirmed.
In India, the “overall number of inland fishers and aquaculture farmers” is estimated to be between approximately 10 and 11 million people. The “average density of overall inland fishers and aquaculture farmers” (101–106 people/km2) is the highest estimated value range among the analysed Asian countries, which concurs with a higher population density of India compared with countries in the Mekong River Basin. It should be noted that India and Thailand are the only two analysed Asian countries in which the number of reported fishers in official statistics is not lower than the number of fishers calculated on the basis of the extent of different inland waters in the country and the average density of inland fishers in Asia (FAO, 2016a). This pattern would provide supporting indications of the number of inland fishers reported in official statistics. However, some caution should be used in the interpretation given that both the “average density of overall inland fishers and aquaculture farmers” and the calculated number of fishers on the basis of the extent of different inland waters (FAO, 2016a) are influenced by the current underestimation of the “inland water area”.
In the Lao People’s Democratic Republic, the estimated “overall number of inland fishers and aquaculture farmers” varies between 30 000 and 1.7 million people. The only official statistic of 30 000 people is dated from 1990 and consists of an aggregated number of inland fishers and aquaculture farmers. Coates (2002) provided a rough estimate of 1.7 million inland fishers in the country on the basis of an extrapolation of a survey carried out in the Luang Prabang Province. This non-official estimate is close to 1 million inland fishers calculated on the basis of the extent of different inland waters and the average density of inland fishers in Asia (FAO, 2016a). The anomalous larger value of the “average density of overall inland fishers and aquaculture farmers” in the country (150 people/km2) is likely to be also influenced by the underestimation of the “inland water area and aquaculture pond area”.
In Myanmar, the “overall number of inland fishers and aquaculture farmers” is estimated to be between approximately 1.8 and 2.2 million people, of which 1.6 million are inland fishers. Coates (2002) argued that the official estimate of inland fishers did not cover reservoir fishers, rice field fishers and occasional fishers using small-scale fishing gear. The relatively estimated low “average density of overall inland fishers and aquaculture farmers” (19 to 23 people/km²) is influenced by the assessment of the “inland water area” driven by the large reported estimate of “seasonally flooded areas” (81 000 km2). The number of fishers, calculated on the basis of the extent of different inland waters and the average density of inland fishers in Asia, suggests a very high

Assessing water availability and economic, social and nutritional contributions from inland capture fisheries and aquaculture70
number of inland fishers between 8 and 16 million. Although such estimates might be inflated by the overestimate of the “inland water area”, they point out a potential underestimate of official statistics related to the number of inland fishers, which should be further investigated.
In Sri Lanka, the “overall number of inland fishers and aquaculture farmers” is estimated to be between 49 000 and 69 000 people. It should be noted that the number of fishers, calculated on the basis of the extent of different inland waters and the average density of inland fishers in Asia, is from two to four times higher than the reported “overall number of inland fishers and aquaculture farmers”. This calculated number of fishers is likely to be a conservative estimate, assessed only considering lakes and permanent and seasonal reservoirs in Sri Lanka, as currently there is no information on the water area occupied by over 100 rivers flowing in the country. In addition, the “average density of overall inland fishers and aquaculture farmers” (12 to 18 people/km2) is among the lowest recorded in the analysed Asian countries, which contrasts with the fact that Sri Lanka is characterized by a high population density where fish activities are relevant in the country. These two indications suggest the hypothesis that the number of inland fishers and aquaculture farmers could be underestimated in reported official statistics.
In Thailand, the “overall number of inland fishers and aquaculture farmers” is assessed at about 3 million people, considering the official statistics of about 280 000 aquaculture farmers and a non-official estimate of the number of inland fishers (2.8 million people). The number of fishers, calculated on the basis of the extent of different inland waters and the average density of inland fishers in Asia, suggests a number of inland fishers between 2 and 5 million people (FAO, 2016a). The “average density of overall inland fishers and aquaculture farmers” in the country (79 people/km2) is close to the value estimated for Viet Nam.
In Viet Nam, the “overall number of inland fishers and aquaculture farmers” is estimated to be between approximately 2.6 and 4 million people. This estimate is based on official statistics of 1 million aquaculture farmers, and takes into consideration both official statistics that referred to 1.6 million inland fishers dated from 1998 and a non-official rough estimate of 3 million inland fishers in the country (World Bank, FAO and WorldFish Center, 2010). The number of fishers, calculated on the basis of the extent of different inland waters and the average density of inland fishers in Asia, suggests a number of fishers between 2 and 5 million (FAO, 2016a). Thus, it is quite close to the estimate of the “overall number of inland fishers and aquaculture farmers”.
In Viet Nam, the “average density of overall inland fishers and aquaculture farmers” estimated between 52 and 82 people/km² is close to the estimate for Thailand (79 people/km²) and below that for Bangladesh (93 people/km²).
4.2.8 Description of nutritional indicators in nine Asian countriesThis section presents the estimated values of two nutritional indicators compiled for nine Asian countries (Figure 37) and discusses major data issues. The section also provides a brief overview on how these indicators can complement each other and improve our understanding of the nutritional contributions of water use by inland capture fisheries and aquaculture activities.
In Bangladesh, the “fish protein supplied by inland fish production” is estimated at about 253 000 tonnes, which is half the value recorded in India. However, as the “inland water area and aquaculture pond area” recorded in Bangladesh is also nearly half the area estimated for India, the resulting annual “fish-protein water productivity” (55 kg/ha) is similar among the two countries. In Bangladesh, aquaculture production contributes to about half of the total amount of animal proteins provided by “inland fish production”.

71Implementation
In Cambodia, the “fish protein supplied by inland fish production” is estimated to be between 51 000 and 83 000 tonnes, and the average annual “fish-protein water productivity” is assessed between 23 and 38 kg/ha. This estimate is mainly provided by inland capture fisheries and based on official statistics. The “aquaculture contribution to inland fish production – quantity” is low (from 7 to 12 percent); however, it should be noted that in the national statistics the fish protein produced by cage culture is likely to be attributed to inland capture fisheries production and not to aquaculture production.
In China, the estimated “fish protein supplied by inland fish production” is almost 3 million tonnes. This value is 10 times higher than in countries such as Bangladesh, Thailand and Viet Nam, but almost 100 times higher than the values recorded for Cambodia and the Lao People’s Democratic Republic. The contribution made by aquaculture production in terms of protein supply is about 12 times more than that made by inland capture fisheries. In China, there is detailed information available on the species composition of both inland capture fisheries and aquaculture production and is represented in the following proportions: freshwater and diadromous species (80 percent), crustaceans (10 percent), aquatic animals (6 percent), and molluscs (4 percent). China also shows the highest “fish-protein water productivity” value (78 kg/ha) among the analysed nine Asian countries.
In India, the “fish protein supplied by inland fish production” is estimated at about 531 000 tonnes. The contribution of proteins from aquaculture production is four times higher than that from inland capture fisheries. Differently to what is recorded for aquaculture production in Thailand, in India the inland protein supply is mainly derived from farmed finfish.
In the Lao People’s Democratic Republic, the “fish protein supplied by inland fish production” is estimated to be between 13 000 and 29 000 tonnes. This range of values reflects the variability shown in the official statistics and the non-official estimate used to compile the “inland fish production – quantity” estimate. The lower value of the annual “fish-protein water productivity”, based on official production estimates (11 kg/ha), falls outside the range of values recorded in other countries of the Lower Mekong River Basin and provides additional indication of an underreporting of inland capture fisheries production in official statistics.
FIGURE 37Comparison of nutritional indicators in nine Asian countries
0
20
40
60
80
0
700
1 400
2 100
2 800
Bangladesh Cambodia China India Lao People's
Democratic Republic
Myanmar Sri Lanka Thailand Viet Nam
Kg/ha Thousand tonnes
Non-official estimate Official estimate
Lowest estimate Highest estimate
Fish
pro
tein
sup
plie
d by
inla
nd fi
sh p
rodu
ctio
n
Fish
-pro
tein
wat
er p
rodu
ctiv
ity

Assessing water availability and economic, social and nutritional contributions from inland capture fisheries and aquaculture72
In Myanmar, the “fish protein supplied by inland fish production” is estimated at about 192 000 tonnes. Aquaculture production provides a substantial contribution to proteins at about 42 percent of the national inland production. The relatively low value shown by the annual “fish-protein water productivity” (20 kg/ha) is due to the large estimate of “seasonally flooded areas” along the Ayeyarwady River, which also determines the highest “percentage of inland water over country area” in Myanmar compared with other countries of the Mekong River Basin.
In Sri Lanka, the “fish protein supplied by inland fish production” is about 7 000 tonnes. The “aquaculture contribution to inland fish production – quantity” is also quite low (12 percent), and consequently the protein supply from aquaculture production is minor and mainly constituted by shrimp, which are likely to be exported and not consumed in the country (FAO, 2016a). However, it should be noted that in Sri Lanka the distinction between aquaculture production and inland capture fisheries production is quite fuzzy, as most of both activities take place in artificial reservoirs. The “fish-protein water productivity” (17 kg/ha) is one of the lowest among the analysed Asian countries.
In Thailand, the “fish protein supplied by inland fish production” estimate varies between 127 000 and 219 000 tonnes. This range of values reflects the variability shown by official statistics and the non-official estimate used to compile the “inland fish production – quantity”, which also affects the range of the annual “fish-protein water productivity” (from 33 to 56 kg/ha). Aquaculture contributes a considerable amount of animal proteins from both the culture of freshwater and diadromous fish (48 000 tonnes/year) and from the culture of crustaceans (56 000 tonnes/year), which are likely to be exported for their high commercial value and not consumed in the country.
In Viet Nam, the “fish protein supplied by inland fish production” varies between 283 000 and 384 000 tonnes/year. Viet Nam shows the highest “fish protein supplied by inland fish production” and “fish protein-water productivity” among the Lower Mekong River Delta countries. The contribution of proteins made by aquaculture production is ten times higher than that made by inland capture fisheries and comes principally from the culture of freshwater and diadromous fish (83 percent) as well as crustaceans (16 percent). Viet Nam has an estimated “inland water area and aquaculture pond area” similar to that of Bangladesh, but is characterized by a significantly higher value of the “fish-protein water productivity” (from 58 to 78 kg/ha).

73
5. Further considerations
The major aim of this study is to show the importance of freshwater and brackish-water resources for the inland fisheries sector and to measure the benefits conveyed in the social, economic and nutritional domains. For this reason, a framework of national-level indicators is designed to provide an assessment of water availability and to link the economic, social and nutritional dimensions to this assessment.
5.1 MULTIDIMENSIONALITy AND MODULARITy OF THE INDICATOR-BASED FRAMEwORk FOR MULTIPLE INDICATORSThe indicator-based framework, designed to encompass environmental, economic, social and nutritional dimensions, provides four different entry points for a multidimensional assessment of water use by the inland fisheries sector in a given country. Each dimension identifies different subcomponents, which constitute the building blocks on which the indicator-based framework has been built (Figure 38).
In the indicator-based framework, the four dimensions are clearly interlinked. The characteristics of water resources determine the occurrence of suitable fish habitats and the amount and availability of water resources for inland capture fisheries and aquaculture activities. The availability of water areas for the inland fisheries sector is the basic condition for the development of the activities of the sector and influences all remaining dimensions. In addition, there are also cross-linkages among the economic, social and nutritional dimensions. For example, there is a direct link between the amount of fish production and the amount of fish protein shown by the nutritional dimension. However, fish production is also connected to the number of inland fishers and aquaculture farmers operating in the sector and relying on fishing and aquaculture
Environmental Economic Social Nutritional
Fish production – quantityFish production – value
Fish waterproductivity – quantity
Fish waterproductivity – value
Overall number ofinland fishers andaquaculture farmers
Permanentinland waters
Aquaculturepond area
Inlandfishers
Aquaculturefarmers
Countryarea
Seasonallyflooded areas
Fish quantityfrom inland
capture fishers
Fish quantityfrom
aquaculture
Farmgate priceof aquaculture
species
First-sale priceof wild caught
species
Proteins fromfreshwater
diadromousfishes
Proteins from crustaceans
Proteins fromother animals
Proteins frommolluscs
Indicator-based framework comprising four dimensions
Average density ofthe overall number of
inland fishers andaquaculture farmers
Fish-protein supply byinland fish production
Fish-protein waterproductivity
DATA REQUIREMENTS FOR THE INDICATOR-BASED FRAMEWORK
INDICATORS OF THE BENEFITS PROVIDED BY THE INLAND FISHERIES SECTOR
Environmental Economic
Social
Economic Social
Nutritional
Nutritional
Water availability
A B
Environmental Economic
Social Nutritional
Economic Social Nutritional
Water availability
A B
BA
FIGURE 38Graphical representation of the architecture of the indicator-based framework
Data requirements for the indicator compilation are shown under each dimension and (A) use the indicator-based framework to assess the economic, social and nutritional benefits conveyed by water use of the inland fisheries sector; and (B) are measured in absolute terms or in relative terms by linking information on each dimension to the water availability assessment.

Assessing water availability and economic, social and nutritional contributions from inland capture fisheries and aquaculture74
activities to support their livelihoods through income generation or fish consumption. In turn, the number of people operating in the sector influences the fishing effort and concurs to determine a certain level of fish production. Although these four dimensions are highly interconnected, having a multiplicity of indicators is very powerful as multiple indicators can express different aspects of each dimension, since their differences can be complementary in describing the information provided by the indicator-based framework. National-level indicators are, by necessity, oversimplifications and face the challenge of condensing the complexity and uncertainty of the information they represent. For example, the crude figure provided by the “inland water area” does not make explicit information on existing water storages that could provide buffer water resources against water scarcity, which instead can be expressed by the “percentage of permanent inland water over inland water area” indicator. Similarly, the aggregated information related to the overall “inland fish production” is considered as the basic information for the scope of the economic assessment. However, having information on the contributions provided separately by inland capture fisheries and aquaculture can enhance the information displayed by the economic dimension as, for example, market prices often vary greatly by production system.
It should be noted that the indicator-based framework includes a limited number of indicators related to the social and nutritional dimensions. This is due to the fact that the available data in these dimensions are sparse or reported in such an aggregated form, limiting compilation to basic indicators.
Having a multiplicity of indicators is useful not only to point out different aspects for different purposes, but also to cross-validate information as shown by the indicator framework. Reported national values are often derived from a process of inference and up-scaling knowledge, as expertise, research and knowledge are commonly linked to specific locations or geographic areas. For this reason, the comparison of interrelated indicators can be a very valuable process as a certain degree of consistency is expected among them.
5.2 BENEFITS RELATED TO wATER USE OF THE INLAND FISHERIES SECTOR The design of the indicator-based framework is ultimately aimed at providing indicators to measure the economic, social and nutritional benefits that the inland fisheries sector can convey to society through the water resources made available to the sector, to understand potential implications of changes in water availability, and to facilitate the participation of the inland fisheries sector in the water management discussion. The assessment of inland water availability constitutes the foundation for such assessment. The inland fisheries sector includes a great diversity of activities and types of operations in both inland capture fisheries and aquaculture production, which can be carried out for commercial, subsistence and recreational purposes. This diversity also determines a high diversity in the type, pattern and intensity of the use of water resources by the sector. As the scope of this study is to provide a combined assessment of the inland fisheries sector, there is need to identify a common core element related to the water availability assessment that is able to bridge the diversity of activities of the sector. This is crucial to show the contributions made by the inland fisheries sector as a whole and to represent the sector in the water management discussion. This common core element has been identified in the assessment of the area covered by natural and artificial surface waters available to the sector and is expressed by the “inland water area and aquaculture pond area” indicator.
Estimation of existing water areas is considered one of the easiest type of assessments that can be carried out at the national level and implemented in data-poor situations. Water area is a powerful metric, as it can be immediately associated with fishing areas and areas used for aquaculture. In addition, variation in the assessment of these water areas can be a way to monitor changes in water variability and the effects of climate
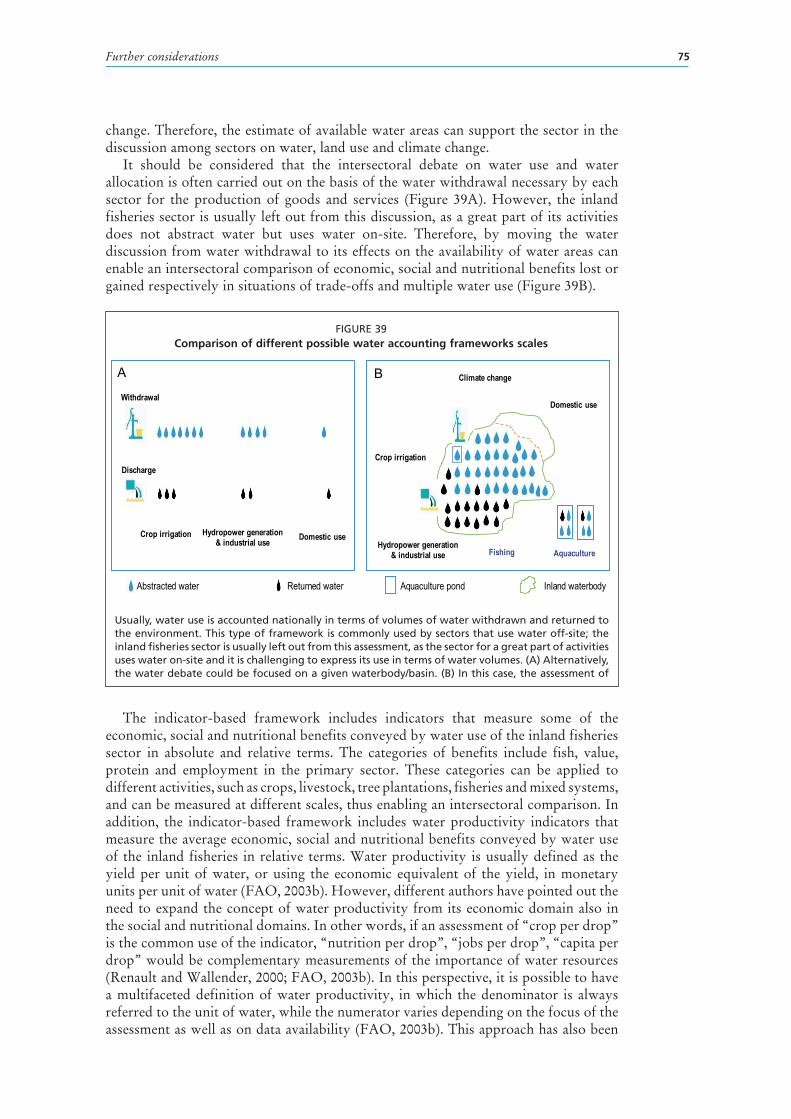
75Further considerations
change. Therefore, the estimate of available water areas can support the sector in the discussion among sectors on water, land use and climate change.
It should be considered that the intersectoral debate on water use and water allocation is often carried out on the basis of the water withdrawal necessary by each sector for the production of goods and services (Figure 39A). However, the inland fisheries sector is usually left out from this discussion, as a great part of its activities does not abstract water but uses water on-site. Therefore, by moving the water discussion from water withdrawal to its effects on the availability of water areas can enable an intersectoral comparison of economic, social and nutritional benefits lost or gained respectively in situations of trade-offs and multiple water use (Figure 39B).
The indicator-based framework includes indicators that measure some of the economic, social and nutritional benefits conveyed by water use of the inland fisheries sector in absolute and relative terms. The categories of benefits include fish, value, protein and employment in the primary sector. These categories can be applied to different activities, such as crops, livestock, tree plantations, fisheries and mixed systems, and can be measured at different scales, thus enabling an intersectoral comparison. In addition, the indicator-based framework includes water productivity indicators that measure the average economic, social and nutritional benefits conveyed by water use of the inland fisheries in relative terms. Water productivity is usually defined as the yield per unit of water, or using the economic equivalent of the yield, in monetary units per unit of water (FAO, 2003b). However, different authors have pointed out the need to expand the concept of water productivity from its economic domain also in the social and nutritional domains. In other words, if an assessment of “crop per drop” is the common use of the indicator, “nutrition per drop”, “jobs per drop”, “capita per drop” would be complementary measurements of the importance of water resources (Renault and Wallender, 2000; FAO, 2003b). In this perspective, it is possible to have a multifaceted definition of water productivity, in which the denominator is always referred to the unit of water, while the numerator varies depending on the focus of the assessment as well as on data availability (FAO, 2003b). This approach has also been
Withdrawal
Discharge
Crop irrigation Domestic useHydropower generation& industrial use
Domestic use
Hydropower generation& industrial use
Crop irrigation
Fishing Aquaculture
Climate changeA B
Aquaculture pond Inland waterbody Returned waterAbstracted water
FIGURE 39Comparison of different possible water accounting frameworks scales
Usually, water use is accounted nationally in terms of volumes of water withdrawn and returned to the environment. This type of framework is commonly used by sectors that use water off-site; the inland fisheries sector is usually left out from this assessment, as the sector for a great part of activities uses water on-site and it is challenging to express its use in terms of water volumes. (A) Alternatively, the water debate could be focused on a given waterbody/basin. (B) In this case, the assessment of

Assessing water availability and economic, social and nutritional contributions from inland capture fisheries and aquaculture76
endorsed by the current study, which has assessed the benefits of water use in terms of four different metrics of water productivity, corresponding to the average amount of fish produced per unit of water resource; the average monetary value of fish produced per unit of water resource; the average amount of proteins produced per unit of water resources; and the average number of people engaging in fishing and aquaculture per unit of water resource.
At the national level, the water productivity indicators can be used to compare information across countries, demonstrating the great diversity of available water resources, the various uses of these resources, and the related benefits conveyed by the inland fisheries sector.
In the proposed indicator-based framework, water productivity indicators for the inland fisheries sector have been expressed in terms of water areas, while other sectors, characterized by an off-stream water use, usually have water productivity indicators expressed in terms of water volumes. This different unit of measurement prevents a direct comparison of water use among sectors, but nevertheless enables the participation of the inland fisheries sector in the water management discussion. For example, when considering the different available sources of proteins, water productivity indicators can measure the amount of water used to produce a kilogram of proteins from soy crop versus eggs, chicken, pork or beef. Fish is usually left out from this comparison since the amount of water needed for fish production varies enormously according to species and type of production. In addition, fishing, cage and pen aquaculture are considered to have no water consumption, but this does not imply that these activities do not need water to make their contribution in animal protein supply. For this reason, if this comparison is used as a basis for a discussion on water allocation and management among different sectors, it follows that the inland fisheries sector will not be adequately considered. On the contrary, by being able to express the average amount of protein that can be extracted per unit of water made available to the inland fisheries sector, the inland fisheries sector can show its potential contribution to food security if a given amount of water is left on-site for fishing or cage aquaculture or if water can be used for pond aquaculture (Figure 40).
Soy
Chicken
Maize
Beef
Fish
Protein per volume of water
e.g. 5 kg/ha
63 g per 378 litres
19 g per 378 litres
13 g per 378 litres
6 g per 378 litres
Source: Modified from: www.seginusfarms.com/why-eat-insects-or-circkets/
Protein per water area
FIGURE 40Hypothetical situation of a comparison of protein water productivity provided by
different sectors
Note: Crop and livestock production can measure the amount of proteins produced per volume of water consumed. It follows that fish is often not considered in the comparison, unless the inland fisheries sector is able to provide a measurement of its protein water productivity. The easiest way would be to calculate the average amount of protein per unit of water area made available to the inland fisheries sector.

77Further considerations
Although the lack of a direct comparison does not represent an ideal situation, the possibility of the inland fisheries sector to express the “protein-fish water productivity” indicator provides the opportunity to raise the importance of its activity for food security.
Water productivity metrics can also be used to assess the changes in different economic, social and nutritional benefits derived through water use of the inland fisheries sector (Figure 41a). The water productivity indicators have been designed to be multi-scale; therefore, if they are compiled at lower spatial scale, they could more closely reflect local conditions.
The water productivity indicators can be used as an initial rapid assessment tool supporting the debate and showing the potential losses due to, for example, a reduction of water areas driven by climate change or by privatization policies of water resources.
The proposed indicator-based framework can improve the ability of the inland fisheries sector to enter the water policy arena and facilitate dialogue with other sectors about water management and climate change planning. The economic, nutritional and social categories of benefits depicted by the indicator-based framework in terms of the amount of food produced (i.e. food), its related monetary value (i.e. value), the amount of proteins (i.e. protein) and the amount of people engaged in the sector (i.e. employment) are metrics that can be applied also to other sectors (Figure 41). This provides the possibility of comparing different categories of benefits across different sectors as a consequence of specific water management or policies.
In an intersectoral comparison, both absolute and relative indicators are needed. Because of the difference in unit of measurement, the comparison among sectors cannot take place through the direct comparison of water productivity indicators, but rather through the change of water productivity indicators from the previous year or to a previous situation. In addition, if the intersectoral water debate occurs around a given shared water resource, such as a waterbody or an entire water basin, the comparison of the benefits conveyed by different sectors can occur directly in absolute terms by circumventing the need for a standardization of benefits by water unit.
In the hypothetical example represented in Figure 41B, a cross-sectoral evaluation could assess the changes in economic, social and nutritional benefits related to the activities of agriculture, inland fisheries and the hydroelectricity sectors of a planned
Agriculture Hydroelectricity Fisheries
ASSESSMENT OF BENEFITS BY THE INLAND FISHERIES SECTOR
Employment
Protein
Food
Value
kg/ha
US$/ha
people/ha
kg/ha
Employment
Protein
Food
Value
CROSS-SECTORAL COMPARISON OF CHANGE IN BENEFITS
Energy
n.a
n.an,a
kg
US$
people
kg
Absolute terms Relative terms
A B
FIGURE 41Possible uses of the indicator-based framework
(A) Assessment of benefits by the inland fisheries sector in terms of absolute and relative terms; and (B) intersectoral comparison assessing potential changes in benefits related to food, money, protein and employment provided by different sectors.
Assessing water availability and economic, social and nutritional contributions from inland capture fisheries and aquaculture78
hydropower plant. In the example, changes in these benefits could be compared by assessing the situation before (ex ante) and after (ex post) the installation of a major hydropower plant, reducing the runoff flowing downstream. For example, the hydroelectricity sector would experience a marked increase of benefits related to the increased number of hydropower plants. The inland fisheries sector could be negatively impacted because such decrease in runoff would have an effect on the suitability of fishing areas, with a potential decrease in fish-water productivity and, for example, a consequent decrease of the number of fishers.28
The potential change in water availability can be compared with potential effects in the agriculture sector. Here, the minor availability of water for irrigation could determine a shift from rice cultivation to other crops that are less water demanding, but characterized by minor content of proteins and minor cash value. Therefore, the same decreased downstream runoff could determine different changes in the economic, social and nutritional benefits in terms of food, value, protein and employment among different sectors.
These differences can be useful to pinpoint potential synergies or trade-offs in water use among sectors. This type of assessment is highly relevant in situations where water resources are increasingly under pressure, and that the use of one sector affects the quantity, quality and timing of water availability for other sectors. Such intersectoral comparisons can be pivotal in stimulating further analysis of sustainability of multiple water uses.
5.3 MAjOR RESULTS ACHIEvED THROUGH THE TESTING OF THE INDICATOR-BASED FRAMEwORk AND FURTHER STEPSThis study provides an indicator-based framework for understanding the economic, social and nutritional contributions of inland capture fisheries and aquaculture and their links to available inland water resources. Fourteen initial indicators are proposed within the framework to represent environmental, economic, social and nutritional dimensions that are based on their ability to be applicable to inland capture fisheries and aquaculture, and that are easy to interpret, robust and applicable to national as well as regional or local scales.
These indicators have the potential: (i) to measure the current benefits derived from the inland fisheries and aquaculture sector from the available natural and artificial inland water areas as a baseline for national sectoral planning and management; (ii) of being a means to inform intersectoral water management; and (iii) in the face of climate change and changing water availability as inputs into modelling the potential economic, social and nutritional losses and opportunities to society stemming through the impacts in the inland fisheries sector.
The indicator framework has been tested in eighteen African and Asian countries, representing the complexity and the diversity not only of the natural and artificial water resources, but also of the economic, social and cultural contexts of these countries. The compilation exercise has been constrained by a paucity of available information relating to the inland sector, but the results show the type of information, and its reliability, that can be obtained in data-poor situations. The results also show how these indicators can support the identification of major data gaps and point out possible incongruences in available statistics.
This study, and its companion document (FAO, 2016a), gathers and compiles a wealth of disparate material in terms of official statistics and data available in the published literature and offers a discussion of these data in the country profiles of each analysed country. This meticulous, yet still not comprehensive, work offers a starting
28 Aquaculture development within the new reservoir may provide positive benefits.

79Further considerations
point for further improvements by sector in the quality and the accuracy of available information.
One of the main advantages of using water areas is that they can easily be derived from remote sensing or aerial photography. In the near future, the Joint Research Centre and Google Earth Engine team will release a Global database, assembled by photointerpretation of Landsat images from the period 1985-2015, and constituted of maps of surface waters with a resolution of 30 metres. Therefore, it will be possible to extract the areas covered by “permanent inland waters” and “seasonally flooded areas” directly from these maps. This data source will be extremely valuable, as it will allow to extend the indicator-based framework to other countries and to further refine, when necessary, the compiled indicators.
The paucity of available information on inland fishers and aquaculture area represents another domain that requires a greater data-mining effort and ultimately affects the reliability of the indicators. Obtaining comprehensive statistics on the number of inland fishers and aquaculture farmers requires a screening of all the people engaging in these activities, not only as a primary occupation, but also as a secondary or marginal activity carried out seasonally or occasionally as a supplement to major activities characterizing their livelihoods. One way to acquire this information would be through the national census framework.
The FAO World Programme for the Census of Agriculture (WCA) includes standard international concepts, definitions and methodology aimed at supporting countries in carrying out national agricultural censuses (FAO, 2015). Since 2000, the WCA guidelines have incorporated a “supplement on aquaculture”, designed to collect information on agricultural holdings that also engage in aquaculture activities (Rana, 1997). In the guidelines for WCA of 2020, in addition to the aquaculture module, a new module for fisheries has been introduced with specific data items related to the number of household members by gender who are engaged in fishing (FAO, 2015). With time, the implementation of an agricultural census with additional fisheries and aquaculture modules in countries where these activities are relevant can provide a good estimate of the number of people engaging in fishing and aquaculture activities within agricultural holdings. However, the agricultural census of agriculture is not able to cover the inventory of landless people relying on fishing and aquaculture undertaken on public land or surface waters to support their livelihoods. For this reason, the inclusion of screening questions with the population census can be useful to obtain a comprehensive picture on the engagement of households in small-scale fisheries and aquaculture (Gee and Tsuji, 2015). In the future, the desired increased integration of screening questions related to the engagement in small-scale fisheries with census frameworks will greatly enhance the comprehensiveness of statistics related to inland fishers and aquaculture farmers. This will facilitate the compilation of social indicators and will increase their reliability.
Another area in which the compilation of the indicator framework has provided a lot of material for discussion refers to the available information on producer prices by species or group of species in the analysed countries. Information on producer prices and on the composition of “inland fish production – quantity” in species or group of species is fundamental to provide a first rough estimate of the value of “inland fish production”. Information on farmgate prices is routinely collected by FAO through questionnaires on aquaculture statistics. Other information on both farmgate and first-sale prices is also available through the Southeast Asian Fisheries Development Center publications for a limited number of countries. However, there is still a lack of a global consolidated database on the prices of fish landings, which has contributed to the limited number of studies on the valuation of inland capture fisheries production.
The compilation of the “inland fish production – value” has shown the importance of price calibration. In fact, the comparison of the values obtained when using the

Assessing water availability and economic, social and nutritional contributions from inland capture fisheries and aquaculture80
lowest and highest unit prices showed that even a difference of half a dollar in the unit price (US$/kg) can introduce remarkable differences in the resulting “inland fish production – value”. Moreover, when the amount of fish landings is reported without any specification on its species composition, the use of unit prices that accounts for both low-value and high-value species can cause a considerable variation in the estimated monetary value of “inland fish production”. The patchiness of available information on prices often determines the common practice of transferring price values referred to a region or a country to another (i.e. value transfer). The results of this study show that caution should be used in this operation, as information gathered on prices show variation also among countries belonging to the same region or even sharing the same watershed. However, the information collected and reported in the country profile of each analysed country (FAO, 2016a) can constitute the starting point for a revision on the current available information and existing data gaps. The direct application of farmgate and first-sale prices in the national-level economic indicator could encourage countries to improve their data collection system, while the generated estimates of “inland fish production – values” could stimulate further refinement of the current methodology used. For a full accounting, it would be important to be able to move beyond producer prices and be able to quantify also generating economic benefits such as value added, economic rents and surpluses.
Although most countries do not routinely place a value on their inland fish production, such social and economic valuation provides a means for assessing the benefits conveyed by the use of water resources by the inland fisheries sector and can be a powerful tool in decision-making by assessing the economic consequences of different management options.
Despite its possible further improvement, this study can be considered as a first step towards the challenging goal of providing some indicator-based measurements of the importance of water for fishing and aquaculture activities. By starting to fill existing data gaps in the assessment of water availability, of the number of people engaged in the inland fisheries sector and in the coarse assessment of the value of “inland fish production”, the outcome of this study contributes to the possibility to respond to the clear demand by many governments and international organizations for water-related indicators relevant to the inland fisheries sector.
National-level indicators can be a very powerful tool to raise attention and awareness as well as to encourage further investigation, stimulate discussion and strengthen policy agenda. However, without debate and political commitment even the perfect indicator-based framework will remain on the shelf. The information provided by this study can be used in supporting the discussion on the importance of the availability and access of water resources for the inland fisheries sector, to motivate additional data collection efforts, and to help with the development of integrated water management plans supporting climate change adaptation planning.

81
6. References
An, D.T., Le Ahn, T.T. & Binh, N.H. 2006. The current state of water environment in 3 river basins of Cau, Nhue, Day and Dong Nai river system. Environment report of Viet Nam, 2006. (also available at http://tinyurl.com/m5pull6).
Andersen, I., & Golitzen, K.G., eds. 2005. The Niger river basin: a vision for sustainable management. Washington, DC, World Bank.
Arias, M.E., Cochrane, T.A., Caruso B., Killeen, T. & Kummu, M. 2011. A landscape approach to assess impacts of hydrological changes to vegetation communities of the Tonlé Sap floodplain. Discussion paper presented at the 34th IAHR World Congress – Balance and Uncertainty, 26 June–1 July 2011, Brisbane, Australia. (also available at http://tinyurl.com/qyv87kv).
Arntzen, C.J. & Ritter, E.M., eds. 1994. Encyclopedia of agricultural science. Vol. 1. San Diego, California, USA, Academic Press.
Arthur, R., Béné, C., Leschen, W. & Little, D. 2013. Fisheries and aquaculture and their potential roles in development: an assessment of the current evidence. London, UK, Department for International Development, Research and Evidence Division.
Balarin, J.D. 1985. National review for aquaculture development in Africa. Cameroon. FAO Fisheries Circular No. 770/6. Rome, FAO. 72 pp.
Bartley, D.M., de Graaf G.J., Valbo-Jorgensen, J. & Marmulla, G. 2015. Inland capture fisheries: status and data issues. Fisheries Management and Ecology, 22: 71–77.
Bazigos, G.P. 1974. The design of fisheries statistical surveys − inland waters. FAO Fisheries Technical Paper No. 133. Rome, FAO. 122 pp.
Béné, C., Mindjimba, K., Belal, E. & Jolley, T. 2000. Evaluating livelihood strategies and the role of inland fisheries in rural development and poverty alleviation: the case of the Yaéré floodplain in North Cameroon. In R.S. Johnston & A.L. Shriver, eds. Micro-behaviour and macro-results. Proceedings of the 10th Conference of the International Institute of Fisheries Economics and Trade, pp. 1–15. Oregon State University, Corvallis. (also available at http://oregonstate.edu/dept/IIFET/2000/papers/bene.pdf).
Béné, C., Steel, E., Kambala Luadia, B. & Gordon, A. 2009. Fish as the ‘bank in the water’ − evidence from chronic-poor communities in Congo. Food Policy, 34: 104–118.
Béné, C., Chijere, A.D., Allison, E.H., Snyder, K. & Crissman, C. 2012. Design and implementation of fishery modules in integrated household surveys in developing countries. Penang, WorldFish Center. 33 pp. (also available at https://www.researchgate.net/publication/254456639_Design_and_implementation_of_fishery_modules_in_integrated_household_surveys_in_developing_countries).
Beveridge, M.C.M., Thilsted, S.H., Phillips, M.J., Metian, M., Troell, M. & Hall, S.J. 2013. Meeting the food and nutrition needs of the poor: the role of fish and the opportunities and challenges emerging from the rise of aquaculture. Journal of fish biology, 83: 1067–1084.
Blake, D.J.H. 2006. The Songkhram River wetlands − a critical floodplain ecosystem of the Lower Mekong Basin. International River Symposium 06, pp.1–25. Brisbane, Australia.
Bogard, J.R., Thilsted, S.H., Marks, G.C., Wahab, M.A., Hossain, M.A., Jakobsen, J. & Stangoulis, J., 2015. Nutrient composition of important fish species in Bangladesh and potential contribution to recommended nutrient intakes. Journal of Food Composition and Analysis, 42: 120–133.
Bontemps, S., Defourny, P., Van Bogaert, E., Arino, O., Kalogirou, V. & Ramos Perez, J. 2011. GlobCover 2009. Product description and validation report. Université catholique de Louvain and the European Space Agency team. (also available at http://due.esrin.esa.int/files/GLOBCOVER2009_Validation_Report_2.2.pdf).
Assessing water availability and economic, social and nutritional contributions from inland capture fisheries and aquaculture82
Bostock, J., McAndrew, B., Richards, R., Jauncey, K., Telfer, T., Lorenzen, K., Little, D., Ross, L., Handisyde, N., Gatward, I. & Corner, R. 2010 Aquaculture: global status and trends. Philosophical transactions of the Royal Society B, 365: 2897–2912.
Brody, A., Demetraides, J. & Esplen, E. 2008. Gender and climate change: mapping the linkages. Brighton, Bridge and Institute of Development Studies. 36 pp. (also available at http://siteresources.worldbank.org/EXTSOCIALDEVELOPMENT/Resources/DFID_Gender_Climate_Change.pdf).
Catling, D.H. 1992. Rice in deep water. Hong Kong, International Rice Research Institute (IRRI).
Central Intelligence Agency (CIA). no date. The world factbook (also available at https://www.cia.gov/library/publications/the-world-factbook/index.html).
Chen, D., Li, S. & Wang, K. 2010. Inland fisheries resources enhancement and conservation in China. In W. Miao, S.D. Silva, B. Davy, eds. Inland fisheries enhancement and conservation in Asia. RAP Publication 2010/22, pp. 19–34. Bangkok, FAO Regional Office for Asia and the Pacific (also available at www.fao.org/docrep/013/i1984e/i1984e.pdf).
Choudhury, K. & Jansen, L.J.M. 1998. Terminology for integrated resources planning and management. Rome, FAO. 69 pp. (also available at https://www.mpl.ird.fr/crea/taller-colombia/FAO/AGLL/pdfdocs/landglos.pdf).
Coates, D. 2002. Inland capture fishery statistics of Southeast Asia: current status and information needs. RAP Publication 2002/11, pp. 114. Bangkok, Asia-Pacific Fishery Commission (also available at www.fao.org/docrep/005/AC487E/AC487E00.HTM).
Cochrane, K., De Young, C., Soto, D. & Bahri, T., eds. 2009. Climate change implications for fisheries and aquaculture: overview of current scientific knowledge. FAO Fisheries and Aquaculture Technical Paper No. 530. Rome, FAO. 212 pp. (also available at www.fao.org/docrep/012/i0994e/i0994e00.htm).
Crespi, V. & Coche, A. 2008. Glossary of aquaculture. Rome, FAO. 401 pp. (also available at ftp://ftp.fao.org/docrep/fao/011/a1555m/a1555m.pdf).
Cubasch, U., Wuebbles, D., Chen, D., Facchini, M.C., Frame, D., Mahowald, N. & Winther, J.G. 2013. Introduction. In T.F. Stocker, D. Qin, G.K. Plattner, M. Tignor, S.K. Allen, J. Boschung, A. Nauels, Y. Xia, V. Bex & P.M. Midgley, eds. Climate change 2013: the physical science basis. Contribution of Working Group I to the Fifth Assessment Report of the Intergovernmental Panel on Climate Change. Cambridge, UK, Cambridge University Press.
De Graaf, G.J. & Ofori-Danson, P.K. 1997. Catch and fish stock assessment in stratum VII of Lake Volta. IDAF/Technical Report No. 97/I. Rome, FAO. 92 pp. (also available at www.nefisco.org/downloads/Lake%20volta%20final%20report.PDF).
De Graaf, G.J., Grainger, R.J.R., Westlund, L., Willmann, R., Mills, D., Kelleher, K. & Koranteng, K. 2011. The status of routine fishery data collection in Southeast Asia, central America, the South Pacific, and West Africa, with special reference to small-scale fisheries. Journal of Marine Science, 68: 1743–1750.
De Iongh, H.H., Hamling, P. & Zuiderwijk, A. 1998. Preliminary report: economic assessment study, consultancy for Waza Logone project/IUCN, Centre of Environmental Science (CML), Leiden. In P. Loth, ed. 2004. The return of the water: restoring the Waza-Logone floodplain in Cameroon. Gland, Switzerland and Cambridge, UK, IUCN.
Department of Fisheries. 2010. Data reported In F. Alam, 2011. A background paper for Bangladesh fisheries value chain study. Selangor, University Putra Malaysia.
De Pryck, D.J. 2013. Good practice policies to eliminate gender inequalities in fish value chains. Rome, FAO. 120 pp. (also available at www.fao.org/docrep/019/i3553e/i3553e.pdf)
De Silva, S.S., Moehl, J., Satia, B., Bartley, D. & Subasinghe, R. 2003. Inland fisheries and aquaculture: a synergy for sustainable food fish production. FAO Fisheries Circular No. 886. Rev. 2. pp. 37−45. Rome, FAO. (also available at www.fao.org/3/a-y4490e/y4490E03.pdf).

83References
Diarra, S., Kuper, M. & Mahé, G. 2004. Mali: flood management − Niger River inland delta. World Meteorological Organization/Global Water Partnership (WMO/GWP). Associated Programme on Flood Management. Geneva:WMO. 25 pp. (also available at http://agritrop.cirad.fr/526675).
Di Gregorio, A. 2005. Land Cover Classification System. Classification concepts and user manual. Software version 2. Environment and Natural Resources Series No. 8. Rome, FAO. 190 pp. (also available at www.glcn.org/downs/pub/docs/manuals/lccs/LCCS2-manual_en.pdf).
Direction de Pêches. 1997. Statistique de pechês, Cotonou, Benin. Data reported In P.A. Laléye, M.C. Villanueva, M. Entsua-Mensah & J. Moreau, eds. 2007. A review of the aquatic living resources in gulf of Guinea lagoons with particular emphasis on fisheries management issues. Journal Afrotropical Zoology, Special Issue: 123–136.
Dyson, M., Bergkamp, G. & Scanlon, J., eds. 2003. Flow. The essentials of environmental flows. Gland, Switzerland and Cambridge, UK, IUCN. 118 pp.
ESA (European Space Agency). 2010. GlobCover 2009 (global land cover map), released 21 December 2010. (also available at http://due.esrin.esa.int/page_globcover.php).
FAO. 1990−2016. CWP handbook of fishery statistical standards. Section J: Aquaculture. CWP data collection. In: FAO Fisheries and Aquaculture Department [online]. Rome. Updated 10 January 2002. [Accessed 20 January 2016]. www.fao.org/fishery/cwp/handbook/j/en.
FAO. 1995. A synthesis of simple empirical models to predict fish yields in tropical lakes and reservoirs. MRAG Ltd. (also available at https://www.mrag.co.uk/sites/default/files/fmspdocs/R6178/R6178_FTR.pdf).
FAO. 1999a. Indicators for sustainable development of marine capture fisheries. FAO Technical Guidelines for Responsible Fisheries. No. 8. Rome. 68 pp. (also available at www.fao.org/3/a-x3307e.pdf).
FAO. 1999b. Flood management and mitigation in the Mekong River Basin. Proceedings of the Regional Workshop, 19–21 March 1998, Vientiane, Lao People’s Democratic Republic. RAP publication 1999/14, Bangkok, FAO. (also available at www.fao.org/docrep/004/ac146e/ac146e00.HTM).
FAO. 2001. Food balance sheets. A handbook. Rome. 95 pp. (also available at www.fao.org/docrep/003/x9892e/x9892e00.htm).
FAO. 2002. Africover. The Global Landcover Network [online]. Rome. [Accessed 21 March 2014]. (also available at www.glcn.org/activities/africover_en.jsp).
FAO. 2003a. Strategy for improving information on status and trends of capture fisheries. Rome. 34 pp.
FAO. 2003b. Unlocking the water potential of agriculture. Rome. (also available at www.fao.org/docrep/006/y4525e/y4525e00.htm).
FAO. 2005. Guidelines for designing data collection and sharing systems for co-managed fisheries. Part 2: Technical guidelines. FAO Fisheries Technical Paper No. 494/2. Rome. 108 pp. (also available at www.fao.org/docrep/009/a0231e/a0231e00.htm).
FAO. 2005–2016a. National Aquaculture Sector Overview. Bangladesh. National Aquaculture Sector Overview Fact Sheets. Text by Gias, U.A. In: FAO Fisheries and Aquaculture Department [online]. Rome. Updated 1 January 2005. [Accessed 1 March 2016]. www.fao.org/fishery/countrysector/naso_bangladesh/en.
FAO. 2005–2016b. National Aquaculture Sector Overview. China. National Aquaculture Sector Overview Fact Sheets. Text by Shuping, C. In: FAO Fisheries and Aquaculture Department [online]. Rome. Updated 1 February 2005. [Accessed 15 February 2016]. www.fao.org/fishery/countrysector/naso_china/en.
FAO. 2006−2016. Fisheries and aquaculture software. FishStat Plus – Universal software for fishery statistical time series. In: FAO Fisheries and Aquaculture Department [online]. Rome. Updated 28 November 2013. [Cited 12 November 2014]. www.fao.org/fishery/statistics/software/fishstat/en.
Assessing water availability and economic, social and nutritional contributions from inland capture fisheries and aquaculture84
FAO. 2007. Building adaptive capacity to climate change. Policies to sustain livelihoods and fisheries. New Directions in Fisheries – A Series of Policy Briefs on Development Issues No. 8. Sustainable Fisheries Livelihoods Programme (SFLP). Rome. 16 pp. (also available at www.fao.org/docrep/010/a1115e/a1115e00.pdf).
FAO. 2009. Adaptive water management in the Lake Chad Basin. Addressing current challenges and adapting to future needs. World Water Week, Stockholm, 16–22 August 2009, Stockholm. (also available at www.fao.org/nr/water/docs/chadwww09.pdf).
FAO. 2010. FAO expert consultation on the development of guidelines for the ecolabeling of fish and fishery products from inland capture fisheries. FAO Fisheries and Aquaculture Report No. 943. Rome. (also available at www.fao.org/docrep/013/k8599e/k8599e00.pdf).
FAO. 2011a. The State of the world’s land and water resources for food and agriculture (SOLAW) – managing systems at risk. Rome, FAO and London, Earthscan. 285 pp. (also available at www.fao.org/docrep/017/i1688e/i1688e.pdf).
FAO. 2011b. FAO workshop to develop an FAO strategy for assessing the state of inland capture fisheries resources, Rome, 7−9 December 2011. FAO Fisheries and Aquaculture Report No. 1016. Rome. 37 pp. (also available at www.fao.org/docrep/016/i3046e/i3046e00.htm).
FAO. 2011c. The State of Food and Agriculture 2010–2011. Women in agriculture: closing the gender gap for development. Rome. 147 pp. (also available at www.fao.org/docrep/013/i2050e/i2050e.pdf).
FAO. 2011d. Cambodia. national fishery sector overview. Rome. 12 pp. (also available at ftp://ftp.fao.org/fi/document/fcp/en/FI_CP_KH.pdf).
FAO. 2013. FAOSTAT glossary list [online]. Rome. [Accessed 1 March 2016]. http://faostat.fao.org/site/375/default.aspx
FAO. 2014a. FAO yearbook. Fishery and aquaculture statistics. 2012/FAO annuaire. Statistiques des pêches et de l’aquaculture. 2012/FAO anuario. Estadísticas de pesca y acuicultura. 2012. Rome. 76 pp. (also available at www.fao.org/fishery/publications/yearbooks/en).
FAO. 2014b. The State of World Fisheries and Aquaculture. Opportunities and Challenges. Rome. 243 pp. (also available at www.fao.org/3/a-i3720e.pdf).
FAO. 2015. World Programme for the Census of Agriculture (WCA). FAO Statistical Development Series 15. Rome. 204 pp. (also available at www.fao.org/3/a-i4913e.pdf).
FAO. 2016a. Assessing water availability and economic social and nutritional contributions from inland capture fisheries and aquaculture: an indicator-based framework – A compilation of water-related indicators in selected African and Asian countries, by Daniela Ottaviani, Cassandra De Young & Sachiko Tsuji. FAO Fisheries and Aquaculture Circular Paper No. 1116. Rome.
FAO. 2016b. Lessons learnt in water accounting: the fisheries and aquaculture perspective, by Daniela Ottaviani, Cassandra De Young & Sachiko Tsuji. FAO Fisheries and Aquaculture Technical Paper No. 599. Rome.
Fortnam, M.P. & Oguntola, J.A. 2004. Lake Chad Basin. GIWA regional assessment 43. Kalmar, Sweden, UNEP and University of Kalmar.
Garibaldi, L. 2012. The FAO global capture production database: a six-decade effort to catch the trend. Marine Policy, 36: 760–768.
Gee, J. & Tsuji, S. 2015. Guidelines to enhance fisheries and aquaculture statistics through a census framework. Global Strategy. Rome, FAO. 165 pp. (also available at http://gsars.org/en/guidelines-to-enhance-fisheries-and-aquaculture-statistics-through-a-census-framework/).
Grainger, R.J.R. & Garcia, S.M. 1996. Chronicles of marine fishery landings (1950–1994): trend analysis and fisheries potential. FAO Fisheries Technical Paper No. 359. Rome, FAO. 51 pp.
Hall, S.J., Delaporte, A., Phillips, M.J., Beveridge, M. & O’Keefe, M. 2011. Blue frontiers: managing the environmental costs of aquaculture. Penang, WorldFish Center.
85References
Halle, B. & Burgess, J. 2006. Country environmental profile for Malawi. Les Isnes, Belgium, AGRIFOR Consult. 106 pp. (also available at http://aei.pitt.edu/50267/1/Malawi.2006.pdf).
Halls, A.S., Arthur, R., Bartley, D., Felsing, M., Grainger, R., Hartmann, W., Lamberts, D., Purvis, J., Sultana, P., Thompson, P. & Walmsley, S. 2005. Guidelines for designing data collection and sharing systems for co-managed fisheries. Part 2: Technical guidelines. FAO Fisheries Technical Paper No. 494/2. Rome, FAO. 108 pp. (also available at www.fao.org/docrep/009/a0231e/a0231e00.htm).
Halwart & M.V. Gupta, eds. 2004. Culture of fish in rice fields. Rome, FAO and WorldFish Center. 83 pp. (also available at www.fao.org/3/a-a0823e.pdf).
Halwart, M., Funge-Smith, S. & Moehl, J. 2003. The role of aquaculture in rural development. In: FAO Review of the State of World Aquaculture. FAO Fisheries Circular No. 886. Rev. 2, pp. 47–58. Rome, FAO.
Hauber, M.E., Bierbach, D. & Linsenmair, K.E. 2011. The traditional whedos aquaculture system in northern Benin. Journal of Applied Aquaculture, 23: 67–84
Hijmans, R.J., Cameron, S.E., Parra, J.L., Jones, P.G. & Jarvis, A. 2005. Very high resolution interpolated climate surface for global land areas. International Journal of Climatology, 25: 1965–1978.
HLPE (High Level Panel of Experts on Food Security and Nutrition). 2014. Sustainable fisheries and aquaculture for food security and nutrition. A report by the High Level Panel of Experts on Food Security and Nutrition of the Committee on World Food Security, Rome. (also available at www.fao.org/3/a-i3844e.pdf).
ICLARM & GTZ. 1991. The context of small-scale integrated agriculture-aquaculture systems in Africa: a case study of Malawi. ICLARM study. pp. 302 (also available at http://pdf.usaid.gov/pdf_docs/PNABL265.pdf).
IPCC (Intergovernmental Panel on Climate Change). 2014. Climate change 2014: impacts, adaptation, and vulnerability. Part A: global and sectoral aspects. In: C.B. Field, V.R. Barros, D.J. Dokken, K.J. Mach, M.D. Mastrandrea, T.E. Bilir, M. Chatterjee, K.L. Ebi, Y.O. Estrada, R.C. Genova, B. Girma, E.S. Kissel, A.N. Levy, S. MacCracken, P.R. Mastrandrea and L.L. White, eds. Contribution of Working Group II to the Fifth Assessment Report of the Intergovernmental Panel on Climate Change. Cambridge, United Kingdom and New York, NY, USA, Cambridge University Press. 1132 pp.
Jenness, J., Dooley, J., Aguilar-Manjarrez, J. & Riva, C. 2007. African water resources database. GIS-based tools for inland aquatic resources management. CIFA Technical Paper No. 33/1. Rome, FAO. 165 pp.
Joffre, O. Kosal, M., Kura, Y., Pant, J. & Nam, S. 2013. Aquaculture for the poor in Cambodia. Lessons learned. Phnom Penh, WorldFish Center. (also available at www.worldfishcenter.org/resource_centre/WF_2769.pdf).
Joseph, L. 2004. National report of Sri Lanka on the formulation of a transboundary diagnostic analysis and strategic action plan for the Bay of Bengal large marine ecosystem programme. Rome, FAO. 125 pp. (also available at www.boblme.org/documentRepository/Nat_Sri_Lanka.pdf).
Jung, H.C., Alsdorf, D., Moritz, M., Lee, H. & Vassolo, S. 2011. Analysis of the relationship between flooding area and water height in the Logone floodplain. Physics and Chemistry of the Earth, Parts A/B/C, 36(7): 232–240. (also available at https://www.researchgate.net/publication/257603827_Analysis_of_the_relationship_between_flooding_area_and_water_height_in_the_Logone_floodplain).
Kapetsky, J.M. & Barg, U. no date. Land quality indicators from the viewpoint of inland fisheries and aquaculture. Rome, FAO. (also available at www.fao.org/docrep/W4745E/w4745e0e.htm).
Kohli, A., Frenken, K. & Spottorno, C. 2010. Disambiguation of water use statistics. FAO Aquastat Report. Rome, FAO 7 pp. (also available at www.fao.org/nr/water/aquastat/catalogues/Water_Terminology_20120523.pdf).

Assessing water availability and economic, social and nutritional contributions from inland capture fisheries and aquaculture86
Kosamu, I., de Groot, W.T., Kambewa, P.S., & de Snoo, G.R. 2012. Institutions and ecosystem-based development potentials of the Elephant Marsh, Malawi. Sustainability, 4: 3326–3345
Lamberts, D. 2008. Little impact, much damage: the consequences of Mekong River flow alterations for the Tonlé Sap Ecosystem. In M. Kummu, M. Keskinen, & O. Varis, eds. Modern myths of the Mekong, pp. 3–18. Espoo, Finland, Helsinki University of Technology and TKK Water Resources Laboratory. (also available at http://water.tkk.fi/English/wr/research/global/myth/01_Lamberts_Myths-of-Mekong.pdf).
Lehner, B. & Doll, P. 2004. Development and validation of a global database of lakes, reservoirs and wetlands. Journal of Hydrology, 296: 1–22.
Lorenzen, K., Amarasinghe, U.S., Bartley, D.M., Bilio, M., de Silva, S.S., Garaway, C.J., Hartmann, W.D., Kapetsky, J.M., Laleye, P., Moreau, J., Sugunan, V.V. & Swar, D.B. 2001. Strategic Review of enhancements and culture-based fisheries. In R.P. Subasinghe, P. Bueno, M.J. Phillips, C. Hough, S.E. McGladdery & J.R. Arthur, eds. Aquaculture in the Third Millennium. Technical Proceedings of the Conference on Aquaculture in the Third Millennium, 2000 pp. Bangkok, Thailand, 20−25 February 221−237. Bangkok, NACA and Rome, FAO. (also available at www.fao.org/docrep/003/AB412E/ab412e11.htm).
Lymer, D. & Funge-Smith, S. 2009. An analysis of historical national reports of inland capture fisheries statistics in the Asia-Pacific region (1950–2007). FAO Regional Office for Asia and Pacific. RAP Publication. Bangkok, FAO. 18 pp. (also available at ftp://ftp.fao.org/docrep/fao/012/i1253e/i1253e00.pdf).
Lymer, D., Funge-Smith, S., Khemakorn, P., Naruepon, S., & Ubolratana, S. 2008. A review and synthesis of capture fisheries data in Thailand. Large versus small-scale fisheries. RAP Publication 2008/17. Bangkok, FAO. 51 pp.
MacDonald, M. 1999. Logone floodplain model study report. Cambridge, UK.Mapila, S.A. 1998. Chapter 5: Fisheries. State of environment report for Malawi. (also
available at www.sdnp.org.mw/enviro/soe_report/contributors.html).Meaden, G.J. & Kapetsky, J.M. 1991. Geographical information systems and remote
sensing in inland fisheries and aquaculture. FAO Fisheries Technical Paper 318. Rome, FAO. 262 pp. (also available at www.fao.org/docrep/003/t0446e/t0446e00.htm).
MOFA (Ministry of Food and Aquaculture). 2003. Fisheries management plan for the Lake Volta. Accra, Ghana, Ministry of Food and Aquaculture. 75 pp. In C. Béné. 2007. Diagnostic study of the Volta Basin fisheries. Part 1: Overview of the Volta Basin fisheries resources, Penang, Malaysia, WorldFish Center Regional Office for Africa and West Asia Cairo. 31 pp.
Nagabhatla, N. & van Brakel, M. 2010. Landscape level characterization of seasonal floodplains under community based aquaculture: illustrating a case of the Ganges and the Mekong Delta. CBFC Working Paper No. 4. Penang, Worldfish Center and CGIAR. (also available at http://pubs.iclarm.net/resource_centre/CBFC/4_Nagabhatla_landscape%20report.pdf).
National Aquaculture Development Authority of Sri Lanka. 2010. Brackishwater (available at www.naqda.gov.lk/brackish_water.php).
National Bureau of Statistics of China. 2012. China Statistical Yearbook 2012. Area of wetlands by region. Tables 12−28. (also available at www.stats.gov.cn/tjsj/ndsj/2012/indexeh.htm).
Needham, S. & Funge-Smith, S.J. 2014. The consumption of fish and fish products in the Asia-Pacific region based on household surveys. RAP Publication 2015/12. Bangkok, FAO. 87 pp.
Nissanka, C., Amarasinghe, U.S. & De Silva, S.S. 2000. Yield predictive models for Sri Lankan reservoir fisheries. Fisheries Management and Ecology, 7: 425–436. (also available at http://onlinelibrary.wiley.com/doi/10.1046/j.1365-2400.2000.00212.x/epdf).

87References
Nwafili, S.A. & Gao, T. 2007. Structure and dynamics of fisheries in Nigeria. Journal of Ocean University of China, 6: 281–291. (also available at http://link.springer.com/article/10.1007%2Fs11802-007-0281-5).
OECD. 2002. Fisheries sustainability indicators: the OECD experience. Paris. OEPP. 1999. Data reported In SEA. 2004. Draft national action plan on wetland management
in the Gulf of Thailand under the UNEP-GEF project on reversing environmental degradation trends in the South China Sea and Gulf of Thailand. Bangkok, Thailand, Kasetsart University. (also available at www.unepscs.org/remository/startdown/1735.html).
Oo, W. 2002. Inland fisheries of the Union of Myanmar. In T.Petr & D.B. Swar, eds. Cold water fisheries in the trans-Himalayan countries. FAO Fisheries Technical Paper No. 431. Rome, FAO. 33 pp. (also available at www.fao.org/3/a-y3994e.pdf).
Palstra, A.P. & Planas, J.V. 2011. Fish under exercise. Fish physiology and biochemistry, 37: 259–272.
Peterson, J. & Keller, H. 2006. The potential for irrigation-aquaculture in Mali. In M. Halwart, A.A. Dam van, eds. Integrated irrigation and aquaculture in West Africa: concepts, practices and potential, 77–93. Rome, FAO. 181 pp. (also available at www.fao.org/docrep/009/a0444e/A0444E09.htm).
Phiri, L.Y., Dzanja, J., Kakota, T. & Hara, M. 2013. Value chain analysis of Lake Malawi fish: a case study of Oreochromis spp. (Chambo). International Journal of Business and Social Science, 4: 170–181. (also available at http://repository.uwc.ac.za/xmlui/bitstream/handle/10566/942/PhiriLakeMalawi2013.pdf?sequence=3).
Phonvisay, S. 2013. An introduction to the Fisheries of Lao PDR. Mekong Development Series No. 6. Phnom Penh, Mekong River Commission. 62 pp. (also available at www.mrcmekong.org/assets/Publications/report-management-develop/Mek-Dev-No6-An-Intro-Fisheries-of-LaoPDR.pdf).
Rackowe, R., Amondakoon, H.P. & Varley, J.W. 2009. Marine fisheries sector assessment in eastern Sri Lanka. Colombo, Sri Lanka, connecting regional economies, USAID/CORE programme. (also available at http://pdf.usaid.gov/pdf_docs/Pnadt123.pdf).
Rahaman, M.M., Mallick, N., Shamsuzzaman, M., Rahaman, M.Z. & Sarker, S. 2012. On the way of success: aquaculture economics of Noakhali, Bangladesh. Agricultural Science Research Journals, 2: 55. (also available at www.resjournals.com/journals/agricultural-science-research-journal/AGRIC%202012%20OCT/Rahaman%20et%20al.pdf).
Rana, K.J. 1997. Guidelines on the collection of structural aquaculture statistics. Supplement to the Programme of the World Census of Agriculture 2000. FAO Statistical Development Series No. 5B. Rome. 56 pp. (also available at www.fao.org/fileadmin/templates/ess/ess_test_folder/Publications/SDS/5b_guidelines_on_the_collection_of_structural_aquaculture_statistics.pdf).
Renault, D. & Wallender, W.W. 2000. Nutritional water productivity and diets: from ‘crop per drop’ to ‘nutrition per drop’. Agricultural Water Management, 45: 275–296.
Russell, A.J., Coulibaly, S., Sinaba, F., Kodio, A., Joffre, O. & Sheriff, N. 2010. Institutional histories, seasonal floodplains (mares), and livelihood impacts of fish stocking in the Inner Niger River Delta of Mali. CBFC Working Paper No. 5. WorldFish Center and CGIAR Challenge Program on Water and Food. 23 pp. (also available at http://pubs.iclarm.net/resource_centre/CBFC/5_Russell_Instit%20Histories.pdf).
Sahara Conservation Fund. 2011. Chad. (available at www.saharaconservation.org/?Chad).Sarch, M. & Birkett, C. 2000. Fishing and farming at Lake Chad: responses to lake-
level fluctuations. The Geographical Journal, 166: 156–172. (also available at http://onlinelibrary.wiley.com/doi/10.1111/j.1475-4959.2000.tb00015.x/epdf).
Schmidt-Kallert, E. 1990. The Volta reservoir in Ghana – a review. Applied Geography and Development, (35): 77–93. (also available at www.raumplanung.tu-dortmund.de/ips/cms/Medienpool/documents/The_Volta_Reservoir.pdf).
Assessing water availability and economic, social and nutritional contributions from inland capture fisheries and aquaculture88
SEAFDEC (Southeast Asian Fisheries Development Center). 2005. Handbook on collecting fishery statistics for inland and coastal fisheries. Bangkok, Southeast Asian Fisheries Development Center.
Shela, O.N. 2000. Naturalization of Lake Malawi levels and Shire River flows. Challenges of water resources research and sustainable utilisation of the Lake Malawi-Shire River System. 1st WARFSA/WaterNet Symposium: Sustainable Use of Water Resources, Maputo, 1−2 November 2000. 1–12 pp.
Smith, L.E., Khoa, S.N. & Lorenzen, K. 2005. Livelihood functions of inland fisheries: policy implications in developing countries. Water Policy, 7: 359–383. (also available at http://wp.iwaponline.com/content/7/4/359.full.pdf).
So, N., Eng, T., Souen, N. & Hortle, K.G. 2005. Use of freshwater low-value fish for aquaculture development in Cambodia’s Mekong Basin. In: H. Navy & U. Sophea, eds. 2012. Value chain analysis of five key fish species: inland fisheries of Cambodia. Phnom Penh, Cambodia, Inland Fisheries Research and Development Institute of Cambodia (IFReDI).
Soe, K.M. 2008. Trends of development of Myanmar fisheries: with references to Japanese experience. Chiba, Institute of Developing Economies, Japan External Trade Organization. (also available at www.ide.go.jp/English/Publish/Download/Vrf/pdf/433.pdf).
Spalding, M., Kainuma, M. & Collins, L. eds. 2010. World atlas of mangroves. London, Earthscan.
Sugunan, V.V. 1997. Fisheries management of small water bodies in seven countries in Africa, Asia and Latin America. FAO Fisheries Circular No. 933. Rome, FAO. 149 pp. (also available at www.fao.org/docrep/w7560e/w7560e00.htm).
Sugunan, V.V. 2010. Inland fishery resource enhancement and conservation in India. In W. Miao, S.D. Silva, B. Davy, eds. 2010. Inland fisheries enhancement and conservation in Asia, 189 pp. RAP Publication 2010/22. Bangkok, FAO.
Tacon, A.G.J. & Metian, M. 2009. Fishing for feed or fishing for food: increasing global competition for small pelagic forage fish. Ambio, 38: 294–302.
Tockner, K. & Standford, J.A. 2002. Riverine flood plains: present state and future trends. Environmental Conservation, 29: 308–330. (also available at http://scholarworks.umt.edu/cgi/viewcontent.cgi?article=1170&context=biosci_pubs).
Toguyen, A. 2004. Tilapia production and its global impact in Central Africa. Sixth International Symposium on Tilapia Aquaculture. 12–16 September 2004. Manila, Université Polytechnique de Bobo-Dioulasso. (also available at http://ag.arizona.edu/azaqua/ista/ista6/ista6web/pdf/691.pdf).
Toldrá, F. & Nollet, L.M. eds. 2012. Proteomics in foods: principles and applications. New York, Springer.
UNEP. 2010. Blue harvest: inland fisheries as an ecosystem service. Penang, WorldFish Center. (also available at www.unep.org/pdf/Blue_Harvest.pdf).
United Nations. 2011. Statistical yearbook: fifty-fourth issue. Table 7. New York, United Nations Publisher. 828 pp. (also available at http://unstats.un.org/unsd/publications/statistical-yearbook/files/syb58/syb58.pdf).
United Nations Population Fund (UNPF) & Women’s Environment and Development Organization (WEDO). 2008. Common ground in Bangladesh, Ghana, Nepal, Senegal and Trinidad and Tobago. Climate change connection, 3: 1–8. (also available at www.unfpa.org/sites/default/files/pub-pdf/climate_3_casestudies.pdf).
UN-Water. 2009. Monitoring progress in the water sector: a selected set of indicators. UN-Water task force on indicators, monitoring and reporting. New York, United Nations Publisher. (also available at www.unwater.org/downloads/TFIMR_FinalReport.pdf).
Vanden Bossche, J.P. & Bernacsek, G.M. 1990a. Source book for the inland fishery resources of Africa. Volume 2. CIFA Technical Paper No. 18. Rome, FAO. 240 pp. (also available at www.fao.org/docrep/005/t0360e/t0360e00.HTM).

89References
Vanden Bossche, J.P. & Bernacsek, G.M. 1990b. Source book for the inland fishery resources of Africa. Volume 1. CIFA Technical Paper No. 18/1. Rome, FAO. 240 pp. (also available at www.fao.org/docrep/005/t0473e/t0473e00.HTM).
Vanden Bossche, J.P. & Bernacsek, G.M. 1990c. Source book for the inland fishery resources of Africa. Volume 3. CIFA Technical Paper No. 18/1. Rome, FAO. 240 pp. (also available at www.fao.org/docrep/005/t0361e/t0361e00.htm).
Van Zalinge, N. 2002. Update on the status of the Cambodian inland capture fisheries sector with special reference to the Tonlé Sap Great Lake. Catch and Culture, 8: 1–5. (also available at http://tinyurl.com/nwvlscf).
Van Zalinge, N., Thuok, N. & Nuov, S. 2001. Status of the Cambodian inland capture fisheries with special reference to the Tonlé Sap Great Lake. In Inland Fisheries Research and Development Institute of Cambodia (IFReDI), ed., pp. 10−16. Cambodia Fisheries Technical Paper Series, Volume III. Phnom Penh, Cambodia, Inland Fisheries Research and Development Institute of Cambodia (IFReDI). (also available at http://tinyurl.com/p6tlhec).
Van Zalinge, N., Degen, P., Pongsri, C., Nuov, S., Jensen, J., Nguyen, V.H. & Choulamany, X. 2004. The Mekong River system. In R.L. Welcomme & T. Petr, eds. Proceedings of the Second International Symposium on the Management of Large Rivers for Fisheries, Volume 1, pp. 333–355. Bangkok, FAO. 356 pp. (also available at www.fao.org/docrep/007/ad525e/ad525e00.HTM).
Weeratunge, N. & Snyder, K. 2010. Gleaner, fisher, trader, processor: understanding gendered employment in the fisheries and aquaculture sector. Fish and Fisheries, 11: 405–420. (also available at www.fao-ilo.org/fileadmin/user_upload/fao_ilo/pdf/Papers/Weeratunge-final.pdf).
Welcomme, R.L. 1979a. The inland fisheries of Africa. CIFA Occasional Paper No. 7. Rome, FAO. 69 pp. (also available at www.fao.org/docrep/008/n0084e/N0084E00.htm#TOC).
Welcomme, R.L. 1979b. Fishery ecology of floodplain rivers. London, Longman. (also available at www.fao.org/docrep/003/t0537e/t0537e00.htm).
Welcomme, R.L. 1999. Management guidelines for Asian floodplain river fisheries. Part 1. A spatial, hierarchical and integrated strategy for adaptive co-management. FAO Fisheries Technical Paper No. 384/1. FAO, Rome. 63 pp.
Welcomme R. & Halls A. 2004. Dependence of tropical river fisheries in flow. In R. Welcomme & T. Petr, eds. Proceedings of the second international symposium on the management of large rivers for fisheries volume II, pp. 1−14. RAP Publication 2004/17. Bangkok, FAO. (also available at www.fao.org/docrep/007/ad526e/ad526e0k.htm#bm20).
Welcomme, R. & Lymer, D. 2012. An audit of inland capture fishery statistics – Africa. FAO Fisheries and Aquaculture Circular No. 1051. Rome, FAO. 61 pp. (also available at www.fao.org/docrep/017/i2608e/i2608e.pdf).
Welcomme, R.L., Cowx, I.G., Coates, D., Béné, C., Funge-Smith, S., Halls, A. & Lorenzen, K. 2010. Inland capture fisheries. Philosophical Transaction of the Royal Society B, 365: 2881–2896. (also available at http://rstb.royalsocietypublishing.org/content/royptb/365/1554/2881.full.pdf).
Wikipedia, no date. List of countries and dependencies by area. (also available at https://en.wikipedia.org/wiki/List_of_countries_and_dependencies_by_area).
World Bank, FAO & WorldFish Center. 2010. The hidden harvests: the global contribution of capture fisheries. Washington DC, World Bank. 92 pp. (available at http://tinyurl.com/ctq6yd8).
WorldFish Center. 2010. Adaptation of floodplain fishing communities to hydro-climatic changes in the Niger basin: lessons learned. Penang, WorldFish Center. (also available at www.worldfishcenter.org/resource_centre/WF_2593.pdf).

Assessing water availability and economic, social and nutritional contributions from inland capture fisheries and aquaculture90
Zwarts, L. & Diallo, M. 2005. Fisheries in the Inner Niger Delta. In L. Zwarts, P. van Beukering, B. Kone & E. Wymenga, eds. The Niger, a lifeline. Effective water management in the Upper Niger Basin, pp. 89–107. Lelystad, Netherland, RIZA and Wageningen, Wetlands International. (also available at www.prem-online.org/archive/11/doc/niger%20lifeline%205.pdf).

91
APPENDIx 1
Indicator descriptions
A1.1: INLAND wATER AREA
Definitions: The “inland water area” indicator is defined as the sum of “permanent inland waters” and “seasonally flooded areas”.
Unit of measurement: Square kilometre (km²).
Adopted criteria for compiling the indicator: Within “permanent inland waters”, the area covered by lakes29, reservoirs30, coastal lagoons31, rivers32 and permanent swamps33 is considered, whereas within “seasonally flooded areas”, it is the inundated areas created by the seasonal overflowing of water from river banks and/or seasonal fluctuations of waterbodies.
The compilation of the “inland water area” indicator poses two methodological issues related to the consideration of water resources with different temporal permanence and the distinction between inland water resources and coastal water resources:
(i) The inclusion of water resources with different temporal extents, such as permanent inland waters and seasonally flooded areas, allows for an assessment of the comprehensive vital resources for inland capture fisheries and aquaculture. Permanent swamps are considered a subcomponent of the “permanent inland waters”, while “seasonally flooded areas” are a component of the “inland water area” indicator. The distinction between permanent swamps and “seasonally flooded areas” lies in the duration of the inundation. However, there is often no information to distinguish between the two ecological categories. In this study, swamps and marshy areas have been considered within “seasonally flooded areas” unless there is explicit indication that the swamps recorded in a given country are permanent.
(ii) The distinction between inland water resources and coastal water resources is not easy to make as there is a gradual transition of inland freshwater resources flowing in the coastal areas. The criterion that has been adopted for this study considers coastal lagoons, deltas and estuaries as part of the “inland water area”, but excludes, when reported, the swampy coastal areas covered by mangroves.
29 Lake: A natural relatively large body of standing water with negligible currents and enclosed by land. It can be regarded as a relatively closed system as most of its hydrology is internal, although it may have substantial inflowing and outflowing rivers (Crespi and Coche, 2008).
30 Artificial reservoir: An artificial lake pond or basin for the collection, storage, regulation and control of water and for its use when required (Crespi and Coche, 2008).
31 Coastal lagoon: A shallow body of water, as a pond or lake, separated from the sea by sandbars, often associated with estuaries, and which may have a shallow, restricted outlet to the sea. They show great seasonal variation in salinity, being fed from associated freshwater rivers for part of the year and from the sea for the remainder (Crespi and Coche, 2008).
32 River: Natural water course from 5 to 100 m wide, running into another water course or a lake (Crespi and Coche, 2008).
33 Swamp: Type of wetland with water standing permanently or for a considerable period of time and with a dense cover of native vegetation. Swamps may be freshwater or saltwater, and tidal or non-tidal. (Crespi and Coche, 2008).

Assessing water availability and economic, social and nutritional contributions from inland capture fisheries and aquaculture92
Major data sources: There are three major types of data sources used in the assessment of the “inland water area” and its subcomponents (i.e. “permanent inland waters” and “seasonally flooded areas”) in each country:
(i) Research papers, reports and documents related to different assessments of inland capture fisheries and aquaculture carried out at the country level.
(ii) FAOSTAT country-level statistics of “inland waters” in each country derived from the difference between official statistics of country area (i.e. political boundary) and land area (i.e. terrestrial portion of the country area).
(iii) Geographic Information System (GIS) maps depicting the area of inland water resources within a country’s land cover. In particular, the following GIS data sets have been used: the Global Lakes and Wetlands Database; GlobCover; Africover (FAO, 2002); and the Landsat satellite imagery of Lake Chad.
The Global Lakes and Wetlands Database (GLWD) is the most comprehensive global data set of inland waters available (Lehner and Doll, 2004). The global data set, a raster map at 30 arc-second resolution (approximately 300 metres resolution), includes 11 different categories. After a careful examination of the mapped different categories, only the lake, reservoir and river categories have been included in the assessment of the extent of “permanent inland waters”. The GLWD data set includes 3 067 lakes (with surface areas ≥ 50 km2), and 250 000 smaller lakes in addition to 654 reservoirs and rivers (with surface areas ≥ 0.1 km2).
The following categories are excluded:• coastal wetlands, as they often include marine areas in addition to coastal areas;•bogs not relevant for fishery activities, as only highly specialized animals and
plants are associated with this type of habitat;•brackish and saline areas, as they are mainly located in interior regions and are
associated with very saline and dry environments that are unlikely to be used for fishery activities;
• swamps, as they are often represented by polygons drawn with very low accuracy that create large overestimations of the real extent of flooded areas;
•marshes, as they are often represented by polygons drawn with low accuracy and include not only the marshy area, but also the whole protected area in which marshes are located;
• intermittent wetland/lake areas, as they are mainly found in Saharan Africa and are therefore unlikely to be fish habitats; and
•wetland complex at a different degree between land and water (0–25 percent; 25–50 percent; 50–100 percent of water/land), as it is difficult to define if and when they could constitute potential fish habitats.
GlobCover is a global land cover map at a spatial resolution of 300 metres, which includes 22 land cover classes defined by the United Nations Land Cover Classification System (ESA, 2010; Di Gregorio, 2005). The land cover map is compiled by the European Space Agency using satellite images acquired through Envisat’s Medium Resolution Imaging Spectrometer (MERIS) in 2009 (Bontemps et al., 2011). For the purpose of this study, the most relevant classes in the GlobCover 2009 include:
•Closed (> 40 percent) broad-leaved forest regularly flooded − freshwater (class code 160).
•Closed to open (> 15 percent) vegetation (grassland, shrubland, woody vegetation) on regularly flooded or waterlogged soil – fresh-, brackish or saline water (class code 180).
•Closed (> 40 percent) broad-leaved semi-deciduous and/or evergreen forest regularly flooded – saline water (class code 170) mainly maps mangrove coastal areas. This class is not considered in the assessment of “seasonally flooded areas”, following the criterion of excluding mangrove areas used to separate inland and from coastal water resources.
93Appendix 1
Africover is a land cover map compiled by the FAO Global Land Cover Network, derived from remote sensing at a spatial resolution of 30 metres (FAO, 2002). It contains land cover classes defined by the United Nations Land Cover Classification System (LCCS) (Di Gregorio, 2005), which includes single continuous class polygons (one LCCS code) and mixed-class polygons (two-three LCCS codes represented in different percentages) (Di Gregorio, 2005). Africover is available for 10 different East African countries, and in this study it was used to map the “permanent inland waters” and “seasonally flooded areas” for the Democratic Republic of the Congo.
Lake Chad has been shrinking gradually, as its open surface water was reduced from about 25 000 km2 in 1963 to less than 2 000 km2 in the 1990s. In order to assess the current extent of Lake Chad, the Landsat Global Land Survey (GLS) data set was used. The data set, compiled by the U.S. Geological Survey (USGS) and NASA, has four layers derived from four sets of Landsat images from different time frames (1970s, 1990s, 2000 and 2005). Each of these global data sets was created from the primary Landsat sensor in use at the time: the Multispectral Scanner in the 1970s, the Thematic Mapper (TM) in 1990, the Enhanced Thematic Mapper Plus (ETM+) in 2000, and a combination of TM and ETM+ in 2005.
The area covered by the open water of Lake Chad was digitalized from the Landsat (GLS) image, and the obtained polygon was overlaid on the Centre National d’Etudes Spatiales (CNES) Spot image of 2013, available on Google Earth. Because a good correspondence between the spatial features of the Landsat image and the CNES spot image was recorded, it has been assessed that the area covered by the open surface water of Lake Chad in 2013 is about 1 637 km2, of which 936 km2 is in Chad and 701 km2 in Cameroon.
Adopted criteria in assembling the indicator: The “inland water area” in a given country is often reported as a single value expressed in square kilometres. However, such a synthetic figure is difficult to interpret without an understanding of the types of water resources considered in the estimate.
In order to assemble the “inland water area” indicator, data have been retrieved on the extent of permanent inland waters and, when possible, the subcomponents (i.e. lakes, rivers and reservoirs, permanent swamps) and “seasonally flooded areas”.
The comparison of multiple sources of information has been the best approach to estimate the existing water resources at the country level. Initially, GIS data sets are screened to derive baseline reference figures of “permanent inland waters” and “seasonally flooded areas”. In the estimate of “permanent inland waters” (lakes, reservoirs, rivers, lagoons and permanent swamps) from GIS maps, the river components are usually a critical feature. While lakes, reservoirs, lagoons and deltas are relatively easy to map as polygons of different shapes and sizes, the extent of rivers is particularly challenging to determine because of their linear features and the fact that the width changes throughout their course from an initially small stream through connections to other rivers and finally into a delta or estuary.
The GLWD did not allow for an accurate mapping of rivers, the smallest lakes, and ponds and minor reservoirs below the raster resolution (approximately 300 metres). Thus, the sum of the area covered by lakes, reservoirs and rivers derived from the GLWD for a given country has been considered as the baseline reference estimate of the “permanent inland waters”. This estimate has been compared with other available sources of information, when available, in order to approximate the most likely estimate of natural inland water resources at the country level.
GlobCover (2009) has been used to derive an estimate of the “seasonally flooded areas” by considering the sum of class code 160 and class code 180 (see above definitions). However, due to its limited resolution, GlobCover maps only a small share of “seasonally flooded areas” in a country and it was mainly used to obtain baseline reference figures.
Assessing water availability and economic, social and nutritional contributions from inland capture fisheries and aquaculture94
Africover, due to its high spatial resolution, is a preferential data source for deriving both estimates of the “permanent inland waters” and the “seasonally flooded areas” for the Democratic Republic of the Congo.
Spatial coverage: The indicator is compiled for all analysed African and Asian countries.
Resolution and limits: The “inland water area” indicator is constituted by the sum of the “permanent inland waters” and the “seasonally flooded areas”. The resolution and the accuracy of the estimate of “inland water area” vary greatly on a country basis. In general terms, countries characterized by large well-defined waterbodies record more consistency among different data sources, and GIS data sets are able to capture the largest share of existing water resources. On the contrary, countries that are characterized by large river networks tend to systematically show an underestimation of the “permanent inland waters” due to their river component. As explained above, the extent of rivers is difficult to map and to quantify. Thus, in such countries the final reliability of the indicator depends on the degree to which “seasonally flooded areas” can compensate for such data bias.
Use of the indicator and next steps: The estimate of “inland water area” is essential for the assessment of water availability. One important refinement of this study is to consolidate and validate the estimates of the “inland water area” by confirming the current extent of the “permanent inland waters” and “seasonally flooded areas” at the country level. This validation is needed given that the most detailed level of information is often found in specialized reports and assessments for the fisheries sector published in the 1990s. The comparison of these estimates with more recent GIS data sets has not allowed confirmation with earlier estimates, as both the GLWD database and the GlobCover maps do not have a sufficient degree of spatial resolution.

95Appendix 1
A1.2: PERCENTAGE OF INLAND wATER OvER COUNTRy AREA
Definition: The “percentage of inland water over country area” is defined as the ratio of the “inland water area” and the country area defined by its political boundaries.
Unit of measurement: Percentage.
Adopted criteria in defining the indicator: The definition for “inland water area” is reported in the indicator description. The country area should be measured as the area under national sovereignty, including its land territory (land area plus inland waters), internal waters and territorial seas, excluding the contiguous zone (Article 22, UNCLOS) and exclusive economic zone (Part V, UNCLOS). However, no explicit definition of country area is reported in the publication of the United Nations (2011) from which country areas are extracted to assemble the indicator.
Major data sources: The values of the country areas are extracted from the publication of the United Nations (2011). The data sources used to estimate the “inland water area” is described in A1.1.
Adopted criteria in assembling the indicator: No specific criteria used in assembling the indicator.
Spatial coverage: The indicator is compiled for all African and Asian countries analysed.
Resolution and limits: This indicator records quite a wide range of values; higher values are often linked with the inclusion of extensive “seasonally flooded areas” in the compilation of the “inland water area”.
Use of the indicator and next steps: The indicator can be useful to compare the “inland water area” among countries, which show marked differences not only in the extent of freshwater and brackish-water resources, but also in the size of their territories (i.e. country area).

Assessing water availability and economic, social and nutritional contributions from inland capture fisheries and aquaculture96
A1.3: PERCENTAGE OF PERMANENT INLAND wATER OvER INLAND wATER AREA
Definition: The “percentage of permanent inland water over inland water area” is defined as the ratio
between the area of “permanent inland waters” and the “inland water area”.
Unit of measurement: Percentage.
Adopted criteria in defining the indicator: The definition of “permanent inland waters” and the definition of the “inland water area” are described in A1.1.
Major data sources: The data sources used to estimate “permanent inland waters” and “inland water area” are described in A1.1.
Adopted criteria in assembling the indicator: No specific criteria have been used in assembling the indicator.
Spatial coverage: The indicator is compiled for all African and Asian countries analysed.
Resolution and limits: The indicator measures the relative amount of “permanent inland waters” to the extent of total “inland water area” in a country.
In particular, a high value for this indicator shows a predominance of “permanent inland waters”, which are expected to be more resilient to climate change and to function as water storage systems providing buffer water resources against water scarcity. On the contrary, a low value recorded for this indicator shows a predominance of “seasonally flooded areas”, which are likely to decrease with increased temperatures and variation in the rainfall pattern, showing a potential greater level of vulnerability to climate change.
Use of the indicator and next steps: The indicator can be useful to provide a coarse assessment of the existing water resources that could support climate mitigation and planning. In addition, the indicator could be used to assess the variation of the extent of “seasonally flooded areas” over time. In fact, “seasonally flooded areas”, because of their relative shallow waters, are likely to change more evidently their area with a contraction or expansion due to a potential combined effect of climate change and inappropriate water management. However, in order to use the indicator for this purpose, several standardized repeated measurements should be carried out at appropriate time intervals.
97Appendix 1
A1.4: INLAND wATER AREA AND AqUACULTURE POND AREA
Definition: The “inland water area and aquaculture pond area” is defined as the sum of “inland water area” and the “aquaculture pond area”.
Unit of measurement: Square kilometre (km²).
Adopted criteria in defining the indicator: The definition of “inland water area” is reported in A1.1. The “aquaculture pond area” is defined as the overall area of aquaculture ponds in a given country. Aquaculture ponds are characterized as relatively shallow and usually small bodies of still water or with a low water refreshment rate (Crespi and Coche, 2008). In this study, the term refers to artificially formed aquaculture ponds without distinction in uses among growing, fattening, reproduction and hatching (see Crespi and Coche, 2008).
Major data sources: Data sources used for the “inland water area” indicator are described in A1.1. Official statistics on the number and size of aquaculture ponds are yearly reported by countries to the FAO Fisheries and Aquaculture Department and have been used to estimate the “aquaculture pond area”. When available, official statistics are compared with non-official estimates reported in published aquaculture assessments and documents. Hall et al. (2011) estimated the water surface used by aquaculture in a given country taking into account the group of farmed species and their production intensities. They split the aquaculture production recorded in 2008 (extracted from the FAO-FishstatJ database) for each country into the main farmed species groups. Each species group is estimated to be raised at different estimated levels of production intensities (kg/ha per year), from which the overall number of hectares used by aquaculture can be derived. This non-official estimate is available for some of the analysed Asian countries such as Bangladesh, China, India, Thailand and Viet Nam. However, since the assessment of Hall et al. (2011) often includes only some specific group of farmed species, these estimates are only used for comparison and not considered in the compilation of the “aquaculture pond area” indicator.
Adopted criteria in assembling the indicator: No specific criteria have been used in assembling the indicator.
Spatial coverage: The indicator is compiled for all analysed African and Asian countries.
Resolution and limits: The “inland water area and aquaculture pond area” indicator is mostly influenced by the estimate provided for the “inland water area”, as the “aquaculture pond area” often constitutes only a minor component. This is particularly relevant for the analysed African countries that are characterized by abundant inland water resources and have relatively low aquaculture development.
The indicator should also include an estimate on water areas used for cage and pen aquaculture, which is not available. However, since the cages are placed in natural inland waters, their extent will be covered by the “inland water area” estimation.
Use of the indicator and next steps: The “inland water area and aquaculture pond area” indicator represents the water areas required for maintaining inland capture fisheries and aquaculture activities. It is an essential indicator in this study, and it has been also used to compute derived indicators such as the “fish-water productivity – quantity”, “fish-water productivity – value”, the “average density of overall inland fishers and aquaculture farmers” and the “fish-protein water productivity”.

Assessing water availability and economic, social and nutritional contributions from inland capture fisheries and aquaculture98
A1.5: INLAND FISH PRODUCTION – qUANTITy
Definition: The “inland fish production – quantity” is defined as the sum of the “national estimate of inland capture fisheries production” and the “national estimate of non-marine aquaculture production”.
Unit of measurement: Tonnes.
Adopted criteria in defining the indicator: The “inland capture fisheries production” is defined as the extraction of living aquatic organisms from natural or artificial inland waters, but excluding those from aquaculture facilities (FAO, 2010). “Aquaculture production” is defined as the production derived from farming of aquatic organisms involving intervention in the rearing process to enhance production and the individual or corporate ownership of the stock being cultivated (FAO, 2010). For this study, only freshwater34 and brackish-water culture35 are considered, whereas mariculture36 has been excluded.
The baseline calculation of the “national estimate of inland capture fisheries production” and “national estimate of non-marine aquaculture production” is constituted by a five-year average of national official statistics of fish production referred to the period 2008–2012. Such five-year averages are expected to be more robust and less influenced by both natural fluctuations in the fish population growth, the variability in fish catch, as well as a bias of reporting fish production in national statistics.
Major data sources: The calculation of the “national estimate of inland capture fisheries production” and “national estimate of non-marine aquaculture production” is based on the official statistics yearly reported by countries to the FAO Fisheries and Aquaculture Department (Garibaldi, 2012). These official statistics are available online as well as recorded in the FAO database (FishstatJ), designed for statistical time series (FAO, 2006–2016).
Recognizing that the official statistics may not have full representation of the actual situation, in particular the contribution of small-scale activities, the document takes into account also the non-official information reported for Cambodia (van Zalinge et al., 2004); Ghana (De Graaf and Ofori-Danson, 1997); Mali (Peterson and Keller, 2006); the Lao People’s Democratic Republic (van Zalinge et al., 2004); Thailand (Lymer et al., 2008); and Viet Nam (the World Bank, FAO and WorldFish Center, 2010). Thus, for these countries, the non-official estimates of inland capture fisheries production (i.e. non-official estimates), provided by the above authors, are considered as an additional data source to compile the “national estimate of inland capture fisheries production”.
34 Freshwater culture is understood as the cultivation of aquatic organisms where the end product is raised in freshwater, such as reservoirs, rivers, lakes, canals and groundwater, in which the salinity does not normally exceed 0.5‰. Earlier stages of the life cycle of these aquatic organisms may be spent in brackish or marine waters (Crespi and Coche, 2008).
35 Brackish-water culture is understood as the cultivation of aquatic organisms where the end product is raised in brackish water, such as estuaries, coves, bays, lagoons and fjords, in which the salinity may lie or generally fluctuate between 0.5‰ and full strength seawater. If these conditions do not exist or have no effect on cultural practices, production should be recorded under either “freshwater culture” or “mariculture”. Earlier stages of the life cycle of these aquatic organisms may be spent in fresh or marine waters (Crespi and Coche, 2008).
36 Mariculture is understood that the cultivation of the end product takes place in seawater, such as fjords, inshore and open waters and inland seas in which the salinity generally exceeds 20‰. Earlier stages in the life cycle of these aquatic organisms may be spent in brackish water or freshwater (Crespi and Coche, 2008).

99Appendix 1
Adopted criteria in assembling the indicator: The indicator is usually constituted by the sum of the “national estimate of inland capture fisheries production” and the “national estimate of non-marine aquaculture production”. When there are official and non-official “national estimate of inland capture fisheries production”, the indicators are calculated with both sources and therefore constituted by a range of values.
Spatial coverage: The indicator is compiled for all analysed African and Asian countries.
Resolution and limits: This indicator is conceived to provide an overall assessment of the “inland fish production” from capture fisheries and aquaculture activities in freshwater and brackish-water areas.
This choice has helped to avoid potential ambiguity in the classification of fishing and aquaculture activities, which are used to compile official statistics. Fishing is considered as the removal of aquatic organisms from natural or enhanced inland waters, while the harvest of fish stocked in artificial reservoirs should be considered aquaculture. Similarly, the capture of fish from seasonally flooded areas should be considered fishing, but when floodwaters recede and fish are trapped into soil depressions and fed before being harvested that should be considered aquaculture.
However, this choice has also some limitations in depicting the development of aquaculture in a given country. For this reason, it is recommended to complement the information provided by this indicator with information expressed by the “aquaculture contribution to inland fish production – quantity” indicator.
Use of the indicator and next steps: The “inland fish production – quantity” indicator is a fundamental indicator for the economic assessment, which has been also used to assemble other indicators such as the “inland fish production – value”, the “fish-water productivity – quantity”, the “fish-water productivity – value” and the “aquaculture contribution to inland fish production – quantity”.
A reliable measurement of “inland fish production” has high economic and policy relevance. In several countries, the “inland fish production – quantity” indicator shows the existing divergence in the official versus non-official estimate of “inland fish production” and, consequently, can be used to encourage countries to further investigate into this matter in order to resolve such level of uncertainty.

Assessing water availability and economic, social and nutritional contributions from inland capture fisheries and aquaculture100
A1.6: INLAND FISH PRODUCTION – vALUE
Definition: The “inland fish production – value” is defined as the sum of the value of “national estimate of inland capture fisheries production” and the value of the “national estimate of non-marine aquaculture production”.
Unit of measurement: Thousands of United States dollars.
Adopted criteria in defining the indicator: The value of the “national estimate of inland capture fisheries production” is constituted by the sum of the quantity of fish produced by species or species group multiplied by the corresponding estimated first-sale price. The value of the “national estimate of non-marine aquaculture production” is constituted by the sum of the quantity of fish produced by species or species group by the corresponding estimated farmgate prices.
The first-sale and farmgate prices are producer prices, which are defined as the prices received by farmers (or fishers) when they participate in their capacity as sellers of their own products at the farmgate or first point of sale (FAO, 2013).
Major data sources: The data sources used to compile the “national estimate of inland capture fisheries production” and “national estimate of non-marine aquaculture production” are reported in A1.5.
The major data sources used to derive the farmgate prices of species or group of species include the questionnaires on aquaculture statistics reported by countries to the FAO Fisheries and Aquaculture Department and the several fishery statistical bulletins published by the Southeast Asian Fisheries Development Center between 2008 and 2012.
The first-sale prices of wild caught species are estimated by using miscellaneous multiple data sources.
Adopted criteria in assembling the indicator: It is evident that the first-sale and the farmgate prices, even for the same species, vary significantly in space and time. Given the sparse information and lack of systematic price surveys, it is hard to identify a representative unique species price at the country level. For this reason, a range of prices for each species or species group has been identified on the basis of information available. Therefore, the value of the “national estimate of inland capture fisheries production” and the value of the “national estimate of non-marine aquaculture production” are constituted by a range of values that correspond to values assessed using the lowest unit price and the highest available unit price. In addition, if the “national estimate of inland capture fisheries production” is constituted by official and non-official estimates, these are valued using the same first-sale prices by species or group of species and then only the lowest and highest values among the four calculated values have been used for the “national estimate of inland capture fisheries production”.
Spatial coverage: The indicator is compiled for all African and Asian countries analysed.
Resolution and limits: The “inland fish production – value” indicator is a fundamental indicator for the economic assessment corresponding to a coarse assessment of the value of inland fish production in the analysed countries based on producers’ prices. This indicator represents only the production value and does not take into account other economic benefits that the inland fisheries sector can generate in terms of employment, economic rents and surpluses.
The range of prices by species or by group of species (i.e. price calibration) is affected by some subjectivity in the choice of information used. The range of unit prices could be further improved with increased available information.
101Appendix 1
The greatest difficulty has been encountered when the “national estimate of inland capture fisheries production” is reported without any specification on its species composition. In this case, a range of first-sale prices has been estimated to reflect the potential (unknown) composition of fish landings by low-value and high-value species.
Use of the indicator and next steps: The “inland fish production – value” indicator is a basic indicator for the economic assessment and provides a coarse assessment of the value of inland fish production in the analysed countries based on producers’ prices. Such monetary assessment can make the economic benefits provided by the inland fisheries sector tangible and their contribution to the local and national economy evident to society. The recognition of the importance of aquatic resources for the inland fisheries sector is likely to be facilitated by an assessment that provides evidence of the derived economic benefit in monetary terms. In addition, such assessment can facilitate the comparison with other sectors and support an intersectoral discussion on water management.
The “inland fish production – value” indicator can be used as a coarse figure of the economic relevance of the inland fisheries sector and to encourage countries to data collection on farmgate and first-sale prices.

Assessing water availability and economic, social and nutritional contributions from inland capture fisheries and aquaculture102
A1.7: AqUACULTURE CONTRIBUTION TO INLAND FISH PRODUCTION – qUANTITy
Definition: The “aquaculture contribution to inland fish production – quantity” is defined as the ratio of “national estimate of non-marine aquaculture production” over the overall “inland fish production – quantity”.
Unit of measurement: Percentage.
Adopted criteria in defining the indicator: The definitions of “national estimate of inland capture fisheries production” and “national estimate of non-marine aquaculture production” are given in A1.5.
Major data sources: Data sources to derive the “national estimate of inland capture fisheries production” and the “national estimate of non-marine aquaculture production” are described in A1.5.
Adopted criteria in assembling the indicator: The indicator is a ratio whose numerator is the “national estimate of non-marine aquaculture production” and the denominator is the sum of the “national estimate of aquaculture production” and “national estimate of inland capture fisheries production”. When the denominator (i.e. “inland fish production – quantity”) is constituted by a range of values due to the occurrence of official statistics and non-official estimates, the “aquaculture contribution to inland fish production – quantity” is also constituted by a range of values.
Spatial coverage: The indicator is compiled for all analysed African and Asian countries.
Resolution and limits: The indicator measures the share of “inland fish production – quantity” that comes from aquaculture. This indicator is symmetrical to the assessment of the share of the “inland fish production – quantity” that comes from inland capture fisheries. However, the choice to highlight the percentage of aquaculture production is due to the fact that aquaculture records the greatest difference in the degree of development among countries, especially between African and Asian countries.
The major limit of the indicator is that it requires a correct distinction between aquaculture and inland capture fisheries production. Therefore, its reliability should be assessed on a country basis.
Use of the indicator and next steps: Without analysing the causes and conditions for aquaculture development, the indicator provides an estimate of the average contribution given in the time period 2008–2012 to the overall inland fish production recorded in the same time period. The indicator could be also compiled yearly. In fact, aquaculture production can be positively influenced by government incentives, effective plans for aquaculture pond rehabilitations and foreign companies setting up large-scale commercial aquaculture farms. On the other hand, aquaculture production can be negatively influenced by the lack of sufficient seeds from hatcheries, spread of aquaculture diseases, banning from the government of key aquaculture species, and little economic gains by the aquaculture farmer, etc. However, given that the indicator measures the variation of aquaculture production compared with the overall “inland fish production – quantity”, small variations are likely to remain undetected.

103Appendix 1
A1.8: AqUACULTURE CONTRIBUTION TO INLAND FISH PRODUCTION – vALUE
Definition: The “aquaculture contribution to inland fish production – value” is defined as the ratio of “estimated value of non-marine aquaculture production” over the overall “inland fish production – value”.
Unit of measurement: Percentage.
Adopted criteria in defining the indicator: The definitions of “estimated value of inland capture fisheries production” and “estimated value of non-marine aquaculture production” are given in A1.6.
Major data sources: Data sources to derive the “estimated value of inland capture fisheries production” and “estimated value of non-marine aquaculture production” are described in A1.6.
Adopted criteria in assembling the indicator: The indicator is a ratio whose numerator is the “estimated value of non-marine aquaculture production” and the denominator is the sum of the “estimated value of non-marine aquaculture production” and “estimated value of inland capture fisheries production”. Since the procedure for valuation of fish production used both the lowest and the highest unit producer prices available, in most cases the “aquaculture contribution to inland fish production – value” is constituted by a range of values.
Spatial coverage: The indicator is compiled for all analysed African and Asian countries.
Resolution and limits: The indicator measures the share of the value of “inland fish production – value” related to aquaculture production. The major limit of the indicator is that it requires a correct distinction between aquaculture and inland capture fisheries production. Therefore, its reliability should be assessed on a country basis.
Use of the indicator and next steps: The major use of the indicator is to assess the contribution of aquaculture in monetary terms. This indicator provides complementary information to the “aquaculture contribution to inland fish production – quantity”; in fact, because of the average higher prices of farmed fish in the analysed countries, aquaculture production can represent a different share of the “inland fish production” if assessed in quantity or in value.
Assessing water availability and economic, social and nutritional contributions from inland capture fisheries and aquaculture104
A1.9: FISH-wATER PRODUCTIvITy – qUANTITy
Definition: The “fish-water productivity – quantity” is defined as the ratio of the sum of the “national estimate of aquaculture production” and the “national estimate of inland capture fisheries production” over “inland water area and aquaculture pond area”.
Unit of measurement: Kilograms per hectare per year (kg/ha).
Adopted criteria in defining the indicator: The definitions of “national estimate of inland capture fisheries production” and “national estimate of non-marine aquaculture production” are given in A1.5, and the definition of “inland water area and aquaculture pond area” is described in A1.4.
Major data sources: Data sources to derive the “national estimate of inland capture fisheries production” and the “national estimate of aquaculture production” are described in A1.5, while data sources for “inland water area and aquaculture pond area” are described, respectively, in A1.1 and A1.4
Different data sources have been used to collect data on fish-water productivity recorded in the major fishing areas of the analysed countries.
Adopted criteria in assembling the indicator: “Fish-water productivity − quantity’ is often composed by a range of values. This occurs when there are both official statistics and non-official estimates related to the “national estimate of inland capture fisheries production”. In this case, the “fish-water productivity – quantity” is computed according to both official and non-official estimates resulting in a range of values.
Spatial coverage: The indicator is compiled for all analysed African and Asian countries.
Resolution and limits: “Fish-water productivity – quantity” provides indications at the national level about the average quantity of fish harvested or farmed from the “inland water area and aquaculture pond area”.
However, within a country, a wide range of fish-water productivity is expected to be found in different types of water resources and aquaculture management.
The comparison between fish-water productivity recorded at the national and local levels is not intended to provide indications about the target fish-water productivity that should or could be achieved. The indicator does not provide information about the sustainability of the current pattern of extraction, or the production of fish resources from existing natural and artificial water resources, or the sustainability of fish-water productivity values recorded at the local level in natural water resources or culture conditions.
Caution should be placed in the compilation of the indicator separately for inland capture fisheries and aquaculture production. In the lack of information and how cage production is accounted within national statistics and of cage inventories, the “fish-water productivity” related to the whole “inland fish production” will be more robust and comparable across countries than the separate values of fish-water productivity for capture fisheries and aquaculture activities
Use of the indicator and next steps: “Fish-water productivity – quantity” is an essential economic indicator linking fish production with water availability. This indicator is useful to show the importance of water resources for fish production, and to represent water use by the inland fisheries sector in common units used with water management as well as for climate scenario analysis. The indicator can show,

105Appendix 1
on average, how many tonnes of fish are produced in a hectare of available water, and therefore what the average loss would be in fish production per unit of available water resource in the case of decreased water availability linked to increased climate variability and climate change and/or water management policies.
The indicator should not be used to establish targets on increasing a country’s fish-water productivity without first conducting a proper assessment on the operational potentials and constraints existing within local conditions.

Assessing water availability and economic, social and nutritional contributions from inland capture fisheries and aquaculture106
A1.10: FISH-wATER PRODUCTIvITy – vALUE
Definition: The “fish-water productivity – value” is defined as the ratio of the sum of “estimated value of non-marine aquaculture production” and “estimated value of inland capture fisheries production” over “inland water area and aquaculture pond area”.
Unit of measurement: United States dollars per hectare (US$/ha).
Adopted criteria in defining the indicator: The definitions of “estimated value of non-marine aquaculture production” and “estimated value of inland capture fisheries production” are given in A1.6, and the definition of “inland water area and aquaculture pond area” in A1.4.
Major data sources: Data sources to derive the “estimated value of non-marine aquaculture production” and “estimated value of inland capture fisheries production” are described in A1.6, while data sources for “inland water area and aquaculture pond area”, respectively, in A1.1 and A1.4
Adopted criteria in assembling the indicator: “Fish-water productivity – value” is always composed by a range of values, as these are primarily derived from the lowest and highest unit prices used to assess both the “estimated value of non-marine aquaculture production” and “estimated value of inland capture fisheries production”. In addition, in several cases, the range of values shown by the “fish-water productivity – value” indicator is also influenced by the discrepancy recorded in a few countries between official statistics and non-official estimates related to the “national estimate of inland capture fisheries production”.
The indicator is also compiled in a disaggregated way in order to be able to compare the average “fish-water productivity – value” provided separately by inland capture fisheries and aquaculture production given the usually higher prices reported or estimated for farmed species rather than wild caught species.
Spatial coverage: The indicator is compiled for all analysed African and Asian countries.
Resolution and limits: “Fish-water productivity – value” provides indications at the national level about the average value of fish harvested or farmed from the “inland water area and aquaculture pond area”. The reliability of the indicator is highly affected by the unit prices statistics on inland fish production as well as by the assessment of the “inland water area and aquaculture pond area”. Further refinements of these estimates could substantially change the indicator values.
Use of the indicator and next steps: “Fish-water productivity – value” expresses the value of one hectare of water made available to the fisheries sector in monetary terms. This indicator is useful to show the economic value of one hectare of water, and therefore to represent the economic relevance of water use by the inland fisheries sector in common units used, which can be used with water management as well as for climate scenario analysis. The indicator can show, on average, how many tonnes of fish are produced in a hectare of available water, and therefore what the average loss in fish production would be per unit of available water resource in the case of decreased water availability linked to increased climate variability and climate change or increased water competition among sectors.

107Appendix 1
A1.11: OvERALL NUMBER OF INLAND FISHERS AND AqUACULTURE FARMERS
Definition: The “overall number of inland fishers and aquaculture farmers” is defined as the sum of people engaged in fishing and aquaculture activities without making any distinction in the degree of engagement (full-time, part-time, but also occasional).
Unit of measurement: Number of people.
Adopted criteria in defining the indicator: The indicator considers the “overall number of inland fishers and aquaculture farmers” irrespective of the degree of engagement (full-time37, part-time38, occasional39), and regardless if fishing or aquaculture activities are remunerated or carried out as part of subsistence household livelihood.
The criterion placed more emphasis on capturing the number of households who benefit from fisheries and aquaculture rather than to measure the extent of labour placed in the sector activities. This approach has been beneficial in: (i) avoiding a clear distinction among inland fishers and aquaculture farmers in official statistics and making use also of the figures related to an unspecified occupation within the inland fisheries sector; and (ii) integrating other information available in the literature where no details on the level of engagement were available.
Major data sources: Official statistics related to the number of inland fishers and aquaculture farmers are yearly reported by countries to the FAO Fishery and Aquaculture Department. This document utilizes the statistics that are not regularly disseminated to the public and that are referred to year 2012, or to any other year available40. When available, official statistics have been compared with non-official estimates reported in published fisheries and aquaculture assessments and documents referred specifically to the analysed countries.
Adopted criteria in assembling the indicator: The “overall number of inland fishers and aquaculture farmers” is often constituted by a range of values. In most cases, the two values of the range refer to official statistics and non-official estimates of the number of inland fishers and aquaculture farmers. In a few countries, official statistics reported the number of inland fishers, the number of aquaculture farmers and the number of people with unspecified occupations within the fisheries sector. In these cases, the number of people with unspecified occupations is added to the reported number of inland fisheries and aquaculture farmers constituting the highest estimate of the indicator range.
Spatial coverage: The indicator is compiled for all analysed African and Asian countries.
Resolution and limits: The “overall number of inland fishers and aquaculture farmers” is a fundamental indicator to show the social relevance of the fisheries sector. The wide range of values of the indicator showing the divergence among official and non-official estimates points out the current low reliability of the indicator and the need to confirm available statistics and eventually strengthen data collection systems.
37 Full-time: Individuals receiving at least 90 percent of their livelihood from farming, or spending at least 90 percent of their working time in that occupation (World Bank, FAO and WorldFish Center, 2010).
38 Part-time: Individuals receiving at least 30 percent but less than 90 percent of their livelihood from farming, or spending at least 30 percent but less than 90 percent of their working time in that occupation (World Bank, FAO and WorldFish Center, 2010).
39 Occasional: Individuals receiving under 30 percent of their livelihood from farming, or spending under 30 percent of their working time in that occupation (World Bank, FAO and WorldFish Center, 2010).
40 Further information on the dissemination process can be obtained by contacting [email protected].
Assessing water availability and economic, social and nutritional contributions from inland capture fisheries and aquaculture108
Use of the indicator and next steps: The “overall number of inland fishers and aquaculture farmers” aims to describe the role of fishing and aquaculture activities in supporting people’s livelihoods. Fishing and aquaculture activities can provide employment and/or constitute an important source of livelihood. Both contributions have great importance in achieving economic security as well as food security, and cannot be measured or compared in terms of relative time allocated to fishing or aquaculture activities. In fact, subsistence artisanal fisheries and extensive household aquaculture are usually carried out on an occasional basis or involving a relatively small time budget. On the contrary, the importance of such activities can be crucial in providing households with food and nutritional security.
The compiled “overall number of inland fishers and aquaculture farmers” indicator can be used to enquire with the analysed countries for clarification on the wide divergences between official and non-official estimates and to point out the potential existing data gap and the importance of comprehensive statistical national surveys.
109Appendix 1
A1.12: AvERAGE DENSITy OF OvERALL INLAND FISHERS AND AqUACULTURE FARMERS
Definition: The “average density of overall inland fishers and aquaculture farmers” considers the “overall number of inland fishers and aquaculture farmers” divided by the extent of “inland water area and aquaculture pond area”.
Unit of measurement: Number of people per square kilometre.
Adopted criteria in defining the indicator: The definitions “overall number of inland fishers and aquaculture farmers” and “inland water area and aquaculture pond area” are given, respectively, in A1.11 and in A1.1 and A1.4.
Major data sources: Data sources used for the “overall number of inland fishers and aquaculture farmers” and “inland water area and aquaculture pond area” are described, respectively, in A1.11 and in A1.1 and A1.4.
Adopted criteria in assembling the indicator: The indicator is a ratio whose numerator is the “overall number of inland fishers and aquaculture farmers” and the denominator the “inland water area and aquaculture pond area”. When the numerator is constituted by a range of values, this derived indicator is also constituted by a range of values.
Spatial coverage: The indicator is compiled for all analysed African and Asian countries.
Resolution and limits: The “average density of overall inland fishers and aquaculture farmers” is assessed to measure, on average, how many people per square kilometre of available water resources rely on fishing and aquaculture activities. This national-level indicator shows the contribution that the inland fisheries sector provides in terms of employment and livelihoods. It also gives a coarse assessment on how many people in a country are likely to be directly affected by a decrease of water resources available to the inland fisheries sector.
It should be noted that, despite the estimated “average density of overall inland fishers and aquaculture farmers” at the national level, great variability in the density of fishers and aquaculture farmers is expected at the local level. Many factors – such as population density, richness of fish stocks and status of fish populations in the natural water resources, market opportunities, laws and regulations on accessibility of public waterbodies and fishing licences, economic incentives and cultural traditions – influence the number of fishers in a given place. In a similar way, the number of aquaculture farmers in a given area depends on the number and size of aquaculture farms, but also on the availability of hatcheries, feed availability, market opportunities, laws, regulations and policies on exotic cultured species, etc.
The reliability of values compiled for the “average density of overall inland fishers and aquaculture farmers” varies on a country basis depending on the reliability of the “overall number of inland fishers and aquaculture farmers” and “inland water area and aquaculture pond area”.
Use of the indicator and next steps: The “average density of overall inland fishers and aquaculture farmers” indicator is useful to link the social with the environmental dimension and it is useful in cross-country comparison.
A high value of the indicator signals the importance of the freshwater and brackish-water resources for a relatively high number of people and a potential high pressure on the existing water resources, as a higher density of fishers and aquaculture farmers per unit of surface water would mean more needs to be met. On the contrary, a low value

Assessing water availability and economic, social and nutritional contributions from inland capture fisheries and aquaculture110
of the indicator signals a relatively small number of fishers and aquaculture farmers compared with the relatively large extent of available water resources.
However, the indicator does not provide information about the sustainability of a given density of fishers and aquaculture farmers. In fact, ecological, economic and social sustainability thresholds will be met at different values according to different cultural and local fishing conditions.

111Appendix 1
A1.13: FISH PROTEIN SUPPLIED By INLAND FISH PRODUCTION
Definition: The “fish protein supplied by inland fish production” is defined as the annual average quantity of proteins supplied by fishing and aquaculture activities in a given country.
Unit of measurement: Tonnes of protein.
Adopted criteria in defining the indicator: The definitions of the “national estimate of inland capture fisheries production” and “national estimate of non-marine aquaculture production” are given in A1.5. When possible, according to reported information, both types of production are broken down into four divisions: freshwater41 and diadromous fish42, crustaceans43, molluscs44 and other aquatic animals45, according to the International Standard Statistical Classification of Aquatic Animals and Plants (ISSCAAP) classification.
Major data sources: Data sources for the “national estimate of inland capture fisheries production” and “national estimate of non-marine aquaculture production” are described in A1.5. The average value of protein content per species group has been extracted from the “food composition factors for FAOSTAT fish and fisheries products” of the FAO food balance sheet referred to the type of commodity category fresh (FAO, 2014a).
Adopted criteria in assembling the indicator: The “fish protein supplied by inland fish production” is compiled by multiplying the quantity of caught or farmed fish by the average protein content of the species groups constituting the fish production from inland capture fisheries and non-marine aquaculture production. The average protein content used for freshwater and diadromous fish as fresh commodities is 109 grams in 1 kg of fish. Similarly, the average protein content for crustaceans is 93 grams/kg, 23 grams/kg for molluscs and 40 grams/kg for aquatic animals (FAO, 2014a).
When there are official statistics as well as non-official estimates related to the “national estimate of inland capture fisheries production”, then the “fish protein supplied by inland fish production” is computed according to both official and non-official estimates and is constituted by a range of values.
Spatial coverage: The indicator is compiled for all analysed African and Asian countries.
Resolution and limits: The “fish protein supplied by inland fish production” is based on the average protein content of the species groups, which is regularly used to compile the FAO food balance sheet based on a standardized methodology to represent the pattern of a country’s food supply during a specified reference period. The indicator does not account for eventual differences recorded in the protein profile of species within the same ISSCAAP division and potential differences between free-ranging and farmed species. However, the nutritional value of fish, related to the content of proteins, fatty acids and micronutrients, varies with fish species. In addition, several studies have
41 Freshwater: Carps, barbels and other cyprinids, tilapias and other cichlids and miscellaneous freshwater fishes (FAO, 2014a).
42 Diadromous: Sturgeons, paddlefishes, river eels, salmons, trouts, smelts, shads and miscellaneous diadromous fishes (FAO, 2014a).
43 Crustaceans: Freshwater crustaceans, shrimps, prawns and miscellaneous crustacean species (FAO, 2014a).44 Molluscs: Freshwater molluscs (FAO, 2014a).45 Other aquatic animals: Frogs and other amphibians, turtles and miscellaneous aquatic invertebrates
(FAO, 2014a).

Assessing water availability and economic, social and nutritional contributions from inland capture fisheries and aquaculture112
also shown that within the same species some relative differences in the nutritional profile of free-ranging and farmed fish species can be found. In general terms, the farmed species have often unlimited access to food and a reduced physical activity compared with free-ranging fish, which can lead to a relatively higher percentage of fat. The protein content of farmed fish will also vary with the type and composition of feed used. Farmed fish are traditionally considered having similar protein content than free-ranging species, although recent studies show that the protein expression profile in different tissues can differ between farmed and free-ranging species (Toldrà and Nollet, 2012). However, this level of detail in the nutritional profile could not be taken into account by the current compilation of the indicator because it goes beyond the scope and level of accuracy used for this assessment.
Use of the indicator and next steps: The “fish protein supplied by inland fish production” indicator is useful in stressing the importance of water availability for the inland capture fisheries and aquaculture activities for protein supply and food security.

113Appendix 1
A1.14: FISH-PROTEIN wATER PRODUCTIvITy
Definition: The “fish-protein water productivity” is defined as the ratio between the “fish protein supplied by inland fish production” and the “inland water area and aquaculture pond area”.
Unit of measurement: Kilograms of proteins per hectare per year (kg/ha).
Adopted criteria in defining the indicator: The definitions of the “fish protein supplied by inland fish production” and “inland water area and aquaculture pond area” are given, respectively, in A1.13 and in A1.1 and A1.4.
Major data sources: Data sources for the “fish protein supplied by inland fish production” and “inland water area and aquaculture pond area” are given, respectively, in A1.13 and in A1.1 and A1.4.
Adopted criteria in assembling the indicator: The “fish-protein water productivity” is assessed by a range of values when the “fish protein supplied by inland fish production” is also constituted by a range of values.
Spatial coverage: The indicator is compiled for all analysed African and Asian countries.
Resolution and limits: The “fish-protein water productivity” indicates the average quantity of proteins per hectare of available surface water. Its resolution is highly influenced by the reliability of the information used to compile the “fish protein supplied by inland fish production” and the “inland water area and aquaculture pond area” indicators.
Use of the indicator and next steps: The “fish-protein water productivity” indicator is useful to carry out a cross-country comparison and to show the importance of the nutritional benefits per unit of water made available to the inland fisheries sector in terms of protein supply and food security.


115
APPENDIx 2
Indicator values
TABLE A2.1values of compiled water availability indicators in the analysed African countries
CountryInland water
area (km2)
Inland water area and aquaculture
pond area(km2)
Percentage of inland water over
country area (%)
Percentage of permanent inland water over inland water area
(%)
Benin 3 000 3 000 3 12
Cameroon 13 900 13 900 3 29
Chad 100 800 100 800 8 3
Congo 79 400 79 400 23 5
Democratic Republic of the Congo 334 900 334 900 14 16
Ghana 15 200 15 200 6 60
Malawi 30 700 30 700 26 86
Mali 36 200 36 200 3 20
Nigeria 61 200 61 400 7 15
Note: Data and data sources are reported in greater detail in FAO, 2016a.
TABLE A2.2values of compiled economic indicators in the analysed African countries
Country
Inland fish production
Aquaculture contribution to inland fish production Fish-water productivity*
Quantity (tonnes)
Value(US$1 000)
Quantity(%)
Value(%)
Quantity(kg/ha)
Value(US$/ha)
Benin 27 200 27 746–54 504 1 2–4 91 92–182
Cameroon 75 500 25 595–189 160 1 6 54 18–136
Chad 91 800 201 960 n.d. n.d. 9 20
the Congo 32 100 16 051–48 152 n.s. n.s. 4 2–6
Democratic Republic of the Congo
223 300 471 667 1 2 7 14
Ghana 102 600–284 900 83 139–472 514 5–14 8–47 68–187 55–311
Malawi 90 500 62 247–74 391 3 9–10 29 20–24
Mali 97 400–151 500 109 609–409 605 1–2 1–4 27–42 30–113
Nigeria 493 700 1 025 675–1 270 585 39 43–50 80 167–207
Notes: Data and data sources are reported in greater detail in FAO (2016a).
* The fish-water productivity is estimated at national level as an annual average.
n.s. = non significant; n.d. = no data.

Assessing water availability and economic, social and nutritional contributions from inland capture fisheries and aquaculture116
TABLE A2.3values of compiled social indicators in the analysed African countries
CountryOverall number of inland fishers
and aquaculture farmers (people)
Average overall density of inland fishers and aquaculture farmers
(people/km2)
Benin 34 000–124 000 11–41
Cameroon 147 700–150 200 11
Chad 435 200 4
Congo 41 200 1
Democratic Republic of the Congo 374 900–511 100 1–2
Ghana 83 600 6
Malawi 158 000 5
Mali 352 700 10
Nigeria 889 200–1 692 600 14–28
Note: Data and data sources are reported in greater detail in FAO (2016a).
TABLE A2.4values of compiled nutritional indicators in the analysed African countries
CountryFish protein supplied by inland
fish production (tonnes)
Annual fish-protein water productivity
(kg/ha)
Benin 2 900 10
Cameroon 8 200 6
Chad 10 000 1
Congo 3 500 < 1
Democratic Republic of the Congo 24 300 1
Ghana 11 200–31 000 7–20
Malawi 9 900 3
Mali 10 600–16 600 3–5
Nigeria 53 800 9
Note: Data and data sources are reported in greater detail in FAO (2016a).

117Appendix 2
TABLE A2.5values of compiled water availability indicators in the analysed Asian countries
CountryInland
water area (km2)
Inland water area and aquaculture
pond area(km2)
Percentage of inland water over
country area (%)
Percentage of permanent inland water over inland
water area (%)
Bangladesh 39 700 45 800 28 26
Cambodia 22 100 22 100 12 22
China 325 400 353 900 3 58
India 67 500 103 300 2 66
Lao People’s Democratic Republic 10 800 11 300 5 53
Myanmar 95 200 97 000 14 15
Sri Lanka 3 800 3 900 6 73
Thailand 36 600 38 800 7 86
Viet Nam 38 500 49 100 12 48
Note: Data and data sources are reported in greater detail in FAO (2016a).
TABLE A2.6values of compiled economic indicators in the analysed Asian countries
Country
Inland fish production
Aquaculture contribution to inland fish
production Fish-water productivity*
Quantity(tonnes)
Value(US$1 000)
Quantity(%)
Value(%)
Quantity(kg/ha)
Value(US$/ha)
Bangladesh 2 349 800 3 121 790–4 843 822 54 58–60 513 682–1 058
Cambodia 467 800–761 900 302 276–2 064 005 7–12 3–31 212–345 137–934
China 26 410 900 38 594 486–60 808 610 91 89–92 746 1 091–1 718
India 4 910 500 3 037 430–9 026 579 76 73–81 475 294–874
Lao People’s Democratic Republic
115 400–266 500 100 739–344 898 31–73 36–84 102–236 89–305
Myanmar 1 762 800 1 544 521–2 929 811 42 37–54 182 159–302
Sri Lanka 63 200 65 782–90 232 14 30–40 159 169–231
Thailand 1 259 200–2 101 100 3 008 670–4 072 981 50–83 68–90 325–542 775–1 050
Viet Nam 2 675 600–3 608 400 3 741 812–7 876 698 69–93 71–96 545–735 762–1 604
Notes: Data and data sources are reported in greater detail in FAO (2016a).
* The fish-water productivity is estimated at national level as an annual average.
TABLE A2.7values of social indicators in the analysed Asian countries
CountryOverall number of inland fishers and
aquaculture farmers(people)
Average density of overall inland fishers and aquaculture farmers
(people/km2)
Bangladesh 4 276 000 93
Cambodia 774 200–853 000 35–39
China 11 128 700–12 020 500 31–34
India 10 467 100–10 975 300 101–106
Lao People’s Democratic Republic 30 000–1 700 000 3–150
Myanmar 1 795 600–2 193 200 19–23
Sri Lanka 48 600–68 500 12–18
Thailand 3 080 000 79
Viet Nam 2 557 900–4 032 000 52–82
Note: Data and data sources are reported in greater detail in FAO (2016a).

Assessing water availability and economic, social and nutritional contributions from inland capture fisheries and aquaculture118
TABLE A2.8values of compiled nutritional indicators in the analysed Asian countries
Country
Annual quantity of proteins supplied by inland capture fisheries
and aquaculture (tonnes)
Annual fish-protein water productivity
(kg/ha)
Bangladesh 253 000 55
Cambodia 51 000–83 000 23–38
China 2 752 700 78
India 531 400 51
Lao People’s Democratic Republic 12 600–29 000 11–26
Myanmar 192 100 20
Sri Lanka 6 800 17
Thailand 127 400–219 200 33–56
Viet Nam 282 500–384 400 58–78
Note: Data and data sources are reported in greater detail in FAO (2016a).


This study provides an initial indicator-based framework for understanding the economic, social and nutritional contributions of inland capture fisheries and aquaculture and their links
to available water resources. Fourteen indicators covering environmental, economic, social and nutritional dimensions of inland fisheries and aquaculture are identified and tested in
eighteen African and Asian countries with significant inland fish production. Complexities in defining and estimating the indicators are discussed, and initial results based on currently available data are presented to identify gaps and future steps to improve knowledge. The
study discusses the potential use of these indicators as a baseline for national sectoral planning and management as a means to inform intersectoral water management and, in the face of climate change and changing water availability, as inputs into modelling the potential
economic, social and nutritional losses and opportunities to society stemming through impacts in the inland fisheries sector.
602FA
OA
ssessing water availability and econom
ic, social and nutritional contributions from inland capture fi
sheries and aquaculture – An indicator-based fram
ework
602
FAOFISHERIES ANDAQUACULTURE
TECHNICALPAPER
ISSN 2070-7010
Assessing water availability and economic, social and nutritional contributions from inland capture fisheries and aquaculture An indicator-based framework
I5878E/1/07.16
ISBN 978-92-5-109318-4 ISSN 2070-7010
9 7 8 9 2 5 1 0 9 3 1 8 4


