Assessing the Resurgent Irrigation Development Program of ...
209
DISCUSSION PAPER SERIES NO. 2020-01 FEBRUARY 2020 Assessing the Resurgent Irrigation Development Program of the Philippines – National Irrigation Systems Component Roberto S. Clemente, Arthur L. Fajardo, Vicente G. Ballaran Jr., Julie Carl P. Ureta, Arman S. Baulita, and Kristel Camille J. Tapire The PIDS Discussion Paper Series constitutes studies that are preliminary and subject to further revisions. They are being circulated in a limited number of copies only for purposes of soliciting comments and suggestions for further refinements. The studies under the Series are unedited and unreviewed. The views and opinions expressed are those of the author(s) and do not necessarily reflect those of the Institute. Not for quotation without permission from the author(s) and the Institute. CONTACT US: RESEARCH INFORMATION DEPARTMENT Philippine Institute for Development Studies 18th Floor, Three Cyberpod Centris - North Tower EDSA corner Quezon Avenue, Quezon City, Philippines [email protected] (+632) 8877-4000 https://www.pids.gov.ph
Transcript of Assessing the Resurgent Irrigation Development Program of ...

DISCUSSION PAPER SERIES NO. 2020-01
FEBRUARY 2020
Assessing the Resurgent Irrigation Development Program of the Philippines – National Irrigation Systems Component
Roberto S. Clemente, Arthur L. Fajardo, Vicente G. Ballaran Jr., Julie Carl P. Ureta, Arman S. Baulita, and Kristel Camille J. Tapire
The PIDS Discussion Paper Series constitutes studies that are preliminary and subject to further revisions. They are being circulated in a limited number of copies only for purposes of soliciting comments and suggestions for further refinements. The studies under the Series are unedited and unreviewed. The views and opinions expressed are those of the author(s) and do not necessarily reflect those of the Institute. Not for quotation without permission from the author(s) and the Institute.
CONTACT US:RESEARCH INFORMATION DEPARTMENTPhilippine Institute for Development Studies
18th Floor, Three Cyberpod Centris - North Tower EDSA corner Quezon Avenue, Quezon City, Philippines
[email protected](+632) 8877-4000 https://www.pids.gov.ph

Assessing the Resurgent Irrigation Development Program
of the Philippines – National Irrigation Systems Component
Roberto S. Clemente
Arthur L. Fajardo
Vicente G. Ballaran, Jr.
Julie Carl P. Ureta
Arman S. Baulita
Kristel Camille J. Tapire
PHILIPPINE INSTITUTE FOR DEVELOPMENT STUDIES
February 2020
2 | P a g e
Abstract
This Project focused on the evaluation of National Irrigation Systems (NIS) in the Philipp ines
which consisted of 22 NIS in Luzon and 17 NIS in Visayas and Mindanao and are represented by 151 Irrigators Associations (IAs). The overall objective is to evaluate the policy, programmatic, and institutional framework governing irrigation development and management
for the main purpose of improving irrigation performance and productivity of irrigated lands. The methodological approach to meet the specific objectives consisted of data collection
through site visits, field measurements, and Key Informant Interviews (KII) and Focus Group Discussions (FGDs). These are part of the Rapid Appraisal Procedure (RAP) of MASSCOTE where most of the questions are derived. Also, Geographic Information System (GIS) analys is
was applied to map location of surveys, structures and point measurements as well as to perform spatial analysis of erosion, groundwater potential, and performance levels of the NIS
cases at the IA level. Principal Component Analysis (PCA) was implemented to assess the performance of the NIS cases considered at the IA level using four major categories (Technical/Physical, Institutional/Organizational, Economic and Environmental) of indicators.
The primary and secondary data collected are associated with these indicators which include water supply and quality, conditions of irrigation structures and canals, IAs profile, degree of
satisfaction on water delivery, irrigation service fee (ISF) collection (in Luzon), maps of service areas, erosion and ground water potential maps, NISPER data, among others. Results showed that siltation problems exist in canals of almost all NIS cases, causing reduced flow capacities
that deprived the downstream portion from adequate water supply. Conveyance efficiency is low in some systems especially in unlined (earth) canals where water losses are high due to
seepage and percolation. Irrigation service is adversely affected by illegal settlers, dumping of garbage, and illegal pumping. On the environmental aspect, water quality as characterized by pH, DO, and EC are reasonably good in most systems where pH is on the neutral side (5 to 7),
DO is > 6ppm, and EC < 300uS/cm. On the institutional side, free ISF was introduced in 2017 and it seems to favor farmers since they can use the savings for other purposes. But some IAs
complain that without ISF, funds are limited for maintaining canals and thus causing poor water delivery. Also, the integrated analysis has shown that ISF has positive effect on the irriga t ion performance index (IPI), thus IAs in Luzon seem to perform better than IAs in Visayas and
Mindanao where most of the low performing IAs were located. To improve performance of irrigation systems, good watershed management is needed as a preventive approach to address
siltation of water courses and thus enhance water supply distribution. The National irriga t ion Administration (NIA) should allocate realistic resources for operation and maintenance to improve efficiency in water allocation and distribution from upstream to downstream users .
GIS techniques are a potentially valuable tool for NIS design and management. However, inadequate data is a constraint that limits comprehensive assessment and management of NIS.

3 | P a g e
List of Abbreviations
AFMA – Agriculture and Fisheries Modernization Act BPIS – Banaoang Pump Irrigation System BSWM – Bureau of Soils and Water Management CIS – Communal Irrigation System CO – Central Office DEM – Digital Elevation Model DO – Dissolved Oxygen EC – Electric Conductivity FA – Farmer’s Association FGD – Focus Group Discussion FUSA – Firmed-up Service Area GIS – Geographic Information System IA – Irrigator’s Association IDO – Irrigation Development Officer IMO – Irrigation Management Office IMT – Irrigation Management Transfer IPI – Irrigation Performance Index ISF – Irrigation Service Fee KII – Key Informant Interview KMO – Kaiser Mayer Olkin LGU – Local Government Unit LIPA – List of Irrigated and Planted Areas MARIIS – Magat River Integrated Irrigation System MASSCOTE – Mapping System and Services for Canal Operation Techniques NIA – National Irrigation Administration NIS – National Irrigation System NISPER – National Irrigation System Performance O&M – Operations and Maintenance PCA – Principal Component Analysis PCD – Pollution Control Department PDRIS – Pampanga Delta River Irrigation System RAP – Rapid Appraisal Procedure RIO – Regional Irrigation Office RIS – River Irrigation System SWIP – Small Water Impounding Project SWRFT – Senior Water Resources Facilities Technician TDS – Total Dissolved Solids TGIS – Tarlac Groundwater Irrigation System UPRIIS – Upper Pampanga River Integrated Irrigation System
4 | P a g e
Table of Contents
1. Background and Brief Description of the Project............................................................ 8
NIS cases covered in this Report ........................................................................................ 10
2. Rationale and Objectives .................................................................................................. 13
3. Review of Literature .......................................................................................................... 14
4. Methodology....................................................................................................................... 19
4.1. Field visits Arrangement with contacts at various IMOs and NIA offices of selected
NIS and itinerary of activities. .............................................................................................. 19
4.2. Collection of data from primary sources (RAP: (KII FGDs), field measurements and
observations) and secondary sources (NIA reports and documents) ................................. 19
4.3. GIS mapping and Spatial Analysis ............................................................................... 22
4.4. Irrigation Performance Assessment using Principal Component Analysis (PCA) ....... 22
5. Results and Discussions based on Primary and Secondary Data .............................. 24
5.1. Synthesis of Key Observations/Findings for the 39 NIS covered ................................ 24
5.2. Results of FGDs and IA Interviews............................................................................. 159
5.3. Assessment of Irrigation Performance using Principal Component Analysis ............ 175
6. Conclusions and Recommendations ............................................................................ 186
6.1. NIS Project Summary ................................................................................................. 186
6.2. Conclusions ................................................................................................................. 193
6.3.Recommendations ....................................................................................................... 199
References ............................................................................................................................ 203
Glossary ………………………………………………………………………………………….206
List of tables
Table 1. Appropriation for Irrigation per year ............................................................................ 9
Table 2. List of NIS Cases covered in this Report .................................................................. 12
Table 3. Classification of Water Quality for Irrigation Water. .................................................. 21
Table 4. Classification of Dissolved Oxygen (DO) Quality...................................................... 22
Table 5. MARIIS canal efficiency summary............................................................................. 26
Table 6. UPRIIS canal efficiency summary ............................................................................. 28
Table 7. Summary of lined canals per system ........................................................................ 28
Table 8. Summary of unlined canals per system .................................................................... 29
Table 9. Summary of lined, unlined and FUSA of the NIS in Mindanao (being consolidated to
include Luzon and Visayas) ..................................................................................................... 29
Table 10. Summary of IAs productivity (yield in cavans per ha) in Luzon Visayas and
Mindanao.................................................................................................................................. 44
Table 11. Summary of the technical, institutional and environmental issues in the National
Irrigation Systems in the Philippines........................................................................................ 45
Table 12. FUSA, programmed and total irrigated area of UPRIIS for 2014 Dry Season ....... 53
Table 13. Profile of canal lining of UPRIIS .............................................................................. 54
Table 14. Performance indicators for UPRIIS ......................................................................... 65
Table 15. Irrigated area of MARIIS from 2010 to 2014 ........................................................... 67
Table 16. Performance of MARIIS from 1999 to 2014 ............................................................ 67
Table 17. Performance of Division II, MARIIS from 2009 to 2014 .......................................... 67
Table 18. Performance indicator for MARIIS .......................................................................... 73

5 | P a g e
Table 19. Summary of Technical, Institutional and Environmental issues confronting the
representative NIS in Luzon (i.e. UPRIIS, Pampanga and MARIIS, Isabela) ........................ 84
Table 20. Cropping intensity of Bohol NIS from 2014 to dry season, 2018............................ 89
Table 21. Irrigated area and average yield per season of Padada RIS for CY 2014 to 2017
................................................................................................................................................ 112
Table 22. Irrigated area and average yield per season of Padada RIS for CY 2018 Dry
Season ................................................................................................................................... 113
Table 23. Pilot sites for the improvement of O&M schemes in NIS ...................................... 113
Table 24. Area and canal sections covered per IA of Padada RIS ...................................... 116
Table 25. Mean monthly river discharge of Marbel #1 RIS from 2005-2017........................ 130
Table 26. Cropping Intensity of Marbel #1 RIS for Dry and Wet Season from 2013-2017 .. 131
Table 27. List of POW for Marbel #1 RIS from 2013 to 2017 ............................................... 134
Table 28. Summary of Technical, Institutional and Environmental issues confronting the
representative NIS in Visayas and Mindanao (Jalaur-Suague RIS, Iloilo; Malinao, Capayas
Bayongan IS, Bohol; Padada RIS, Davao del sur; and Marbel #1, South Cotabato) .......... 139
Table 29. Summary IA Functionality Survey from 2013 to 2017 .......................................... 159
Table 30. Problems encountered by farmers related to irrigation......................................... 160
Table 31. Questions related to other modes of irrigation and scheduling ............................ 161
Table 32. Coping strategies adopted by the IA in case of prolonged dry spell .................... 162
Table 33. Questions related to preferred irrigation flow ........................................................ 162
Table 34. Average production yield in cavans per hectare by cropping season .................. 163
Table 35. Production, cost and profit of Palay for the 1st cropping ....................................... 165
Table 36. Production, cost and profit of Palay for the 2nd cropping ...................................... 166
Table 37. Fees being collected from farmers by IA .............................................................. 167
Table 38. Water charges collected by IAs ............................................................................. 168
Table 39. Incentive for paying on time and rating of IA’s financial strength ......................... 169
Table 40. Questions related to rules and conflicts ................................................................ 170
Table 41. Provisions that are not implemented adequately .................................................. 170
Table 42. Reason for delinquency presented by IAs ............................................................ 171
Table 43. Penalty for delinquency implemented by IAs ........................................................ 172
Table 44. Problems/ issues encountered by the IAs and farmers ........................................ 173
Table 45. Suggestion to address IA concerns ...................................................................... 173
Table 46. Ratings of satisfaction and performance indices of IAs ........................................ 174
Table 47. Satisfaction ratings of IAs on NIA's performance.................................................. 175
Table 48. PCA results of Cycle 1........................................................................................... 176
Table 49. Summary of the performance of IAs in Cycle 1. ................................................... 176
Figure 57. GIS map of results for Cycle 1 ............................................................................. 177
Table 50. PCA results of Cycle 2........................................................................................... 177
Table 51. Summary of the performance of IAs in Cycle 2 .................................................... 177
Table 52. PCA results of Cycles 1 and 2............................................................................... 179
Table 53. Results of Regression Analysis for Integrated Analysis of Cycles 1 and 2. ......... 181
Table 54. List of Low, Moderate, and High Performing IAs. ................................................. 183
Table 55. IA responses to technical inquiries........................................................................ 188
Table 56. Summary of responses pertaining to irrigation operation ..................................... 190
Table 57. Comparison between Earth/Lined Canals and Pipelines as main and secondary
distribution waterways............................................................................................................ 192

6 | P a g e
List of Figures
Figure 1. Relative locations of service areas of 22 NIS cases covered in Luzon................... 11
Figure 2. Relative locations of 17 NIS cases in Visayas and Mindanao. ............................... 12
Figure 3. Irrigated area of the different Divisions of UPRIIS ................................................... 55
Figure 4. DEM Map of UPRIIS, Nueva Ecija ........................................................................... 56
Figure 5. Soil erosion map of UPRIIS, Nueva Ecija ................................................................ 57
Figure 6. Overlaid map of UPRIIS, Nueva Ecija showing reduction in service area in terms of
erodibility of soil........................................................................................................................ 58
Figure 7. Built-up area map of UPRIIS, Nueva Ecija .............................................................. 59
Figure 8. Slope map of UPRIIS, Nueva Ecija.......................................................................... 60
Figure 9. Overlaid map of UPRIIS, Nueva Ecija showing reduction in service area in terms of
desirable slope ......................................................................................................................... 61
Figure 10. Soil map of UPRIIS, Nueva Ecija ........................................................................... 62
Figure 11. Overlaid map of UPRIIS, Nueva Ecija showing reduction in service area in terms
of desirable soil ........................................................................................................................ 63
Figure 12. Overlaid map of UPRIIS, Nueva Ecija showing reduction in service area ............ 64
Figure 13. Location of NIA office and NIS Structures in UPRIIS, Nueva Ecija ...................... 66
Figure 14. DEM of MARIIS, Isabela ........................................................................................ 74
Figure 15. Soil erosion map of MARIIS, Isabela ..................................................................... 75
Figure 16. Overlaid map of MARIIS, Isabela showing reduction in service area in terms of
erodibility of soil........................................................................................................................ 76
Figure 17. Built-up area map of MARIIS, Isabela.................................................................... 77
Figure 18. Slope map of MARIIS, Isabela ............................................................................... 78
Figure 19. Overlaid map of MARIIS, Isabela showing reduction in service area in terms of
desirable slope ......................................................................................................................... 79
Figure 20. Soil map of MARIIS, Isabela .................................................................................. 80
Figure 21. Overlaid map of MARIIS, Isabela showing reduction in service area in terms of
desirable soil ............................................................................................................................ 81
Figure 22. Overlaid map of MARIIS, Isabela showing reduction in service area ................... 82
Figure 23. Location of NIA office and structures in MARIIS, Isabela...................................... 83
Figure 24. Schematics of the water transfer from Malinao down to Capayas reservoir......... 86
Figure 25. 3D map showing the area around the Malinao, Capayas and Bayongan IS. ....... 87
Figure 26. Canal layout of the Malinao IS. .............................................................................. 91
Figure 27. Location map of the Bohol Integrated Irrigation System ....................................... 94
Figure 28. Malinao dam profile. ............................................................................................... 95
Figure 29. Bohol groundwater potential map. ......................................................................... 96
Figure 30. Bohol Erosion Map. ................................................................................................ 96
Figure 31. Bohol walkthroughs and system boundaries. ........................................................ 97
Figure 32. General canal layout of the Jalaur-Suague RIS. ................................................... 99
Figure 33. 3D map showing the Sibalom-Tigbauan, Jalaur-Suague, and Barotac Viejo RIS.
................................................................................................................................................ 100
Figure 34. Iloilo groundwater potential map. ......................................................................... 111
Figure 35. Iloilo Erosion Map. ................................................................................................ 111
Figure 36. Iloilo walkthroughs and system boundaries. ........................................................ 112
Figure 37. Geotagging of location of stuctures in Padada RIS from JICA Project. .............. 114
Figure 38. Geotagging of perimeter of IA Boundaries in Padada RIS from JICA Project. ... 114

7 | P a g e
Figure 39. Area boundaries of the different IAs of Padada RIS with canal layout and
parcellary map........................................................................................................................ 117
Figure 40. Canal layout and parcellary map of Padada RIS with other intake dams. .......... 118
Figure 41. Sample water delivery schedule. ......................................................................... 120
Figure 42. Padada RIS general information. ......................................................................... 126
Figure 43. Padada RIS Cropping Pattern.............................................................................. 126
Figure 44. Davao del Sur groundwater potential map. ......................................................... 127
Figure 45. Davao del Sur Erosion Map. ................................................................................ 128
Figure 46. Davao del Sur walkthroughs and system boundaries. ........................................ 128
Figure 47. Layout map of Marbel #1 RIS with relative locations of the 18 IAs area
boundaries. ............................................................................................................................ 129
Figure 48. 3D map showing the area around Marbel #1 and Banga RIS............................. 130
Figure 49. Canal layout map of Marbel #1 RIS ..................................................................... 133
Figure 50. Layout of the Marbel #1 RIS showing the different Divisions. ............................. 134
Figure 51. General information of Marbel #1 RIS. ................................................................ 136
Figure 52. South Cotabato groundwater potential map. ....................................................... 137
Figure 53. South Cotabato Erosion Map. .............................................................................. 138
Figure 54. South Cotabato walkthroughs and system boundaries. ...................................... 138
Figure 55. 3D map showing relative elevation of service area and terrain of the whole
watershed of the NIS covered in Bukidnon. .......................................................................... 142
Figure 56. Firmed-Up Service Area (FUSA), Program and Actual Irrigated Areas (Wet and
Dry) and
Figure 57. GIS map of results for Cycle 1 ............................................................................. 177
Figure 58. GIS map of results for Cycle 2 ............................................................................. 178
Figure 59. Distribution of the effects of Component weights for Integrated Analysis of Cycles
1 and 2. .................................................................................................................................. 179
Figure 60. Standardized Computed Performance Index....................................................... 180
Figure 61. Performance Index vs Yield ................................................................................. 182
Figure 62. Result of regression with the presence of ISF ..................................................... 182
Figure 63. GIS map of results for Cycles 1 and 2. ................................................................ 183

8 | P a g e
Assessing the Resurgent Irrigation Development Program of the Philippines –
National irrigation systems component
Roberto S. Clemente, Arthur L. Fajardo, Vicente G. Ballaran Jr.,
Julie Carl P. Ureta, Arman S. Baulita, and Kristel Camille J. Tapire
1. Background and Brief Description of the Project
The government through the National Irrigation Administration (NIA) undertakes the planning, construction, O&M, and rehabilitation of national irrigation systems (NIS), which are mostly
run-of the-river gravity systems, though a few systems use large pumps to extract water from major river systems. The NIS are typically more than 1000 hectares (has) in size, with the largest three systems with water reservoirs for dry season cropping having service areas ranging
from about 30,000 to 110,000 has. They presently number close to 220 systems with a total firmed up service area of about 723,000 has and have accounted for approximately 78% of
government capital outlays for irrigation from 1966 to 2012. However, the NIS accounted for only 47% of government’s capital outlays for irrigation from 2008 to 2012, much lower than the overall average as greater budgets were allocated for communal and other smaller irriga t ion
systems in recent years. Also, while irrigation service fees are collected from farmers, these do not cover any of the capital cost nor the full cost of operation and maintenance.
The project aims to evaluate the effectiveness, impact, and efficiency of the government's irrigation program. Irrigation is firmly ensconced in key legislations for agriculture in the
Philippines, namely Magna Carta of Small Farmers (RA 7607) and the Agriculture and Fisheries Modernization Act or AFMA (RA 8435). The project aims at providing a set of
recommendations for public irrigation projects. It is the second phase of an appraisal initia ted in 2013-2014, whose output is a series of Policy Notes and a Discussion Paper of the Philipp ine Institute for Development Studies. For this phase, the study focuses on three components: i)
assessment of NIS towards improved governance; ii) rapid appraisal of communal irriga t ion systems (CIS); and iii) cross-cutting issues.
The three types of irrigation are distinguished by its size in terms of service area, source of water, technology of water extraction and distribution, and the nature of governance. The
government, through the National Irrigation Administration (NIA), undertakes the planning and design, project selection, operation and maintenance, repair, restoration, and rehabilita t ion
of national irrigation systems. And though irrigation service fees are collected from farmers, revenues are generally less than the cost of operation and maintenance, while the government finances all of the capital cost of irrigation construction, repairs, and rehabilitation. By the late
1980s, irrigators’ associations have been developed to undertake some of the operation and maintenance functions in NIS.
National irrigation systems are defined to be those with service areas that are 1000 has and above, with the largest reaching slightly more than 100,000 has, though a small number are
currently less than the threshold size. There are about 217 national irrigation systems with a total service area of 770,000 has. The three largest NIS, which all have reservoirs in combination with run-of-the-river gravity irrigation systems, account for about one -third of
total NIS service area (Inocencio, et al, 2018). The other two-thirds are mostly just run-of-the-

9 | P a g e
river gravity irrigation, except for five medium sized NIS that pump water from large rivers (Inocencio et al. 2018).1
The large gap between actual irrigated area and design area in national irrigation systems have
been pointed out in several studies and summarized in the policy-oriented World Bank irrigation sector review of 1992. Overly optimistic technical and economic assumptions, inadequate water supply, inappropriate designs of irrigation systems, difficulties in operation
and maintenance have been listed as the main reasons for the disappointing performance of the national irrigation systems.
Upon examination of the NIS which started operation in the 1990s, they showed even poorer performance than irrigation projects completed earlier which should lead to question the
budgetary allocations for those irrigation projects. There appears to be little effort to adopt more realistic assumptions in estimating design areas. Also, estimates of available water
supply continue to be overstated and designs of irrigation systems have not adequately addressed or taken into account drainage problems, location-specific physical characterist ics and rapid urbanization. Operation and maintenance have not significantly improved despite the
nearing completion of irrigation management transfer to irrigators’ associations.
The incentive structure to do more accurate ex-ante and ex-post evaluations of both new construction and rehabilitation irrigation projects (Table 1), more efficient engineering designs, and more effective operation and maintenance had been apparently too weak both within the
bureaucracy and the lending agencies, despite presumably rigorous evaluations, particularly of foreign-funded projects.
Table 1. Appropriation for Irrigation per year Year
Appropriation for irrigation (P billion)
Share in Department of Agriculture budget (%)
2011 12.79 36.8
2012 24.45 46.2 2013 27.16 42.1
2014 21.18 30.9
2015 26 42 2016 (no data) (no data)
2017 38 (no data) 2018 41.7 (no data)
It should be emphasized that the opportunities to do better planning, construction, operation
and maintenance, and rehabilitation are now much better. Greater and more accessible technical data have been collected through remote sensing and field level measurements. The
technical capacity to undertake more modern and rigorous methodologies of analysis and design, e.g., GIS analysis, mathematical modeling and simulations, is now available in the country. However, the evaluation and continuous refinement of involvement of farmers in the
governance of the sector from planning to rehabilitation remains relevant. The constraint appears to be the limited effective demand for improved governance of the sector.
1A few attempts have been made to introduce deepw ell pumps in Central Luzon, but these have generally failed w ith the latest
such project in Tarlac called the Tarlac Groundw ater Reactivation Project also proving to be unsustainable.

10 | P a g e
Undoubtedly, the performance of irrigation systems is influenced not just by the quality of
governance of the sector itself, but also importantly by factors outside its control. These are the worsening flooding problems caused by constriction of waterways; the rapid denudation of the
watersheds which accelerate the rate of flooding and siltation within the irrigation system and reduce available water supply; and the political pressures impinging on the choice of irriga t ion projects and contractors, proper operations of irrigation systems, as well as quality of
appointments in the bureaucracy.
NIS cases covered in this Report
The list of the 39 NIS cases in Luzon, Visayas and Mindanao is shown in Table 2. The selection
of these NIS is based on criteria such as location, size, performance (successful/non- successful), and irrigation technology (gravity vs pump). For each selected NIS case, the
proponents meet with the IMO Division Manager, NIS Manager, or any key personnel knowledgeable with the system. All available technical references including feasibility studies, technical drawings, and network maps were obtained (hard and soft copy). Review and analys is
of the maps, including technical specifications, canal layout, location and functions of irriga t ion structures, and irrigated and built-up areas, were conducted. The 22 cases in Luzon (Figure 1)
include 3 in Nueva Ecija, 3 in Tarlac, 1 in Pampanga, 1 in Bulacan, 2 in Ilocos Norte, 1 in Ilocos Sur, 2 in Pangasinan, 3 in Cagayan, 2 in Isabela, 1 in Camarines Sur, 1 in Occidental Mindoro, 1 in Quezon and 1 in Cavite. Specifically, the system names are PDRIS (Pampanga),
TGIS and TASMORIS (Tarlac), UPRIIS (Nueva Ecija), AMRIS (Bulacan), Nueva Era RIS and Bonga Pump #2 PIS (Ilocos Norte), Banaoang PIS (Ilocos Sur), MARIIS (Isabela), Solana
PIS (Cagayan), Visitacion RIS (Cagayan), Magapit PIS (Cagayan), Libmanan-Cabusao PIS (Camarines Sur), Ambayoan-Dipalo RIS (Pangasinan), Caguray RIS (Occidental Mindoro), Balayungan RIS (Cavite) and Dumacaa RIS (Quezon). Meanwhile, the 17 NIS cases in Visayas
and Mindanao include 1 in Capiz, 3 in Iloilo, 3 in Bohol, 2 in Leyte, 3 in Bukidnon, 1 in Davao del Sur, 2 in North Cotabato, and 2 in South Cotabato (See Figure 2). Specifically, the system
names are Mambusao RIS (Capiz), Jalaur-Suague RIS (Iloilo), Sibalom-Tigbauan RIS (Iloilo), Barotac Viejo RIS (Iloilo), Malinao RIS (Bohol), Capayas RIS (Bohol), Bayongan RIS (Bohol), Binahaan-Tibak RIS (Leyte), Daguitan-Guinarona-Marabong RIS (Leyte), Manupali
RIS (Bukidnon), Pulangui RIS (Bukidnon), Roxas-Kuya RIS (Bukidnon), Padada RIS (Davao del Sur), M’lang RIS (North Cotabato), Maridagao RIS (North Cotabato), Marbel #1 RIS
(South Cotabato), and Banga RIS (South Cotabato). All NIS covered were relatively old (more than 25 years) except for Pampanga Delta RIS, Malinao NIS and MalMar.

11 | P a g e
Figure 1. Relative locations of service areas of 22 NIS cases covered in Luzon.

12 | P a g e
Figure 2. Relative locations of 17 NIS cases in Visayas and Mindanao.
Table 2. List of NIS Cases covered in this Report
Count Region Province System Name
2 1 Ilocos Norte Nueva Era RIS and Bonga Pump #2
PIS
1 1 Ilocos Sur Banaoang PIS
2 1 Pangasinan Ambayoan RIS and Dipalo RIS
3 2 Cagayan Magapit PIS, Solana PIS and Visitacion
RIS
2 2 Isabela Divisions 2 and 4 of MARIIS
3 3 Nueva Ecija Divisions 2, 3 and 4 of UPRIIS
1 3 Pampanga Pampanga Delta RIS
3 3 Tarlac TGIS, Tarlac RIS and San Miguel-
O’Donnell RIS
1 3 Bulacan Angat-Maasim RIS
1 4B Occidental
Mindoro
Caguray RIS
1 4A Cavite Balayungan RIS
1 4A Quezon Dumacaa RIS
1 5 Camarines Sur Libmanan-Cabusao PIS
1 6 Capiz Mambusao RIS
3 6 Iloilo Jalaur-Suague RIS

13 | P a g e
Count Region Province System Name Iloilo Sibalom-Tigbauan RIS Iloilo Barotac Viejo RIS
3 7 Bohol Malinao IS Bayongan IS Capayas IS
2 8 Leyte Binahaan-Tibak RIS Daguitan-Guinarona-Marabong RIS
3 10 Bukidnon Manupali RIS
Pulangui RIS Roxas-Kuya RIS
1 11 Davao del Sur Padada RIS
2 12 North Cotabato M’lang RIS Maridagao RIS (MalMar 2)
2 12 South Cotabato Marbel #1 RIS
Banga RIS
39
TOTAL
2. Rationale and Objectives
The disappointing performance of public investments in large-scale irrigation in the Philipp ines has been documented as early as the late 1980’s and early 1990’s by David (1986), Ferguson
(1987), and the World Bank (1992) mainly in terms of the significant gap between actual irrigated area and design area of selected national irrigation systems. Moreover, a Policy Note published by PIDS considered additional measures of performance of all NIS from the mid -
1960s to 2012 which included cropping intensity and irrigation service fee (ISF) collection. However, it is recognized that there are other relevant indicators of irrigation performance of
national irrigation systems. Thus, the overall objective of this component is to evaluate the policy, programmatic, and institutional framework governing irrigation development and management for the main purpose of improving irrigation performance and productivity of
irrigated lands in the Philippines.
The Objectives for Component 1: National Irrigation Systems are as follows: The project aims to evaluate the effectiveness, impact, and efficiency of the government's irrigation program. By component, the objectives are as follows:
Component 1: National Irrigation Systems
Objectives for this component are as follows: (1) Characterize the distribution of all the NIS; examine the trends and patterns of
performance indicators of NIS across the different systems, based on secondary sources.
(2) For selected 39 NIS cases, undertake the following: Review the effectiveness of the NIS project cycle at each stage, namely identificat ion,
feasibility assessment, project selection, project design, construction, operation and maintenance, repairs, restoration, and rehabilitation;

14 | P a g e
Characterize and explain deviations, if any, from design area and intended water service delivery, based on technical evaluation, engineering measurements, GIS mapping, site visits
(including walk-through), and key informant interviews especially of irrigators’ association (IA) members;
Characterize and evaluate the incidence of individual pump usage within or in the vicinity of the selected NIS, in terms of effectiveness and cost, in relation to gravity irrigation users; (3) Undertake an overall review of the effectiveness of the NIS project cycle based on
Objectives (1) and (2) state recommendations to improve project identification, selection, design, implementation, operations, and maintenance.
3. Review of Literature
The fundamental causes of poor performance of government owned and managed irriga t ion systems in most cases are institutional rather than technical (Bottrall, 1995). The question is:
what institutional arrangement would allow efficient and sustainable water management in irrigation? (Trung, et al, 2005).
Trung, et al (2005) compared the performance of three (3) irrigation management models to test if equity of water supply and land and water production are effective or not. The coefficient
of variation and the modified water quality rate (MIR) as per Abernethy (1986) were used to estimate the equity in water distribution.
It was found that the increased participation of farmers in the decision-making process contribute to improved performance. For example, the equity of water distribution and land
and water production are found higher in the model managed by the farmers, followed by shared management system and the conventionally managed.
Introduction of the large gravity irrigation system in the Indus Basin in the late 19 th century without a drainage system resulted in a rising water table, which resulted in water logging and
salinity problems over large areas (Kazmi, et al, 2012). In order to cope with the salinity and water logging problems, the Pakistan government initiated installation of 10,000 tube wells in different areas. This not only resulted in the lowering of water table, but also supplemented
irrigation. Resulting benefits from the irrigation opportunities motivated farmers to install private tube wells. The Punjab area meets 40% of its irrigation needs from groundwater abstraction (Kazmi, et al, 2012). Today, farmers apply both surface water flows and
groundwater from tube wells, creating a pattern of private and public water control. The field work in the Lagar irrigated area, as discussed in this paper, shows that within the general picture
of conjunctive use of canal water and groundwater, there is a clear spatial pattern between upstream and downstream areas, with upstream areas depending much less on groundwater than downstream areas. The irrigation context in the study area proves to be highly complex,
with water users having differential access to canal and tube well water, resulting in different responses of farmers with their irrigation strategies, which in turn affect the salinity and water
balances on the fields (Kazmi, et al, 2012). Nowadays, with the Pakistan Government charging electricity at a flat rate when it is used for
agricultural purposes, operational costs of electrically operated pumps are much less than that of diesel pumps (Kazmi, et al, 2012).

15 | P a g e
Tiewtoy, et al (2010) evaluated the performance of two projects in Thai Chin Basin namely Kangphaengsen (KPP) and Phrophraya (PPP) Irrigation projects based on key indicators using
Principal Component Analysis (PCA). Results indicated that net farm income, awareness on irrigation water use, managing of water delivery schedule and agricultural operation and field
application ratio are the major indicators of performance for KPP. In PP, on the other hand, analysis showed that irrigation sustainability is affected by 4 key indicators such as perception of drained water quality, satisfaction on adequacy of water distribution, field application ratio
and net farm income.
Shah, et al (2016) examines the fairness in distribution of water in a tertiary canal within the Indus Basin Irrigation System. They have shown that although the depth of flow at the tail end of a canal is widely used in the Indus Basin Irrigation System as a proxy indicator, this is in
fact a poor indicator of equity. They reaffirm that measuring flows within a canal where dedicated flow measurement structures do not exist and one has to resort to rating equations
and/or measuring discharge through outlets still poses a challenge. However, it is still possible to obtain reasonable estimates and thereby determine the inequity in the system. The advantage of using a quantitative measure of inequity such as the Gini as opposed to the qualitat ive
description hitherto more common is that it allows alternative comparisons to be made.
A study conducted by David, et al (2012) focused on the evaluation of National and Communa l Irrigation Systems and Small Water Impounding Project (SWIP) in Ilocos Norte where irrigation intensity was used as an indicator of performance. It is aimed to examine the ratio of
the actual irrigated area during the dry season to the irrigated service area. Results indicate that the performance of the system in the province are quite poor as reflected in the dry season
cropping intensity of only 27% in 2005. This was partly attributed to the extensive damage of the dam covering the Madongan River Irrigation System which was also associated to the design shortcomings of the headworks and hydraulic structure.
Irrigation efficiency, as a complex and useful measure of irrigation performance, is in a
vulnerable scientific position. Knowledge gaps feed through to naïve views of a sector held to be highly inefficient, ‘wasting’ freshwater which could be allocated to other purposes (Lankford, 2012).
The allure of irrigation efficiency as a single measure of system performance produces, in part,
the doubts that irrigation scientists hold with it. Notionally simple, it is highly prone to capture by groups that engage with irrigation, feeding through variously to public and scientist/engineer understandings, and policies and practices regarding irrigation and water allocation. It can,
without doubt, be misunderstood. Donors, advisers and irrigation engineers often ignore that irrigation systems sit nested within larger systems of recapture and reuse. Thus a ‘loss’ from
one unit within the hierarchy should be parenthesised, qualified, and quantified (Lankford, 2012).
Raising irrigation efficiency can lead to increased consumption from the basin if the consumed fraction increases relative to the recovered fraction (Lankford, 2012).
As cited by Pradeep, et al (2015) and Mahato (2013), the following major reasons have been identified for low water use efficiency of irrigation projects in Maharashtra: poor or no-
maintenance of canals/distributaries/minors of irrigation systems resulting in growth of weed & vegetation, siltation, damages in lining etc.; distortion of canal sections due to siltation or
collapse of slopes resulting in some channels carrying much less and some other channels

16 | P a g e
carrying much more than their design discharges; non-provision of lining in canal reaches passing through permeable soil strata; leakages in gates and shutters; damaged structures; no
regulation gates on head regulators of minors causing uneven distribution of water; over irrigation due to non-availability of control structures and facilities for volumetric supply of
irrigation water to farmers; poor management practices; lack of awareness among farmers about correct irrigation practices and cropping pattern.
The Jai Malhar Water user Association, Indore Minor Irrigation Project, Dist: Nasik, Maharashtra, India, discarded the use of open channel and established an innovative water
conveyance and distribution PVC pipe system. This is to maximize the benefit and equitable distribution of water. They replaced the open channel water distribution network with innovative specially designed gravity flow PVC pipe water distribution network to resolve the
above problems. On the other hand, their system has in-built effective and simple built- in) water management scheme (Pradeep, et al, 2015).
There is now a growing consensus among irrigation researchers that the primary reasons behind the poor performances of canal irrigation systems include: (1) inadequate data base for
planning, (2) inadequate institutional capacity and mechanisms for project planning and development, (3) design errors, (4) poor quality of construction, (5) inadequate and fragmented
irrigated agriculture support services, (6) overoptimistic assumptions of water use efficiency and irrigation service area during the project planning stage, and (7) failure to manage and distribute irrigation water efficiently and effectively (David, et al, 2012). Because of inadequate
baseline information and institutional capacity for project planning, designers and builders of the irrigation facilities fail to establish appropriate design criteria (Horst 1998; Plusquellec
2002; David, 2003; 2008; 2009) Horst (1998) concluded that often in the design phase, little to no attention is paid to operational
aspects. He specifically identified the design of water division structures as the core of many irrigation problems. Owing to their functions, he argues that the type and characteristics of
these structures largely determine the operability and manageability of the system and are the points of interface where conflicts of interest among farmers and between farmers and management often take place. He pointed out that the design of many water division structures
was based on incorrect hydraulic supposition and was also devoid of social and institutiona l criteria such as staff requirement (in terms of number and skills), operability and social
acceptance, among others. Such design shortcomings led to hydraulically unstable canals which were too cumbersome to operate, requiring extra field staff.
The problem of inappropriate design criteria has always been a major constraint to irriga t ion development in the Philippines. It can be traced to the failure to invest in the collection and the
generation of the necessary baseline information and the limited interactions among design and O&M engineers. Design engineers are not required to test run the systems they designed in collaboration with those who are supposed to operate and maintain them. As a result, design
errors are repeated from system to system without being rectified.
NIA irrigation systems in general appear to have various technical problems and issues that need to be resolved. First, it was observed that in the four selected irrigation systems (AMRIS, Pampanga Delta, Balog-Balog, and Casecnan) the actual irrigated areas had all been
consistently below the target or design irrigation area (Tabios and David, 2014). The major reason was overestimation of irrigable areas by not fully accounting for built-up areas or
urbanization, flooded areas during the wet season, and elevated areas that cannot be reached

17 | P a g e
by gravity systems. Other reasons were mentioned such as overlapping watershed boundaries (e.g. Balog-Balog and Casecnan irrigation systems), competing water use in the case of
AMRIS, and serious technical and financial issues concerning the proposed Balog-Balog dam.
A study was conducted by Moya (2014) for 14 irrigation systems in Luzon and Visayas to evaluate the kind of design problems determining underperformance of the systems. He reported several issues which caused low performance of the irrigation systems includ ing,
among others: a) field water requirements used in the design of most irrigation systems have been grossly underestimated; 2) water losses throughout the system were underestimated; and
3) on account of the conventional approach to designing canals and water control and regulating appurtenances based on maximum flow conditions, many irrigation systems are littered with redundant turnouts and unresponsive and long farm ditches that had increased
project costs. Some recommendations to address these issues are also mentioned in the report by Moya (2014).
To obtain a good harvest, there is a need for adequate water supply and suitable quality. The main problem in the Philippine irrigation is the insufficient water supply. Most projects and
rehabilitation work focus on providing structures for irrigation, neglecting the quality of the water irrigated on the crops.
The salinity of the water would be a problem if salt accumulates in the crop root zone to a certain level that would lead to loss in yield (Ayers and Westcot, 1994). Excessive salt in the
rootzone would hinder the crops in extracting enough water from the soil. This could lead to slow growth and maturity of the crops that can significantly affect the yield.
Accumulation of toxic ions at sufficiently large concentrations also causes crop damage and reduced yields (Ayers and Westcot, 1994).
Some studies also link water quality and rice productivity. A study on the effect of water
pollution on rice was conducted in Vietnam where rice farmers were surveyed in two areas with the assumptions of the same natural condition and social characteristics (Huynh and Yabe, 2012). One is considered as the polluted area near and directly receiving wastewater from
industrial parks, while the other is assumed to be non-polluted area far from and having no effect of industrial pollutants. The yield loss of rice production caused by water pollution was
estimated by the difference in rice yield between the two regions. The results showed that the yield loss of rice was about 0.57 – 0.75 tons per hectare per crop (Huynh and Yabe, 2012). Polluted water hinders absorption of nutrients, and causes stunted growth of crops. Based from
statistical analysis, there is also an increase in rice production cost and 26% profit loss due to water pollution.
Gao, et al (2017) used PCA to study the data structure of soil contaminations, relationships and differences of soil pollutions, and the major components of soil pollutions. The result of
agriculture field quality classified with component scores showed that paddy field irrigated with clean water was on the top of the six types of land, and soil environment of sewage
irrigated paddy field had the worst quality. The relationships with and contribution to contamination of soil pollutants were reflected well. The effect of heavy metals inputting was higher than organic pesticide, and is the major factor of soil contamination. The study implied
that PCA is advantageous in the assessment on complex soil contamination and classifica t ion of soil environmental quality, and could be used in soil pollutants identification and soil

18 | P a g e
environment assessment as well. The method could simplify the process of major soil pollutants identification especially in cases of complex or poorly recorded contamination.
A study by Wang, et al (2017) involved an experiment in a solar greenhouse spanning three consecutive growing seasons to evaluate the effects of irrigation and fertilization on the fruit
yield and quality, water use efficiency (WUE) and fertilizer partial factor productivity (PFP) of tomatoes. Interactions between irrigation and fertilization treatments and individual factors of irrigation and fertilization significantly (p < 0.01) affected fruit yield, WUE and PFP. PCA
results showed that WUE and fruit yield and quality were more sensitive to changes in irrigation than to changes in fertilizer, but PFP showed the opposite trend. Interestingly, the
treatment with moderate irrigation (W2: 75% ET 0) and high fertilizer level (F1: 240N−120P2O5−150K2O kg ha−1) was twice ranked first after a combinational evaluation. It was concluded that proper application of drip fertigation (W2F1) may be a good compromise
for solar greenhouse-grown tomatoes with regard to fruit yield and quality, WUE, and PFP.
Fang, et al (2017) studied the driving factors of irrigation water-use change based on a study of literature and a field survey. It selects 21 indices from five aspects of climatic change, resource endowment, economic situation, technological level, and management mode as the
system of driving factors for irrigation water-use change. The statistical data on economic and social development in the 31 provinces of China in 2009 are analyzed using the principa l
component analysis (PCA) method to extract the main driving factors affecting irriga t ion water-use efficiency change. After calculation of factor scores, regional differences among driving factors of irrigation water use efficiency are evaluated and results show that these can
be attributed to the factors of agricultural economic development, water-saving irriga t ion technology, water resource endowment, and dissipation.
Irrigation is firmly ensconced in key legislations for agriculture in the Philippines, namely Magna Carta of Small Farmers (RA 7607) and the Agriculture and Fisheries Modernizat ion
Act or AFMA (RA 8435). As such, it has commanded considerable investments from government, with significant surge over the last three years.
The Magna Carta requires that the government provide adequate support services that will address the development, management, and conservation of water resources (Section 19). The
AFMA furthermore states the imperative to prevent the further destruction of watersheds, rehabilitate existing irrigation systems and promote the development of irrigation systems that
are effective, affordable, appropriate, and efficient (Sect. 26). Irrigation development and management in the country has historically been the single biggest item of public expenditure for agriculture, accounting for about a third of the total budget since the 1960’s (Inocencio
et al. 2018). In the 1970s and early 1980s, as well as in recent years when world rice prices rose at unprecedented levels, this ratio averaged even higher, at close to half of total public
expenditures for agriculture (Inocencio et al. 2018). In recent years, irrigation has taken up about 30–46 percent of the budget of the Department of Agriculture (Inocencio et al. 2018). In the 2015 proposed budget for the agriculture sector of PHP 62 billion, irrigation continued to
get the biggest share of about PHP 26 billion or 42 percent of total.

19 | P a g e
4. Methodology
4.1. Field visits Arrangement with contacts at various IMOs and NIA offices of
selected NIS and itinerary of activities.
Prior to field visits, Head of NIA offices (Regional Manager and Division Manager) in the NIS
cases were contacted for scheduling of field visits and nature of activities. Request for secondary data were also coordinated. Secondary data include:
• NIS functionality surveys;
• Technical Data (i.e. system profile, service area, irrigation efficiency, construction cost, rehabilitation cost, yield, cropping calendar, cropping intensity, feasibility studies,
technical drawings, layout map);
• Status of IAs (i.e. profile/institutional report of IAs, source of funding, financ ia l status/viability, program of works (POWs) for all available years, and nationa l irrigation system performance (NISPER).
4.2. Collection of data from primary sources (RAP: (KII FGDs), field measurements
and observations) and secondary sources (NIA reports and documents)
The project activities include site visits, field measurements, and questionnaire surveys . Questionnaires for Key Informant Interviews (KII) and Focus Group Discussions (FGDs) for the 39 NIS cases were prepared and used during the field visits. These were part of Rapid
Appraisal Procedure (RAP) of MASSCOTE where most of the questions are derived. KIIs of key system personnel (e.g. IMO, System managers, IDOs/operations staff, and IA
President/officer) engaged in NIS operation were conducted. At the time of survey in Visayas and Mindanao, R.A. 10969 or Free Irrigation Service Act was being implemented. Some of the guide questions were revised to include the effect of Free Irrigation Service Act. NIA
Memorandum Circular related to R.A. 10969 is summarized in Annex A. Detailed description of the guide questions and questionnaire surveys is presented in Annex B.
FGDs with IA officers/members were carried out. Information on socio-economic characteristics of farmer-members, institutional capacity of IA, problems and constraints in
managing the NIS laterals, and of the IA itself was generated from the FGDs. The status and current conditions of the main canal and selected secondary and tertiary canals were initia l ly
determined through FGD. IA officers/members interviewed represented the upstream, midstream, and downstream section of each NIS cases.
Simultaneous with FGDs, walk-throughs and actual field measurements were conducted to determine the status and current conditions of the irrigation facilities. Measurements in the field were conducted using portable equipment (flow meters, water quality kits, etc.). Measurements
include canal and structure dimensions, canal length, canal flow, silt depth, and water quality parameters (conductivity, DO and pH). Depending on the size of the IS, sections selected were:
(a) near the dam or headgate (which represent the upstream), (b) in the middle (which represent the midstream), or (c) at the tail end of the system (which represent the downstream). These structures/facilities were photographed and geo-tagged (GPS readings) for proper referencing.
Conveyance losses were measured on selected main and lateral canals, and where applicable, compared for lined and unlined canals.

20 | P a g e
Field activities and FGDs were conducted in the upstream, midstream, and downstream section because each location has customary and some unique characteristics. These characterist ics
may vary depending on the situations and should be verified by the field visits and FGDs. Example of customary characteristic is that upstream sections in a typical system have lined
canals and complete structures. The upstream sections usually have high cropping intensity due to high reliability/availability of water. However, upstream sections usually have inactive farmers (as member of IA) and low payments of irrigation service fees (ISF). On the other
hand, it could be expected that downstream sections in a typical system have unlined canals and incomplete structures (so water losses and inefficiency in water distribution are high
compared to lined canals in the upstream part). In effect, the downstream sections usually have low cropping intensity due to low water supply. Downstream sections usually have active farmers (as member of IA) and ISF payments ranges from moderate to high. The condition at
the midstream section could be in the range or the same as of the upstream and downstream sections. In terms of water quality, the downstream section is expected to have lower water
quality. Therefore, evaluating the up-, mid- and downstream location could provide a better understanding of the overall condition of a specific irrigation system.
4.1.1. Technical/Physical Factors
The following is a partial list of primary and secondary data related to Physical/Technica l
factors collected in the different NIS:
• Location and description of project sites
• Climate (rainfall, temperature, humidity)
• Soil property (soil fertility)
• Irrigation water supply (flow ratio, field application ratio)
• Topography (DEM)
• Relative location of irrigated areas with respect to canal network
• Location of Sub-Main Canal in the field
• Relative position of irrigated area to water resource
• Irrigation and drainage ditch condition and siltation
These factors address the degree of satisfaction of farmers on the condition of ditch (canal) and drainage ditch system in terms of cleanliness and smoothness. These also reflects the erosion/siltation problem in the canals which can be related to flow capacities. Degree of
satisfaction is classified into five levels, i.e. 1=strongly dissatisfied, 2=dissatisfied, 3=neutral, 4=satisfied, 5=strongly satisfied.
4.1.2. Institutional Factors
The questionnaires were used to determine the farmer’s degree of satisfaction on irriga t ion water delivery. Details such as the degree of satisfaction on the adequacy of water distribution to individual farms, matching of farm operations with NIA water delivery, reliability of
continuous flow during irrigation period, degree of satisfaction on institutional organizat ion, and information about the farmer’s willingness to pay for their irrigation water are also
included in the questionnaires. A five-point Likert scale was used for optimization. Each item in this scale ranged from 1 (strongly disagree) to 5 (strongly agree). The reliability of questionnaires was tested using Cronbach’s alpha coefficient method (Pallant, 2005).

21 | P a g e
4.1.3. Environmental Factors (Water quality)
The important environmental factors to consider in irrigation water quality are electrica l conductivity (EC), total dissolved solids (TDS), pH and dissolved oxygen (DO).
Electrical conductivity (EC)
Electrical Conductivity (EC) is a measure of the water salinity or the total salt content of water based on the flow of electrical current through the sample. EC is measured in unit deciSiemens per meter (dS/m).
Total dissolved solid (TDS)
Total dissolved solid (TDS) represents the total amount of salts in the water. It is reported in milligrams per liter (mg/l), parts per million (ppm) or parts per thousand (ppt). The TDS concentration can be obtained by multiplying the conductivity value with a factor which is
empirically determined.
Acidity/Alkalinity (pH)
pH is a measure of the acidity or alkalinity of water. The pH scale ranges from 1 to 14; water
is acidic if pH is between 1 to 7, whereas alkaline for the range between 7 to 14. Water is neutral at pH 7.0. The normal range for irrigation water is from pH 6.5 to 8.0 where crops have done well in this range. Table 3 presents the classification of water quality in different scores
for each quality level using guidelines of Arnold, et al (2007) for interpretation of irriga t ion water quality.
Table 3. Classification of Water Quality for Irrigation Water.
Electrical Conductivity (EC) (dS/m)
TDS (ppm) pH Quality Score
< 0.25 <175 <6.5 Excellent 5 0.25-0.75 175-525 6.5-6.8 Good 4
0.75-2.00 525-1400 6.8-7.0 Permission 3
2.00-3.00 1400-2100 7.0-8.0 Doubtful 2 >3.00 >2100 >8.0 Unsuitable 1
Source: Arnold, et al (2007)
Dissolved oxygen (DO)
Dissolved Oxygen (DO) indicates the amount of oxygen dissolved in a body of water. In this
study, DO will be classified into four classes such as: a much deteriorated, deteriorated, fair, and good. Table 3 presents the classification of dissolved oxygen (DO) using the guidelines of Pollution Control Department (PCD, 2007) to interpret the DO factor and assign a score for
each quality level presented in Table 4.
Irrigation water quality data were analysed at the project sites using portable water quality kits at three locations i.e. upper, middle, and lower sections of each main canal. The water quality

22 | P a g e
parameters analysed include i.e. pH, electric conductivity (EC), total dissolved solid (TDS), and dissolved oxygen (DO).
Table 4. Classification of Dissolved Oxygen (DO) Quality.
(Dissolved Oxygen)
(mg/l)
Quality Score
<2 Very deteriorated 1
2-4 Deteriorated 2
4-6 Fair 3
>6 Good 4
Source: PCD, 2007
4.3. GIS mapping and Spatial Analysis
Available maps especially service area maps from each NIS cases were digitized if no
shapefiles were available. Walkthrough maps of specific NIS cases covered were developed using the service area map and GPS readings of headworks, canal structures and water flow and quality measurement points. Moreover, available digital elevation maps (DEM), soil
erosion maps, soils maps, built-up area maps, and ground water potential maps were presented for specific NIS cases. Data for these maps were obtained/ sourced from Department of
Agriculture, DA-BAR, DA-BSWM, NWRB, NAMRIA, DA-CIRDUP, and Google Maps. Spatial analysis is done by generating hillshade effect on the DEMs acquired through remotely
sensed images from ASTER. After which, the erosion map is shown side by side with the DEM with delineated watershed in order to have a visual explanation as to where the possible siltat ion
came from (which could be due to the process of erosion and sedimentation from the upstream down to the downstream portion of the watershed and accumulation in the entry point or pour point region of the watershed. The rampant and prevalent problem among all NIS is the siltat ion
problem. With this, it is necessary to generate/delineate the watershed that may be the source of siltation on the particular service area/s of the visited NIS. Delineating the watershed that
may possibly be one of the sources of siltation is done using spatial analysis in ArcGIS. Service area maps and groundwater potential maps were overlaid to show/present areas within
a specific NIS cases with potential for STW irrigation. Potential STW irrigation areas could supplement NIS during low water supply.
In addition, Coastal Flood modelling is also done especially in the Magapit PIS in order to show the seawater intrusion experienced by some farmers near the coastal region of the NIS.
Moreover, overlaying the slope, soil type, erodibility, and built-up areas are done in order to show the reason why there is reduction in service area and occurrence of siltation problems in
most NIS canal systems.
4.4. Irrigation Performance Assessment using Principal Component Analysis (PCA)
In this study, principal component analysis (PCA) may help in identifying the factors presenting the most important variability in the sample, and then, explaining most part of the

23 | P a g e
total variability which represent technical, socio-economic, institutional and environmenta l parameters that affect irrigation performance.
The three main steps in PCA approach are as follows:
Step 1 – Is the assessment of the suitability of the data. A statistical measure was generated by Stata to help assess the validity of the PCA factor determinants called Kaiser Mayer Olkin
(KMO) measure of sampling adequacy (Kaiser, 1974). The KMO is expected to be greater than 0.5 to consider the PCA model to be a recommendable and acceptable value. Furthermore,
KMO values between 0.5 - 0.7 are claimed to be mediocre, 0.7 – 0.8 are good, 0.8-0.9 are great, and finally, values above 0.9 are superb (Field, 2005). To inspect the validity of the variables to be part of the principal components, a correlation matrix for evidence of coefficients were
generated. Variables with correlation coefficients greater than 0.3 are found to be appropriate (Pallant, 2005).
Step 2 – Is factor extraction using PCA approach. Tabachnick and Fidell (2000) recommend Kaiser’s criterion techniques to assist in the decision concerning the number of factors to be
retained. Factors with an eigenvalue of 1.0 or more are retained for further investigation.
Step 3 – Is factor rotation and interpretation. The most commonly used orthogonal approach is the varimax method (Kaiser, 1958) which attempts to minimize the number of variables that have high loadings on each factor. Although the acceptable varimax index is greater than 0.3,
the study used a cut-off of 0.4 to increase the validity of the weight of the variable index.
Determination of dominant factors affecting irrigation system
The analysis involved a sequence of logical steps, starting with the initial selection of factors
to the determination of key factors that best represented the technical, socio-economic, institutional, and environmental parameters. To complete the PCA the following steps are
performed: 1. Selection of a set of technical, socio-economic, institutional and environmental factors
for the study area.
2. T-test was used to test normality of data distribution and Cronbach’s alpha was used to test the reliability of questionnaire. Moreover, bivariate analysis was used to test the
correlation of data. 3. PCA was used to find out the principal components (PCs) as the best representative
factors or indicators (key factors). It will be assumed that PCs with high variance
(eigenvalues) best represent system indicators. Therefore, only PCs with eigenva lues more than 1 are used for further analysis (Pallant, 2005). Eigenvalues are the amount
of variance explained by each factor, in this case “technical, socio-economic, institutional and environmental indicators/attributes”.
Then the irrigation performance index (IPI) is developed based on principal components (PCs) that are defined as linear combinations of the variables that account for maximum variance
within the data set. IPI is formulated using the score of key indicators which are obtained earlier by PCA.
It should be noted that IPI is developed to reflect the technical and Institutional effectiveness of the project cycle from project identification, feasibility up to O&M since the factors and
questions related to these stages of the project are captured in the PCA. Moreover, the IPI will

24 | P a g e
indicate more than just Technical and Institutional dimension of irrigation management because it also includes Socio-economic and Environmental indicators that affect irriga t ion
systems performance and effectiveness. That is why our irrigation evaluation approach will be more comprehensive and encompassing since it covers both the effectiveness and overall
performance of the systems based on 4 these major indicators.
5. Results and Discussions based on Primary and Secondary Data
5.1. Synthesis of Key Observations/Findings for the 39 NIS covered
The major issue under Technical/Physical is siltation problems. The source of siltation is the rivers that supply water for the irrigation systems. Excessive river siltation causes lower water
intake and canal siltation. Canal siltation causes reduced flow capacities that deprive the downstream section of adequate water supply. Excessive siltation of the dam as well canal
siltation was observed in Ambayoan-Dipalo RIS (see Annex C and Photo 1), Nueva Era RIS, TASMORIS, Caguray RIS, Jalaur-Suague RIS, Padada RIS (see Photo 2), M’lang RIS and Manupali RIS (see Annex C). Poor watershed management results in upland erosion and
siltation of the rivers. This was partially verified by the erosion maps generated through GIS (see Annex C). Watershed management and environmental studies are important consideration
in engineering design and feasibility study of irrigation projects. The degradation of the watershed due to human activities and other factors is deemed to be one of the reasons for the unstable water resource for irrigation. Although watershed management is being considered
during design stage, it has problems during operation of the system after construction. In the Philippines, administratively, watersheds were being managed and controlled by the DENR
not by NIA in the case of NIS watershed. To reduce future rehabilitation works due to desilting, provision of silt control devices, either on the head works or on main or lateral canals, should be included in the design, especially for sediment laden rivers or creeks. Moreover, sediment
discharge studies should be considered as a prerequisite in the feasibility study. Estimation of sediment discharge should also be included in standard river flow measurement, in light of the
escalating erosion of our watersheds.
As part of the design, siltation of the dam can be controlled by opening the sluice gates during
high river flow. But opening the sluice gates can only control siltatio n at a certain extent. On the other hand, canal siltation can be controlled by regular maintenance. Silt control in silted
canals can be implemented through dredging or through the use of structures (i.e silt ejector of PDRIS and Marbel #1 RIS – in Annex C, by-pass canals). The lack of canal maintenance was mentioned during FGDs (as reason for canal siltation) by Mapamasa IA in Division 4 of
UPRIIS, Muhara IA in Solana PIS, Zigiran IA in Magapit PIS, Carsan IA in Ambayoan-Dipa lo RIS, and Gamot Bolo Nicolas IA in Caguray RIS, among others. Siltation depth was measured
in PDRIS (see Annex C) and was found to range from 6 cm midstream to 37 cm downstream. This indicates that flows have reduced considerably from the upper to lower sections of the main canal which is consistent with the increase in siltation depth from midstream to
downstream.

25 | P a g e
Photo 1. Silted diversion dam of Dipalo RIS
Photo 2. Silted Main Canal of Padada RIS where presence of shellfish is evident.
Siltation is also part of the headwork problems of all pump irrigation system (PIS) covered
(Bonga Pump #2, Banaoang, Libmanan-Cabusao, Solana and Magapit). Siltation could not be minimized in these systems since all of them were drawing water from major rivers (i.e.
Cagayan River for Solana and Magapit PIS and Libmanan River for Libmanan-Cabusao PIS; see also Annex C). These major rivers were not just outlets of water but also outlets for sediments.
The next major issue observed in the NIS cases covered was canal lining. The efficiency of
water distribution is a function of the condition of the main canals and laterals in terms of the lining coverage. If canal linings were not completed, the assumptions during design stage will not be valid. This could be one of the reasons for the large discrepancy between the design

26 | P a g e
service area and actual irrigated area or the discrepancy between FUSA and actual irrigated area. For example, the canal efficiencies for Divisions 1, 2, 3 and 4 in MARIIS (Table 5), and
Divisions 1, 2 and 5 in UPRIIS (Table 6) ranged from 41.3 to 81 % and from 49 to 73.8%, respectively. The design conveyance efficiency in main canals is 90% while in laterals is 80%.
This validates again the findings that earth canals have more seepage and percolation losses compared to lined canals hence efficiency in lined canals are higher than earth canals. More than 80% of the main canals and laterals in PDRIS, Bonga Pump #2, Libmanan-Cabusao PIS,
Malinao IS, Capayas IS, Bayongan IS, Manupali RIS, and Marbel #1 RIS are lined (Table 7 and 8). In contrast, more than 80% of the main canals and laterals in AMRIS, Magapit PIS,
Jalaur-Suague RIS, Barotac Viejo RIS, and Mambusao RIS are unlined or earth canals (Table 8 and 9). In addition, animals (especially carabaos) are frequenting the earth canals, causing damage (see sample in Photo 3) and collapse of the canal side slopes which can result in more
serious problems.
Photo 3. Damaged canal end section of Lateral D2-D2, Div. 4, MARIIS. Pile of sediments could be
observed in both embankments of the canal
Table 5. MARIIS canal efficiency summary
DIVISION
CANAL LENGTH (m)
LOSS Stretch Efficiency (%)
Total Stretch Length (m)
Total Loss (cu.m./s)
Measured Efficiency* (%)
cu. m /s
lps lps/km
I Lateral Q
525.0 0.0486 48.6477
92.662 96.5
1448.0
0.2672 81.0 602.0 0.1676
167.5854
278.381
87.2
321.0 0.0510 50.9650
158.769
95.4

27 | P a g e
DIVISION
CANAL LENGTH (m)
LOSS Stretch Efficiency (%)
Total Stretch Length (m)
Total Loss (cu.m./s)
Measured Efficiency* (%)
cu. m /s
lps lps/km
South Flow Main
43.0 0.1085
108.4520
2522.134
88.9
527.0 0.5751 41.3 484.0
0.4667
466.6560
964.164
58.0
II
Lateral A5
237.0 1.1583
1158.3210
4887.430
74.4 627.0 1.6547 63.4
390.0 0.4964
496.4220
1272.876
75.1
Lateral B
317.0 0.6232
623.2140
1965.975
86.7 950.0 1.2627 73.0
633.0 0.6394
639.4420
1010.176
84.9
III
Lateral A
374.0 0.1731
173.0480
462.695
77.5
1050.0
0.2760 64.2 202.0 0.0605 60.4780
299.394
89.4
474.0 0.0424 42.4410
89.537 89.0
NDC 9
243.0 0.2316
231.5670
952.951
80.9
1116.0
0.5048 58.4 400.0
0.0967 96.6570
241.643
89.3
216.0 0.1038
103.7970
480.540
86.0
257.0 0.0728 72.8040
283.285
88.4
IV
Lateral A1
532.0 0.4390
439.0180
825.221
69.1
894.0 0.6540 54.0 168.0 0.1523
152.3130
906.625
71.8
194.0 0.0626 62.6350
322.863
86.9
Lateral A1A
272.0 0.1595
159.4680
586.279
79.4 497.0 0.1754 77.3
225.0 0.0159
159.2040
707.574
74.1
Source: DOST NUWAM Project

28 | P a g e
Table 6. UPRIIS canal efficiency summary
DIVISION
CANAL LENGTH (m)
LOSS Stretch Efficiency (%)
Total Stretch Length (m)
Total Loss (cu.m./s)
Measured Efficiency* (%)
cu. m /s
lps lps/km
I Lateral F1-A
185.0 0.1550
155.0305
0.838 85.4
620.6 0.2783 73.8
120.8 0.0304 30.4115
0.252 97.2
134.9 0.0494 49.3712
0.366 94.7
110.9 0.0056 5.5842
0.050 98.2
69.0 0.0379 37.9289
0.550 70.4
II Lateral C1
1000.1
1.0156
1015.5710
1015.480
78.8 1552.1
1.3811 71.1 552.0
0.3656
365.5660
662.257
89.8
V Lateral E1
247.1 0.2719
271.8680
1100.233
69.3
548.1 0.4516 49.0 110.0
0.0164 16.3980
149.074
97.4
111.0 0.1527
152.6620
1375.333
76.6
80.0 0.0106 10.6340
132.923
98.1
Source: DOST NUWAM Project
Table 7. Summary of lined canals per system
Name of System Location/Municipality
LINED CANAL (km.)
(%) MC LAT TOTAL
PDRIS Arayat, Pampanga 31.8 29.8 61.6 89.12
AMRIS Bulacan, Pampanga 23.751 32.804 56.555 15.37
NUEVA ERA RIS Nueva Era locos Norte 4.498 0.52 5.018 40.44
BONGA PUMP #2 RIS San Nicolas, Ilocos Norte 14.133 14.529 28.662 95.03
MAGAPIT PIS Camalaniugan, Cagayan 17.53 - 17.53 13.55
LIBMANAN-CABUSAO PIS Camarines Sur 7.516 34.5223 42.0383 85.12
VISITACION RIS Sta. Ana, Cagayan 3.938 6.757 10.695 42.57
CAGURAY RIS Magsaysay, Occidental Mindoro 13.52 11.33 24.85 58.66

29 | P a g e
BALAYUNGAN RIS Naic, Maragondon Cavite 7.591 13.65 21.241 43.40
DUMACAA RIS Lucena City, Quezon 1.12 36.172 37.292 46.66
52.99
Table 8. Summary of unlined canals per system
Name of System Location/Municipality
UNLINED CANAL (km.)
(%) MC LAT TOTAL
PDRIS Arayat, Pampanga 0 7.52 7.52 10.88
AMRIS Bulacan 92.153 219.206 311.359 84.63
NUEVA ERA RIS Ilocos Norte - 7.392 7.392 59.56
BONGA PUMP #2 RIS Ilocos Norte - 1.5 1.5 4.97
MAGAPIT PIS Camalaniugan, Cagayan 11.24 100.567 111.807 86.45
LIBMANAN/CABUSAO PIS Camarines Sur 0.456 6.891 7.347 14.88
VISITACION RIS Sta. Ana, Cagayan 6.842 7.586 14.428 57.43
CAGURAY RIS Magsaysay, Occidental Mindoro 2.36 15.15 17.51 41.34
BALAYUNGAN RIS Naic, Maragondon Cavite 6.485 21.2198 27.7048 56.60
DUMACAA RIS Lucena City, Quezon 2.582 40.049 42.631 53.34
47.01
Table 9. Summary of lined, unlined and FUSA of the NIS in Mindanao (being consolidated to include Luzon and Visayas)
Lined (%) Unlined (%) FUSA
Main Lateral Main Lateral
MAMBUSAO RIS 29.83 19.19 70.17 80.81 1372
JALAUR-SUAGE RIS 5.69 7.48 94.31 92.52 12789.72
SIBALOM-TIGBAUAN RIS 37.92 1.57 62.08 98.43 1719.00
BAROTAC VIEJO RIS 2.87 11.36 97.13 88.64 1700.28
MALINAO IS 100.00 100.00 0.00 0.00 4740.00
CAPAYAS IS 100.00 100.00 0.00 0.00 1113.10
BAYONGAN IS 100.00 100.00 0.00 0.00 4084.00
BINAHAAN-TIBAK RIS 35.78 64.22 6444.00
DAGUITAN-GUINARONA-MARABONG RIS
89.57 66.13 10.43 89.57 2615.00
MANUPALI RIS 100.00 100.00 0.00 0.00 2170.00
PULANGUI RIS 57.36 33.74 42.64 66.26 10557.00
ROXAS-KUYA RIS 59.28 46.59 40.72 53.41 1006.00
PADADA RIS 30.50 69.50 3015.00
M’LANG RIS 23.51 76.49 3017.59
MALMAR2 32.44 67.56 19601.00
MARBEL #1 RIS 100.00 100.00 0.00 0.00 2042.78
BANGA RIS 80.83 19.17 2805.00

30 | P a g e
Another major issue observed in the NIS cases covered was non-functional, missing, or damaged irrigation structures. Irrigation structures are for measurement, control, and distribution of irrigation water supply. Staff gauges (part of flow-measuring structure) are
lacking or missing in most NIS cases visited (e.g. Libmanan-Cabusao PIS, Ambayoan-Dipa lo RIS, Caguray RIS, Balayungan RIS, BPIS, Bonga Pump #2 PIS, Nueva Era RIS, and TGIS)
which limits information on available flows; and canals/structures (see sample in Photos 4 to 6) are damaged which affects water delivery service (e.g. Victoria IA in MARIIS, MalMar 2, and Manupali RIS). On the other hand, the rehabilitation and installation of staff gauges is on-
going during the time of visit (June to August, 2018) in the NIS cases in Visayas and Mindanao.
Lack of information on canal flows poses a concern on the operational efficiency of the system since flows should be monitored to ensure that water delivered corresponds to what is required. In effect, the delivery performance ratio, an indicator which describes the actual over design
discharge cannot be assessed yet but needs to be determined to show the water delivery efficiency of the systems. In measurements conducted in AMRIS (see Annex E for details),
where main canal is supplied by the Ambuspa Pump, discharge was found to be 0.45 m³/s and at the downstream portion (lateral B Station 4 + 120), the discharge was estimated to be 0.31 m³/s. It can be seen that the flow from the main canal was reduced when diverted to the lateral.
Because rotation is practiced along the lateral, which results in the diversion of water from the main canal to a number of laterals, there is a reduction in flow. Furthermore, equal distribution
of water could not be achieved if irrigation structures were missing or damaged. During design stage, system performance considered was based from the design standards that
all canals were lined, and canal structures were in placed. However, after construction, most of the NIS in the country were actually completed if compared to the original design. Most of the
deviations were unlined canal and reduced area covered. Thus, it will result in the deviation between designed service area and actual irrigated area. Moreover, there were no interact ions between design and O&M engineers of irrigation system (David, 2004). Problems related to
design during operations were not properly conveyed to the designers. This is evident of the problems encountered by the NIS designed in the 1970s and designed in the early 2000s
encountered the same operational problems as canal seepage, siltation and lack of structures.

31 | P a g e
Photo 4. Control and division structures along Lateral B, Div. 2, MARIIS
Photo 5. Missing gates in MalMar 2 RIS.
Photo 6. Damaged headgates control lever of Lateral A of Manupali RIS.
Flooding problems also exist in most NIS (e.g. PDRIS, Magapit PIS, AMRIS, M’lang RIS,
MalMar 2, and Pulangui RIS) especially during wet season which limit cropping to dry season only and thus reduce the Cropping Intensity of the said NIS (see Annex C). Furthermore, drainage canals are lower than the river (e.g. Lal-lo IA in Magapit and TG 86 in TGIS) so
flooding problems exist especially during wet season since drainage canals cannot drain out the excess water.

32 | P a g e
Not only the NIS cases covered but also other gravity irrigation systems in the country are experiencing lack of irrigation water supply. Lack of water supply could be presented in the
point of view of NIA and in the point of view of IAs and farmers. But both acknowledged that lack of water supply is due to declining water intake from denuded watersheds of the irriga t ion
systems. The lack of water supply could be easily observed with difference between FUSA and actual irrigated area, especially during dry season. To close the gap, IMOs in some NIS were maximizing available water resources in the service areas. Example of these are construction
of re-use dam (see Photos 7 and 8), construction of intake dam, installation of open source pumps (re-pump), and installation of shallow tubewells (STW). Re-use dams could be observed
in UPRIIS, MARIIS, Balayungan RIS, Dumacaa RIS, Binahaan-Tibak RIS, Daguitan-Guinarona-Marabong RIS, Jalaur-Suague RIS, Barotac Viejo RIS, Padada RIS, M’lang RIS, Marbel #1 RIS, Banga RIS, and Pulangui RIS (see Annex C). Magapit PIS, PDRIS, UPRIIS
and MARIIS (see Annex C) have re-pump stations.
There is a need to reevaluate the definition of potential irrigable areas, including the assessment of water supply sources and comprehensive land use plans of the local government units. In estimating potential irrigable areas, improved data collection and management is necessary. In
all the feasibility studies of all the NIS in the country, data adequacy and quality are always the constraints to proper estimation of irrigable areas. Although soil texture and land suitability to
certain type of crops were being considered during design, reliable data in the field were however not collected. Science-based information hydrologic data should include smaller rivers and creeks. Water supply and water demand projections using new climate change
scenarios can be useful in identifying new and potential sites for irrigation development. Groundwater potential should be assessed by estimating recharge rates via water balance but
needs complete data sets on inflow outflow parameters.
Photo 7. Vaca Dam of Division 2, UPRIIS

33 | P a g e
Photo 8. Belisong #1 dam (re-use dam) of Lower Binahaan RIS.
On the other hand, in the point of view of IAs and farmers, the irrigation system should supply the required irrigation for the duration of the cropping. The lack of water supply would mean
using supplemental modes of irrigation. The most common supplemental mode of irrigation is pumping. Sources of water for pumping are irrigation and drainage canals, tubewells, lakes,
and nearby creeks and streams. Pumping from irrigation and drainage canals could be observed in BPIS, Solana and Magapit PIS (see Photo 9), UPRIIS, MARIIS, Libmanan-Cabusao PIS, Malinao IS, Binahaan-Tibak RIS, Sibalom-Tigbauan RIS (see Photo 10), Padada RIS, MalMar
2, and M’lang RIS (see Annex C for other systems). Although only a few STW were observed during the walk-throughs (see Photos 11 and 12), FGDs showed that STWs were being used in
some NIS cases. Based from groundwater potential maps in Annex C, service areas of PDRIS, BPIS, Bonga Pump #2 PIS, TASMORIS, some areas of UPRIIS and MARIIS, and Solana and Magapit PIS, Binahaan-Tibak RIS, Jalaur-Suague RIS, Barotac Viejo RIS, Padada RIS, M’lang
RIS, and Pulangui RIS are within shallow well potential areas. During dry season or periods of prolonged water shortage, alternate wetting and drying (AWD) approach is being practiced in
most of the irrigation systems covered. This is an example of deficit irrigation (DI) where water delivery is reduced to a level lower than discharge capacity or design discharge. However, to be effective, DI should be practiced in such a way that the reduction in water delivery should
not be lower than what is required by the crops to obtain optimum production. To achieve this, the concept of DI should be applied at different growth stages of crop growth which correspond
to different levels of water requirement. If this is adopted properly then optimum production and profit can be achieved.

34 | P a g e
Photo 9. A pump set extracting water from drainage canals in Magapit PIS
Photo 10. A pumpset installed along Main Canal, Sibalom-Tigbauan RIS (downstream section).

35 | P a g e
Photo 11. A pumpset installed in the service area of Jalaur RIS (downstream section).
Photo 12. A pumpset installed in the service area of Padada RIS.
Lack of policy or its weak implementation on illegal settlers (e.g. Camalap IA in Magapit PIS), dumping of garbage, and illegal pumping have caused both delivery and environmental issues.
In Div. 3 of UPRIIS, informal settlers along the canals pose solid waste problems. Garbage was observed in a section of lateral in AMRIS (Photo 13) and Pulangui RIS (Photo 14).
According to different IMO, different Resolutions were issued by LGUs concerned regarding waste disposal in the canals but to no avail. Other issues include poor water delivery scheduling and distribution (e.g. TGIS, Kadaklan Baldias IA in Nueva Era RIS, Cabusligan IA in BPIS,
New Life IA in Division 2 of MARIIS, and Kaps Ambayoan IA in Ambayoan RIS) and conflicts among users especially when upstream members block the path of water which
reduces the water supply for the downstream part. Illegal pumps also exist in some laterals (see

36 | P a g e
Photo 15) plus illegal diversion of water through KKB (“kanya kanyang butas”) along the canals (see Photo 16). It is however difficult to track down the violators since the improvised
holes are not visible when water is flowing deep.
There is inconsistent policy implementation on pumping irrigation water. In Luzon, pumping is strictly illegal in NIS service areas while some systems in Visayas and Mindanao allow pumping within the service areas. Malinao IS and M’lang RIS allow pumping at certain
schedules because the farm elevation is higher than the canal elevation.
Coordination between agencies will always be a problem but needs to be enhanced via a government program on integration and collaboration among related agencies. Specific laws or regulations are always needed for a certain agency to fully coordinate with another one. For
now, a Memorandum of Agreement specifying the roles and responsibilities of each agency and mechanics for coordination may be useful.
Photo 13. Garbage in gates of one section of Lateral B NMC, AMRIS

37 | P a g e
Photo 14. Section of South Main Canal of Pulangui RIS with floating debris trapped in a headgate.
Photo 15. Illegal pumping unit along MC of LTRIS, Division 2, UPRIIS

38 | P a g e
Photo 16. Illegal turn out along lateral of Caguray RIS
(Photo courtesy of Engr. Wilson Lopez)
Farmers are also resistant to change and new technology adoption and some are hesitant to pay ISF because of poor water service especially in the downstream part. In Bohol, Leyte and Iloilo, most IAs respondents have expressed satisfaction for the Free Irrigation structure especially
the farmers because they no longer have to pay the fees. In effect they can use the savings for other purposes. As members of the association, however, there are some minor fees that the
farmers have to pay such as management and association fees. For the IAs, they also have some incentives representing remuneration and canal clearing. But the IAs response in Jalaur, Iloilo seems to be different from the rest of the NIS in Visayas since some IAs are not quite satisfied
with the new policy of free irrigation. This is because even the main canal from the source has shortage of water due to siltation problem which is not being addressed due to lack of funds
and support from NIA. This is also true in Mambusao RIS where some IAs are complaining that laterals (e.g. Lateral C) are only partially operational and some canals are lower than the field so small check dams are built, which usually overflow.
For the governance of NIS, IAs have varying response with regard to the impact of free
irrigation. Although the IAs receive some incentives in lieu of ISF (e.g. management and association fees), some IAs complain that the incentives cannot fully cover the maintenance costs, especially those involving major repairs or rehabilitation. The O&M compensation of
PhP150 per hectare and canal clearing support of PhP250 pesos per km (lined) and PhP500 pesos per km (unlined) are not enough especially for Mambusao RIS and Jalaur RIS since
laterals have become nonfunctional and main canal has been almost fully silted resulting in reduced discharge capacities and water delivery. These NIS have reported that there was no improvement in system performance when free irrigation was introduced in 2017.
Many farmers are still traditional and don’t follow cropping calendar, as in the case of VSPC
IA in BPIS. In fact, the Manupali RIS has no cropping calendar. The system will implement a cropping calendar this coming 2019 only.

39 | P a g e
Some IAs encountered illegal opening and closing of gates. This could be observed in the field wherein
locks and security gates where installed to prevent illegal gate control (see sample in Photos 17 and
18).
Photo 17. Check gate with padlocks in Libmanan-Cabusao PIS
Photo 18. Section of Lateral C of Bayongan IS.
Take note of the chains with padlock on the turning mechanism of the gates.

40 | P a g e
Farm to market roads are also in poor condition in some IAs (e.g. New Life IA in MARIIS, Dagupan IA in Visitacion IS, Ambayoan-Dipalo RIS, and Balayungan RIS) and are not passable, especially during wet season.
On the environmental aspect, focusing on the determination of irrigation water quality such as
pH, dissolved oxygen (DO), and electrical conductivity (EC) in main canals and laterals using water quality kits, it was found that most of the NIS main canal and laterals exhibited reasonably good water quality as reflected <300 uS/cm (EC), and > 6 ppm ( DO). Most NIS
cases showed pH levels on the alkaline side (> 7) which can be attributed to excess sodium, and can therefore lead to sodicity problem in the future and pose serious problem on water
quality especially if this is combined with high salinity levels. In fact some NIS cases (especially those pumping ground water like TGIS) and due to sea water intrusion (e.g. Magapit PIS), salinity is a problem (i.e. EC is > 300uS/cm) which can pose serious effects on crop
development and yield if not properly addressed. Another important water quality indicator which affects photosynthesis and thus biomass production is DO which was found to be low
(i.e. 6 < ppm) in some NIS cases (e.g. downstream of Vaca dam and PDRIS end of downstream. This can be attributed to the thick aquatic vegetation just upstream of the Vaca dam which has caused the reduction of DO downstream. DO is very important in photosynthesis, which is
responsible for biomass production. The effect of poor water quality, especially on crop productivity has not been established yet since data on yield of the different NIS cases visited
are not yet available. DO which was found to be low (i.e. 6 < ppm) in some NIS cases (e.g. Capayas and Bayongan
IS, Binahaan-Tibak and Daguitan-Guinarona-Marabong RIS). Seven (7) sites in Capayas and Bayongan IS have shown low pH (<5) and low DO (around 4.5 ppm) indicating that it is acidic
and is lacking in dissolved oxygen. All 12 sites in Leyte NIS have shown very low DO (around 1.5 ppm) indicating that it is deficient in dissolved oxygen. Normally, the DO increases going upstream since water in the source have less pollution. Some cases have different findings such
as measurements in re-use dams which have more pollution. Although there was no measurement of this parameter in Iloilo NIS sites, there are some measurements in the other
provinces. DO was found to be low (i.e. 6 < ppm) in some NIS cases such as 6/14 sites in Bukidnon, 8/12 sites in South Cotabato, and MalMar 2, 3/6 in M’lang and Padada RIS.
Some factors which affect the DO level are: a) the overabundance of organic matter like dead algae where aquatic aerobic bacteria can grow rapidly and consume oxygen during respiration,
which decreases the amount of dissolved oxygen in watersheds; b) the low atmospheric pressure found at higher altitudes which slightly decreases the solubility of dissolved oxygen; and c) the mixing of air and water caused by swiftly flowing water over rocks, by wind, or
thermal upwelling, which increases dissolved oxygen concentrations in a process called aeration. A body of water that is very stagnant may result in very low dissolved oxygen
concentration. This was the case in Vaca dam where thick aquatic vegetation has reduced DO level as was reflected in the reading of only 1.1 ppm in the main canal downstream of the intake gate.
The EC, which reflects the salinity level of the irrigation water, ranged from 130 to 300uS/cm
which is quite acceptable for crops (e.g. rice). There was only one case (in TGIS Tarlac) where EC was high (around 700 uS/cm). This can be attributed to the source of water, which is ground water pumping. Ground water is usually saline due to sea water intrusion or leaching of salts
from irrigated lands. Another problem case with respect to salinity is the Magapit PIS in

41 | P a g e
Cagayan. During walkthroughs, it was observed that some areas are problematic (stunted crop growth) due to salinity problem because of the tidal intrusion of sea water caused by the
collapse of dikes protecting the irrigated areas. Although the EC meter was not working during the visit, observations were verified by the guide (Engr. Laureo C. Bulseco) who attested that
there was problem in crop development in areas near the collapsed dike due to high levels of salinity.
For the pH, which describes the acidity or alkalinity of the irrigation water, it was found that most of the NIS sampled showed pH values greater than 7 which is above neutral and
considered alkaline. Alkalinity reflects the sodium content of irrigation water where high values can be hazardous to crops. Soil moisture with pH < 4 is called very acid and with pH > 10 very alkaline. The causes of soil alkalinity can be natural or man-made. The natural cause
is the presence of soil minerals producing sodium carbonate upon weathering. The man-made cause is the application of irrigation water (surface or ground water) containing a relative ly
high proportion of sodium bicarbonates (Oosterbaan, 2003). Most NIS cases in Visayas and Mindanao also showed pH levels on the alkaline side (> 7)
which can be attributed to excess sodium, and can therefore lead to sodicity problem in the future and pose serious problem on water quality, especially if this is combined with high
salinity levels. Most NIS cases in Iloilo showed pH levels on the alkaline side where 14 of 22 samples showed pH > 7. This was especially evident in all Jalaur RIS measurements (9 locations) where pH was greater than 7 and EC was greater than 300 uS/cm in 3 out of 10
locations. Salinity as reflected by high EC (i.e. >300uS/cm) was also a problem in all Sibalom-Tigbauan RIS sites where all 5 measured values from laterals, main canals, turnouts showed
values greater than 400uS/cm and 2 out of 4 locations showed high pH. Salinity is a problem (i.e. EC is >) which can pose serious effects on crop development and yield if not properly addressed.
The DO level and pH of the water in a rice field are positively correlated. Both pH and DO
levels are lowered during the time when respiration dominates and depending on the alkalinity (or buffering capacity) of the water, the diurnal variations can range from zero DO to super-saturation and from acidic to highly alkaline (pH>9.5) waters during times of algal blooms
(Roger, 1996). Zhi (2000) also showed the relation between the dissolved oxygen in soil water and the days of submergence of deepwater rice. The results indicated that the days of
submergence increased from 1 to 5 days when DO levels (mg/L) decreased from 7.8 to 0.6. But there was limited time to measure the diurnal and seasonal variations in DO (as a function of temperature, salinity, water depth, aeration, photosynthesis, respiration and decomposit ion)
so its effect on yield cannot be established in this project.

42 | P a g e
Photo 19. Water quality measurement in paddy
Photo 20. Water quality measurement upstream of Parshall flume

43 | P a g e
Photo 21. Water quality measurement in a Lateral (Marbel #1 RIS).
Studies have shown that there was reduction in rice yield of about 0.57 – 0.75 tons per hectare per crop due to water pollution (Huynh and Yabe, 2012). Results seem to confirm this finding
since some NIS sites in Visayas and Mindanao with high EC and pH and low DO could have also caused the low yield in those sites where rice yield have ranged from 70 to 100 cavans per
hectare compared to other sites with high production (i.e. 150 cavan per ha) (see Table 10). For instance, in Barotac Viejo and Sibalom-Tigbauan RIS sites in Iloilo, yield was as low as 70 and 100 cavans per hectare, respectively, during first cropping due to high EC (> 400) and high
pH (> 7). This was also true in Padada RIS and Marbel #1 RIS where yield was only 110 and 80 cavans per hectare respectively and this can be due to the effect of high EC and pH and low
DO (<6ppm). Other systems with low yield are: CASANDEL IA and Merced Carmelo IA in Barotac Viejo RIS with 50 and 70 cavans respectively, TATAG IA, PAMPBU AND GUINTTU IA in Mambusao RIS with 40, 45, and 70 cavans respectively, Balatikan IA in
Mlang with 80 cavans, Rice Field IA, Pagbidaet-Malipayon Center IA and CABUMADU IA in Marbel #1 RIS with 80 cavans, all downstream of Banga RIS with 70-80 cavans and
Sinayawan Lat G6 IA in Pulangui RIS with 80 cavans. These systems also reflect low water quality in terms of one or two of the water quality parameters.
It can be seen from Table 10 that Visayas IAs seem to perform better than IAs in Luzon and Mindanao where 23% and 77% of IAs in Visayas got yield of <100 and >100 cavans per ha,
respectively during the 1st cropping. In the 2nd cropping, similar trend was observed where Visayas got 30% <100 and 70% >100 cavans per ha. Mindanao productivity even got lower during 2nd cropping where <100 cavans per ha was 55% compared to only 45% >100 cavans
per ha. This consistent performance in production of IAs in Visayas can be attributed to a number of factors foremost of which is the availability of water due to the lining of canals from
upstream to downstream (e.g. Bohol) so bank erosion and water losses due to seepage and percolation are controlled compared to those earth canals (unlined) in other systems. Looking at the effect of water quality on yield, it appears that those IAs that meet the threshold values
for pH, DO and EC seem to have better yield. The water quality of different NIS was presented in Table 11 where environmental factors as reflected in the 3 water quality parameters are
shown. Those NIS with low water quality seem to also have lower yield and this is consistent

44 | P a g e
with data found in literature where water quality reduces yield by 0.57 to 0.75 tons/ha or equivalent to 11.4 to 15 cavans per ha.
But there are other factors that can cause low yield other than poor water quality such as lack
of inputs (fertilizer and water) and crop and soil management which has to be verified with more data.
Table 10. Summary of IAs productivity (yield in cavans per ha) in Luzon, Visayas, and
Mindanao
Province 1st cropping (cavans/ha) 2nd cropping (cavans/ha)
<40 41-64 65-99 >100 Ave <40 41-64 65-99 >100 Ave
Luzon
Quezon 0 0 3 0 87.00 0 0 2 1 90.00
Cavite 0 0 3 0 80.00 0 1 2 0 68.33
Ilocos Norte 0 0 2 1 90.00 0 0 2 1 106.67
Ilocos Sur 0 0 1 3 97.50 0 0 0 4 135.00
Pampanga 0 0 2 2 87.50 0 1 2 2 80.00
Isabela 0 0 0 9 131.11 0 0 1 8 112.78
Nueva Ecija 0 0 1 7 120.00 0 0 6 2 95.00
Bulacan 0 0 1 1 119.00 0 0 0 2 110.00
Cagayan 0 0 3 6 123.89 0 2 1 5 90.63
Occidental Mindoro 0 0 1 2 103.33 1 1 1 0 60.00
Pangasinan 1 0 2 2 91.60 0 1 2 1 80.00
Tarlac 0 0 1 2 106.67 0 0 0 3 130.00
Camarines Sur 0 0 2 1 86.67 0 1 2 0 76.67 Total no. of IA's 1 0 22 36 101.87 1 7 21 29 95.01
% 1.69 0.00 37.29 61.02 1.72 12.07 36.21 50.00
Visayas
Bohol 0 0 9 5 94.71 0 0 6 8 100.71
Leyte 0 0 5 7 101.07 0 0 10 2 90.81
Iloilo 0 0 12 5 93.61 0 1 12 4 85.68
Capiz 0 3 2 0 63.80 0 1 2 0 63.79
Total no. of IA's 0 3 28 17 88.30 0 2 30 14 85.25
% 0.00 6.25 58.33 35.42 0.00 4.35 65.22 30.43
Mindanao
Davao del Sur 0 0 0 5 132.00 0 0 0 5 129.60
North Cotabato 0 0 2 4 103.20 0 0 2 4 104.27
South Cotabato 0 0 3 9 106.23 0 0 7 4 96.57

45 | P a g e
Province 1st cropping (cavans/ha) 2nd cropping (cavans/ha)
<40 41-64 65-99 >100 Ave <40 41-64 65-99 >100 Ave
Maguindanao 0 0 2 0 91.80 0 0 1 1 109.80
Bukidnon 0 0 7 7 118.79 0 0 6 8 111.38 Total no. of IA's 0 0 14 25 110.40 0 0 16 22 110.32
% 0.00 0.00 35.90 64.10 0.00 0.00 42.11 57.89
Table 11. Summary of the technical, institutional and environmental issues in the National
Irrigation Systems in the Philippines
Technical Issues Institutional Issues Environmental Issues
Pampanga Most laterals are earth canals
Experienced pest infestation in 2013 due to 5 in 2
Water quality measurements or information are lacking in all NIS cases visited.
There is double pumping of water from drainage (Pump operating cost is P3000 per ha
Farmers only get break-even thus cannot pay the ISF
Water quality parameters such as dissolved oxygen (DO), electrical conductivity (EC), and pH are measured in the field to determine the quality of water in the main canals, laterals, and paddies. Acceptable values for these indicators are 6 to 7 (pH), <300 uS/cm (EC), and > 6 ppm (DO) (see Tables below for details).
Need to improve irrigation facilities (e.g. turnout gates)
Conflict arises due to difficulty in convincing other members to pay the ISF
Measured water quality in the downstream part of PIDRIS showed low DO levels of 2.7 ppm.
Rehabilitation of damaged canals
NIA has no adequate funds for major repair and rehabilitation
pH values are greater than 7 which is above neutral and considered alkaline.
Main canal of PDRIS is already highly silted, around 40%, due to lahar
Reshuffling of management affects prioritization of programs which leads to delay or cancellation
However the other parameters like EC is not a concern.
Silt levels were measured to be around 10 cm- 41 cm
Conflict arises due to difficulty in convincing other members to pay the ISF
Illegal pumping and garbage dumping

46 | P a g e
Technical Issues Institutional Issues Environmental Issues
Nueva Ecija Target improvements are: to restore approximately 100 hectares in addition; modify check structures; improve canal linings to reduce losses
Previously, support from NIA is very good. However, it drastically decreased as of 2006 because of cost cutting measures followed by RAT Plan
The lateral downstream of Vacca Dam exhibited very low DO of 1.1 ppm. This can be attributed to the thick aquatic vegetation just upstream of the Vacca dam which caused the low DO downstream.
Some members use surface pumps which increases their cost from P3000 – P5000 (per ha)
Usual conflict is due to distribution of water
pH values are greater than 7 which is above neutral and considered alkaline
LTRIS dam damaged due to typhoon Mario
High prevailing prices of inputs while selling prices of harvest is low
However the other parameters like EC is not a concern.
Farmers experience delay and occasional shortage of water
Institutional Issues Environmental Issues
Earth canals are very prone to damage and siltation
Weak policy enforcement on informal settlers
No water quality data since measurement or water quality monitoring is not done.
Declining water supply due to heavy siltation of Peñaranda river
Initially, the IA constructed brush dams in order to store water. However, due to a dike construction by the DPWH, the water that flows to the brush dam and eventually to the canal is blocked.
Measured pH values are greater than 7 which is above neutral and considered alkaline.
Heavy siltation is due to poor watershed management
However the other parameters like EC and DO are not a concern.
Water source is too far (Pantabangan dam), thus even if the dam is full, water has to travel a very long distance before it reaches the division
No water quality data since measurement or water quality monitoring is not done
Highly recommend to continue the proposed Balintingol dam where it could store water near Division 4 area
Informal settlers along the canal is a
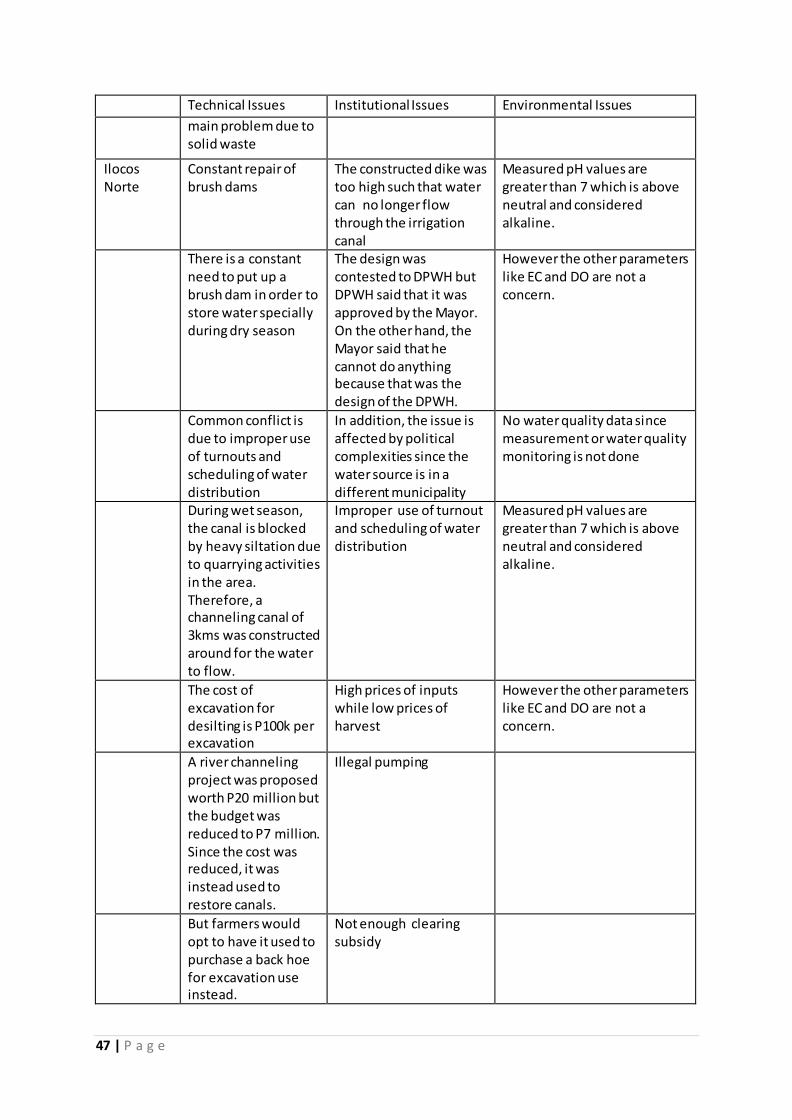
47 | P a g e
Technical Issues Institutional Issues Environmental Issues
main problem due to solid waste
Ilocos Norte
Constant repair of brush dams
The constructed dike was too high such that water can no longer flow through the irrigation canal
Measured pH values are greater than 7 which is above neutral and considered alkaline.
There is a constant need to put up a brush dam in order to store water specially during dry season
The design was contested to DPWH but DPWH said that it was approved by the Mayor. On the other hand, the Mayor said that he cannot do anything because that was the design of the DPWH.
However the other parameters like EC and DO are not a concern.
Common conflict is due to improper use of turnouts and scheduling of water distribution
In addition, the issue is affected by political complexities since the water source is in a different municipality
No water quality data since measurement or water quality monitoring is not done
During wet season, the canal is blocked by heavy siltation due to quarrying activities in the area. Therefore, a channeling canal of 3kms was constructed around for the water to flow.
Improper use of turnout and scheduling of water distribution
Measured pH values are greater than 7 which is above neutral and considered alkaline.
The cost of excavation for desilting is P100k per excavation
High prices of inputs while low prices of harvest
However the other parameters like EC and DO are not a concern.
A river channeling project was proposed worth P20 million but the budget was reduced to P7 million. Since the cost was reduced, it was instead used to restore canals.
Illegal pumping
But farmers would opt to have it used to purchase a back hoe for excavation use instead.
Not enough clearing subsidy

48 | P a g e
Technical Issues Institutional Issues Environmental Issues Dilapidation of canals and turnouts are also aggravated by the heavy siltation from the river
No water during scheduled delivery
The heavy siltation is due to quarrying
Stealing of water
Lack of irrigation facilities
Slow rehabilitation of damaged canals
Unfinished structures
Use of pump because canal elevation is lower than the farm elevation
Capiz Lack of farm machineries
High cost of farm inputs, Low cost of rice product
3 out 5 sites in Mambusao, Capiz NIS have high pH (>7) which indicates that the water is quite alkaline. But the EC reading is ard 160 uS/cm which is OK. There was no reading of DO in Mambusao.
Need to improve irrigation facilities
High cost of fertilizer and labor
Bohol Slow rehabilitation of damaged canals and FMR
Illegal pumping and garbage dumping
7 sites in Capayas and Bayongan, Bohol NIS have shown low pH (<5) and low DO (ard 4.5ppm) indicating that it is acidic and is lacking in dissolved oxygen. But EC is ard 200 uS/cm which is OK in terms of salinity level.
Lateral C is partially filled with stones
Less than 100% collection efficiency of Annual Dues
Abandoned area (reuse point)
High cost of farm inputs, low cost of rice product
Lack of manpower in canal cleaning
No water during dry season
Stealing of water and illegal check structures
Lack of postharvest facilities
Need for dam heightening

49 | P a g e
Technical Issues Institutional Issues Environmental Issues
Leyte Slow rehabilitation of damaged canals and farm to market roads (FMRs)
Not enough water for the whole system
12 out of 12 sites in Binahaan and Daguitan Leyte NIS have shown very low DO (ard 1.5ppm) indicating that it is deficient in dissolved oxygen. But EC is around 200 uS/cm which is OK in terms of salinity level and pH is ard 6 which is on the neutral side.
Needs farm machineries for canal cleaning and postharvest activities
Stealing of water
Siltation of canals Delayed water delivery
High cost of farm input, low cost of rice product
High labor cost
Infestation (Stem borers and rats)
Iloilo Need to improve irrigation facilities
High cost of farm inputs, low cost of product
Most NIS cases in Iloilo showed pH levels on the alkaline side where 14 of 22 samples showed pH > 7. This was especially evident in all Jalaur measurements (9 locations) where pH was greater than 7 and EC was greater than 300 uS/cm in 3 out of 10 locations.
Slow rehabilitation of damaged canals and demolished structures
Stealing of steel gates Salinity as reflected by high EC (i.e. >300uS/cm) was also a problem in all Sibalom-Tigbauan sites where all 5 measured values from laterals, main canals, turnouts showed values greater than 400uS/cm and 2 out of 4 locations showed high pH (>7).
Needs drainage structures
Drainage outlet draining into the canal
Silted canals Shortage of water
Delayed water delivery
Illegal turnouts
Davao del Sur
Many portion of the canal system are unlined
High cost of farm input, low cost of palay
DO is <6ppm, EC > 300 uS/cm and pH >7 in 4 out 5 NIS sites in Padada Davao del Sur, which are indicative of the low quality of water in the area.
Damaged steel gates High cost of fertilizer

50 | P a g e
Technical Issues Institutional Issues Environmental Issues
Members are not paying the Association Sustainable Dues
North Cotabato
Low subsidy; Not all IAs have offices
4 out of 6 sites in M’lang North Cotabato have DO <6ppm, 3 out 6 sites have pH >7 which means that some sites in the area have low water quality in relation to these indicators. However, EC <200uS/cm for all 6 sites which indicates that salinity is not a problem in the area.
Slow repair and rehabilitation of farm to market roads (FMRs)
Water shortage In Malmar RIS, 2 out 2 sites have pH> 7 and DO < 6ppm indicating low water quality. However, EC is OK since it’s around 150 uS/cm for the two sites.
Needs new heavy equipment
Flooding in low-lying areas
Unfinished lining of canals
Delayed water delivery
South Cotabato
Silted canals Delayed response on reports of water stealing and damaging of structures
12 out of 12 NIS sites in Marbel and Banga South Cotabato have pH >7, 8 out of 12 have DO <6 ppm which indicates low water quality in most sites in South Cotabato. However only 2 out 12 sites have EC > 300 uS/cm which are located in downstream part of Marbel sites
Need back hoe for cleaning
Contaminated water
Unfinished lining of the canals
Water shortage
Unfinished construction of supplementary dams
Presence of debris
Difficulty in collecting O&M dues
High cost of inputs, low price of products
Lack of government support

51 | P a g e
Technical Issues Institutional Issues Environmental Issues
Bukidnon Too much water distribution losses especially in unlined canals
Lack of funds and subsidy 13 out of 14 sites in Pulangui, Roxas Kuya, and Manupali Bukidnon NIS have pH > 7 and 6 out of 14 sites have DO < 6ppm which indicate low water quality. However, EC is around 100 uS/cm which shows that salinity is not a problem in the area.
Needs back hoe for desilting
No action on requests for repair and rehabilitation
Pest infestation that lowers the farm output
Slow repair and rehabilitation of irrigation structures
Lack of water in downstream areas
Flooding and siltation especially during wet season
Rapid land conversion from farmland to residential
Most IA members do not cooperate on meetings and activities
High cost of farm inputs and low price of products
Source: Authors’ compilation
Although this section only covers UPRIIS and MARIIS (Luzon); Malinao IS and Jalaur -
Suague RIS (Visayas); and Padada RIS and Marbel #1 RIS (Mindanao), other discussions with
corresponding maps, photos figures and tables are presented in Annex C.
5.1.1. Upper Pampanga River Integrated Irrigation System (UPRIIS)
Three divisions of UPRIIS (2, 3 and 4) were visited. Siltation problems (see Photo 22) exist across all sections of the canal network which again points to the technical deficiency in the
maintenance of the canal network. This is even worst in unlined canals which are eroded and damaged by uncontrolled animals frequenting the sides of the canals. As observed in other NIS, similar concerns exist such as lack of staff gauges to measure flow, siltation of canal up to
lateral level, illegal pumping, garbage dumping in canals due to illegal settlers (Photo 23) and lack of maintenance were also observed in UPRIIS. Water shortage is expected to occur during
El Nino this year. Another major issue is the collapse of LTRIS dam (see Photo 24) due to typhoon Mario in 2014.

52 | P a g e
Photo 22. Silted MC of LTRIS, Division 2, UPRIIS
Photo 23. Direct household refuse into MC of Division 4, UPRIIS

53 | P a g e
Photo 24. LTRIS dam damaged due to Typhoon Mario
UPRIIS was able to irrigate at most 114,000 hectares, however due to the declining water this is now reduced to around 86,000 hectares (Table 12). Some notable issues of UPRIIS were the
declining water supply due to El Nino and prolonged drought. Reduction of irrigated area was due to declining inflow in Pantabangan dam and other intakes. As shown in the cropping
intensity in the last ten years, there were years that it reaches to near 200%. To maximize water, re-use dams were constructed like the one visited Vaca dam (Division II) and Campana dam (Division IV). Moreover, some farmers are using LLPs and STWs (Photo 25) to supplement
irrigation during low water supply.
Table 12. FUSA, programmed and total irrigated area of UPRIIS for 2014 Dry Season
DIVISION FIRMED-UP SERVICE AREA, ha.
PROGRAMMED AREA, ha.
TOTAL IRRIGATED, ha
I 20,651.71 15,475.54 11,051.00
II 23,190.96 18,033.02 18,033.00 III 32,970.11 24,065.00 24,065.00
IV 24,977.00 14,864.00 14,889.00 V 15,291.00 11,549.16 9,409.00
CMIPP II 2,559.00 1,871.00 1,114.00
UPRIIS 119,639.78 85,857.72 78,560.00 Percentage Accomplishment, % 91.50
(Source: UPRIIS Briefer 2015) (As of January 15, 2015)
Heavy siltation could be observed especially in the mid and downstream area of UPRIIS. In
the soil erosion map shown in Figure 5, moderate to severe erosion could be observed in the watershed area of UPRIIS. Watershed area is the upper and right side part of Figure 5. Other than watershed as silt source, siltation may be due also to erosion of unlined canal (Table 13)
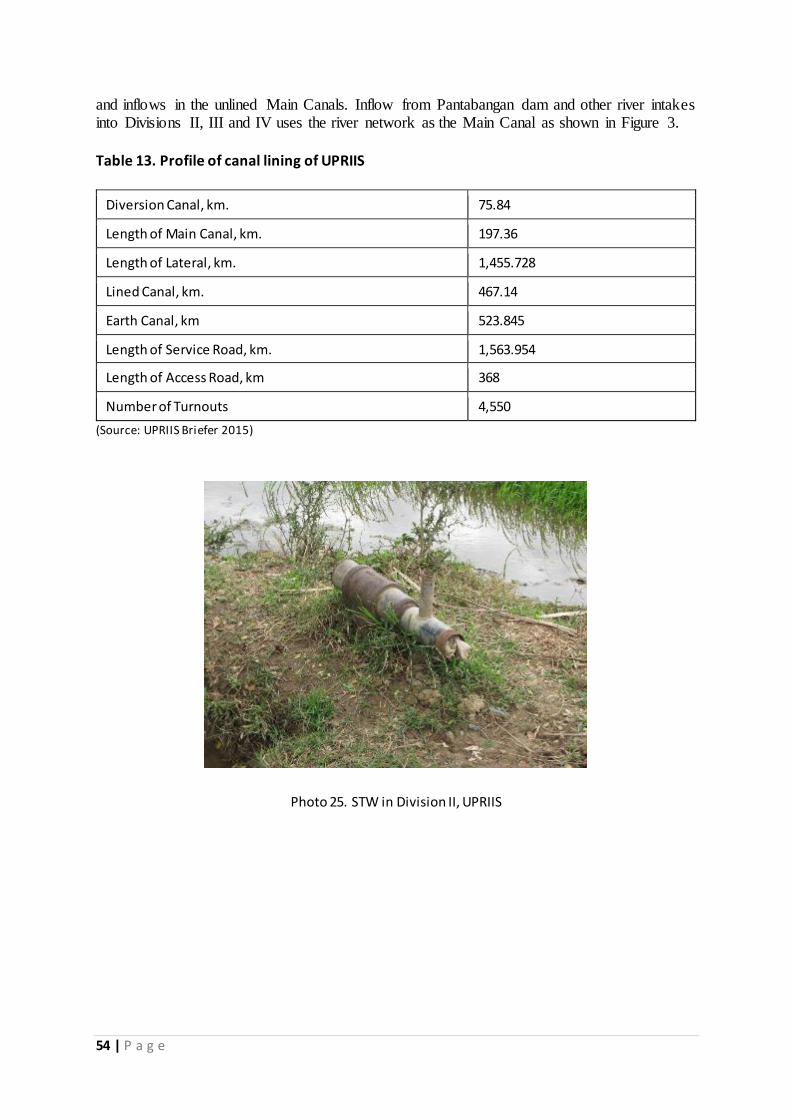
54 | P a g e
and inflows in the unlined Main Canals. Inflow from Pantabangan dam and other river intakes into Divisions II, III and IV uses the river network as the Main Canal as shown in Figure 3.
Table 13. Profile of canal lining of UPRIIS
Diversion Canal, km. 75.84
Length of Main Canal, km. 197.36
Length of Lateral, km. 1,455.728
Lined Canal, km. 467.14
Earth Canal, km 523.845
Length of Service Road, km. 1,563.954
Length of Access Road, km 368
Number of Turnouts 4,550
(Source: UPRIIS Briefer 2015)
Photo 25. STW in Division II, UPRIIS

55 | P a g e
Figure 3. Irrigated area of the different Divisions of UPRIIS
The DEM map, soil erosion map, slope map, built-up area map and overlaid maps of UPRIIS are shown in Figures 4 to 12. The overlaid maps show the reduction in service area in terms
of the different component maps. The overlaid maps show the reduction in service area in terms of the different component maps. From the Erosion Map, the delineated FUSA was overlaid to determine the erodibility of the soil within the FUSA as shown in Figure 6. These show
reduction in FUSA by 3% in terms of the erodibility of the soil alone. In Figure 7, the Map of Major Built-up areas are shown as digitized from Google Earth image (as of 2015).
The slope derived from remotely sensed DEM image is cropped by the delineated FUSA and are shown in Figure 9 after which the slopes of 0%-3% and 3%-8% were chosen to be desirable
and are presented in Figure 10. The resulting maps show a reduction in service area by 0%.
The soil type map from BSWM Reconnaissance Survey obtained by DA-BAR was incorporated in the FUSA and is shown in Figure 10 with maps showing the desirable soil type (done by removing the sandy soils) which show a reduction in service area by 17%.
Using these 4 individual maps (erosion, slope, soil type, and built-up areas) with values
showing desirable vs undesirable properties, they were overlaid using the Map Algebra function of GIS incorporating the 'Boolean' algebra, this resulted to final overlaid maps as shown in Figures 11 and 12. The reduction in the service area is 25%. This result just implies
Pantabangan Dam
Masiway Dam
Rizal Dam
Digmala River
Coronel River

56 | P a g e
that only 75% of the total FUSA for UPRIIS is just available for farming which may result to optimum yield given a favorable condition. But this doesn't imply that you can no longer use
the undesirable FUSA. This may just help to explain why some farmers obtain unfavorab le crop yields. Moreover, the resulting maps and reduction values may be subjected to accuracy
and reliability of the obtained secondary data.
Figure 4. DEM Map of UPRIIS, Nueva Ecija
Sources: NAMRIA; NIA; DA BAR Metadata

57 | P a g e
Figure 5. Soil erosion map of UPRIIS, Nueva Ecija
Sources: NAMRIA; NIA; DA BAR Metadata

58 | P a g e
Figure 6. Overlaid map of UPRIIS, Nueva Ecija showing reduction in service area in terms of erodibility of soil
Sources: NAMRIA; NIA; DA BAR Metadata

59 | P a g e
Figure 7. Built-up area map of UPRIIS, Nueva Ecija
Sources: NAMRIA; NIA; DA BAR Metadata

60 | P a g e
Figure 8. Slope map of UPRIIS, Nueva Ecija
Sources: NAMRIA; NIA; DA BAR Metadata

61 | P a g e
Figure 9. Overlaid map of UPRIIS, Nueva Ecija showing reduction in service area in terms of desirable slope
Sources: NAMRIA; NIA; DA BAR Metadata

62 | P a g e
Figure 10. Soil map of UPRIIS, Nueva Ecija
Sources: NAMRIA; NIA; DA BAR Metadata

63 | P a g e
Figure 11. Overlaid map of UPRIIS, Nueva Ecija showing reduction in service area in terms of desirable soil
Sources: NAMRIA; NIA; DA BAR Metadata

64 | P a g e
Figure 12. Overlaid map of UPRIIS, Nueva Ecija showing reduction in service area
Sources: NAMRIA; NIA; DA BAR Metadata

65 | P a g e
Table 14. Performance indicators for UPRIIS
*No or lacking parameter data for Division II and III
(Source: NUWAM Project)
Figure 13 shows the actual NIS walkthroughs for the three divisions (II, III, and IV) of UPRIIS. Location of NIA UPRIIS Division II office as well as the Vaca dam and office of Lower Talavera Irrigation System together with different canal structures with corresponding
coordinates of flow and water quality measurements can be seen at the upper portion of the map. At the middle portion are the locations of Pampanga-Bongabon River Irrigation System
of Division III together with its different laterals (D, E, F, and F1). The location of water quality and flow measurements can also be seen in this location. The lower portion of the map shows the structures that can be seen in the Division IV of UPRIIS. Downstream portion of Laterals
E and F as well as laterals D4 and D5, and Campana Dam’s laterals D7 and D8 can be seen at this portion. Water quality and flow measurements were also done in this location as can be
seen in the map.
PERFORMANCE
INDICATORS
DIVISION I
(9-year data) DIVISION IV
(5-year data) DIVISION V
(5-year data)
Dry
Season
Wet
Season
Dry
Season
Wet
Season
Dry
Season
Wet
Season
Relative Water Supply
[RWS]1
( m3/ m
3)
1.26 1.23 1.09 3.06 1.27 2.20
Irrigated Area
Performance [F]2(%)
81.61 86.10 96.8 86.5 80.7 78.6
Gross Irrigation Water
Quota [M]3
( m3/Ha)
15,380 6,578 10,672 13,339 17,102 8,339
Yield Per Unit Area [Y]4
( kg/Ha) 5,680 3,778 4,397 3,845 6,730 4,710
Yield per unit Quantity
of Irrigation water [Yw]5
( kg/ m3)
0.37 0.57 0.47 0.32 0.40 0.61

66 | P a g e
Figure 13. Location of NIA office and NIS Structures in UPRIIS, Nueva Ecija
Sources: NAMRIA; NIA; DA BAR Metadata
5.1.2. Magat River Integrated Irrigation System (MARIIS)
In this system, the team has taken into consideration Division 2 and Division 4. For the Divis ion 2, earth canals were observed to be damaged by carabaos when they dip in the water. This eventually causes siltation. Actually, the main source of siltation is the watershed. In the soil
erosion map shown in Figure 15, moderate to severe erosion could be observed in the watershed area of MARIIS. Watershed area is the left and lower side part of Figure. Earth canals were
also eroded by water flow (Photo 26). Lateral canals need to be rehabilitated. Earth canals (Photo 27) have to be lined. In MARIIS, the main canal has a length of 381 km while the total

67 | P a g e
length of laterals and sub-laterals is 1,114 km. Not only the canals need rehabilitation but also the structures. Photos 28 to 30 show the current state of the structures in MARIIS. Most of the
structures are damaged and deteriorating. The headgates in MARIIS is about 380 while the turnouts total to about 4,329.
The FUSA of MARIIS is about 85,731 has. The performance of MARIIS is presented in Tables 15 and 16. The performance of MARIIS-Division II is presented in Table 17. To improve the
performance of the system, MARIIS is maximizing the available water resources by install ing re-use dams (Photos 31 and 32) and pumping stations. Pumping stations in MARIIS includes
MARIIS DIV IV PUMP 1 (No. of Pump units = 3; Pump Capacity = 69 cu.m./min; Service Area = 661 has); MARIIS DIV III PUMP 2 (No. of Pump units = 5; Pump Capacity = 199.2 cu.m./min; Service Area = 2,704 has); and MARIIS DIV III PUMP 3 (No. of Pump units = 5;
Pump Capacity = 88.8 cu.m./min; Service Area = 2,885 has).
Another notable observation in MARIIS is the installation of a hydro power plant (Photo 33) along Lateral B, Division II, and MARIIS. Feasibility studies for the installation of hydro power plant in other Laterals of MARIIS as well as in UPRIIS are being prepared.
Table 15. Irrigated area of MARIIS from 2010 to 2014
Source: MARIIS, 2015
Table 16. Performance of MARIIS from 1999 to 2014
Source: MARIIS, 2015
Table 17. Performance of Division II, MARIIS from 2009 to 2014
CALENDAR CROPPING IRRIGATED BENEFITED C.I. V.I. C.E. AVE.
YIELD
YEAR SEASON AREA (ha.) AREA (ha.) (%) (%) (%) (cav./ha.)
2014 Dry 23,560 22,505
195 1.71 93 116
Wet 23,568 22,431 110

68 | P a g e
CALENDAR CROPPING IRRIGATED BENEFITED C.I. V.I. C.E. AVE.
YIELD
YEAR SEASON AREA (ha.) AREA (ha.) (%) (%) (%) (cav./ha.)
2013 Dry 23,149 23,038
194 1.62 89 110
Wet 23,258 23,065 109
2012 Dry 23,105 23,105
193 1.28 87 111
Wet 23,105 23,105 109
2011 Dry 23,118 22,678
195 1.39 73 112
Wet 23,118 16,622 82
2010 Dry 22,676 13,807
200 1.03 86 75
Wet 22,812 13,118 110
2009 Dry 22,474 22,474
198 2.15 81 95
Wet 22,474 21,390 87
Photo 26. Unlined section of Lateral B, Div. 2, MARIIS with damages from erosion

69 | P a g e
Photo 27. Unlined canal of Lateral B, Division II, MARIIS
Photo 28. Damaged structures along Lateral D2, Div.4, MARIIS

70 | P a g e
Photo 29. Damaged canal and turnout in a section Lateral Dw-D, Div.4, MARIIS.
Take note that the Lateral was unlined
Photo 30. Control and division structures along Lateral B, Div.2, MARIIS.
Take note of the damages and condition of the canal and structures.

71 | P a g e
Photo 31. Check gate of Palomares Diversion Dam.
One of the re-use dam in Div. 2, MARIIS.
Photo 32. Main canal of Nungnungan Dam (re-use dam), Div.4, MARIIS.

72 | P a g e
Photo 33. Mini-hydro power plant (45kW) along Lateral B, Div. 2, MARIIS.
The DEM map, soil erosion map, slope map, built-up area map and overlaid maps of MARIIS are shown in Figures 14 to 22. The overlaid maps show the reduction in service area in terms
of the different component maps. The overlaid maps show the reduction in service area in terms of the different component maps. From the Erosion Map, the delineated FUSA was overlaid to
determine the erodibility of the soil within the FUSA. These show reduction in FUSA by 16% in terms of the erodibility of the soil alone. In Figure 17, the Map of Major Built-up areas are shown as digitized from Google Earth image (as of 2015). The slope derived from remotely
sensed DEM image is cropped by the delineated FUSA and the resulting map show a reduction in service area by 6% for MARIIS. The soil type map from BSWM Reconnaissance Survey
obtained by DA-BAR was incorporated in the FUSA show a reduction in service area by 26%. Using these 4 individual maps (erosion, slope, soil type, and built-up areas) with values
showing desirable vs undesirable properties, they were overlaid using the Map Algebra function of GIS incorporating the 'Boolean' algebra, this resulted to final overlaid map as shown
in Figures 21 and 22 for MARIIS. The reduction in the service area is 46%. This result just implies that only 54% of the total FUSA for MARIIS is just available for farming which may result to optimum yield given a favorable condition. But this doesn't imply that you can no
longer use the undesirable FUSA. This may just help to explain why some farmers obtain unfavorable crop yields.

73 | P a g e
Table 18. Performance indicator for MARIIS
(Source: DOST NUWAM Project)
PERFORMANCE
INDICATORS
DIVISION I (10-year data)
DIVISION II (10-year data)
DIVISION III (11-year data)
DIVISION IV (6-year data)
Dry
Season
Wet
Season
Dry
Season
Wet
Season
Dry
Season
Wet
Season
Dry
Season
Wet
Season
Relative Water
Supply [RWS]1
( m3/ m
3)
0.41 .52 0.66 0.81 0.51 0.82 0.49 0.59
Irrigated Area
Performance
[F]2(%)
88.49 83.07 93.91 93.93 76.51 70.31 91.2 91.23
Gross Irrigation
Water Quota [M]3
( m3/Ha)
17,521 13,466 29,477 30,350 21,270 29,481 17,
012
17,
001
Yield Per Unit
Area [Y]4
( kg/Ha) 4,664 4,416 4,969 4,386 5,450 5,250 4,358 3,883
Yield per unit
Quantity of
Irrigation water
[Yw]5
( kg/ m3)
0.28 0.28 0.17 0.15 0.24 0.16 0.26 0.23

74 | P a g e
Figure 14. DEM of MARIIS, Isabela
Sources: NAMRIA; NIA; DA BAR Metadata

75 | P a g e
Figure 15. Soil erosion map of MARIIS, Isabela
Sources: NAMRIA; NIA; DA BAR Metadata

76 | P a g e
Figure 16. Overlaid map of MARIIS, Isabela showing reduction in service area in terms of erodibility of soil
Sources: NAMRIA; NIA; DA BAR Metadata

77 | P a g e
Figure 17. Built-up area map of MARIIS, Isabela
Sources: NAMRIA; NIA; DA BAR Metadata

78 | P a g e
Figure 18. Slope map of MARIIS, Isabela
Sources: NAMRIA; NIA; DA BAR Metadata

79 | P a g e
Figure 19. Overlaid map of MARIIS, Isabela showing reduction in service area in terms of desirable slope
Sources: NAMRIA; NIA; DA BAR Metadata

80 | P a g e
Figure 20. Soil map of MARIIS, Isabela
Sources: NAMRIA; NIA; DA BAR Metadata

81 | P a g e
Figure 21. Overlaid map of MARIIS, Isabela showing reduction in service area in terms of desirable soil
Sources: NAMRIA; NIA; DA BAR Metadata
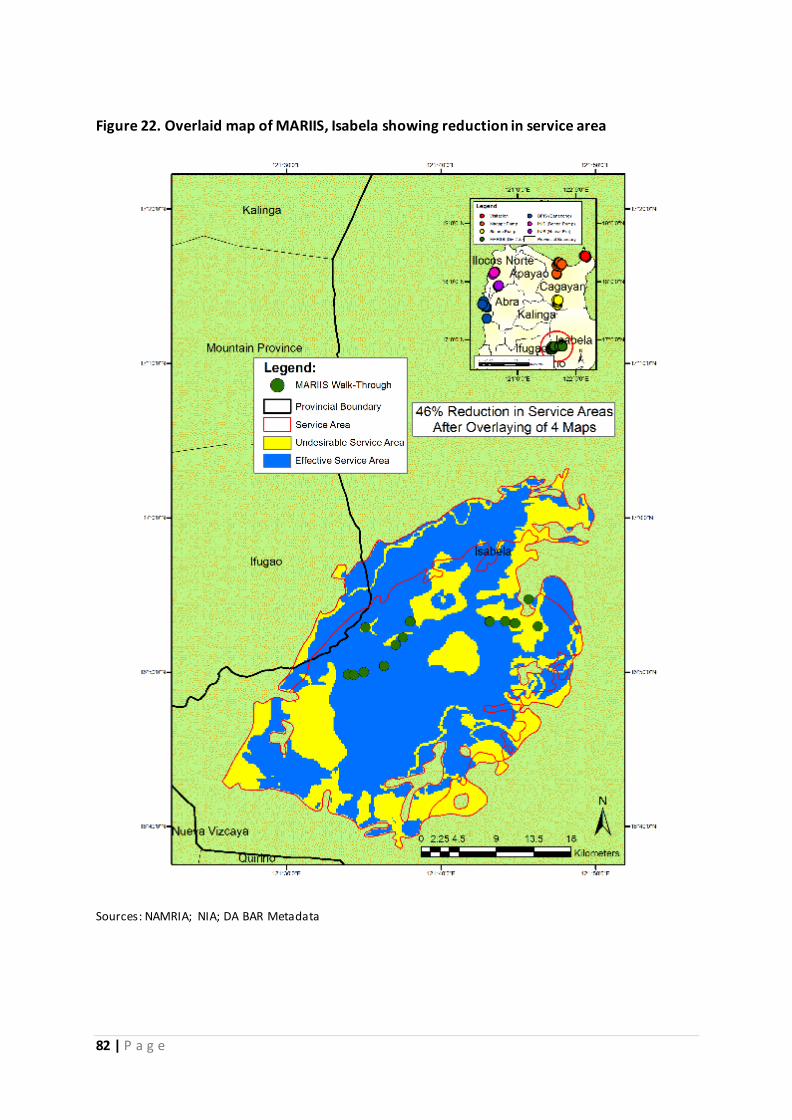
82 | P a g e
Figure 22. Overlaid map of MARIIS, Isabela showing reduction in service area
Sources: NAMRIA; NIA; DA BAR Metadata

83 | P a g e
Figure 23. Location of NIA office and structures in MARIIS, Isabela
Sources: NAMRIA; NIA; DA BAR Metadata
Figure 23 shows the actual NIS walkthroughs for MARIIS. Different irrigation structures
together with measurements on canal flow and water quality can also be seen in this Figure.

84 | P a g e
Table 19. Summary of Technical, Institutional and Environmental issues confronting the representative NIS in Luzon (i.e. UPRIIS, Pampanga and MARIIS, Isabela)
Technical Issues Institutional Issues Environmental Issues
Pampanga Most laterals are
earth canals
Experienced pest
infestation in 2013 due
to 5 in 2
Water quality measurements
or information are lacking in
all NIS cases visited. There is double
pumping of water
from drainage (Pump
operating cost is PhP
3,000 per ha
Farmers only get break-
even thus cannot pay
the ISF
Need to improve
irrigation facilities
(e.g. turnout gates)
Conflict arises due to
difficulty in convincing
other members to pay
the ISF
Measured water quality in the
downstream part of PIDRIS
showed low DO levels of 2.7
ppm. Rehabilitation of
damaged canals
NIA has no adequate
funds for major repair
and rehabilitation
pH values are greater than 7
which is above neutral and
little bit alkaline.
Main canal of PDRIS
is already highly
silted, around 40%,
due to lahar
Reshuffling of
management affects
prioritization of
programs which leads to
delay or cancellation
However, the other
parameters like EC is not a
concern.
Silt levels were
measured to be
around 10 cm- 41 cm
Conflict arises due to
difficulty in convincing
other members to pay
the ISF
Illegal pumping and
garbage dumping
Nueva Ecija
(Division 2)
Target improvements
are: to restore
approximately 100
hectares in addition;
modify check
structures; improve
canal linings to
reduce losses
Previously, support from
NIA is very good.
However, it drastically
decreased as of 2006
because of cost cutting
measures followed by
RAT Plan
The lateral downstream of
Vacca Dam exhibited very low
DO of 1.1 ppm. This can be
attributed to the thick aquatic
vegetation just upstream of
the Vacca dam which caused
the low DO downstream.
Some members use
surface pumps which
increases their cost
from P3000 – P5000
(per ha)
Usual conflict is due to
distribution of water
pH values are greater than 7
which is above neutral and
little bit alkaline

85 | P a g e
Technical Issues Institutional Issues Environmental Issues LTRIS dam damaged
due to typhoon
Mario
High prevailing prices of
inputs while selling
prices of harvest is low
However ,the other
parameters like EC is not a
concern.
Division 4 Earth canals are very
prone to damage and
siltation
Weak policy
enforcement on informal
settlers
No water quality data since
measurement or water quality
monitoring is not done Declining water
supply due to heavy
siltation of
Peñaranda river
Initially, the IA
constructed brush dams
in order to store water.
However, due to a dike
construction by the
DPWH, the water that
flows to the brush dam
and eventually to the
canal is blocked.
Measured pH values are
greater than 7 which is above
neutral and little bit alkaline.
Heavy siltation is due
to poor watershed
management
However, the other
parameters like EC and DO are
not a concern.
Water source is too
far (Pantabangan
dam), thus even if the
dam is full, water has
to travel a very long
distance before it
reaches the division
No water quality data since
measurement or water quality
monitoring is not done
Highly recommend
continuing the
proposed Balintingol
dam where it could
store water near
Division 4 area
Table 19 summarizes the issues/concerns observed in UPRIIS and MARIIS. The technica l
problem is mainly due to siltation of canals especially the unlined canals which further contributes to the poor water distribution especially in the downstream part of the main canal. The Institutional issue revolves on weak enforcement of policies with regards to illega l
settlers/pumping/garbage dumping, conflicts due to ISF collection and water distribution, high costs of inputs, etc. The environmental concerns is due to poor water quality as reflected in low
DO and high pH, which could have affected the yield in those NIS. High EC was also reported in other NIS in Luzon especially those pumping saline groundwater (Please see section on water quality).

86 | P a g e
5.1.3. Malinao IS
The three (3) NIS visited in Bohol was part of the Bohol Integrated Irrigation System. It consists of three (3) reservoir-type dam system namely: Malinao IS, Bayongan IS and Capayas
IS. Because of the very small catchment area of Bayongan reservoir (11.2 sq.km.) most of its water supply will come from Malinao reservoir. It was estimated that about 63.5 MCM of water
per year will be transferred from Malinao reservoir to Bayongan reservoir thru Malinao Main Canal (Figure 24). At km. 16+880 Malinao main canal, a spillway structure (Photo 34) was constructed and connected to a chute which diverted and convey water down to Bayongan
reservoir located at an elevation approximately 100 meters below with a gross capacity of 34.6 MCM. Malinao dam supplies water to Bayongan if dam water level is 151.6 m and above.
Bayongan reservoir transfer water to Capayas reservoir through a supply canal only if the water is in excess.
Figure 24. Schematics of the water transfer from Malinao down to Capayas reservoir.
(Source: NIA Region 7)

87 | P a g e
Figure 25. 3D map showing the area around the Malinao, Capayas and Bayongan IS.
Photo 34. Gate of the spillway that supply water to Malinao IS to Bayongan reservoir
Cropping intensities of the systems under the Bohol Integrated Irrigation System was relative ly
low as presented in Table 20. The highest cropping intensity for Malinao IS was the year 2017 while the Bayongan IS has the highest during the year 2017. The highest cropping intensity for Capayas IS was also the year 2017 and it has also the lowest cropping intensity among the three
systems.
The Malinao IS is supplied by water from Malinao Dam which is located in the southeastern part of Bohol in the municipality of Pilar. It is a reservoir-type dam that covers the

88 | P a g e
municipalities of Pilar, Alicia, SanMiguel, Dagohoy and Ubay with a total service area of 4,960 hectares with the Wahig and Pamacsalan Rivers as the water sources. It was implemented by
the National Irrigation Administration (NIA) from February 1,1984 to December 31,1997 with a total project cost of P1,565,264,141.00 which was assisted by the Japan Internationa l
Cooperation Agency (JICA). There were about 50 direct turnouts from the Main canal (Photo 35). The system allowed
pumping (Photo 36) from the main canal, on the right side. Schedule of pumping depends on their location. It was mentioned that siltation could be observed in some downstream sections
but minimal. It could be flushed out during high flow but was not documented during the visit.

Table 20. Cropping intensity of Bohol NIS from 2014 to dry season, 2018
Name of
System
CY 2017 PLANTED AREA
2014 2015 2016 2017 2018
FUSA Optimal
Area WS DS Ratoon CI WS DS CI WS DS CI WS DS Ratoon CI WS DS CI
Malinao IS 4,740 3,866 3,149 3,108 650 146 2,742 3,300 127 3,167 2,442 118 3,831 3,662 1,250 185 227 4,011 89
Bayongan
IS 4,084 3,063 2,602 2,659 1,025 154 1,494 2,670 102 895 2,404 81 2,922 2,877 1,735 185 1,259 3,063 106
Capayas IS 1,113.1 858 592 596 93 105.91 71 588 54.49 68 435 41.6 694 746 480 158.7 858 77.1
Talibon IS 967.7 943 464 574 0 103.82 575 574 114.94 582 569 115.11 604 604 250 145.8 943 97.4
Total 10,905 8,730 6,807 6,937 1,768 140.59 4,882 7,132 108.88 4,712 5,850 95.73 8,051 7,889 3,715 178.1 1,486 8,875 95
Source: NIA Region 7
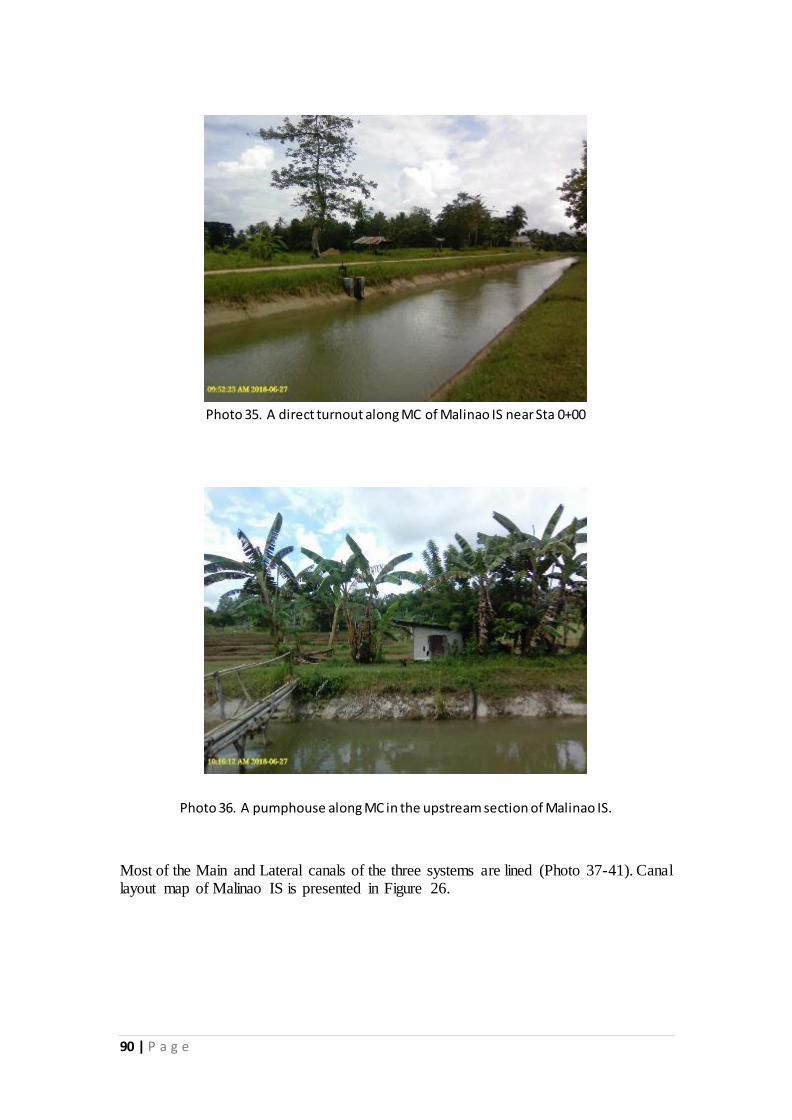
90 | P a g e
Photo 35. A direct turnout along MC of Malinao IS near Sta 0+00
Photo 36. A pumphouse along MC in the upstream section of Malinao IS.
Most of the Main and Lateral canals of the three systems are lined (Photo 37-41). Canal layout map of Malinao IS is presented in Figure 26.

91 | P a g e
Photo 37. Section of Lateral D, Malinao IS in the downstream that are lined.
Figure 26. Canal layout of the Malinao IS.
(Source: NIA Region 7)
Most of the Main and Lateral canals of the three systems were installed with staff gages
for monitoring flow intakes (Photo 38). Same with NIS in Luzon some of the gates of systems in Bohol has padlock (Photo 39). Siltation in the canals came from roads along the canal. Debris from plants and trees in the area usually clogged the gates at the lateral

92 | P a g e
and turn outs (Photo 40). There were also several damaged structures, one can be seen in Photo 41.
Photo 38. Staff gage installed in the downstream section of Malinao IS MC.
Photo 39. A gate with padlock in the downstream section of Malinao IS Lateral F.

93 | P a g e
Photo 40. Check gate at the downstream section of Lateral D, Malinao IS. Take note of the
debris on both sides of the canal.
Photo 41. Damaged structure in Malinao IS.

94 | P a g e
Figure 27. Location map of the Bohol Integrated Irrigation System
(Source: NIA Region 7)
Photo 42. Headwater of the Main Canal, Malinao IS.

95 | P a g e
Photo 43. Duckbill weir near Lateral A, Malinao IS.
Figure 28. Malinao dam profile.
(Source: NIA Region 7)

96 | P a g e
Figure 29. Bohol groundwater potential map.
Figure 30. Bohol Erosion Map.

97 | P a g e
Figure 31. Bohol walkthroughs and system boundaries.
5.1.4. Jalaur-Suague RIS
In the Jalaur-Suague RIS, separate Main Canal supplies Jalaur Proper and Jalaur Extension (Photo 44) but only one source. Suague RIS has separate diversion dam and
canal layout (Photo 46). Moreover, the main canal and Lateral B of Suague RIS is connected to the main canal of Jalaur Proper to augment water supply (Figure 45). One
of the problems in the operation of Jalaur-Suague RIS is siltation in the canal as mentioned by the farmers and observed in the field (Photos 47 and 48).

98 | P a g e
Photo 44. Diversion dam of Jalaur Proper and Jalaur Extension RIS.
Photo 45. Dry log debris on the side of Jalaur-Suage RIS

99 | P a g e
Figure 32. General canal layout of the Jalaur-Suague RIS.
(Source: Iloilo-Guimaras IMO)

100 | P a g e
Figure 33. 3D map showing the Sibalom-Tigbauan, Jalaur-Suague, and Barotac Viejo RIS.
Photo 46. End section of the Main canal of Suague RIS that flows into the Main Canal of
Jalaur Proper RIS. Take note of the pumpset on the right side.

101 | P a g e
Photo 47. Section of Jalaur Suage near the residential areas.
Photo 48. Silted section of Lateral C, Jalaur Proper RIS near the headgate.

102 | P a g e
Photo 49. Clogged canal in Sibalom Tigbauan.
(Take note of the dead swine together with the debris)
Photo 50. Shallow tubewell in Jalaur-Suage.
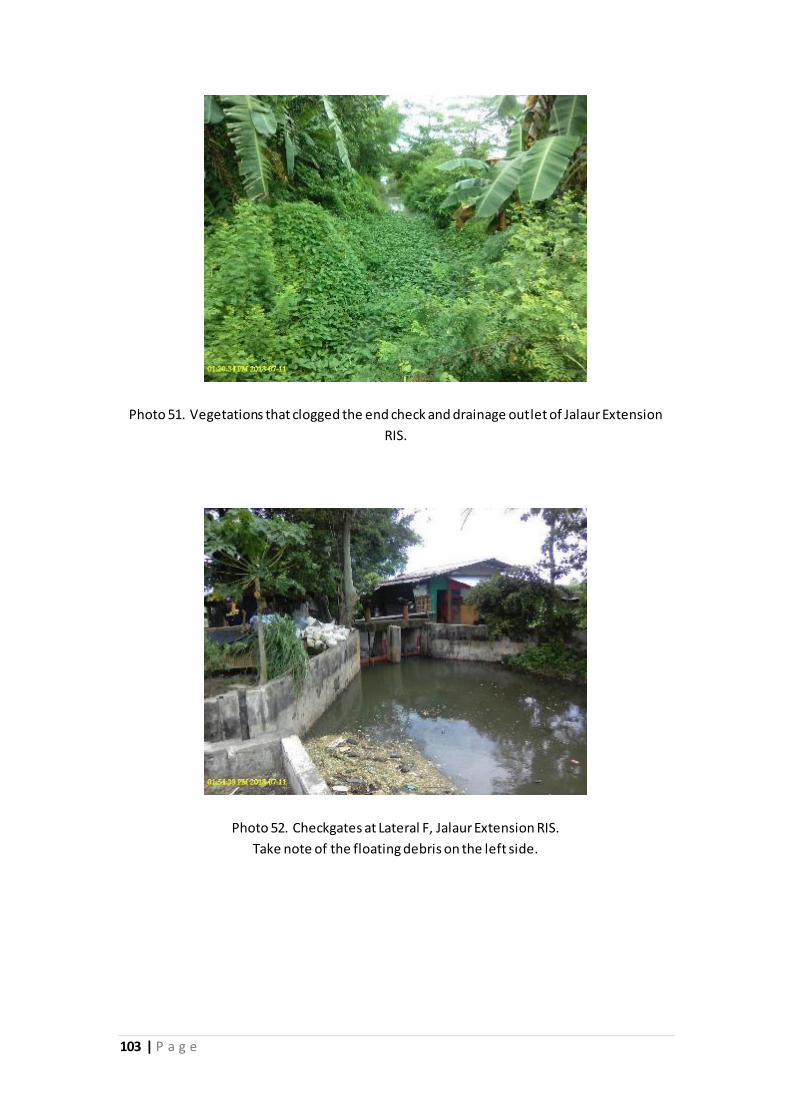
103 | P a g e
Photo 51. Vegetations that clogged the end check and drainage outlet of Jalaur Extension
RIS.
Photo 52. Checkgates at Lateral F, Jalaur Extension RIS.
Take note of the floating debris on the left side.

104 | P a g e
Photo 53. Lined section of Lateral F, Jalaur Extension RIS.
Photo 54. A shallow tubewell (well point system) in the midstream section of Jalaur Proper
RIS.

105 | P a g e
Photo 55. Downstream section of Lateral C, Jalaur Proper RIS.
Photo 56. Direct turnout along Main Canal, Jalaur Proper RIS.

106 | P a g e
Photo 57. Section of Lateral B, Jalaur Proper RIS.
Photo 58. Check gate structure of Lateral B, Jalaur Proper RIS.

107 | P a g e
Photo 59. A pumpset along Main Canal, Jalaur Proper RIS.
Take note of the width of the canal and vegetations along.
Photo 60. Section of the Main Canal of Jalaur Proper RIS with vegetations.

108 | P a g e
Photo 61. A direct turnout in the midstream of Main Canal of Jalaur Proper RIS.
Photo 62. Newly-cleaned main farm ditch in Jalaur Proper RIS.

109 | P a g e
Photo 63. A checkgate using wood planks near the downstream of Main Canal of Jalaur
Proper RIS. Take note of the debris on the right side of the canal.
Photo 64. Downstream section of Lateral G, Jalaur Proper RIS.

110 | P a g e
Photo 65. A re-use dam in Suague RIS.
The intake gate is on the left side covered with debris.
Photo 66. Section of the Main Canal, Suague RIS (midstream) with drainage intake (right
side).

111 | P a g e
Figure 34. Iloilo groundwater potential map.
Figure 35. Iloilo Erosion Map.

112 | P a g e
Figure 36. Iloilo walkthroughs and system boundaries.
5.1.5. Padada RIS
Padada RIS started operation in 1956 serving mostly the town of Hagonoy, Davao del
Sur and some part of Digos City, Davao del Sur. The designed service area was 3,000 has while the firmed-up service area was 3,015 has. The main crops were rice and
banana. The irrigated area and average yield per season for CY 2014-2017 is presented in Table 21 while for Dry season 2018 is presented in Table 22.
Table 21. Irrigated area and average yield per season of Padada RIS for CY 2014 to 2017
Season Irrigated Benefited Average Yield Cav/Ha
WET 2669.07 2665.9 131 cav/ha
DRY 2623.76 2608.08 125 cav/ha

113 | P a g e
Table 22. Irrigated area and average yield per season of Padada RIS for CY 2018 Dry Season
The Padada RIS was part of the JICA project for Improving Operation & Maintenance
(O&M) of National Irrigation Systems (3rd Technical Cooperation Project). The project’s purpose is for the improvement of O&M schemes of NIS. The project duration
was from May 2013 to April 2017. One of the activities of the project were the introduction of GIS which include the establishment of new parcellary map by Satellite imagery and the introduction of Farmland database/GIS in 10 pilot sites. The other
pilot sites are presented in Table 23. Aside from Padada RIS, there were other NIS visited by the team which include Pampanga Delta, Caguray, Mambusao, Barotac
Viejo, and Malinao RIS. Sample output of the JICA project for Padada RIS is shown in Figures 39 and 40. Moreover, it is commendable that the training and experience obtained by the staff in the JICA project were being used in other system under the
IMO as well as in the CIS.
Table 23. Pilot sites for the improvement of O&M schemes in NIS Name of NIS Location Service
Area Firmed-up Service Area
Number of Farmers
Amburayan RIS Region I 3,489 3,289 9,074
Division 5 UPRIIS 18,050 17,850 17,456
Pampanga Delta Region III 13,158.54 10,830.27 5,771
Caguray RIS Region IV-B 3,308 1,990 742
Mambusao RIS Region VI 1,423 1,372 828
Barotac Viejo RIS Region VI 2,124 1,700 805
Malinao RIS Region VII 4,950 4,740 11,503
Padada RIS Region XI 3,512 3,015 2,275
Lasang RIS Region XI 4,928.92 4,928.92 1,931
Lower Agusan River PIS Region XIII 6,000 4,492.75 1,825
As of June 30, 2018
( HAS ) ( HAS ) ( HAS ) ( HAS ) ( HAS ) ( HAS ) ( HAS ) ( HAS ) ( HAS ) ( HAS ) % Cav / Has
1. LAPOSA 355.50 4.50 360.00 330.45 - 330.45 - 330.45 - 330.45 391 91.79% 112
-
2. UPSFIA 416.90 8.10 425.00 414.09 8.10 422.19 - 414.09 8.10 422.19 425 99.34% 115
-
3. BIA 695.97 34.03 730.00 685.72 35.83 721.55 - 685.72 35.83 721.55 603 98.84% 114
-
4. BASISFIA 521.35 3.25 524.60 495.65 3.25 498.90 495.65 3.25 498.90 464 95.10% 115
-
5. SMIA 80.40 80.40 80.40 80.40 80.40 - 80.40 94 100.00% 110
-
6. SIA 300.00 300.00 179.76 179.76 179.76 - 179.76 268 59.92% 104
sub-total 2,370.12 49.88 2,420.00 2,186.07 47.18 2,233.25 - 2,186.07 47.18 2,233.25 2245
BANANA (Multi) 595.00 595.00 461.53 461.53 461.53 461.53 4 77.57%
TOTAL 2,370.12 644.88 3,015.00 2,186.07 508.71 2,694.78 - 2,186.07 508.71 2,694.78 2249 89.38% 112
RICE BANANA TOTAL RICE BANANA TOTAL RICE BANANA
NUMBER
OF
FARMERSC. I. PROD'NNAME OF IA
SERVICE AREA IRRIGATED AREA FAILURE
FOR RICE
AREA
BENEFITED AREA
TOTAL

114 | P a g e
Figure 37. Geotagging of location of stuctures in Padada RIS from JICA Project.
Figure 38. Geotagging of perimeter of IA Boundaries in Padada RIS from JICA
Project.

115 | P a g e
During the time of visit at Padada RIS, the unlined sections of Main Canal were being lined (Photo 67). The Laterals and Main Canals of other supply dams (Photo 68) were turned over to IAs (part of Modified IMT) as presented in Table 24. Of the total length
(42.565 kms) of canal sections managed by the IAs, about 69.5% were unlined (Table 23). System layout and parcellary map of Padada RIS is shown in Figures 39 and 40.
Photo 67. Newly lined headwater section of Padada RIS Main Canal.
Photo 68. Parat dam along Sacub river (Intake dam for Padada RIS area).

116 | P a g e
Table 24. Area and canal sections covered per IA of Padada RIS
NAME OF
IA
FUSA CANALS CONTRACT
NAME STATION LENGTH TYPE
(has) FROM TO (km) LINED UNLINED
LAPOSA 360.00 Lat. A 0+000 5+520 5.520 4.620 0.900 IMT
Lat. A-
1
0+000 1+640 1.640 1.640 0.000
Lat. AA 0+000 0+747 0.747 0.747
Sub-Total 7.907 6.260 1.647
UPSFIA 425.00 Lat. B 0+000 1+983 1.983 1.783 0.200 IMT
Lat. B-
1
0+000 1+457 1.457 0.451 1.006
Lat. B-
2
0+000 5+450 5.450 1.240 4.210
Sub-Total 8.890 3.474 5.416
BIA 730.00 Lat. B 1+983 7+720 5.737 0.977 4.760 IMT
Lat. B-
4
0+000 4+180 4.180 4.180
Sub-Total 9.917 0.977 8.940
BASISFIA 524.60 Lat. B-
3
0+000 7+200 7.200 0.255 6.945 IMT
Lat. B-
3A
0+000 1+060 1.060 1.060
Sub-Total 8.260 0.255 8.005
SMIA 80.40 MC 0+000 2+305 2.305 1.010 1.295 TYPE III
Sub-Total 2.305 1.010 1.295
SIA 300.00 SK MC 0+000 2+840 2.840 0.030 2.810 IMT
SK Lat.
A
0+000 1+415 1.415 0.300 1.115
Parat
LMC
0+000 1+031 1.031 0.691 0.340
Sub-Total 5.286 1.021 4.265

117 | P a g e
Figure 39. Area boundaries of the different IAs of Padada RIS with canal layout and parcellary map.

118 | P a g e
Figure 40. Canal layout and parcellary map of Padada RIS with other intake dams.
Photo 69. Bridge crossing over the Main canal of Padada RIS.

119 | P a g e
Photo 70. Problem at the dam site due to over quarrying near the downstream section of
Padada RIS dam.
Photo 71. Take note of the standby STW as water source during dry spells.
At the time of survey, sections of Main Canal were being lined. Silts being removed
from the canal as evidence of heavy siltation plus freshwater shellfish could be observed. Due to the on-going canal linings in Padada RIS, calibration of staff gages has to be done after completion.
A water delivery schedule for Padada RIS is presented in Figure 41. Still, the system
encountered illegal turnout and pumping at night. Sometimes, the system operators seek

120 | P a g e
assistance of the police and barangay officials in enforcing the schedule. Moreover, there also issues with illegal settlers along drainage and other section of the Padada RIS
which include garbage dumping and canal damages among others.
Figure 41. Sample water delivery schedule.

121 | P a g e
Photo 72. Illegal settlers along the drainage.
During the field visit in Padada RIS, we observed some odd structures. The headwater of Lateral A has two checkgates (Photos 73 and 74). Additional gate was installed to
increase water intake into the Lateral. On the other hand, the silt ejector opposite the headgate of Lateral B was converted into farm turn out (Photo 75).
Photo 73. First intake gate of Lateral A.

122 | P a g e
Photo 74. Second intake gate of Lateral A.
Photo 75. Silt ejector converted into supply gate opposite Lateral B headgate.

123 | P a g e
Photo 76. Portion of lined section followed by unlined section in the downstream of Padada
RIS.
Photo 77. Pump house beside a reuse point in Padada RIS.

124 | P a g e
Photo 78. Padada RIS dam.
Photo 79. Silted main canal of Padada RIS.

125 | P a g e
Photo 80. Main canal above designed water level in Padada RIS.
Photo 81. Portion of the Farm to Market Road that was a marshland before.

126 | P a g e
Figure 42. Padada RIS general information.
(Source: Padada RIS IMO)
Figure 43. Padada RIS Cropping Pattern.
(Source: Padada RIS IMO)

127 | P a g e
Figure 44. Davao del Sur groundwater potential map.
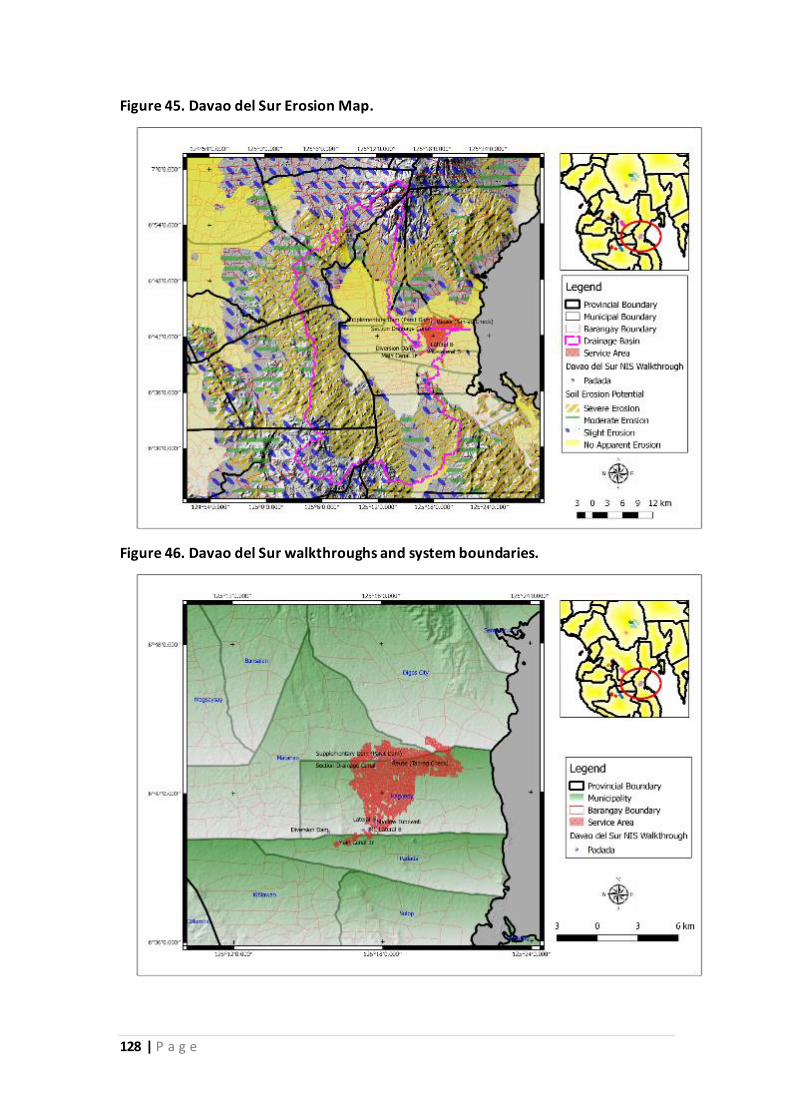
128 | P a g e
Figure 45. Davao del Sur Erosion Map.
Figure 46. Davao del Sur walkthroughs and system boundaries.

129 | P a g e
5.1.6. Marbel #1 RIS
The Marbel#1 RIS diversion dam (Photo 82) is located in Koronadal, South Cotabato (Lat - 6°24’30”; Long - 124°54’17”) serving the Koronadal City and Municipality of
Tantangan. The system started operation in September 1973 with a potential area of 2,700 has. As of August 2018, FUSA is about 2,042.78 has with 18 IAs serving 1,458
members (Figure 47).
Photo 82. Diversion dam of Marbel #1 RIS.
Figure 47. Layout map of Marbel #1 RIS with relative locations of the 18 IAs area boundaries

130 | P a g e
Figure 48. 3D map showing the area around Marbel #1 and Banga RIS
The designed river discharge for Marbel #1 RIS was 5.44 CMS but the river discharge was only about 2.726 CMS (Table 25). The total watershed area is about 203.0 km². Due to low river discharge, supplementary water was being drawn out from Calalima
and Bulok Creek as re-use dams. There were about 18 re-use dams that irrigate about 358 has. An example is the Bulok Dam presented in Photo 83.
Table 25. Mean monthly river discharge of Marbel #1 RIS from 2005-2017
YEAR JAN FEB MAR APR MAY JUN JUL AUG SEP OCT NOV DEC
2005 3,204.00 3,130.00 2,865.00 1,680.00 3,185.00 3,264.00 3,156.00 1,938.00 1,415.00 2,820.00 3,317.00 3,628.00
2006 2,771.00 2,840.00 2,522.00 3,060.00 2,988.00 3,134.00 1,733.00 1,980.00 2,000.00 1,916.00 2,851.00 2,736.00
2007 2,667.00 2,817.00 2,937.00 3,010.00 3,093.00 3,364.00 3,594.00 3,242.00 3,240.00 2,760.00 3,060.00 3,313.00
2008 3,305.00 3,046.00 2,954.00 2,518.00 3,623.00 3,000.00 2,387.00 1,998.00 2,976.00 3,260.00 2,919.00 2,663.00
2009 1,975.00 3,044.00 2,717.00 3,501.00 3,623.00 2,786.00 2,554.00 2,840.00 2,652.00 3,004.00 2,839.00 2,487.00
2010 1,793.00 1,657.00 1,487.00 1,855.00 2,644.00 2,966.00 2,943.00 3,354.00 2,405.00 1,890.00 2,501.00 3,167.00
2011 2,676.00 2,243.00 2,487.00 2,561.00 3,162.00 2,102.00 1,903.00 2,904.00 3,019.00 2,687.00 3,051.00 2,690.00

131 | P a g e
YEAR JAN FEB MAR APR MAY JUN JUL AUG SEP OCT NOV DEC
2012 2,420.00 2,781.00 2,730.00 2,592.00 1,173.00 2,304.00 1,136.00 2,202.00 1,929.00 2,568.00 2,388.00 2,709.00
2013 1,811.00 2,933.00 2,373.00 2,402.00 2,687.00 2,554.00 2,657.00 1,762.00 2,333.00 2,422.00 2,583.00 2,422.00
2014 2,594.00 2,480.00 2,457.00 2,396.00 2,592.00 2,390.00 2,549.00 2,476.00 2,429.00 2,569.00 2,092.00 2,339.00
2015 2,575.00 2,579.00 3,125.00 2,972.00 2,682.00 2,321.00 2,562.00 2,384.00 2,288.00 2,568.00 2,510.00 2,753.00
2016 3,010.33 2,074.14 450.00 915.00 3,026.00 2,953.00 2,805.00 2,607.00 1,463.00 2,253.00 2,559.00 2,489.00
2017 1,916.13 1,579.00 2,257.00 2,359.00 2,378.00 2,674.00 2,484.00 2,343.00 2,268.53 2,423.74 2,650.00 1,901.55
Mean 2,516.73 2,554.09 2,412.38 2,447.77 2,835.08 2,754.77 2,497.15 2,463.85 2,339.81 2,549.29 2,716.92 2,715.20
Photo 83. The Bulok Dam (re-use) of the Marbel #1 RIS.
Even though the water supply from the Marbel #1 RIS was relatively low, the cropping
intensity was relatively high with an average of 100% for wet season from 2013-2017 (Table 26). One of the reasons is the installation of multiple re-use and supplementary
dams. The high cropping intensity could also be attributed to the 100% lined canals. There were about 21.57 kms of Main Canal and about 23.51 kms of Lateral Canals supported with 45.46 kms of service roads (Photos 84 and 85). Canal layout map of
Marbel #1 RIS is presented in Figure 49.
Table 26. Cropping Intensity of Marbel #1 RIS for Dry and Wet Season from 2013-2017 YEAR DRY WET AVERAGE
2013 97.80 99.39 98.595
2014 100.04 100.00 100.02
2015 95.34 102.19 98.765
2016 100.04 99.30 99.67
2017 98.85 98.79 98.82
AVERAGE 98.414 100.042

132 | P a g e
Photo 84. Section of Main Canal of Marbel #1 RIS at the headgate of Lateral E.
Photo 85. Section of Main Canal of Marbel #1 RIS at the headgate of Lateral H1.
.
The 100% lined canal status of the Marbel #1 RIS were achieved through continuous repair and rehabilitation of the system as shown in the list of POW from 2013-2017 in
Table 27. Another reason for the high cropping intensity is the synchronized planting. In this system, the midstream (Division B, Figure 52) first, then upstream and
downstream section were simultaneous (Divisions A and C, Figure 50). The reason was for the downstream section to receive excess of midstream section. The synchronized planting is also coordinated with Marbel #2 RIS. The Marbel #2 RIS (Photo 86) is
irrigating the right side of the river while Marbel #1 serves the left side. With the coordinated scheme, the midstream of Marbel #1 should not be simultaneous with
midstream of Marbel#2. It could also be observed that another reason for high cropping

133 | P a g e
intensity of Marbel #1 RIS is the reduction of silt in the canals. The system is operating the silt ejector (Photo 87) and wasteways (Photo 88) once a month.
Figure 49. Canal layout map of Marbel #1 RIS

134 | P a g e
Table 27. List of POW for Marbel #1 RIS from 2013 to 2017
YEAR TYPE AMOUNT (₱)
2013 Concrete Pavement 1,649,000.00 NIS Extension 31,501,000.00
2014 NIS Extension 27,667,000.00
2015 Rehab and Reconstruction 5,000,000.00
Restoration/ Rehab/ Repair 4,000,000.00
2016 Repair and Rehab 12,000,000.00
2017 Restoration/ Rehab/ Repair 10,000,000.00
(Congressional Fund) 10,000,000.00 Coco-net Slope 2,025,000.00
Figure 50. Layout of the Marbel #1 RIS showing the different Divisions.

135 | P a g e
Photo 86. Diversion dam of the Marbel #2 RIS.
Photo 87. Control gates of the silt ejector of Marbel #1 RIS.

136 | P a g e
Photo 88. Control gate of one of the wasteways of Marbel #1 RIS.
Figure 51. General information of Marbel #1 RIS.

137 | P a g e
Photo 89. Silted section of Marbel #1 RIS.
Figure 52. South Cotabato groundwater potential map.

138 | P a g e
Figure 53. South Cotabato Erosion Map.
Figure 54. South Cotabato walkthroughs and system boundaries.

139 | P a g e
Table 28 summarizes the issues/concerns observed in selected NIS in Bohol, Iloilo, Davao del Sur and South Cotabato. As in Luzon, the main technical problem is siltat ion
of canals especially the unlined canals which further contributes to the poor water distribution especially in the downstream part of the main canal. The Institutional issue
revolves on weak enforcement of policies with regards to illega l settlers/pumping/garbage dumping and stealing of structures, high costs of inputs, difficulty in collecting Association and O&M dues and water distribution, etc. The
environmental concerns are due to poor water quality as reflected in low DO and high pH and EC, which could have affected the yield in those NIS (please see section on
water quality).
Table 28. Summary of Technical, Institutional and Environmental issues confronting the representative NIS in Visayas and Mindanao (Jalaur-Suague RIS, Iloilo; Malinao, Capayas Bayongan IS, Bohol; Padada RIS, Davao del sur; and Marbel #1, South Cotabato)
Technical Issues Institutional Issues Environmental Issues
Bohol Slow rehabilitation
of damaged canals
and FMR
Illegal pumping and
garbage dumping
7 sites in Capayas and
Bayongan, Bohol NIS have
shown low pH (<5) and low
DO (ard 4.5ppm) indicating
that it is bit acidic and is
lacking in dissolved oxygen.
But EC is hard 200 uS/cm
which is OK in terms of
salinity level Lateral C is partially
filled with stones
Less than 100%
collection efficiency of
Annual Dues
Abandoned area
(reuse point)
High cost of farm
inputs, low cost of rice
product
Lack of manpower in
canal cleaning
No water during dry
season
Stealing of water and
illegal check structures
Lack of postharvest
facilities
Need for dam
heightening
Iloilo Need to improve
irrigation facilities
High cost of farm
inputs, low cost of
product
Most NIS cases in Iloilo
showed pH levels on the
alkaline side where 14 of 22
samples showed pH > 7.
This was especially evident

140 | P a g e
Technical Issues Institutional Issues Environmental Issues
in all Jalaur measurements
(9 locations) where pH was
greater than 7 and EC was
greater than 300 uS/cm in 3
out of 10 locations.
Slow rehabilitation
of damaged canals
and demolished
structures
Stealing of steel gates Salinity as reflected by high
EC (i.e. >300uS/cm) was
also a problem in all
Sibalom Tigbauan sites
where all 5 measured
values from laterals, main
canals, turnouts showed
values greater than
400uS/cm and 2 out of 4
locations showed high pH
(>7). Needs drainage
structures
Drainage outlet
draining into the canal
Silted canals Shortage of water
Delayed water delivery
Illegal turnouts
Davao del
Sur
Many portions of
the canal system are
unlined
High cost of farm
input, low cost of palay
DO is <6ppm, EC > 300
uS/cm and pH >7 in 4 out 5
NIS sites in Padada Davao
del Sur, which are
indicative of the low quality
of water in the area. Damaged steel
gates
High cost of fertilizer
Members are not
paying the Association
Sustainable Dues
South
Cotabato
Silted canals Delayed response on
reports of water
stealing and damaging
of structures
12 out of 12 NIS sites in
Marbel and Banga South
Cotabato have pH >7, 8 out
of 12 have DO <6 ppm
which indicates low water
quality in most sites in
South Cotabato. However
only 2 out 12 sites have EC
> 300 uS/cm which are
located in downstream part
of Marbel sites
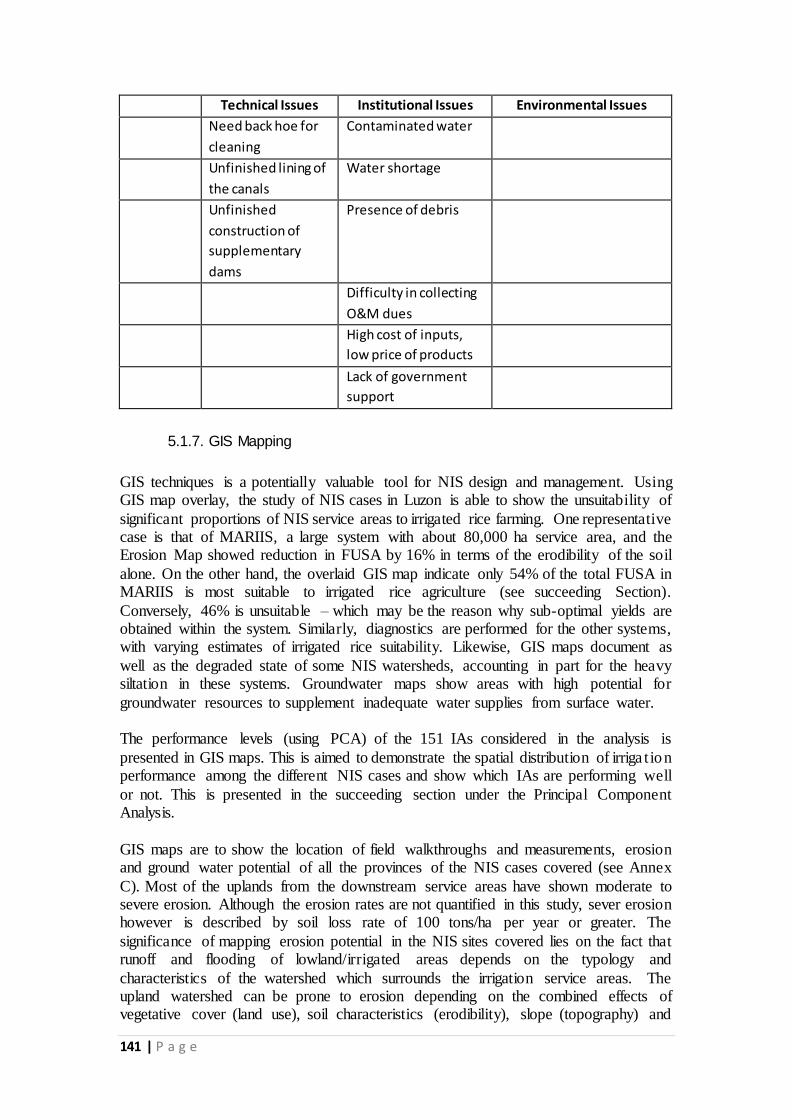
141 | P a g e
Technical Issues Institutional Issues Environmental Issues Need back hoe for
cleaning
Contaminated water
Unfinished lining of
the canals
Water shortage
Unfinished
construction of
supplementary
dams
Presence of debris
Difficulty in collecting
O&M dues
High cost of inputs,
low price of products
Lack of government
support
5.1.7. GIS Mapping
GIS techniques is a potentially valuable tool for NIS design and management. Using GIS map overlay, the study of NIS cases in Luzon is able to show the unsuitability of
significant proportions of NIS service areas to irrigated rice farming. One representative case is that of MARIIS, a large system with about 80,000 ha service area, and the Erosion Map showed reduction in FUSA by 16% in terms of the erodibility of the soil
alone. On the other hand, the overlaid GIS map indicate only 54% of the total FUSA in MARIIS is most suitable to irrigated rice agriculture (see succeeding Section).
Conversely, 46% is unsuitable – which may be the reason why sub-optimal yields are obtained within the system. Similarly, diagnostics are performed for the other systems, with varying estimates of irrigated rice suitability. Likewise, GIS maps document as
well as the degraded state of some NIS watersheds, accounting in part for the heavy siltation in these systems. Groundwater maps show areas with high potential for
groundwater resources to supplement inadequate water supplies from surface water. The performance levels (using PCA) of the 151 IAs considered in the analysis is
presented in GIS maps. This is aimed to demonstrate the spatial distribution of irriga t ion performance among the different NIS cases and show which IAs are performing well
or not. This is presented in the succeeding section under the Principal Component Analysis.
GIS maps are to show the location of field walkthroughs and measurements, erosion and ground water potential of all the provinces of the NIS cases covered (see Annex
C). Most of the uplands from the downstream service areas have shown moderate to severe erosion. Although the erosion rates are not quantified in this study, sever erosion however is described by soil loss rate of 100 tons/ha per year or greater. The
significance of mapping erosion potential in the NIS sites covered lies on the fact that runoff and flooding of lowland/irrigated areas depends on the typology and
characteristics of the watershed which surrounds the irrigation service areas. The upland watershed can be prone to erosion depending on the combined effects of vegetative cover (land use), soil characteristics (erodibility), slope (topography) and

142 | P a g e
rainfall patterns (erosivity). These factors are used as inputs in the Universal Soil Loss Equation (USLE) to estimate soil loss and erosion potential of a watershed. Many
studies have shown which are validated by actual observations that eroded particles from upland areas are carried downstream areas which commonly cause siltation of
water courses, irrigation canals and surface water systems. By mapping erosion potential, then we can assess which part of the watershed is prone to erosion, so we can propose land use planning and watershed management measures to minimize erosion
potential and thus protect the lowland areas from sedimentation and siltation which are believed to be the causal factors for reduced flow capacity of canals and poor water
distribution. Some representative maps are shown in the Technical section and all soil erosion maps are presented in the Annex C.
Estimation of ground water recharge on the other hand, seems to be out of scope in the present study since we need more time and data related to groundwater balance
components such as rainfall, runoff, evapotranspiration, subsurface inflow and outflow and deep percolation and upward flux. This entails another independent study since we need to have the measured data from the NIS sites covered to enable to undertake a
ground water balance to estimate infiltration or recharge rates. We propose that this can be included as one of the recommendations for future studies. The ground water
potential maps for the different NIS in Luzon, Visayas and Mindanao are presented in Annex C.
Moreover, another interesting output of GIS mapping is the 3D map as presented in Figure 55. The 3D map presented location of service area of NIS as well as its
watershed. Merging this with other maps will be an excellent tool for policy and planning. For example, an input of an update built-up areas or land use plan may show areas for expansion or limits for the irrigated area.
Figure 55. 3D map showing relative elevation of service area and terrain of the whole watershed of the NIS covered in Bukidnon.

143 | P a g e
5.1.8. Irrigation Performance in terms of Cropping Intensity
Irrigation/cropping Intensity varies from one NIS to another. The cropping intensity of the different NIS cases covered is presented in Figure for the crop years 2005-2017.
The highest cropping intensity achieved by a specific NIS is highlighted with red font. The data for Nueva Era RIS, Bonga #2 PIS and Balayungan RIS was not presented.
The cropping intensity (in %) per crop year was computed by adding the actual area irrigated during wet and dry cropping divided by FUSA multiplied by 100. Though it is always being interchange as irrigation intensity, the term cropping intensity (CI) will
be used in this report.
The cropping intensity is one of the basic irrigation performance parameters being used in assessing irrigation systems. Another approach is presented in the succeeding section using the Principal Component Analysis. The best cropping intensity will be 200% or
higher, however, this was not always the case. Though CI may vary every year depending on the water flow, condition of the system and other variables, FUSA may
also vary every year. FUSA decreases mainly due to land use conversion like housing, commercial expansion, and road development. Other reasons in the reduction of FUSA include conversion to other crops, natural calamity, and not planting of farmers. On the
other hand, FUSA increases due to area expansion and system rehabilitation. (Note: The cropping intensity presented in Figure was computed using two cropping only.
Some of the NIS have third cropping or other schemes, and may have higher CI presented in their respective reports. Also, some of the NIS in Luzon (Ambayoan-Dipalo RIS) and Mindanao (Padada RIS and Manupali RIS) have other crops being
irrigated which may result to higher cropping intensity.)
The average cropping intensity (2005-2017) for the NIS cases ranges from 71% to 205% (Figure 56). The average cropping intensity for Luzon NIS ranges from 71% to 195%. The main reason for the relatively low cropping intensity were siltation and low
water supply especially for Pampanga Delta RIS and Caguray RIS. On the other hand, the average cropping intensity for Mindanao NIS ranges from 119% to 205%. The
relatively higher cropping intensity especially of South Cotabato NIS may be attributed to high percentage of lined canals and the synchronized scheduling.
The cropping intensities by the pump irrigation systems (Banaoang and Libmanan-Cabusao) were among the lowest. The performance of large reservoir-type system
(MARIIS and UPRIIS) was relatively higher than the smaller one (Bohol NIS).

144 | P a g e
Figure 56. Firmed-Up Service Area (FUSA), Program and Actual Irrigated Areas (Wet and Dry) and Cropping Intensities of Different NIS covered in (a) Luzon, (b) Visayas, and (c) Mindanao.
CY FUSAProgram
WetActual Wet
Program
DryActual Dry
Cropping
Intensity
2005
2006
2007
2008
2009
2010
2011
2012 3,127 2,000 1,620 3,000 750 76
2013 1,873 2,311 720 1,812 810 82
2014 1,873 885 721 725 712 77
2015 3,127 885 841 815 758 51
2016 1,873 783 801 85
2017 1,873 995 970 105
79
Banaoang PIS
AVE
-
20
40
60
80
100
120
-
500
1,000
1,500
2,000
2,500
3,000
3,500
2005 2006 2007 2008 2009 2010 2011 2012 2013 2014 2015 2016 2017
Banaoang PIS
FUSA Program Wet Actual Wet
Program Dry Actual Dry Cropping Intensity
CY FUSAProgram
WetActual Wet
Program
DryActual Dry
Cropping
Intensity
2005 4,045 3,310 3,310 1,240 1,240 112
2006 4,045 3,200 3,200 1,000 959 103
2007 4,045 3,200 3,313 1,000 998 107
2008 4,045 3,200 3,310 1,000 1,000 107
2009 4,045 2,680 2,680 1,200 1,271 98
2010 4,045 2,565 2,320 1,275 1,170 86
2011 4,045 2,565 2,525 1,270 1,323 95
2012 4,045 2,565 2,527 1,435 1,501 100
2013 4,045 2,650 2,715 1,545 1,545 105
2014 4,045 2,800 2,805 1,590 1,526 107
2015 4,209 3,380 3,261 2,600 2,508 137
2016 4,799 3,133 3,532 1,745 1,786 111
2017 4,882 3,208 3,536 1,781 3,187 138
108
Ambayoan-Dipalo RIS
AVE
0
20
40
60
80
100
120
140
160
-
1,000
2,000
3,000
4,000
5,000
6,000
2005 2006 2007 2008 2009 2010 2011 2012 2013 2014 2015 2016 2017
Ambayoan-Dipalo RIS
FUSA Program Wet Actual Wet
Program Dry Actual Dry Cropping Intensity
CY FUSAProgram
WetActual Wet
Program
DryActual Dry
Cropping
Intensity
2005 2,777 2,000 1,735 1,600 1,712 124
2006 2,777 2,000 2,015 1,800 2,081 147
2007 2,777 2,200 2,154 2,080 2,150 155
2008 2,777 2,249 2,249 2,249 2,249 162
2009 2,777 2,424 2,364 2,364 2,364 170
2010 2,777 2,574 2,400 2,514 2,400 173
2011 2,777 2,599 2,425 2,539 2,539 179
2012 2,777 2,539 2,539 2,599 2,539 183
2013 2,777 2,589 2,589 771 771 121
2014 2,777 2,589 2,589 2,589 2,590 187
2015 2,777 2,589 2,590 2,589 2,590 187
2016 2,777 2,619 1,810 2,619 2,605 159
2017 2,777 2,704 2,418 2,704 2,646 182
164
Solana-Tugue PIS
AVE
0
20
40
60
80
100
120
140
160
180
200
-
500
1,000
1,500
2,000
2,500
3,000
2005 2006 2007 2008 2009 2010 2011 2012 2013 2014 2015 2016 2017
Solana-Tugue PIS
FUSA Program Wet Actual Wet
Program Dry Actual Dry Cropping Intensity

145 | P a g e
CY FUSAProgram
WetActual Wet
Program
DryActual Dry
Cropping
Intensity
2005 9,390 4,975 4,706 8,994 8,949 145
2006 10,046 4,706 3,791 9,084 8,924 127
2007 10,046 3,000 3,269 9,084 8,635 118
2008 10,044 4,706 5,073 9,078 8,872 139
2009 9,787 5,223 4,107 9,145 9,005 134
2010 9,787 5,708 4,375 9,630 9,148 138
2011 9,787 5,718 4,858 9,640 9,200 144
2012 9,791 5,708 5,200 2,104 9,700 152
2013 9,791 9,607 4,599 5,278 5,362 102
2014 9,791 6,000 5,644 9,760 9,421 154
2015 9,791 6,000 6,204 9,691 9,394 159
2016 10,460 6,827 5,998 10,091 9,716 150
2017 10,467 6,203 7,534 10,098 10,026 168
141
Magapit PIS
AVE
0
20
40
60
80
100
120
140
160
180
-
2,000
4,000
6,000
8,000
10,000
12,000
2005 2006 2007 2008 2009 2010 2011 2012 2013 2014 2015 2016 2017
Magapit PIS
FUSA Program Wet Actual Wet
Program Dry Actual Dry Cropping Intensity
CY FUSAProgram
WetActual Wet
Program
DryActual Dry
Cropping
Intensity
2005 1,409 750 485 1,000 878 97
2006 1,409 750 650 900 891 109
2007 1,409 900 700 1,000 951 117
2008 1,409 950 850 1,100 1,080 137
2009 1,409 1,017 800 1,167 1,080 133
2010 1,409 1,042 605 1,192 1,100 121
2011 1,409 1,140 740 1,290 1,100 131
2012 1,409 1,140 820 1,290 1,100 136
2013 1,409 1,400 662 883 623 91
2014 1,409 1,225 573 1,225 1,140 122
2015 1,409 1,225 518 1,225 1,140 118
2016 1,385 1,225 599 1,225 1,140 126
2017 1,385 1,225 643 1,225 1,140 129
120
Visitacion RIS
AVE
0
20
40
60
80
100
120
140
160
-
200
400
600
800
1,000
1,200
1,400
1,600
2005 2006 2007 2008 2009 2010 2011 2012 2013 2014 2015 2016 2017
Visitacion RIS
FUSA Program Wet Actual Wet
Program Dry Actual Dry Cropping Intensity
CY FUSAProgram
WetActual Wet
Program
DryActual Dry
Cropping
Intensity
2005 22,676 22,250 21,960 22,411 21,808 193
2006 22,676 22,250 22,047 22,250 21,974 194
2007 22,676 22,250 22,118 22,250 22,070 195
2008 22,676 22,361 22,361 22,281 22,270 197
2009 22,676 22,610 22,474 22,474 22,474 198
2010 22,676 22,676 22,812 22,676 22,676 201
2011 22,676 23,118 23,118 23,118 23,118 204
2012 23,926 23,706 23,105 23,706 23,105 193
2013 23,926 23,816 23,258 23,816 23,816 197
2014 23,926 23,891 23,568 23,871 23,560 197
2015 23,926 23,770 23,774 23,720 23,733 199
2016 24,771 23,860 18,502 17,500 19,500 153
2017 25,011 23,775 23,903 23,744 23,844 191
193
MRIIS Division 2
AVE
0
50
100
150
200
250
-
5,000
10,000
15,000
20,000
25,000
30,000
2005 2006 2007 2008 2009 2010 2011 2012 2013 2014 2015 2016 2017
MRIIS Div. 2
FUSA Program Wet Actual Wet
Program Dry Actual Dry Cropping Intensity
CY FUSAProgram
WetActual Wet
Program
DryActual Dry
Cropping
Intensity
2005 19,512 18,146 17,600 18,368 17,746 181
2006 19,512 17,934 17,592 18,320 17,654 181
2007 19,512 17,959 17,549 17,853 17,682 181
2008 19,512 18,121 17,753 17,914 17,685 182
2009 19,512 18,306 17,814 17,951 17,841 183
2010 19,512 18,400 17,704 18,306 17,610 181
2011 19,512 18,507 17,993 18,464 17,832 184
2012 19,414 18,700 18,017 18,627 17,925 185
2013 19,483 18,803 18,123 18,745 18,745 189
2014 19,483 19,143 18,043 19,114 18,147 186
2015 19,483 18,700 18,240 18,058 18,148 187
2016 19,800 18,682 18,086 17,715 18,137 183
2017 19,594 18,249 18,290 18,247 18,253 187
184
MRIIS Division 4
AVE
176
178
180
182
184
186
188
190
16,000
16,500
17,000
17,500
18,000
18,500
19,000
19,500
20,000
2005 2006 2007 2008 2009 2010 2011 2012 2013 2014 2015 2016 2017
MRIIS Div. 4
FUSA Program Wet Actual Wet
Program Dry Actual Dry Cropping Intensity

146 | P a g e
CY FUSAProgram
WetActual Wet
Program
DryActual Dry
Cropping
Intensity
2005 22,591 22,500 21,963 22,500 22,036 195
2006 22,591 22,500 22,079 22,036 21,829 194
2007 22,591 22,400 22,103 22,200 21,882 195
2008 22,591 22,334 22,117 22,323 22,099 196
2009 22,591 22,427 22,245 22,323 22,166 197
2010 22,591 22,246 22,246 22,256 22,178 197
2011 22,591 22,473 22,473 22,256 22,501 199
2012 23,098 22,676 22,676 22,501 22,547 196
2013 23,163 22,856 22,856 22,726 22,903 198
2014 23,163 22,897 22,885 23,038 23,038 198
2015 24,008 22,991 22,967 18,033 18,706 174
2016 23,163 22,967 22,752 20,860 22,861 197
2017 23,163 22,967 23,163 22,718 22,773 198
195
UPRIIS Division 2
AVE
160
165
170
175
180
185
190
195
200
205
-
5,000
10,000
15,000
20,000
25,000
30,000
2005 2006 2007 2008 2009 2010 2011 2012 2013 2014 2015 2016 2017
UPRIIS Div. 2
FUSA Program Wet Actual Wet
Program Dry Actual Dry Cropping Intensity
CY FUSAProgram
WetActual Wet
Program
DryActual Dry
Cropping
Intensity
2005 24,449 23,300 20,738 22,655 22,806 178
2006 25,738 21,019 20,465 22,810 21,944 165
2007 25,738 23,060 22,990 23,060 22,717 178
2008 25,738 24,427 23,850 24,050 25,301 191
2009 26,211 24,904 25,232 25,072 25,970 195
2010 26,211 25,293 25,293 25,970 25,994 196
2011 26,691 28,660 28,660 26,571 26,571 207
2012 30,527 15,833 23,128 32,687 32,687 183
2013 32,687 31,129 31,129 32,687 32,687 195
2014 32,970 31,509 31,509 33,067 31,516 191
2015 32,970 31,509 25,231 24,065 25,485 154
2016 29,662 25,304 22,925 25,480 26,815 168
2017 29,662 23,520 28,051 25,121 25,643 181
183
UPRIIS Division 3
AVE
0
50
100
150
200
250
-
5,000
10,000
15,000
20,000
25,000
30,000
35,000
2005 2006 2007 2008 2009 2010 2011 2012 2013 2014 2015 2016 2017
UPRIIS Div. 3
FUSA Program Wet Actual Wet
Program Dry Actual Dry Cropping Intensity
CY FUSAProgram
WetActual Wet
Program
DryActual Dry
Cropping
Intensity
2005 21,293 15,900 15,900 14,500 15,540 148
2006 19,924 16,200 15,601 16,000 16,633 162
2007 19,924 16,500 16,009 16,500 16,806 165
2008 19,924 18,139 18,800 17,803 18,186 186
2009 19,924 19,000 19,014 19,276 19,308 192
2010 22,504 19,000 19,008 22,000 22,021 182
2011 22,504 19,100 19,107 22,000 22,214 184
2012 24,080 9,209 13,816 23,811 22,854 152
2013 24,307 20,450 20,277 23,843 23,843 182
2014 24,977 21,220 21,244 24,613 24,179 182
2015 24,977 20,608 21,244 14,864 15,591 147
2016 24,349 21,243 20,682 15,600 18,893 163
2017 24,706 21,403 21,768 11,773 20,833 172
170
UPRIIS Division 4
AVE
0
50
100
150
200
250
-
5,000
10,000
15,000
20,000
25,000
30,000
2005 2006 2007 2008 2009 2010 2011 2012 2013 2014 2015 2016 2017
UPRIIS Div. 4
FUSA Program Wet Actual Wet
Program Dry Actual Dry Cropping Intensity
CY FUSAProgram
WetActual Wet
Program
DryActual Dry
Cropping
Intensity
2005 9,303 1,502 820 3,603 3,424 46
2006 7,985 3,455 893 3,455 3,162 51
2007 7,985 1,485 1,089 3,543 3,347 56
2008 7,837 1,500 1,042 4,289 3,838 62
2009 8,637 2,253 2,253 4,195 4,195 75
2010 8,637 2,701 1,116 5,898 4,424 64
2011 8,637 2,789 2,789 5,968 4,503 84
2012 8,637 2,889 433 6,086 4,417 56
2013 10,020 2,022 965 5,322 5,248 62
2014 10,020 1,870 1,870 5,848 6,029 79
2015 10,020 2,170 2,170 7,146 7,146 93
2016 8,103 2,173 1,268 6,716 6,244 93
2017 9,812 2,121 2,320 8,227 7,677 102
71
Pampanga Delta RIS
AVE
0
20
40
60
80
100
120
-
2,000
4,000
6,000
8,000
10,000
12,000
2005 2006 2007 2008 2009 2010 2011 2012 2013 2014 2015 2016 2017
Pampanga Delta RIS
FUSA Program Wet Actual Wet
Program Dry Actual Dry Cropping Intensity

147 | P a g e
CY FUSAProgram
WetActual Wet
Program
DryActual Dry
Cropping
Intensity
2005 26,791 18,718 17,428 23,529 23,240 152
2006 26,791 18,742 17,317 25,163 23,625 153
2007 26,791 18,178 18,396 22,794 24,504 160
2008 26,791 20,356 17,930 27,658 26,071 164
2009 24,593 19,446 19,446 23,013 22,868 172
2010 24,593 21,181 20,648 25,628 24,111 182
2011 26,791 22,108 22,105 26,328 26,328 181
2012 26,791 22,322 22,381 26,545 26,328 182
2013 26,981 23,376 22,296 26,437 26,328 180
2014 26,981 22,846 14,891 26,878 26,383 153
2015 26,981 23,750 15,971 23,667 23,667 147
2016 26,734 23,750 14,423 23,667 23,068 140
2017 26,734 23,750 20,027 23,068 23,182 162
164
Angat-Maasim RIS
AVE
0
20
40
60
80
100
120
140
160
180
200
-
5,000
10,000
15,000
20,000
25,000
30,000
2005 2006 2007 2008 2009 2010 2011 2012 2013 2014 2015 2016 2017
Angat-Maasim RIS
FUSA Program Wet Actual Wet
Program Dry Actual Dry Cropping Intensity
Region 4B
CY FUSAProgram
WetActual Wet
Program
DryActual Dry
Cropping
Intensity
2005 1,990 1,800 1,490 600 350 92
2006 1,990 1,650 1,427 350 450 94
2007 1,990 1,000 1,147 409 412 78
2008 1,990 1,600 1,237 600 480 86
2009 1,990 1,230 1,250 400 400 83
2010 1,990 1,400 1,256 220 56 66
2011 1,990 1,226 1,070 220 248 66
2012 1,990 1,050 1,100 300 250 68
2013 1,990 1,100 1,122 150 200 66
2014 1,990 1,100 1,331 150 150 74
2015 1,990 1,213 1,220 250 172 70
2016 1,990 1,100 1,100 180 180 64
2017 1,990 1,100 1,200 170 200 70
75
Caguray RIS
AVE
0
10
20
30
40
50
60
70
80
90
100
-
500
1,000
1,500
2,000
2,500
2005 2006 2007 2008 2009 2010 2011 2012 2013 2014 2015 2016 2017
Caguray RIS
FUSA Program Wet Actual Wet
Program Dry Actual Dry Cropping Intensity
CY FUSAProgram
WetActual Wet
Program
DryActual Dry
Cropping
Intensity
2005 2,752 2,630 2,543 2,690 2,174 171
2006 2,752 2,600 2,127 2,600 2,199 157
2007 2,752 2,590 1,893 2,736 2,217 149
2008 2,752 2,712 2,219 2,712 2,218 161
2009 2,752 2,712 2,216 2,712 2,317 165
2010 2,752 2,363 2,244 2,409 2,409 169
2011 2,752 2,507 2,339 2,632 2,255 167
2012 2,752 2,619 2,421 2,564 2,361 174
2013 2,766 2,766 2,344 2,766 2,420 172
2014 2,769 2,734 2,068 2,769 2,223 155
2015 2,766 2,480 2,784 2,062 2,273 183
2016 2,816 2,687 2,687 191
2017 2,816 2,694 2,687 191
170
Dumacaa RIS
AVE
0
50
100
150
200
250
-
500
1,000
1,500
2,000
2,500
3,000
2005 2006 2007 2008 2009 2010 2011 2012 2013 2014 2015 2016 2017
Dumacaa RIS
FUSA Program Wet Actual Wet
Program Dry Actual Dry Cropping Intensity
CY FUSAProgram
WetActual Wet
Program
DryActual Dry
Cropping
Intensity
2005 2,076 1,300 1,520 65 3
2006 2,076 1,500 924 45
2007 2,076 1,172 1,070 1,010 1,136 106
2008 2,076 1,510 940 1,424 1,424 114
2009 2,076 1,610 1,424 1,424 69
2010 2,076 1,800 1,445 1,613 1,421 138
2011 2,076 1,613 1,606 1,500 1,042 128
2012 2,195 1,613 1,076 1,500 1,503 117
2013 2,195 2,076 2,076 940 43
2014 2,195 1,613 1,002 1,500 1,503 114
2015 2,195 1,150 920 1,635 1,171 95
2016 2,195 1,204 1,204 1,204 1,187 109
2017 2,195 1,204 1,204 1,204 1,204 110
92
Libmanan-Cabusao PIS
AVE
0
20
40
60
80
100
120
140
160
-
500
1,000
1,500
2,000
2,500
2005 2006 2007 2008 2009 2010 2011 2012 2013 2014 2015 2016 2017
Libmanan-Cabusao PIS
FUSA Program Wet Actual Wet
Program Dry Actual Dry Cropping Intensity
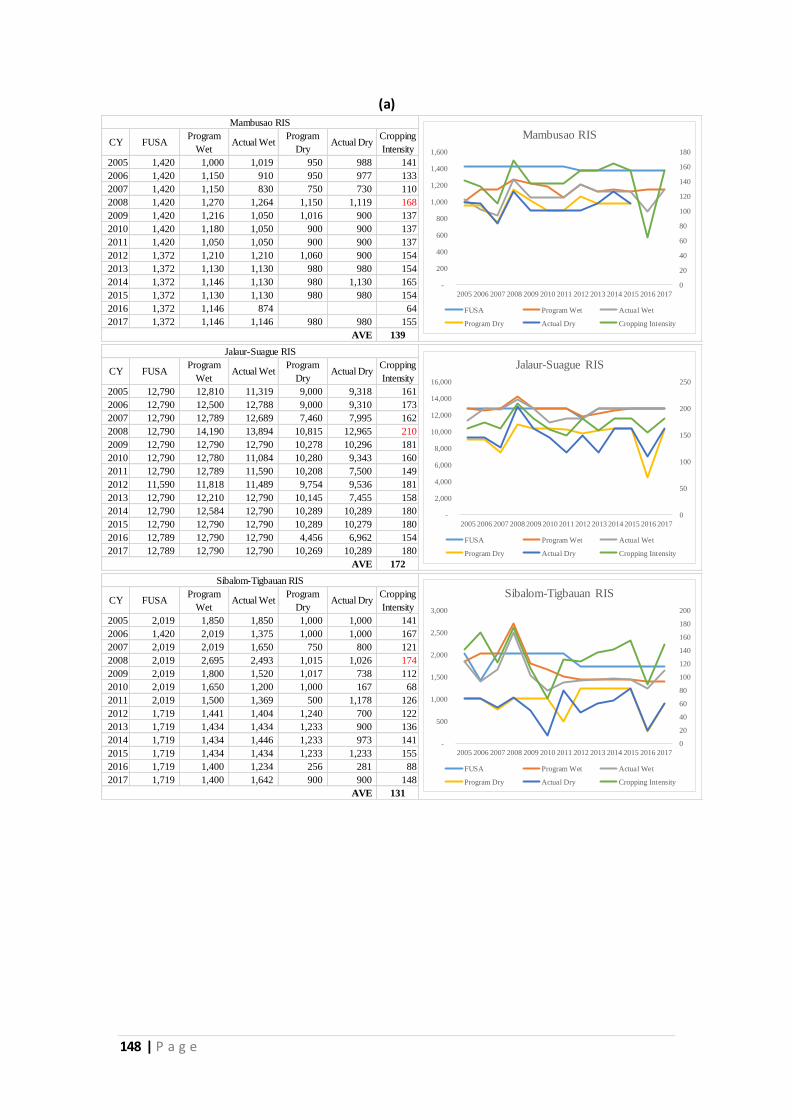
148 | P a g e
(a)
CY FUSAProgram
WetActual Wet
Program
DryActual Dry
Cropping
Intensity
2005 1,420 1,000 1,019 950 988 141
2006 1,420 1,150 910 950 977 133
2007 1,420 1,150 830 750 730 110
2008 1,420 1,270 1,264 1,150 1,119 168
2009 1,420 1,216 1,050 1,016 900 137
2010 1,420 1,180 1,050 900 900 137
2011 1,420 1,050 1,050 900 900 137
2012 1,372 1,210 1,210 1,060 900 154
2013 1,372 1,130 1,130 980 980 154
2014 1,372 1,146 1,130 980 1,130 165
2015 1,372 1,130 1,130 980 980 154
2016 1,372 1,146 874 64
2017 1,372 1,146 1,146 980 980 155
139
Mambusao RIS
AVE
0
20
40
60
80
100
120
140
160
180
-
200
400
600
800
1,000
1,200
1,400
1,600
2005 2006 2007 2008 2009 2010 2011 2012 2013 2014 2015 2016 2017
Mambusao RIS
FUSA Program Wet Actual Wet
Program Dry Actual Dry Cropping Intensity
CY FUSAProgram
WetActual Wet
Program
DryActual Dry
Cropping
Intensity
2005 12,790 12,810 11,319 9,000 9,318 161
2006 12,790 12,500 12,788 9,000 9,310 173
2007 12,790 12,789 12,689 7,460 7,995 162
2008 12,790 14,190 13,894 10,815 12,965 210
2009 12,790 12,790 12,790 10,278 10,296 181
2010 12,790 12,780 11,084 10,280 9,343 160
2011 12,790 12,789 11,590 10,208 7,500 149
2012 11,590 11,818 11,489 9,754 9,536 181
2013 12,790 12,210 12,790 10,145 7,455 158
2014 12,790 12,584 12,790 10,289 10,289 180
2015 12,790 12,790 12,790 10,289 10,279 180
2016 12,789 12,790 12,790 4,456 6,962 154
2017 12,789 12,790 12,790 10,269 10,289 180
172
Jalaur-Suague RIS
AVE
0
50
100
150
200
250
-
2,000
4,000
6,000
8,000
10,000
12,000
14,000
16,000
2005 2006 2007 2008 2009 2010 2011 2012 2013 2014 2015 2016 2017
Jalaur-Suague RIS
FUSA Program Wet Actual Wet
Program Dry Actual Dry Cropping Intensity
CY FUSAProgram
WetActual Wet
Program
DryActual Dry
Cropping
Intensity
2005 2,019 1,850 1,850 1,000 1,000 141
2006 1,420 2,019 1,375 1,000 1,000 167
2007 2,019 2,019 1,650 750 800 121
2008 2,019 2,695 2,493 1,015 1,026 174
2009 2,019 1,800 1,520 1,017 738 112
2010 2,019 1,650 1,200 1,000 167 68
2011 2,019 1,500 1,369 500 1,178 126
2012 1,719 1,441 1,404 1,240 700 122
2013 1,719 1,434 1,434 1,233 900 136
2014 1,719 1,434 1,446 1,233 973 141
2015 1,719 1,434 1,434 1,233 1,233 155
2016 1,719 1,400 1,234 256 281 88
2017 1,719 1,400 1,642 900 900 148
131
Sibalom-Tigbauan RIS
AVE
0
20
40
60
80
100
120
140
160
180
200
-
500
1,000
1,500
2,000
2,500
3,000
2005 2006 2007 2008 2009 2010 2011 2012 2013 2014 2015 2016 2017
Sibalom-Tigbauan RIS
FUSA Program Wet Actual Wet
Program Dry Actual Dry Cropping Intensity

149 | P a g e
CY FUSAProgram
WetActual Wet
Program
DryActual Dry
Cropping
Intensity
2005 1,700 1,325 988 900 975 115
2006 1,420 1,420 1,028 1,050 937 138
2007 1,700 1,400 1,050 1,030 949 118
2008 1,700 2,210 2,141 1,364 1,262 200
2009 1,700 1,633 1,589 1,113 1,071 156
2010 1,700 1,600 1,599 840 818 142
2011 1,700 1,600 1,599 900 1,151 162
2012 1,700 1,617 1,627 1,208 982 153
2013 1,700 1,642 1,630 1,233 911 149
2014 1,700 1,616 1,616 1,278 1,024 155
2015 1,700 1,616 1,616 1,024 1,208 166
2016 1,700 1,616 1,616 729 756 140
2017 1,825 1,616 1,616 1,208 152 97
146
Barotac Viejo RIS
AVE
0
50
100
150
200
250
-
500
1,000
1,500
2,000
2,500
2005 2006 2007 2008 2009 2010 2011 2012 2013 2014 2015 2016 2017
Barotac Viejo RIS
FUSA Program Wet Actual Wet
Program Dry Actual Dry Cropping Intensity
CY FUSAProgram
WetActual Wet
Program
DryActual Dry
Cropping
Intensity
2005
2006
2007 4,973 3,200 2,748 3,000 2,968 115
2008 4,387 2,968 2,968 2,968 3,304 143
2009 4,000 4,000 3,218 3,000 3,300 163
2010 4,000 3,500 3,166 3,000 3,244 160
2011 4,000 4,000 3,325 3,500 3,356 167
2012 4,000 4,000 4,000 3,500 3,368 184
2013 4,740 3,600 3,492 3,500 3,452 146
2014 4,740 3,780 3,500 3,600 3,149 140
2015 4,740 3,780 3,402 3,600 3,589 147
2016 4,740 3,500 3,499 2,250 2,573 128
2017 4,740 3,550 3,841 3,500 3,662 158
150
Malinao IS
AVE
-
20
40
60
80
100
120
140
160
180
200
-
1,000
2,000
3,000
4,000
5,000
6,000
2005 2006 2007 2008 2009 2010 2011 2012 2013 2014 2015 2016 2017
Malinao IS
FUSA Program Wet Actual Wet
Program Dry Actual Dry Cropping Intensity
CY FUSAProgram
WetActual Wet
Program
DryActual Dry
Cropping
Intensity
2005
2006
2007
2008 800 800 800 1,800 2,700
2009 4,140 2,000 1,900 2,500 2,000 94
2010 3,153 2,500 2,500 3,000 2,700 165
2011 3,153 3,295 2,586 3,153 2,644 166
2012 3,295 3,295 3,295 3,300 2,809 185
2013 3,955 2,810 2,405 2,800 2,566 126
2014 3,955 2,858 2,603 2,858 2,602 132
2015 3,855 2,858 2,650 2,858 2,669 138
2016 4,084 2,858 1,040 2,375 2,510 87
2017 4,084 2,858 2,922 2,858 2,877 142
137
Bayongan IS
AVE
-
20
40
60
80
100
120
140
160
180
200
-
500
1,000
1,500
2,000
2,500
3,000
3,500
4,000
4,500
2005 2006 2007 2008 2009 2010 2011 2012 2013 2014 2015 2016 2017
Bayongan IS
FUSA Program Wet Actual Wet
Program Dry Actual Dry Cropping Intensity
CY FUSAProgram
WetActual Wet
Program
DryActual Dry
Cropping
Intensity
2005 539 400 250 350 200 83
2006 539 450 600 450 392 184
2007 539 150 157 530 433 109
2008 539 433 461 433 486 176
2009 700 700 511 650 511 146
2010 600 600 568 550 642 202
2011 600 730 624 730 617 207
2012 730 730 730 730 672 192
2013 1,160 680 687 700 680 118
2014 1,160 700 700 690 592 111
2015 1,160 700 350 700 680 89
2016 1,210 700 98 230 435 44
2017 1,210 600 694 700 746 119
137
Capayas IS
AVE
0
50
100
150
200
250
-
200
400
600
800
1,000
1,200
1,400
2005 2006 2007 2008 2009 2010 2011 2012 2013 2014 2015 2016 2017
Capayas IS
FUSA Program Wet Actual Wet
Program Dry Actual Dry Cropping Intensity

150 | P a g e
(b)
CY FUSAProgram
WetActual Wet
Program
DryActual Dry
Cropping
Intensity
2005 5,391 4,450 4,002 4,250 3,600 141
2006 5,906 4,500 4,171 5,000 4,176 141
2007 5,906 4,468 3,921 4,614 4,190 137
2008 6,394 4,665 4,665 5,300 4,750 147
2009 6,394 5,038 4,835 5,281 4,981 154
2010 6,394 5,489 5,498 5,489 4,934 163
2011 6,394 5,788 5,613 5,788 5,621 176
2012 6,394 5,834 5,673 5,834 5,654 177
2013 6,394 5,986 5,906 6,000 6,129 188
2014 6,444 6,061 6,159 6,034 6,077 190
2015 6,444 6,240 5,135 6,186 6,226 176
2016 6,672 6,072 5,332 4,981 5,633 164
2017 6,722 5,830 6,245 5,968 6,081 183
165
Binahaan-Tibak RIS
AVE
0
20
40
60
80
100
120
140
160
180
200
-
1,000
2,000
3,000
4,000
5,000
6,000
7,000
8,000
2005 2006 2007 2008 2009 2010 2011 2012 2013 2014 2015 2016 2017
Binahaan-TIbak RIS
FUSA Program Wet Actual Wet
Program Dry Actual Dry Cropping Intensity
CY FUSAProgram
WetActual Wet
Program
DryActual Dry
Cropping
Intensity
2005 1,057 1,496 1,349 1,396 820 205
2006 2,458 1,400 1,333 1,890 1,717 124
2007 2,458 1,900 1,946 1,890 2,262 171
2008 2,362 2,362 2,362 2,362 2,362 200
2009 2,362 2,362 2,171 2,362 2,182 184
2010 2,362 2,182 2,182 2,182 2,182 185
2011 2,362 2,182 2,182 2,182 2,182 185
2012 2,362 2,182 2,182 2,182 2,182 185
2013 2,362 2,182 2,182 2,182 2,226 187
2014 2,405 2,277 2,351 2,182 2,226 190
2015 2,405 2,379 2,414 2,337 2,326 197
2016 2,527 2,371 2,464 2,093 2,438 194
2017 2,548 2,441 2,498 2,441 2,498 196
185
Daguitan-Guinarona-Marabong RIS
AVE
0
50
100
150
200
250
-
500
1,000
1,500
2,000
2,500
3,000
2005 2006 2007 2008 2009 2010 2011 2012 2013 2014 2015 2016 2017
Daguitan-Guinarona-Marabong RIS
FUSA Program Wet Actual Wet
Program Dry Actual Dry Cropping Intensity
CY FUSAProgram
WetActual Wet
Program
DryActual Dry
Cropping
Intensity
2005 1,554 1,500 1,287 1,500 1,356 170
2006 1,554 1,500 1,543 1,500 1,836 217
2007 1,600 1,550 1,621 1,550 1,712 208
2008 1,800 1,674 1,537 2,171 2,070 200
2009 1,800 1,725 1,713 1,725 1,754 193
2010 1,800 1,759 1,816 1,759 1,902 207
2011 1,800 1,868 1,865 1,868 1,851 206
2012 1,800 1,835 1,833 1,835 1,830 204
2013 2,170 1,870 1,813 1,825 1,804 167
2014 2,170 795 820 1,810 1,865 124
2015 2,170 800 888 800 871 81
2016 2,170 805 843 850 823 77
2017 2,170 850 860 860 872 80
164
Manupali RIS
AVE
0
50
100
150
200
250
-
500
1,000
1,500
2,000
2,500
2005 2006 2007 2008 2009 2010 2011 2012 2013 2014 2015 2016 2017
Manupali RIS
FUSA Program Wet Actual Wet
Program Dry Actual Dry Cropping Intensity
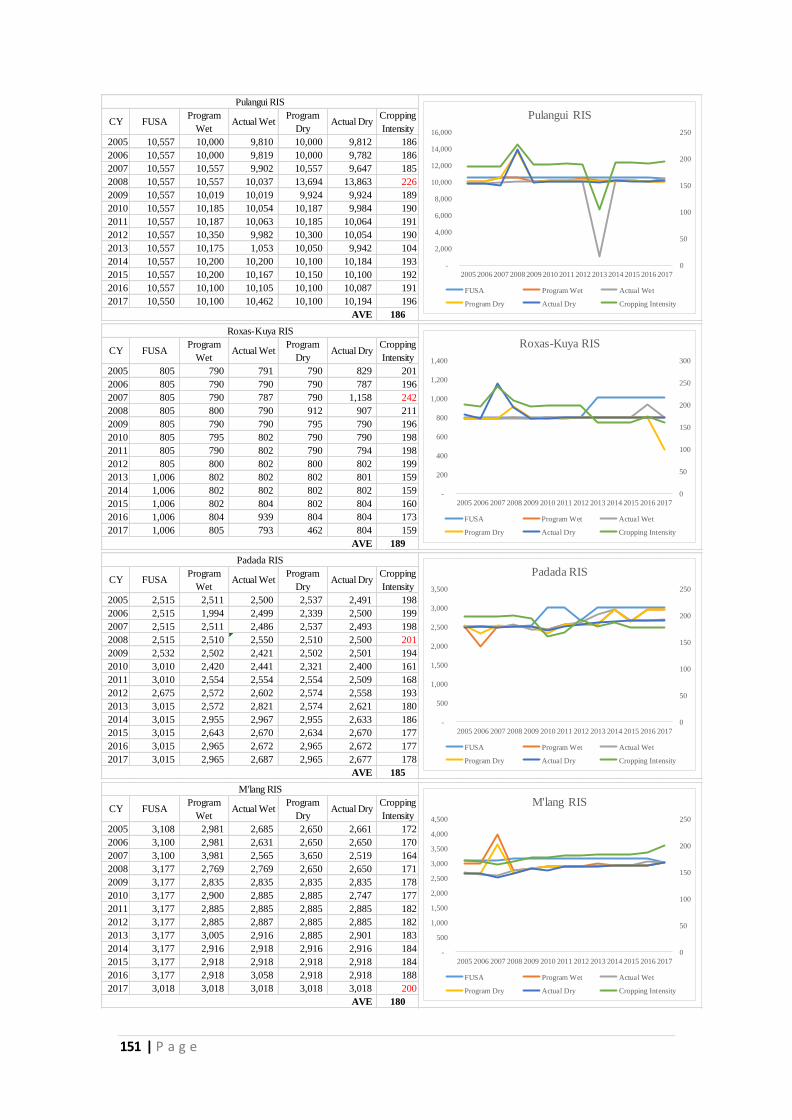
151 | P a g e
CY FUSAProgram
WetActual Wet
Program
DryActual Dry
Cropping
Intensity
2005 10,557 10,000 9,810 10,000 9,812 186
2006 10,557 10,000 9,819 10,000 9,782 186
2007 10,557 10,557 9,902 10,557 9,647 185
2008 10,557 10,557 10,037 13,694 13,863 226
2009 10,557 10,019 10,019 9,924 9,924 189
2010 10,557 10,185 10,054 10,187 9,984 190
2011 10,557 10,187 10,063 10,185 10,064 191
2012 10,557 10,350 9,982 10,300 10,054 190
2013 10,557 10,175 1,053 10,050 9,942 104
2014 10,557 10,200 10,200 10,100 10,184 193
2015 10,557 10,200 10,167 10,150 10,100 192
2016 10,557 10,100 10,105 10,100 10,087 191
2017 10,550 10,100 10,462 10,100 10,194 196
186
Pulangui RIS
AVE
0
50
100
150
200
250
-
2,000
4,000
6,000
8,000
10,000
12,000
14,000
16,000
2005 2006 2007 2008 2009 2010 2011 2012 2013 2014 2015 2016 2017
Pulangui RIS
FUSA Program Wet Actual Wet
Program Dry Actual Dry Cropping Intensity
CY FUSAProgram
WetActual Wet
Program
DryActual Dry
Cropping
Intensity
2005 805 790 791 790 829 201
2006 805 790 790 790 787 196
2007 805 790 787 790 1,158 242
2008 805 800 790 912 907 211
2009 805 790 790 795 790 196
2010 805 795 802 790 790 198
2011 805 790 802 790 794 198
2012 805 800 802 800 802 199
2013 1,006 802 802 802 801 159
2014 1,006 802 802 802 802 159
2015 1,006 802 804 802 804 160
2016 1,006 804 939 804 804 173
2017 1,006 805 793 462 804 159
189
Roxas-Kuya RIS
AVE
0
50
100
150
200
250
300
-
200
400
600
800
1,000
1,200
1,400
2005 2006 2007 2008 2009 2010 2011 2012 2013 2014 2015 2016 2017
Roxas-Kuya RIS
FUSA Program Wet Actual Wet
Program Dry Actual Dry Cropping Intensity
CY FUSAProgram
WetActual Wet
Program
DryActual Dry
Cropping
Intensity
2005 2,515 2,511 2,500 2,537 2,491 198
2006 2,515 1,994 2,499 2,339 2,500 199
2007 2,515 2,511 2,486 2,537 2,493 198
2008 2,515 2,510 2,550 2,510 2,500 201
2009 2,532 2,502 2,421 2,502 2,501 194
2010 3,010 2,420 2,441 2,321 2,400 161
2011 3,010 2,554 2,554 2,554 2,509 168
2012 2,675 2,572 2,602 2,574 2,558 193
2013 3,015 2,572 2,821 2,574 2,621 180
2014 3,015 2,955 2,967 2,955 2,633 186
2015 3,015 2,643 2,670 2,634 2,670 177
2016 3,015 2,965 2,672 2,965 2,672 177
2017 3,015 2,965 2,687 2,965 2,677 178
185
Padada RIS
AVE
0
50
100
150
200
250
-
500
1,000
1,500
2,000
2,500
3,000
3,500
2005 2006 2007 2008 2009 2010 2011 2012 2013 2014 2015 2016 2017
Padada RIS
FUSA Program Wet Actual Wet
Program Dry Actual Dry Cropping Intensity
CY FUSAProgram
WetActual Wet
Program
DryActual Dry
Cropping
Intensity
2005 3,108 2,981 2,685 2,650 2,661 172
2006 3,100 2,981 2,631 2,650 2,650 170
2007 3,100 3,981 2,565 3,650 2,519 164
2008 3,177 2,769 2,769 2,650 2,650 171
2009 3,177 2,835 2,835 2,835 2,835 178
2010 3,177 2,900 2,885 2,885 2,747 177
2011 3,177 2,885 2,885 2,885 2,885 182
2012 3,177 2,885 2,887 2,885 2,885 182
2013 3,177 3,005 2,916 2,885 2,901 183
2014 3,177 2,916 2,918 2,916 2,916 184
2015 3,177 2,918 2,918 2,918 2,918 184
2016 3,177 2,918 3,058 2,918 2,918 188
2017 3,018 3,018 3,018 3,018 3,018 200
180
M'lang RIS
AVE
0
50
100
150
200
250
-
500
1,000
1,500
2,000
2,500
3,000
3,500
4,000
4,500
2005 2006 2007 2008 2009 2010 2011 2012 2013 2014 2015 2016 2017
M'lang RIS
FUSA Program Wet Actual Wet
Program Dry Actual Dry Cropping Intensity

152 | P a g e
(c)
(Source: NISPER 2005-2017)
5.1.9. Other Technical Issue: Canal Operation and Maintenance
Bench Flume. Most of the visited NIS uses bench flume design (rectangular canal) in
the lining of Main and Lateral canals (Photos 90 and 91). Compared to the rectangular cross-section design, rectangular section occupies less space and lesser earthworks
making it faster to construct and lower in cost. However, the design section of NIA should look or study the bench flume design in terms of hydraulic efficiency. Flow efficiency is very critical during low water supply. The design should consider a canal
discharge level that would need the use of bench flume as canal cross-section.
CY FUSAProgram
WetActual Wet
Program
DryActual Dry
Cropping
Intensity
2005 5,562 3,006 1,817 2,641 1,520 60
2006 5,562 3,000 2,247 2,700 2,109 78
2007 5,562 3,000 2,249 2,700 2,050 77
2008 5,562 3,085 2,508 4,190 3,400 106
2009 5,562 4,004 3,548 3,829 3,829 133
2010 5,562 3,869 3,415 3,869 3,069 117
2011 5,562 3,560 2,771 3,560 3,383 111
2012 4,399 3,482 1,399 3,482 2,896 98
2013 4,027 3,651 3,831 3,651 3,274 176
2014 5,068 4,304 4,369 4,304 3,806 161
2015 5,068 4,433 4,202 4,433 3,788 158
2016 5,527 4,433 3,062 4,433 4,191 131
2017 5,527 4,482 4,452 4,482 3,418 142
119
Maridagao RIS (MalMar 2)
AVE
0
20
40
60
80
100
120
140
160
180
200
-
1,000
2,000
3,000
4,000
5,000
6,000
2005 2006 2007 2008 2009 2010 2011 2012 2013 2014 2015 2016 2017
Maridagao RIS (MalMar 2)
FUSA Program Wet Actual Wet
Program Dry Actual Dry Cropping Intensity
CY FUSAProgram
WetActual Wet
Program
DryActual Dry
Cropping
Intensity
2005 1,885 1,788 1,807 1,788 1,798 191
2006 1,802 1,806 1,809 1,798 1,796 200
2007 1,802 1,806 1,844 1,798 1,801 202
2008 1,842 1,841 1,813 2,051 3,307 278
2009 1,842 1,868 1,881 1,868 1,878 204
2010 1,878 1,878 1,898 1,865 1,879 201
2011 1,878 1,859 1,853 1,859 1,879 199
2012 1,878 1,865 1,873 1,865 1,863 199
2013 1,913 1,950 1,902 1,905 1,871 197
2014 1,994 1,950 1,904 1,900 1,905 191
2015 1,994 1,995 2,039 1,995 1,904 198
2016 2,046 2,042 2,027 2,039 2,042 199
2017 2,042 2,013 2,018 2,015 2,019 198
204
Marbel #1 RIS
AVE
0
50
100
150
200
250
300
-
500
1,000
1,500
2,000
2,500
3,000
3,500
2005 2006 2007 2008 2009 2010 2011 2012 2013 2014 2015 2016 2017
Marbel #1 RIS
FUSA Program Wet Actual Wet
Program Dry Actual Dry Cropping Intensity
CY FUSAProgram
WetActual Wet
Program
DryActual Dry
Cropping
Intensity
2005 2,607 2,542 2,541 2,534 2,495 193
2006 2,499 2,541 2,536 2,495 2,487 201
2007 2,499 2,542 2,539 2,534 2,520 202
2008 2,546 2,539 2,525 3,590 4,494 276
2009 2,546 2,539 2,451 2,535 2,514 195
2010 2,546 2,530 2,529 2,530 2,456 196
2011 2,546 2,522 2,565 2,522 2,562 201
2012 2,546 2,530 2,569 2,530 2,575 202
2013 2,635 2,637 2,668 2,567 2,570 199
2014 2,745 2,745 2,765 2,717 2,717 200
2015 2,745 2,799 2,765 2,765 2,780 202
2016 2,780 2,765 2,781 2,765 2,765 199
2017 2,799 2,784 2,763 2,758 2,758 197
205
Banga RIS
AVE
0
50
100
150
200
250
300
-
500
1,000
1,500
2,000
2,500
3,000
3,500
4,000
4,500
5,000
2005 2006 2007 2008 2009 2010 2011 2012 2013 2014 2015 2016 2017
Banga RIS
FUSA Program Wet Actual Wet
Program Dry Actual Dry Cropping Intensity

153 | P a g e
Photo 90. Section of Main Canal of Visitacion NIS
Photo 91. Section of Lateral G6 of Pulangui RIS.
MAINs Problem? As part of the original design of irrigation systems, the Main and
Lateral canals should be lined for the system to have high conveyance efficienc ies. These canal carries large volume of water which makes it prone to high seepage and percolation as well as erosion. However, lining or even rehabilitating the Main Canal
of an operational NIS pose a very big problem, not only for the operation but also the socio-economic impact. A NIS will cut off water supply for about two months only. In
this period, the length for lining or rehabilitation will not be significant. It will take

154 | P a g e
about a year or two to line a significant section of Main Canal of a particular NIS. One could compare this during road repairs of main thorough fares in the Philippines. But,
cutting the water supply of a given NIS for one year will affect livelihood of the farmers as well as the target rice yield of the area. For example, if the 21 kms of unlined section
of the Main Canal (Photo 92) of Jalaur RIS will be lined, it will affect about 8,200 has of farms in Iloilo. Thorough planning and use of advance construction technology (or methodology) will be needed to properly execute lining of Main Canal. For example,
at the time of survey, sections of Main Canal of Padada RIS were being lined (Photo 93). Lining of the Main Canal could pose a problem during operation. A system could
only have a water cut off of around two months. In this period, only a small portion could be lined depending on the condition. The lining of the MC of Padada RIS has to be temporarily suspended (Photo 94). However, total system closure for one to two
croppings is a bigger problem.
Photo 92. Section of Main Canal, Jalaur Proper RIS that meander.

155 | P a g e
Photo 93. Unfinished construction of Main canal of Padada RIS.
Photo 94. Unfinished construction of Main canal of Padada RIS near Lateral A.
Lock or Not. In all NIS cases covered, one of the most common problem during operation was the illegal opening of gates (Laterals and turnouts). In some of the NIS
surveyed, gates were being padlocked (Photo 95) to avoid illegal opening. While some of the gates were confined and protected with padlocked gates (entrance). But only in
some of the NIS surveyed in Mindanao (Photo 96) where gates are being welded (permanent). In fact, Bukidnon IMO was planning in procuring more portable welding machine for this purpose. Padlocks are prone to breakdown and sometimes stolen thus,
gates were being welded.

156 | P a g e
Photo 95. Gate in Cavite FLIS.
Photo 96. Gates in Banga RIS.
Trapped! Some of the floating debris in the Main and Lateral canals were trapped near the checkgates (Photos 97 and 98). However, removal of debris is a big problem with
NIS with wide canals like Angat-Maasim RIS, Pampanga Delta RIS, UPRIIS, MARIIS, Libmanan-Cabusao PIS, Binahaan-Tibak RIS, Jalaur RIS and Malitubog-Maridagao
RIS. To remove debris in a wide canal section, one may need long poles, a platform to stand during operation and some NIS even uses back hoe equipment.

157 | P a g e
Photo 97. Section of Main Canal of Angat-Maasim RIS.
Photo 98. Debris trapped in a check gate along Main Canal of Malitubog-Maridagao RIS.
Innovations? Some structures in the NIS in Mindanao looks weird, at least at the
technical point of view. But this was the adjustments made by people from ground (operations) to cope up with actual situations. For example, Lateral A of Padada RIS
has two headgates (Photo 99). Additional (second headgate, Photo 100) gate was installed because water spills on this section during high flows. On the other hand, additional canal was installed beside the existing lined canal of Lateral F, Banga RIS
(Photo 101). Additional areas for expansion was added on the tail-end part of Lateral F. This will require increasing the cross-sectional area of canal to accommodate higher
discharge rate. To avoid demolition of a part of the existing canal, additional canal was constructed beside it, making it a double canal.

158 | P a g e
Photo 99. Second headgate of Lateral A of Padada RIS.
Photo 100. First (original) headgate of Lateral A of Padada RIS.
Photo 101. The “double” canal of Lateral F, Banga RIS.

159 | P a g e
5.2. Results of FGDs and IA Interviews
In this report, only initial findings based on Interviews (KII and FGDs) are discussed in relation to the Institutional/Technical evaluation of the NIS covered.
The team interviewed 151 irrigators association (IAs) from the different National
Irrigation System across the country. The IAs was selected to represent upstream, midstream, and downstream sentiment of farmers.
The summary of IA Functionality Survey from 2013 to 2017 is presented in Table 29. Most of the IAs are in the Very Satisfactory and Satisfactory rating. The IAs surveyed
in MARIIS and UPRIIS have a rating of Satisfactory to Outstanding.
Table 29. Summary IA Functionality Survey from 2013 to 2017
REGION Average no. of IA organized
Average no. of IA evaluated
% IA IA functionality rating average
O VS S FAIR POOR
1 277 242 87.5 10 117 97 16 2
MRIIS 358 355 99.2 126 216 13 0 0
2 174 164 94.2 18 91 53 2 0
UPRIIS 412 394 95.4 191 202 0 0 0
3 300 252 83.9 19 165 65 2 0
4A 88 83 94.3 1 29 40 12 1
4B 112 95 85.5 6 30 47 12 1
5 79 73 91.9 10 29 29 3 2
6 165 161 97.1 2 36 64 46 13
7 84 84 99.5 11 65 8 0 0
8 83 81 97.8 12 36 26 6 1
10 97 83 85.6 11 38 26 9 0
11 128 126 98.0 47 58 19 0 2
12 241 226 93.8 21 110 72 22 1
TOTAL 2599 2418 93.0 483 1221 559 130 24
5.2.1. Technical
The usual problems pertaining to irrigation were asked of the respondents. The top 3 problems elicited from the respondents were: 1) Siltation; 2) Shortage of water due to
water schedule or stealing of water (internal); and 3) Shortage of water due to environmental limitation.
Siltation has already been a common problem in the irrigation system. This could be due to natural causes or structural causes. This poses significant threat to the farmers as
it further decreases the available water in the system and increases the efficiency losses of the canal. As in NIS cases in Luzon, siltation is also a major concern especially in

160 | P a g e
Jalaur RIS where the 8-meter-wide main canal have been reduced to a width of 1 meter due to siltation.
Shortage of water due to scheduling or stealing of water is an institutional and
organizational issue. This pertains to the effectivity and efficiency of the management of IAs towards their members. Rampant occurrence of water stealing should be supported by institutional policies and strict organizational enforcement. Note that this
should not be confused with “shortage due to scheduling brought about by NIA or other agencies”. The latter, which gained minimal vote, is merely poor coordination and
operation of the irrigation system. Finally, the third most common problem is shortage of water due to environment a l
limitation. This is very common among different irrigation systems since many watersheds which produce irrigation water were mismanaged. In effect, some farmers
are constructing illegal turnouts to avail of canal water and check dams to elevate water level or use pumps to draw water from the canals. Others adopt drainage water re use by pumping water from creeks.
Other notable common problems of farmers are: canal repair, farm-to-market road,
shortage due to engineering limitations and/or design.
Table 30. Problems encountered by farmers related to irrigation
Problems Luzon Visayas Mindanao
Siltation 9 4 16
Solid waste 6 3 5
Canal repair 10 15 6
Earth canal to be lined 7 3 12
Dam repair 1 0 0
Gates for repair 2 3 12
Shortage of water due to environmental limitation 6 18 3
Shortage of water due to engineering limitation 9 5 16
Farm to market road 10 9 9
Shortage of water due to water schedule or stealing of water/institutional cause (internal)
20 64 53
Shortage of water due to water schedule or stealing of water/institutional cause (due to NIA or government)
12 12 40
no answer 13 1 1
Number of responses 105 137 173
Number of respondents 65 48 39
Therefore, given the problems that encountered, the interviewed IAs were inquired of different set of questions pertaining to their satisfaction rate and perception on different
technical, economic, and institutional situation and indicator questions which affects their performance.

161 | P a g e
It was highly regarded by the farmers that NIA provides regular support to the farmers. Majority of the IAs affirmed that they receive regular support of different type. The
most common support that NIA provide to the farmers is in terms of technical. This includes providing different types of trainings, seminars, and other consults and advice
that would enhance the capability of the farmers in the efficient management of their system. On the other hand, the least common support that NIA provide is in terms of equipment and other physical and structural support. This could be attributed to the
limited resources of the organization in providing adequate equipment and other physical support needs.
The IAs were also asked if the group had already made modifications in the irriga t ion structures provided. Although majority of the IAs did not have any modifications, the
few groups that that were asked what modifications were made usually spend it in the lining of earth canals and repair of irrigation infrastructure. Note that the commonality
between modifications pertains to addressing siltation. IAs that did not have modifications in their structure, and even those that have already had modifications, mentioned that their main constraint for improving their facilities is due to their
financial resource limitation. Furthermore, farmers affirmed some of the observations during the walk-throughs wherein some canal structures in many NIS cases covered are
damaged and missing. Pumps were also used by some members as indicated in Table 31. This is not
uncommon since many members experience difficulty in accessing irrigation water even with the assistance of NIA. These were affirmed during the field visits and
checking with the groundwater potential map of specific NIS cases. Coping mechanisms by farmers during dry spell or low water supply is presented in Table 32.
The results in Table 31 also indicate that majority of the IAs practice scheduling or rotational irrigation. The usual preferred irrigation flow practiced by the IAs is upstream
to downstream which would flow through different irrigation zones. There are usually around 7 irrigation zones per IA which are commonly divided based on their lateral identification. The scheduling of irrigation water is just one of the policies formula ted
to have equitable and efficient use of the natural resource. Results reflect that the common irrigation flow preference of the IA is from upstream to downstream (Table
33). Although the average rating is still remarkably high, the ratings also decrease from upstream to downstream.
Table 31. Questions related to other modes of irrigation and scheduling
QUESTION YES NO Blank Total
Is/are there farm(s) within the service are that is/are being irrigated by other modes of irrigation to supplement its/their crop water requirements? 69 46 36 151
If Y, provide details below (Y-pump) 61 10 80 151
Is irrigation scheduling or rotational irrigation practiced for these zones or farm groups? 118 23 10 151

162 | P a g e
Table 32. Coping strategies adopted by the IA in case of prolonged dry spell
Count Proper Monitoring and Scheduling / Rotation 56
Pumps 22
Planting Other Crops 19
AWD/ Water Saving / Rationing 15
None 11
STW/ deep wells 9
Reduce Irrigated Area 8
Cloud Seeding 8
Ratooning/ One Cropping/ Adjust Cropping Calendar 6
No data 40
Total Number of Responses 111
Table 33. Questions related to preferred irrigation flow
QUESTION U-D D-U OTHERS Blank Total
Preferred irrigation flow 59 43 6 43 151
(Note: D-U = downstream-upstream; U-D = upstream-downstream)
5.2.2. Economic
Economic profiles of IAs interviewed were also elicited during the KII. Note that the declared profiles are only rough estimates as declared by the IA members or officers
interviewed. Commonly, there are only 2 cropping in a year; however, there were IAs that were interviewed claim that they only have 1 cropping season per year and IAs which claimed that they can have as much as 3 cropping seasons per year.
Table 34 shows the average production yield in cavans per hectare by cropping season.
Normally, 1st cropping season happens either from June to November. On the other hand, the 2nd cropping usually falls from November to March.
Results show that the highest yield usually falls on the 1st cropping. Overall, the average yield of the IAs reaches up to 110 cavans per hectare (Mindanao) wherein it could go
for as low as 40 cavans per hectare and as high as up to 200 cavans per hectare. Since the 2nd cropping usually falls on months with strong rain, normally have the lowest yield at 85 cavans per hectare (Visayas) on the average.

163 | P a g e
Table 34. Average production yield in cavans per hectare by cropping season
Province 1st cropping (cavans/ha) 2nd cropping (cavans/ha)
<40 41-64
65-99 >100 Ave <40
41-64
65-99 >100 Ave
Luzon
Quezon 0 0 3 0 87.00 0 0 2 1 90.00
Cavite 0 0 3 0 80.00 0 1 2 0 68.33
Ilocos Norte 0 0 2 1 90.00 0 0 2 1 106.67
Ilocos Sur 0 0 1 3 97.50 0 0 0 4 135.00
Pampanga 0 0 2 2 87.50 0 1 2 2 80.00
Isabela 0 0 0 9 131.11 0 0 1 8
112.78
Nueva Ecija 0 0 1 7 120.00 0 0 6 2 95.00
Bulacan 0 0 1 1 119.00 0 0 0 2
110.00
Cagayan 0 0 3 6 123.89 0 2 1 5 90.63
Occidental Mindoro 0 0 1 2
103.33 1 1 1 0 60.00
Pangasinan 1 0 2 2 91.60 0 1 2 1 80.00
Tarlac 0 0 1 2 106.67 0 0 0 3
130.00
Camarines Sur 0 0 2 1 86.67 0 1 2 0 76.67 Total no. of IA's 1 0 22 36 101.8
7
1 7 21 29 95.01
% 1.69
0.00
37.29
61.02
1.72
12.07
36.21
50.00
Visayas
Bohol 0 0 9 5 94.71 0 0 6 8
100.71
Leyte 0 0 5 7
101.07 0 0 10 2 90.81
Iloilo 0 0 12 5 93.61 0 1 12 4 85.68
Capiz 0 3 2 0 63.80 0 1 2 0 63.79 Total no. of IA's 0 3 28 17
88.30 0 2 30 14
85.25
% 0.00
6.25
58.33
35.42
0.00 4.35
65.22
30.43
Mindanao
Davao del Sur 0 0 0 5
132.00 0 0 0 5
129.60
North Cotabato 0 0 2 4
103.20 0 0 2 4
104.27

164 | P a g e
Province 1st cropping (cavans/ha) 2nd cropping (cavans/ha)
<40 41-64
65-99 >100 Ave <40
41-64
65-99 >100 Ave
South Cotabato 0 0 3 9
106.23 0 0 7 4 96.57
Maguindanao 0 0 2 0 91.80 0 0 1 1
109.80
Bukidnon 0 0 7 7
118.79 0 0 6 8
111.38
Total no. of IA's 0 0 14 25 110.4
0 0 0 16 22 110.3
2
% 0.00
0.00
35.90
64.10
0.00 0.00
42.11
57.89
(Note: All data were adjusted to 50 kg/cavan)
The farmers were also requested to provide their production profit and costs. Tables 35
and 36 shows the profit and costs profile both for 1st and 2nd cropping.
During the 1st cropping season, the overall production cost per hectare reaches PhP 33,550 (Luzon) while the gross profit, would reach up to PhP 80,685.07 per hectare (Mindanao). On the other hand, during 2nd cropping, the average overall production
cost reaches PhP 32,300 (Luzon) while the average gross profit per hectare usually reaches PhP 85,797.97 (Mindanao).
Based on the IAs interviews and FGDs, there is a wide range in the financ ia l performance of IAS in terms of net profit from production. The area of landhold ing
ranges from 1 to 2 ha, the harvest ranges from 80 to 180 cavans per hectare, the content range from 42 to 60 kg per cavan and the selling price ranges from PhP 12 to 21 per kg.
Based on this, the Gross profit ranges from PhP 43,200 per ha (Mambusao, Capiz NIS) to PhP 81,600 per ha (Bayongan, Bohol NIS) With production costs ranging from PhP 27,000 (Mambusao) to 30,000 (Bayongan), the net profit ranges from PhP 16,000 per
ha (Mambusao) to 51,600 per ha (Bayongan). This varying financial performance of IAs only shows that some IAs are performing well compared to others. The identified
factors affecting performance are higher production/operational costs in some areas, low buying price of palay by NFA/Traders in other areas, and inequitable distribution and delivery of water from upstream to downstream sections of the main canal/lateral.
The main crop that is planted by farmers is rice/palay, but there is also some which
plant corn. Other crops planted are garlic, vegetables, watermelon, onion, ginger, mongo, tobacco, peanut, banana, and pineapple.

165 | P a g e
Table 35. Production, cost and profit of Palay for the 1st cropping
Province Total production (kg/ha)
Total production cost (PhP/ha)
Gross profit (PhP/ha)
Net profit (PhP/ha)
Luzon
Quezon 4330.67 ₱28,333.33 ₱71,621.33 ₱43,288.00
Cavite 3666.67 ₱30,000.00 ₱47,000.00 ₱17,000.00
Ilocos Norte 4500.00 ₱31,666.67 ₱80,500.00 ₱48,833.33
Ilocos Sur 4875.00 ₱37,500.00 ₱85,000.00 ₱50,000.00
Pampanga 4375.00 ₱20,000.00 ₱68,000.00 ₱48,000.00
Isabela 6412.22 ₱42,777.78 ₱106,801.11 ₱63,856.67
Nueva Ecija 6518.75 ₱46,333.33 ₱132,464.29 ₱97,300.00
Bulacan 5445.00 ₱36,000.00 ₱98,010.00 ₱62,010.00
Cagayan 6250.00 ₱36,250.00 ₱110,718.75 ₱74,531.25
Occidental Mindoro 5166.67 ₱32,333.33 ₱87,833.33 ₱41,000.00
Pangasinan 4430.00 ₱37,500.00 ₱81,510.00 ₱54,825.00
Tarlac 5666.67 ₱30,000.00 ₱98,500.00 ₱68,500.00
Camarines Sur 4513.33 ₱31,666.67 ₱74,060.00 ₱42,393.33
Average Production Cost ₱33,550.00
Average Net Profit ₱54,733.66
Visayas
Bohol 4735.71 ₱37,250.00 ₱90,287.50 ₱52,612.50
Leyte 5053.33 ₱31,398.75 ₱73,159.00 ₱44,200.00
Iloilo 4416.29 ₱36,793.33 ₱63,593.73 ₱32,677.38
Capiz 3190.00 ₱25,500.00 ₱41,522.50 ₱19,323.33
Average Production Cost ₱32,735.52
Average Net Profit ₱37,203.30
Mindanao
Davao del Sur 6600.00 ₱41,000.00 ₱132,000.00 ₱82,000.00
North Cotabato 5160.00 ₱30,400.00 ₱88,840.00 ₱82,840.00
South Cotabato 5311.67 ₱25,625.00 ₱111,126.67 ₱95,892.50
Maguindanao 4590.00 ₱17,000.00 ₱82,530.00 ₱68,500.00
Bukidnon 5939.29 ₱35,357.14 ₱111,692.86 ₱74,192.86
Average Production Cost ₱29,876.43
Average Net Profit ₱80,685.07

166 | P a g e
Table 36. Production, cost and profit of Palay for the 2nd cropping
Province Total production (kg/ha)
Total production cost (PhP/ha)
Gross profit (PhP/ha)
Net profit (PhP/ha)
Luzon
Quezon 4576.67 ₱28,333.33 ₱68,678.33 ₱40,347.67
Cavite 3750.00 ₱33,333.33 ₱47,875.00 ₱14,541.67
Ilocos Norte 5333.33 ₱28,333.33 ₱85,333.33 ₱57,000.00
Ilocos Sur 6750.00 ₱35,000.00 ₱93,500.00 ₱58,500.00
Pampanga 4100.00 ₱12,000.00 ₱45,000.00 ₱33,000.00
Isabela 5350.00 ₱42,777.78 ₱89,894.44 ₱47,116.67
Nueva Ecija 5031.25 ₱30,333.33 ₱94,000.00 ₱66,783.33
Bulacan 7150.00 ₱38,000.00 ₱128,700.00 ₱120,700.00
Cagayan 4687.50 ₱35,000.00 ₱87,714.29 ₱52,714.29
Occidental Mindoro 4000.00 ₱32,333.33 ₱68,000.00 ₱35,666.67
Pangasinan 5125.00 ₱32,500.00 ₱85,125.00 ₱50,625.00
Tarlac 6333.33 ₱30,000.00 ₱114,666.67 ₱84,666.67
Camarines Sur 3973.33 ₱31,666.67 ₱69,046.67 ₱37,380.00
Average Production Cost ₱32,300.00
Average Net Profit ₱53,772.46
Visayas
Bohol 5035.71 ₱32,857.14 ₱92,350.00 ₱62,971.43
Leyte 4540.58 ₱33,125.00 ₱74,443.50 ₱40,315.25
Iloilo 4283.82 ₱35,746.15 ₱64,361.40 ₱24,252.92
Capiz 3189.33 ₱25,500.00 ₱49,082.00 ₱26,582.00
Average Production Cost ₱31,807.07
Average Net Profit ₱38,530.40
Mindanao
Davao del Sur 6480.00 ₱41,000.00 ₱138,000.00 ₱88,000.00
North Cotabato 5213.33 ₱18,200.00 ₱97,144.00 ₱78,944.00
South Cotabato 4828.27 ₱25,625.00 ₱107,297.78 ₱91,585.00
Maguindanao 5490.00 ₱17,000.00 ₱99,450.00 ₱99,280.00
Bukidnon 5568.93 ₱35,357.14 ₱106,537.50 ₱71,180.36
Average Production Cost ₱27,436.43
Average Net Profit ₱85,797.87

167 | P a g e
The team also inquired several questions which is relevant to their economic well-being particularly in terms of the irrigation service fees. The succeeding tables below show
the responses of the 151 IAs.
Across the IAs interviewed, there were different estimates declared for the actual ISF that they pay per cropping season and per location. This could be due to exceptions and
other arrangements between the farmers and the collection party. Moreover, at the time survey in Visayas and Mindanao, Free Irrigation was being implemented. But still, fees were being collected by IAs (Tables 37 and 38). To avoid confusion and disputes, the
“irrigation service fee” was termed as irrigation maintenance fee, association fee, water maintenance, etc. With free irrigation, IAs have no funds to clear the canal and support
from NIA is also lacking. They have actually made a resolution asking for heavy equipment for canal clearing.
The water charges that were usually collected in the IAs is presented in Table 38. Before free irrigation, ISF bills are normally prepared by NIA but the actual collection task
would depend on the model type of the IA. Usually, NIA collects the ISF but is assisted by the IAs.
Table 37. Fees being collected from farmers by IA
Province Irrigation service fee Development cost contribution (DCC)/ amortization
Others
Luzon
Quezon 3 0 0
Cavite 0 0 3
Ilocos Norte 0 1 1
Ilocos Sur 1 0 3
Pampanga 2 0 1
Isabela 9 0 0
Nueva Ecija 5 0 1
Bulacan 1 0 1
Cagayan 4 0 6
Occidental Mindoro 1 0 1
Pangasinan 4 0 0
Tarlac 3 0 0
Camarines Sur 3 0 0
Visayas
Bohol 2 0 35
Leyte 0 1 20
Iloilo 0 0 0
Capiz 0 0 0
Mindanao
Davao del Sur 5 0 2
North Cotabato 0 0 4
South Cotabato 12 0 1

168 | P a g e
Province Irrigation service fee Development cost contribution (DCC)/ amortization
Others
Maguindanao 0 0 2
Bukidnon 4 0 3
Table 38. Water charges collected by IAs
Province Yes, they are collected
None collected, although policy says charges are to be collected
None collected, and none are assessed
No answer
Luzon
Quezon 2 1 0 3
Cavite 0 3 0 3
Ilocos Norte 3 0 0 3
Ilocos Sur 3 1 0 4
Pampanga 4 0 0 4
Isabela 6 3 0 9
Nueva Ecija 4 3 0 7
Bulacan 1 1 0 2
Cagayan 7 2 0 9
Occidental Mindoro 1 1 0 2
Pangasinan 1 3 0 4
Tarlac 1 2 0 3
Camarines Sur 2 1 0 3
Visayas
Bohol 13 1 0 14
Leyte 11 0 0 11
Iloilo 0 5 11 16
Capiz 0 0 5 5
Mindanao
Davao del Sur 0 5 0 5
North Cotabato 0 4 2 6
South Cotabato 0 6 6 12
Maguindanao 0 0 0 0
Bukidnon 0 0 8 8
Table 39 was about if there are incentives for paying on time and how their rate their
IA’s financial strength from 0 – 4, wherein 0 being the lowest and 4 being the highest. However, as presented in Table 37, most of the IAs have incentives for paying on time.
Before free irrigation, usually for type 2 models of IA not yet in IMT, there is a 10% discount if ISF is paid on time. In order to encourage the IAs to collect the ISF, NIA implements incentive schemes. Such schemes include a percentage return from the

169 | P a g e
collection to be given to the IA if a certain percentage threshold of collection is met or if 100% collection is met for that season. The funds are then pooled by the IA and used
for their few operating expenses such as when conducting meetings, general assembly, and honorarium for others.
Results showed that farmers think that their financial strength is just above the middle where they can at least meet the minimum requirement of running the IAs. Although
many IAs think that theirs have good financial strength, the majority thinks that their financial strength is only of mediocre level. Some of the farmers in Luzon rated their
financial strength below average.
Table 39. Incentive for paying on time and rating of IA’s financial strength
Province YES NO Rating*
Luzon
Quezon 3 3 1.0
Cavite 3 3 2.3
Ilocos Norte 0 3 1.0
Ilocos Sur 1 4 2.5
Pampanga 1 5 3.0
Isabela 9 9 3.7
Nueva Ecija 4 12 3.0
Bulacan 0 2 3.0
Cagayan 1 9 2.0
Occidental Mindoro 0 3 3.0
Pangasinan 0 5 1.7
Tarlac 1 3 2.0
Camarines Sur 0 3 1.5
Visayas
Bohol 10 14 3.2
Leyte 1 12 2.8
Iloilo 4 17 2.2
Capiz 4 5 2.0
Mindanao
Davao del Sur 5 5 3.0
North Cotabato 3 6 3.0
South Cotabato 12 12 3.0
Maguindanao 2 2 3.0
Bukidnon 12 14 3.0
(*Financial rating rated from 0 – 4, with 4 being very strong)
5.2.3. Institutional and organizational
The organizational profile of the IAs was also elicited from the interview to categorize
and analyze the organizational development and circumstances of the IA. According to

170 | P a g e
the farmers interviewed, their IAs is run through a president wherein the leaders are chosen through election. The usual term of office for the set of officers is 2 years.
Majority of the IAs do not provide compensation for the officers however, for some IAs that has compensation, it is usually in a form of honorarium per month.
Table 40 shows the IAs responses to questions pertaining to their perception towards the institution and their organization. Organizing an IA usually requires by-laws and
rules in order to be registered. This is also reflected in the answers of the IA. Included in the by-laws is on how decisions were made. Majority of the IAs respond that
decisions are usually made through a consensus of a quorum. Further, rules include provisions and sanctions. For instance, majority of IAs claimed that their rules have provisions on holding water users accountable in the use of their resource. There is also
a provision on penalties or sanctions for violations. There are also rules which are specific to Board of Directors and/or officers to be held accountable or liable in their
actions. Other inquiries asked about conflict resolution and performance awards. Majority of
the IAs have conflict resolution mechanisms. The conflict resolution ability of IA officers is critical in the development of the organization. Although many IAs claim
that it is very seldom for them to engage into a formal conflict resolution mechanism, they only usually resolve petty arguments between members particularly on the topic of water distribution. Provisions in the rules that were not adequately implemented is
presented in Table 41.
Table 40. Questions related to rules and conflicts
QUESTION YES NO Blank Total Are there written rules (e.g. by laws) in the IA regarding proper behavior of farmers and employees?
130 4 17 151
Are there provisions in the rule/ ordinance holding water users accountable? (Y/N/NC/DK)
97 19 35 151
Penalty provisions/fines? 94 39 18 151
Sanctions? 13 93 45 151
If and when conflicts arise between water users, are there any conflict resolution mechanisms? (Y/N/DK)
91 37 23 151
Table 41. Provisions that are not implemented adequately
Count
Water Stealing / Illegal Checking and Pumping 44
Monthly/Annual Dues 33
Rules and Regulations 14
None 11
ISF Payment 6
No IAMO, No Turtle Tiller 5
Inactive 5

171 | P a g e
Count
Free Irrigation 4
No data 41
Total Number of Responses 111
On the other hand, collection delinquency is the inability of the farmers to pay their
ISF. Not paying the ISF could be due to several reasons. The top reasons that were tallied based from the interviews were due to personal reasons, insufficient water, lack of funds, and damaged irrigation infrastructures (Table 42). According to the officers,
many members refuse to pay since they are not satisfied with the irrigation supply. In addition, members also refuse to pay since they still believe that water and irriga t ion
system should be a service by the government to the people, thus it should be free. Similarly, water should be free since it is a God-given gift to humanity. In some areas, political interest and statements or propaganda are the reasons why members do not
want to pay. Promises made by politicians during the campaign period are used against the organization which forces them to accept things as it is. Table 43 shows the penalty
imposed by IAs for delinquency in payments.
Table 42. Reason for delinquency presented by IAs
Province
Willin
gness to
pay
Perso
nal
reason
s
Po
verty
Weak h
arvest
Delay in
selling
pro
du
ce
Lack of w
ater
Lack of
facilities/
equ
ipm
ent
Can
al dam
age
Po
or
engin
eering
Institu
tion
al
Farmers n
eed
to b
e orien
ted
Nu
ll
Luzon
Quezon 1 2
Cavite 2 1 1
Ilocos Norte 2 1
Ilocos Sur 2 2
Pampanga 2 1 3 1 1 1
Isabela 2 2 4 1
Nueva Ecija 3 1 1 1 7
Bulacan 1 1
Cagayan 2 1 1 1 1 1 3
Occidental
Mindoro 1 2
Pangasinan 2 2 1
Tarlac 2 1 2
Camarines
Sur 3 1
Visayas
Bohol 3 5 4 4
Leyte 4 3 1 1 2 2
Iloilo 5 2 9 2
Capiz 2 4 1 1
Mindanao

172 | P a g e
Province
Willin
gness to
pay
Perso
nal
reason
s
Po
verty
Weak h
arvest
Delay in
selling
pro
du
ce
Lack of w
ater
Lack of
facilities/
equ
ipm
ent
Can
al dam
age
Po
or
engin
eering
Institu
tion
al
Farmers n
eed
to b
e orien
ted
Nu
ll
Davao del
Sur 1 4
North
Cotabato 2 2 4
South
Cotabato 6 10 2
Maguindana
o 2
Bukidnon 5 1 1 6 1 3
Number of responses = 179
Number of respondents = 151
Table 43. Penalty for delinquency implemented by IAs
Province <5%
interest
>5%
interest
Seize
bank
account
Demand
letter
and
legal
action
Cut
off
water
supply
Others No
penalty
Null
data
Luzon
Quezon 2 1
Cavite 3
Ilocos Norte 2 1
Ilocos Sur 3 1
Pampanga 2 3
Isabela 6 3
Nueva Ecija 2 1 2 1 7
Bulacan 1 1
Cagayan 3 1 1 1 1 4
Occidental
Mindoro 1 2
Pangasinan 4 1
Tarlac 1 1 1
Camarines
Sur 1 2
Visayas
Bohol 6 2 6
Leyte 1 2 6 1 2
Iloilo 2 2 1 2 10
Capiz 4 1
Mindanao
Davao del Sur 1 4

173 | P a g e
Province <5%
interest
>5%
interest
Seize
bank
account
Demand
letter
and
legal
action
Cut
off
water
supply
Others No
penalty
Null
data
North
Cotabato 2 4
South
Cotabato 6 6
Maguindanao 1 1
Bukidnon 5 1 8
Number of responses = 154
Number of respondents = 151
Finally, common issues that were experienced by the farmers were elicited. Table 44
shows the enumerated issues usually experienced by the IAs. On the other hand, Table 45 shows the suggestions to addressed IA issues and concerns. Based from the suggestions, generally, farmers will still need continuously the support of government.
Table 44. Problems/ issues encountered by the IAs and farmers
Count
O&M of the Irrigation 54
Access to Funds for Rehabilitation (LGU, NIA, other
government agencies) 49
Access to Water (Quantity and Timeliness) 41
Technical Support from NIA, Support Services from the
Department of Agriculture (DA) 37
Access to Production Credit (including providers) 34
Others 12
Blank 49
Total Number of Responses 102
Table 45. Suggestion to address IA concerns
Count
Technical Support from NIA, Support Services from the Department of
Agriculture (DA) 96
Subsidy from Government 62
Government Support 40
Others 4
Blank 30
Total Number of Responses 121
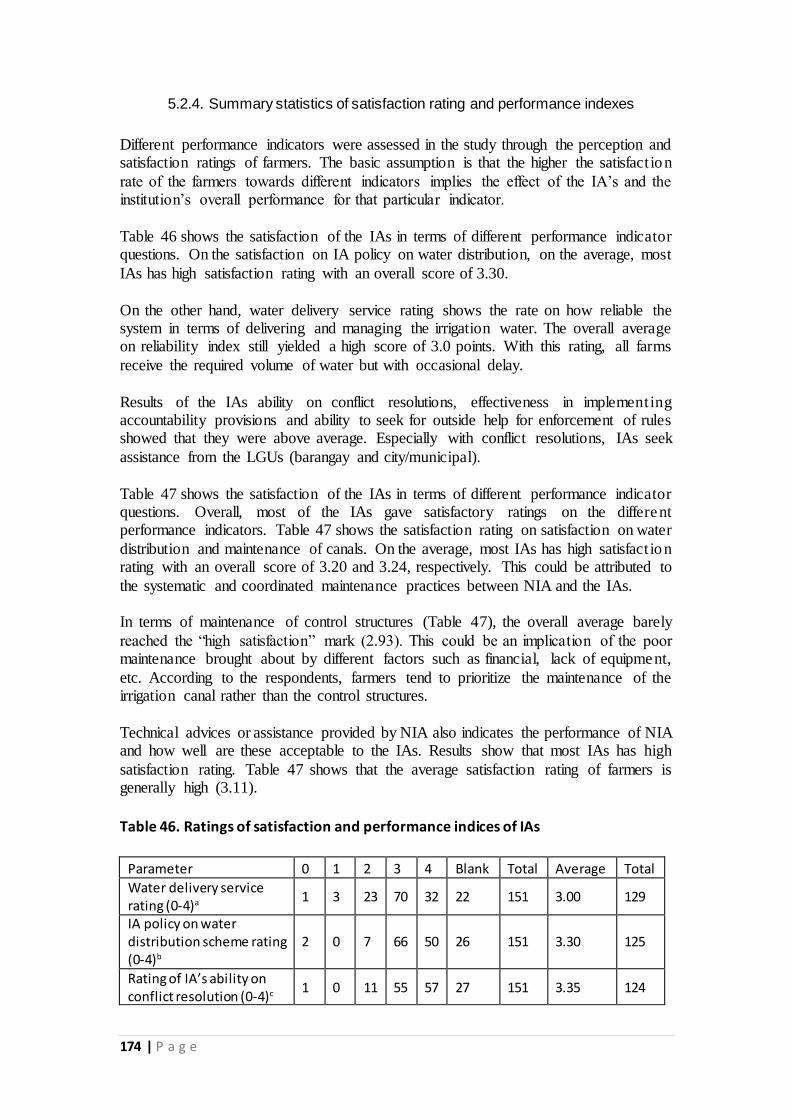
174 | P a g e
5.2.4. Summary statistics of satisfaction rating and performance indexes
Different performance indicators were assessed in the study through the perception and satisfaction ratings of farmers. The basic assumption is that the higher the satisfact ion
rate of the farmers towards different indicators implies the effect of the IA’s and the institution’s overall performance for that particular indicator.
Table 46 shows the satisfaction of the IAs in terms of different performance indicator questions. On the satisfaction on IA policy on water distribution, on the average, most
IAs has high satisfaction rating with an overall score of 3.30.
On the other hand, water delivery service rating shows the rate on how reliable the system in terms of delivering and managing the irrigation water. The overall average on reliability index still yielded a high score of 3.0 points. With this rating, all farms
receive the required volume of water but with occasional delay.
Results of the IAs ability on conflict resolutions, effectiveness in implementing accountability provisions and ability to seek for outside help for enforcement of rules showed that they were above average. Especially with conflict resolutions, IAs seek
assistance from the LGUs (barangay and city/municipal).
Table 47 shows the satisfaction of the IAs in terms of different performance indicator questions. Overall, most of the IAs gave satisfactory ratings on the different performance indicators. Table 47 shows the satisfaction rating on satisfaction on water
distribution and maintenance of canals. On the average, most IAs has high satisfact ion rating with an overall score of 3.20 and 3.24, respectively. This could be attributed to
the systematic and coordinated maintenance practices between NIA and the IAs. In terms of maintenance of control structures (Table 47), the overall average barely
reached the “high satisfaction” mark (2.93). This could be an implication of the poor maintenance brought about by different factors such as financial, lack of equipment,
etc. According to the respondents, farmers tend to prioritize the maintenance of the irrigation canal rather than the control structures.
Technical advices or assistance provided by NIA also indicates the performance of NIA and how well are these acceptable to the IAs. Results show that most IAs has high
satisfaction rating. Table 47 shows that the average satisfaction rating of farmers is generally high (3.11).
Table 46. Ratings of satisfaction and performance indices of IAs
Parameter 0 1 2 3 4 Blank Total Average Total
Water delivery service rating (0-4)a
1 3 23 70 32 22 151 3.00 129
IA policy on water distribution scheme rating (0-4)b
2 0 7 66 50 26 151 3.30 125
Rating of IA’s ability on conflict resolution (0-4)c
1 0 11 55 57 27 151 3.35 124

175 | P a g e
Effectiveness of accountability provisions in a scale of 0 to 4d
14 2 21 48 32 34 151 2.70 117
Ability of the IA to seek for outside help for enforcement of its rules rated from 0 – 4e
6 9 25 39 38 34 151 2.80 117
(Note: a4 – all farms receive the required volume of water at the right time, 3 – all farms receive the
required volume of water but with occasional delay, 2 – not all farms receive the required water more
often,
1 – all farms do not receive sufficient water when needed; b4 – clear policy and adequately
implemented, 3 – clear policy but not implemented sometimes, 2 – clear policy but not implemented
oftentimes, 1 – unclear policy, 0 - no policy; c4 – Very effective, 3 – Moderately successful, 2 – Not
very effective, 1 – Not effective at all, 0 – nothing done by IA to resolve conflict; d0 – not at all
effective, 1 – rarely, 2 – sometimes, 3 – frequent 4 – very effective always; ewith 4 being the most
influential)
Table 47. Satisfaction ratings of IAs on NIA's performance
0 1 2 3 4 Blank Total Average Total
a. Distribution of water in its area 0 3 8 67 37 36 151 3.20 115
b. Maintenance of canals 0 1 11 63 41 35 151 3.24 116
c. Maintenance of control structures 3 1 24 59 27 37 151 2.93 114
d. Construction of facil ities in the area 3 4 16 47 23 58 151 2.89 93
e. Collection of irrigation service fee 0 3 10 52 22 64 151 3.07 87
f. Collection of other fees 1 2 16 56 13 63 151 2.89 88
g. Technical advice to farmers 0 1 13 61 26 50 151 3.11 101
(Note: 4 – excellent; 3 – satisfactory; 2 – average; 1 – poor; 0 – very poor)
5.3. Assessment of Irrigation Performance using Principal Component
Analysis
The study estimated the IPI using the Principal Component Analysis. Due to the difference in the nature of data collection between cycles, initial assessment resulted to
a separate PCA model specific for each cycle and an integrated PCA model using common variables. Cycle 1 will include data from Luzon while Cycle 2 will include Visayas and Mindanao. The PCA results for each cycle are treated to strictly apply only
for the specific group (i.e. Cycle 1 IPI will only apply for cycle 1 group). In order to compare the IPI of Cycle 1 and 2 IAs, a separate PCA model using an integrated dataset
of common observable variables was also conducted. The results of each PCA model are discussed in this section.

176 | P a g e
Table 48. PCA results of Cycle 1
Component weights
22.73% 20.71% 19.09% 12.61%
Variables Economic Financial Institutional Environmental
Annual Yield 0.5359 Annual Gross Profit 0.6468 Annual Net Profit 0.5365 Annual ISF collection 0.5491 Collection Efficiency 0.5189 Collection Delinquency 0.6167 Satisfaction rate on effectivity of
accountability of provisions 0.7051 Satisfaction rate on clarity of policies
implemented 0.6372 DO 0.7644
pH 0.6302
Table 49. Summary of the performance of IAs in Cycle 1.
Summary
Low performing IAs 30 47%
Moderate performing IAs 26 41%
High performing IAs 8 12%
The results of the PCA for Cycle 1 resulted in 10 factors which contributes to the overall
performance index. These 10 factors were sub classified into 4 components: Economic, Financial, Organizational, and Environmental. Based from the PCA model, 75% of the
resulting performance index is explained by the model, leaving the remaining 25% as unexplained. The results also show that Economic and Financial factors are the major indicators of the IA’s performance. Applying the model to all IAs resulted in a
classification of Low, Moderate, High performing organizations. Note that the performance scale is based on the variables identified by the PCA, hence this
specifically applies to this particular group.
Results showed that, under this rating scale, 12% of the IAs are rated as high performing, while 41% are moderate and 47% are low performing. Relative location of results for Cycle 1 is presented in Figure 57.

177 | P a g e
Figure 57. GIS map of results for Cycle 1
Table 50. PCA results of Cycle 2 Component weights 19.55% 17.96% 15.39% 12.02%
Variables Technical Institutional Environment Economic
Performance rate on distribution of water 0.5214
Performance rate on maintenance of canals 0.5909
Meeting Participation rate for GA 0.552
Rate on conflict resolution 0.6231
Performance rate on maintenance of control structures 0.4927
pH (alkalinity) 0.578
Electric Conductivity (salinity) 0.5941
Rate of IA's financial strength 0.6243
Rate on technical advices to farmers 0.5725
Table 51. Summary of the performance of IAs in Cycle 2
Summary
Low performing IAs 28 32%
Moderate performing IAs 39 45%
High performing IAs 20 23%

178 | P a g e
In Cycle 2, the level of performance for the 87 IAs is broken down as follows: 28/87 (32%), 39/87 (45%), and 20/87 (23%) are showing Low, Moderate, and High
performance, respectively. Again, the low performing IAs are mostly located in the downstream part of the main canal. This confirms that water distribution and
availability is a major factor that affects irrigation performance on the IA level. This finding towards the location of IAs is also consistent on the correlation sign estimated from the regression model of their Irrigation Performance Index (IPI). Relative location
of results for Cycle 2 is presented in Figure 58.
Figure 58. GIS map of results for Cycle 2
Since the determinants of “localized” PCA model for Cycle 1 and Cycle 2 were different, PCA results for both Cycle 1 and Cycle 2 only applies within their respective
groups. However, anecdotal evidences from interviews claim that free ISF has improved the satisfaction of IAs (not to be confused with the “Performance Index”)
despite some complains from few IAs (especially in Jalaur RIS) which claims that free ISF has reduced their funds allocated for maintenance of canals related to siltat ion. However, in the development of Irrigation Performance Index (IPI), a mutua lly
exclusive PCA model integrating common observable data from Cycles 1 and 2 with a total sample size of 151 IAs throughout the Philippines, results show that only 23% of
the samples have high level of irrigation performance while those having moderate to low performance are 33 and 45%, respectively.
Integrated Analysis for Cycle 1 and 2
Using the IPI from the integrated analysis allow for the comparability between groups. The mean IPI of Cycle 1 showed higher score than Cycle 2, hence this imply that the

179 | P a g e
performance of IAs in Cycle 1 seem to perform better than IAs in Cycle 2. Most of the low performing IAs are from Visayas and Mindanao. It should be noted in the integrated
analysis, a dummy variable representing ISF (i.e. whether IAs are collecting ISF or not) was used and results imply that ISF is a significant factor that is likely to increase IAs
performance. The resulting PCA model excluded “annual yield”, “stream location”, and “ISF” data
to integrate both Cycles 1 and 2. Eventually, the PCA model computed 10 specific factors as main indicators for the IAs’ performance index (Table 50). These factors
were classified into 4 components: Economic, Technical, Environmental, and Institutional. Figure 59 shows the distribution of effect between components as performance indicator. The results show that Economic and Technical components are
the prime indicators for the IAs performance index.
Figure 59. Distribution of the effects of Component weights for Integrated Analysis of Cycles 1 and 2.
Table 52. PCA results of Cycles 1 and 2.
Component weights 22.90% 19.67% 14.18% 12.75%
Variables Economic Technical Environmental Institutional
Number of Cropping per year 0.4938
Annual Gross Profit 0.6094
Annual Net Profit 0.5966
Performance rate on distribution of water
0.5776
Performance rate on maintenance of canals
0.6324
Rate on technical advices to farmers 0.5117

180 | P a g e
Component weights 22.90% 19.67% 14.18% 12.75%
Variables Economic Technical Environmental Institutiona
l
Dissolved Oxygen 0.6969
pH (Acidity) 0.7086
Ability to seek for outside help 0.749
Meeting Participation rate for BOD 0.6397
Based from the PCA computation, the indicators explain at least 70% of the performance index. Given the rating scale and the set of indicators, results show that
majority of the IAs are in the moderate and high performing category. However, in between Cycle 1 and Cycle 2 groups, Cycle 1 are generally classified in Moderate and High performing IAs.
To validate this, we consider using the mean performance score as benchmark to
compare between IAs from Cycles 1 and 2, and results showed that the mean score of IAs from cycle 1 are above average whereas the mean score of IAs from Cycle 2 is below the mean performance index, as shown in the Figure 60.
Figure 60. Standardized Computed Performance Index
A t-test statistic was also conducted to investigate whether the mean difference between
the two groups are indeed valid. This affirms that the Cycle 1 performance is significantly different from Cycle 2 group hence validating the claim that Cycle 1 group’s mean performance rating is indeed higher than Cycle 2 group.
To further determine the effect of ISF in the IAs performance, a regression model was
conducted in the IPI from the integrated analysis between Cycle 1 and 2. The model estimated that the presence of ISF highly likely to affect the performance index of the IAs by a score of 0.30. Intuitively, this suggest that the presence of ISF increases their
performance index in terms of efficient usage of their resource. Since there is cost implication from the ISF, IAs tend to manage the use of their resource more efficient ly.
Cycle 1, 0.791337617
Cycle 2, 0.491490362
Overal l, 0.617426209
0
0.1
0.2
0.3
0.4
0.5
0.6
0.7
0.8
0.9
Average of Standardized CPI
Per
form
an
ce S
core
Standardized Computed Performance Index

181 | P a g e
This is also evident in the PCA model indicated by the Technical component. The results of the regression are shown in the Table 53.
Table 53. Results of Regression Analysis for Integrated Analysis of Cycles 1 and 2.
Variable Coefficient Std. Error P-Value
Loc_down -0.0189746 0.0301518 0.530 Loc_mid -0.0086407 0.0323526 0.790
Loc_up 0.0299249 0.0294059 0.311 Annual yield 0.000683 0.0002657 0.011**
Presence of ISF (w/ or without ISF)
0.3033828
0.0253181 0.000***
_constant 0.3516904 0.0574767 0.000*** *** significant at 1%; ** significant at 5%
The regression result showed that the dummy variables for the location of the IAs are
not likely to have an effect towards their performance index. This is likely probable particularly if the IAs have efficient management of the irrigation structures as reflected
in the separate PCA results for Cycle 1 and Cycle 2. However, although the p-value did not result to a significant effect to the index, notice that as the location goes downstream, the relationship towards the performance index decreases.
On the other hand, the “annual yield” and “presence of ISF” displayed high statistica l
significance to affect the IAs performance index. Since “annual yield” is a common indicator, it is just expected that higher annual yield also indicates better performance. In this case, an increase in annual yield by 1 unit increases the index by 0.0007 score
point. However, a more interesting result is in terms of the presence of ISF or Irrigation Service Fee.
Instead of using the actual amount of ISF collected, the study used a dummy variable to indicate whether the IAs are collecting ISF or not. This is because there is data
variation from ISF collections from Cycle 1 but none from Cycle 2 since they all pay 0 amount. Hence, this skews the analysis of the variable. Using a dummy variable instead
makes both Cycle 1 and Cycle 2 comparable, hence yielding a better estimate.
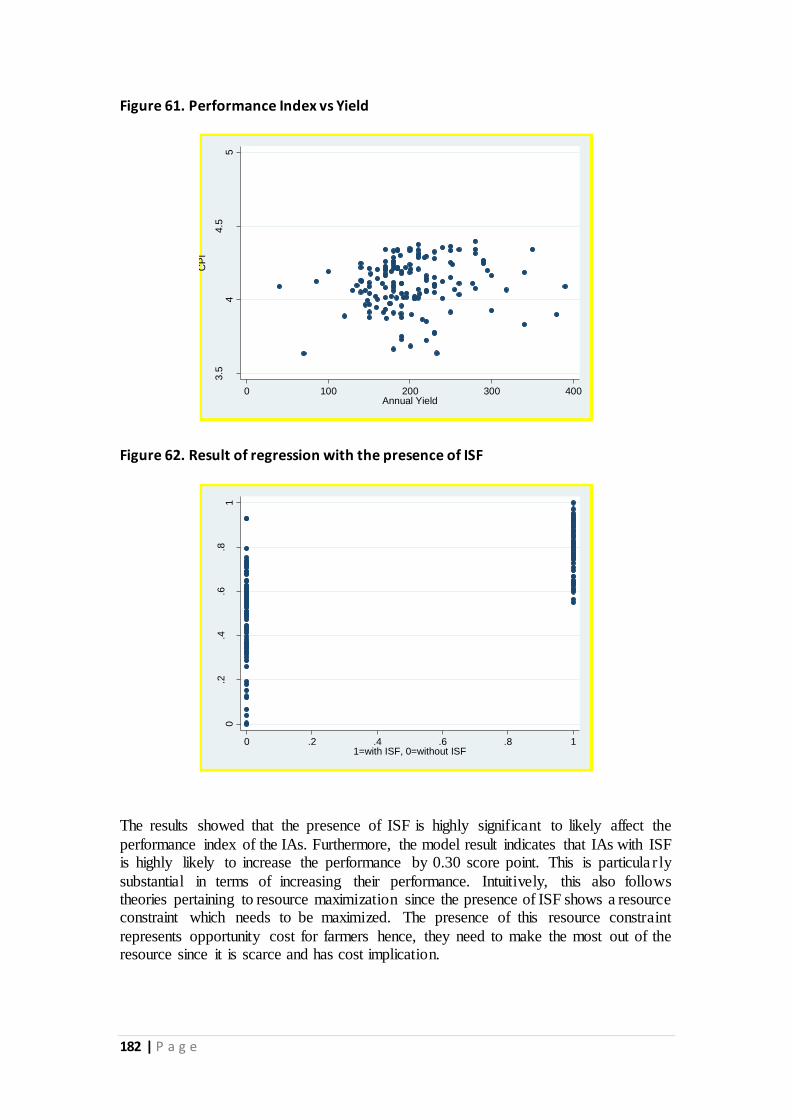
182 | P a g e
Figure 61. Performance Index vs Yield
Figure 62. Result of regression with the presence of ISF
The results showed that the presence of ISF is highly significant to likely affect the
performance index of the IAs. Furthermore, the model result indicates that IAs with ISF is highly likely to increase the performance by 0.30 score point. This is particula r ly
substantial in terms of increasing their performance. Intuitively, this also follows theories pertaining to resource maximization since the presence of ISF shows a resource constraint which needs to be maximized. The presence of this resource constraint
represents opportunity cost for farmers hence, they need to make the most out of the resource since it is scarce and has cost implication.
3.5
44.5
5
CP
I
0 100 200 300 400Annual Yield
0.2
.4.6
.81
StC
PI
0 .2 .4 .6 .8 11=with ISF, 0=without ISF

183 | P a g e
Table 52 shows the list of IAs with low, moderate and high performance. Out of 151 IAs, 68 are low performing where majority comes from Visayas and Mindanao.
Relative location of results for Cycles 1 and 2 is presented in Figure 63.
Figure 63. GIS map of results for Cycles 1 and 2.
Table 54. List of Low, Moderate, and High Performing IAs.
Low Moderate High
Bohol Bohol Bukidnon
BODCASACAL IA AAIA2 Bukidnon IA
Oryza Sativa Linn CAM-BA-SAN Irrigators Association Inc. Bulacan
San Babue GABIBU Bagbaguin-Manatal
San D Mil GBL-IA (Gabi Bulilis Lomangog) Masacp-Pisacamba IA
Triple C&T MBK Good farmers Irrigators Association, INC Cagayan
Tubocalin IA Bukidnon Camalap IA
Bukidnon Bangcud, Cabangahan, Aglayon IA Dagupan IA Section 3 Cabisia
(MASBA) Mailag San Carlos Bagontaas IA Colonia IA Lal-lo IS
ARFI Araneta Lugong IA Hindangon Hagkol Poblacion Northern Solana Rice Producer IA
Batangan Malabuaya Inawaan IA Mailag Colonia IA Camarines Sur

184 | P a g e
Low Moderate High
Kahaponan Valencia City IA Inc Patag-Corona IA Labao Boguites IS
Salvacion Maramag IA San Martin North Main Canal IA Inc Ilocos Norte
Sinayawan Lateral G6 IA Inc Cagayan
Before: Laoag-San Nicolas IA; Now:San Nicolas Damilyan IA- Bonga Pump 2
Vintar Valencia City IA Kavisya IA Kadaklan Baldias IA
Capiz Muhara Ilocos Sur
GUINTTU NWSFIA Paing-Taguipuro IA
PAMMANBBA Zigiran-Dodan IA Isabela
PAMPBU Camarines Sur Bagong Silang IA
PASIMROBA
Bigong Patag Cagampis IA (BPCIA) & Pandan New Poblacion Camagong IA (PNPC IA) Der-an IA
TATAG Candatu-Labao-Patag-Tarcum FIA Golden Hope IA
Cavite Cavite Lateral D1 & B Salinongan IA Balite Munti Irrigator's Association Inc.
Bucal-Pasong Malainan Luma IA Mabisa IA
Davao del Sur Malaking Pilapil/Magabe C IA New Life IA
BASIS FIA Davao del Sur Victory IA Bayanihan Hagonoy Zone 3 LAPOSA IA
Sacub IA UPSFIA-Upper Sinayawan Farmer IA Nueva Ecija
Iloilo Ilocos Norte Biyaya-Radar IA
Banuba IA Tigbauan Caniyogan-Balbalay-Kau Alakay IA Flume IA
Bariga Magdalo Farmers IA Ilocos Sur LRTRIS FIA
BOTAPAC IA Kabukiran Mapamasa IA
CASANDEL IA Macagui Penaranda IA, Inc.
Cordova IA Inc
VSPC / San Hera de Magsinggal / Western Mags 2 / Pansaca Occidental Mindoro
Dita IA Iloilo Gamot Bolo Nicolas IA
Hampad Pampang Proper IA Inc
TUMCAN Irrigators Association Inc Pangasinan
Lateral B-Tigbauan IA Inc TUPOBA Farmers IA Inc Kaps Ambayoan
LIBU IA Leyte Main Canal Ambayoan Saranay IA
Merced Carmelo IA Bakaslipi IA SMD-Samahang Magsasaka ng Gonzalo
Nabiba tigbauan Inc North Cotabato Quezon

185 | P a g e
Low Moderate High
SALMIG MLARIS Division A. (BIMADU) IA Inc. Mayao Castillo Lucena IA
Sambaloca IA SARAPANI Irrigator Association Inc South Cotabato
SANSIMDA IA Nueva Ecija Highway Katilingban IA
VANI IA Inc Bagumbos Tarlac
Leyte Gamaca IA Dalayap Tarlac FIA Binouigay Farmers-Irrigators Service Coop. Kapit Bisig IA Himala IA
CAGUICA Laham IA Maliwalo IA at Lateral A
CAMACA Makabilog-Maynabo-Tambo IA
Cutay, Canmamotong, Victoria, Alaklihaw IA Maranac IA
Guinarona (blank)
KAHAYAG-LIBAG IA Inc. Occidental Mindoro
Kasaganahan IA Bugtong Buni Olima IA Lanauan TIN-AO, Balilit San Isidro IA Purnaga Magsaysay IA
MAGKAUROSA IA INC. Pampanga
San Roque Hetala IA Kansinala IA Sidlit farmers Irrigator Service Cooperative Magcasaup IA
Maguindanao Mazario Binuya IA Gagdanen Baya IA, Division 1 Inc. Sto. Nino Candating
Morning Light IA Pangasinan
North Cotabato Carsan Kudung Dungo IA
BAGONABATI IA Inc Quezon
BALATIKAN IA Ginintuang Butil Dalingaoen Farmers Irrigators Association of Pikit
Nagkakaisang Magsasaka ng Bantigue IA
MLARIS Division B. (LIDANAMA) IA Inc. South Cotabato
Pampanga CALOMOR Irrigation Association Inc
San Carlos-Sta. Rita-San Pedro IA, Inc. Lenticels IA
Pangasinan Morning Star IA
Salud-San Eugenio
South Cotabato
CABUMADU IA
Country Folks IA
DAWN IA

186 | P a g e
Low Moderate High
Midstream IA
Paghidaet-Malipayon Center Irrigators Association Inc
Rice Field IA
Roxas Macapagal Lambunao IA (ROMALIA) Sta. Cruz Magsaysay Maupayon (SCMM)
6. Conclusions and Recommendations
6.1. NIS Project Summary
This Project is envisioned to characterize and evaluate the Technical and Institutiona l dimensions of NIS. With water quality not a priority program of NIA in its previous
and on-going development projects, and thus no water quality information is availab le in all NIS managed or transferred by NIA, it was decided to include an environmenta l aspect in the performance assessment of NIS cases covered. As such, in addition to the
3 basic indicators considered such as CI, ISF and ratio of irrigated over service area, additional indicators related to physical and environmental aspects of irriga t ion
performance were included. In this Project, 39 representative NIS cases in Luzon, Visayas and Mindanao are
selected based on some criteria such as location, size, performance (successful/non
successful), and irrigation technology (gravity vs pump) which are either managed by
NIA or transferred to IAs under the IMT programs of NIA which empowers IAs to operate and manage irrigations systems in four schemes (i.e. model 1 to model 4). Also, the effect of Free irrigation was considered during the FGDs and KIIs in Visayas and
Mindanao.
The evaluation approach adopted in this project consists of walkthroughs/fie ld visits/interviews, measurement of water flow and quality from selected stations in the main and lateral canals and questionnaire surveys, KII and FGDs for IAs representing
the upstream, midstream and downstream part of the main canal or laterals which are based on the RAP approach under the MASSCOTE framework.
GIS was also applied to map location of surveys, structures and measurements as well as to perform spatial analysis of erosion, groundwater potential, coastal flooding and
performance levels of the NIS cases at the IA level.
Another innovative approach adopted in this project is the application of PCA to assess the performance of the NIS cases considered at the IA level using four major categories of indicators such as Technical/Physical, Institutional/Organizational, Economic and
Environmental. Within these major indicators are numerous factors which are analyzed using a correlation matrix to determine its loading factor or weight which is then used
to derive the performance index of the 151 IAs considered. Based on this composite

187 | P a g e
index which is a function of the relative weights of the factors analyzed, irriga t ion performance is described into three levels such as poor, moderate and high. Then the
performance levels of the 151 IAs evaluated was presented using GIS maps to demonstrate the distribution of IA performance in the 39 NIS cases covered.
Many technical and environmental issues confront the NIS covered based on the ocular inspection, walkthroughs and measurements of water flows, quality and siltation. In our
face to face discussion with the Engineers and Field guides, some pressing issues raised consist of 1) non-functional, missing or damaged structures (check gates, staff gauges,
etc.); 2) siltation and lack of canal maintenance; and 3) lack of policy or its weak enforcement with regards to canal maintenance, illegal settlers, illegal pumping and dumping of garbage. In addition, animals (especially carabaos) are frequenting the
earth canals which cause damage and collapse of the canal side slopes which can result in more serious problem such as reduction in capacity and increase in maintenance
costs. In some cases, there are misplaced or damaged structures (concrete turnouts or division boxes) which need immediate restoration to maintain its designated functions
Results of the evaluation from measurement, interviews and performance assessment are presented in terms of the major issues/concerns among NIS cases related to
Physical, Institutional and Environmental aspects of irrigation management as well the performance levels of the 151 IAs considered in the analysis.
The major issues under Technical/Physical include siltation problems in canals of almost all NIS cases causing reduced flow capacities that deprive the downstream
portion from adequate water supply. The reason is lack of maintenance especially. of unlined canals and poor watershed management which results in upland erosion and siltation of the rivers and canals downstream of the watershed. In addition, staff gauge s
are lacking or missing in most NIS cases visited which limits information on availab le flows; and canals/structures are damaged which affect water delivery service. In effect,
the delivery performance ratio, an indicator which describes the actual over design discharge cannot be assessed yet but needs to be determined to show the water delivery efficiency of the systems. Flooding problems also exist in most NIS especially during
wet season which limit cropping to dry season only and thus reduce Cropping Intensity. Also, drainage canals are lower than the river so flooding problems exist especially
during wet season since drainage canals cannot drain out the excess water. Tables 55 and 56 present a summary of the IAs responses to technical and irriga t ion
operation inquiries. From Tables 55 and 56, it is evident that most of the respondents have indicated silt problems in canals and difficulty in operating check gates/structures
in the system are the major technical concerns in NIS. Table 55 is a summary of KII for technical issues across all NIS in the Philippines in
terms of canal conditions (e.g. siltation) maintenance and operation of structures as well as satisfaction rating based on Flexibility, Reliability, and Equitability Indices. It can
be seen that most NIS in the Philippines are facing siltation problems in canals (i.e bet 50 to 75% are affected). Ease of operation of structures such as cross regulators and offtakes on the other hand have average rating across the NIS in the Philippines, while
satisfaction rating based on the 3 indices of Flexibility, Reliability, and Equitability indicate that they have above average rating of ¾ across all NIS in the Philippines.

188 | P a g e
Table 56 is a summary of the KII for technical issues across all NIS in the Philipp ines in terms of structures and systems operation and management. It appears that the rules
and policies for operations of structures (e.g. cross regulators, offtakes etc) are strictly followed with some minor deviations in some NIS across the Philippines. Also, in terms
of water management, most NIS in the Philippines are practicing AWD and drainage re use which indicates the farmers awareness on current technology for water saving especially during times when there is water shortage.
Table 55. IA responses to technical inquiries
Questions LUZON VISAYAS MINDANAO PHILIPPINES
AVE TOTAL AVE TOTAL AVE TOTAL AVE TOTAL
Silt in canals
(4=high, 0=low) 2.53 57 2.29 7 1.44 8 2.38 72
Percentage of a
typical canal
section that is
fi l led with silt,
(0= 0%, 1<=25%,
2<=50%,
3<=75%,
4<=100%)
2.23 35 1.43 7 1.29 7 1.98 49
General lack of
undesired
seepage (0-high
seepage, 4-very
l ittle seepage)
2.67 52 2.71 7 3.36 7 2.75 66
Availability of
staff to
adequately
maintain the
assigned canal
sections (0-not
adequate, 4-
adequate)
3.31 54 2.07 7 2.38 8 3.08 69
Availability of
proper
equipment to
adequately
maintain the
assigned canal
sections (0-not
adequate, 4-
adequate)
2.24 55 1.43 7 0.94 8 2.01 70
General
condition of
cross regulators
2.02 51 3.07 7 2.88 8 2.23 66

189 | P a g e
Questions LUZON VISAYAS MINDANAO PHILIPPINES
AVE TOTAL AVE TOTAL AVE TOTAL AVE TOTAL
(0-Worst, 4-
Excellent):
Ease of cross
regulator
operation (0-
impossible to
operate, 4-very
easy to
operate):
2.50 42 3.29 7 3.00 8 2.67 57
Availability of
roads along the
canal (0- no
access, 4-very
good access):
2.88 49 2.86 7 3.06 8 2.90 64
Can they
operate as
needed? (4-very
easy, 0-difficult
to operate):
2.83 52 2.93 7 3.00 7 2.86 66
Are they
physically
operated as
designed? (4-
excellent, 0-not
operated as
designed):
3.12 50 2.86 7 2.83 6 3.06 63
Personnel from
what level
operate the
offtakes? (1=this
level, 2=lower,
3=both):
1.93 44 3.00 7 2.50 8 2.14 59
Flexibil ity Index
(0-schedule
unknown, 4-
highly flexible)
3.06 49 3.21 7 2.88 8 3.05 64
Reliability Index
(0-unreliable, 4-
available as
scheduled)
3.21 52 3.57 7 3.81 8 3.32 67
Equitability
Index (4-100%
of the area has
equitable
distribution, 0-
3.53 47 3.57 7 3.44 8 3.52 62

190 | P a g e
Questions LUZON VISAYAS MINDANAO PHILIPPINES
AVE TOTAL AVE TOTAL AVE TOTAL AVE TOTAL
no consistent
pattern)
Table 56. Summary of responses pertaining to irrigation operation
Questions
LUZON VISAYAS MINDANAO PHILIPPINES
YES
NO
Blan
k
TOTA
L
YES
NO
Blan
k
TOTA
L
YES
NO
Blan
k
TOTA
L
YES
NO
Blan
k
TOTA
L
Is there an
existing
system of
operation
for the
canal cross
regulator/s
? 44 8 8 60 7 0 1 8 6 2 0 8 57 10 9 76
Are
operators
allowed to
have
deviations
from the
approved
system? 8 39 13 60 5 2 1 8 2 4 2 8 15 45 16 76
Is there a
time the
operation
made
deviations? 12 33 15 60 3 2 3 8 3 1 4 8 18 36 22 76
Is there a
l ine of
communica
tion
between
the
operator
and IA? 51 2 7 60 7 0 1 8 8 0 0 8 66 2 8 76
Is there an
existing
system of
operation
for the
offtakes? 40 4 16 60 7 0 1 8 7 1 0 8 54 5 17 76

191 | P a g e
Questions
LUZON VISAYAS MINDANAO PHILIPPINES
YES
NO
Blan
k
TOTA
L
YES
NO
Blan
k
TOTA
L
YES
NO
Blan
k
TOTA
L
YES
NO
Blan
k
TOTA
L
Are
operators
allowed to
have
deviations
from the
approved
system? 7 34 19 60 4 2 2 8 4 2 2 8 15 38 23 76
Is there a
time the
operator
made
deviations? 18 23 19 60 6 0 2 8 3 1 4 8 27 24 25 76
Are there
any direct
farm
offtake
(<2has)
from the
Main/Later
al Canal? 25 15 20 60 0 0 25 15 20 60
Do these
direct farm
offtakes
affect
operation? 16 5 39 60 0 0 16 5 39 60
Are there
farmers
practicing
alternate
wet and dry
method? 31 22 7 60 5 2 1 8 5 2 1 8 41 26 9 76
Re-using
drainage
water for
irrigation? 19 16 25 60 6 1 1 8 8 0 0 8 33 17 26 76
The issue on siltation is further validated by the degree of lining of main canals and laterals in selected NIS cases. The efficiency of water distribution is a function of the
condition of the main canals and laterals especially in terms of the lining coverage and degree of siltation. It was emphasized earlier that siltation causes reduction in discharge capacity of canals and results to poor water delivery esp. in the downstream part. In
view of the perennial problem of poor water distribution in NIS cases due to lack of maintenance and siltation of main canals and laterals, it is being contemplated to adopt

192 | P a g e
pipe irrigation system in NIS. To evaluate the feasibility of this option, Table 57 shows the comparison between lined/unlined canals and pipelines.
Table 57. Comparison between Earth/Lined Canals and Pipelines as main and secondary distribution waterways
Features Lined/Unlined Pipeline
Design Trapezoidal, Lined or unlinedearth or concrete Circular, Steel or Iron
Dimensions Z, D, W, T Diameter
Maintenance Cleaning/ Disiltation Flushing
Efficiency 40-70% 80-90%
Life span short term Long term
Pros/Cons Low initial cost, high maintenance High initial cost, low maintenance
high water losses water losses nil
Recom make a cost benefit analyis to establish/justify pipe use
(Source: Taken from Irrigation Books and Lecture Notes)
Based on Table 57, it is worth exploring on investing for pipe network since the cost of maintenance is low, and conveyance/distribution efficiency is high as seepage and
percolation losses are minimal. Also, evaporation loss especially during summer is basically nil since it’s an enclosed system. But the return to investment can be obtained
after several years of operation. A detailed cost analysis is needed to estimate the investment needed and when the cost will be recovered. A pilot project is recommended to establish its feasibility and viability with respect to economic, technical and social
implications.
For now, the use of pipes in the mains and laterals will not be economically feasible. As discussed in the Final Report, repair or rehabilitation of main and lateral will disrupt operation for at least two cropping seasons. In all the NIS covered, problems raised
include siltation and solid waste clogging. This will be a major problem in a pipe system even if it has a control system for silt and clogs.
It is recommended to use pipe system in main and lateral canals on a case to case basis, in cases where there are:
a. Sections prone to erosion; b. Sections damaged by high flows;
c. Sections silted by nearby hill or sloping areas; d. Sections for road widening (partial only); e. Sections to be used for multi-purpose like drying pavement, community
space/park, etc but not for residential and commercial purposes
It is recommended to implement pipe system in small laterals and farm ditches (main and supplementary). Pipe system will support land consolidation. This is to facilita te
farm operations, especially mechanization activities. On the Institutional aspect, the KII and FGDs of the different IAs representing the 151
NIS, have generated some findings which have come out as the important issues related to the Institutional/Technical performance of selected NIS cases. Lack of policy or its

193 | P a g e
weak implementation on illegal settlers, dumping of garbage, and illegal pumping has caused both delivery and environmental issues. Other issues include poor water
delivery scheduling and distribution and conflicts among users especially when upstream members block the path of water which reduces the water supply for the
downstream part. Farmers are also resistant to change and new technology adoption and some are hesitant to pay ISF because of poor water service especially in the downstream part. Many farmers are still traditional and don’t follow crop calendar.
Another pressing issue is the high prevailing costs of inputs while selling price of harvest is low. Informal settlers along the canals pose solid waste problems. Farm to
market roads are also in poor condition in some IAs and they are not passable especially during wet season.
On the environmental aspect focusing on water quality, most NIS cases showed pH levels on the alkaline side (> 7) which can be attributed to excess sodium and can
therefore lead to sodicity problem in the future and pose serious problem on water quality especially if this is combined with high salinity levels. In fact, some NIS cases (especially those pumping ground water like TGIS) and due to sea water intrusion (e.g.
Magapit PIS), salinity is a problem (i.e. EC is > 300uS/cm) which can pose serious effects on crop development and yield if not properly addressed. Another important
water quality indicator which affects photosynthesis and thus biomass production is DO which was found to be low (i.e. 6 < ppm) in some NIS case (e.g. downstream of Vaca dam and PDRIS end of downstream. This can be attributed to the thick aquatic
vegetation just upstream of the Vaca dam which has caused the reduction of DO downstream. DO is very important in photosynthesis which is responsible for biomass
production. The effect of poor water quality, especially on crop productivity has not been established yet since data on yield of the different NIS cases visited are not yet available. During the site visits, transplanting has just started so it would be important
to gather information on yield, so we can assess the effect of poor water quality on crop productivity (i.e. yield per irrigated area). We expect this information to be availab le
during the next cycle and thus can make more analysis on the relationship between water quality and yield.
6.2. Conclusions
Many technical/institutional/environmental issues confront the NIS covered based on
the ocular inspection, walkthroughs and measurements of water flows and quality and siltation. In our face to face discussion with the Engineers and Field guides, some pressing issues raised consist of 1) Non-functional, missing or damaged structures
(check gates, staff gauges, etc.) Siltation and lack of canal maintenance, and 3) Lack of policy or its weak enforcement with regards to canal maintenance, illegal settlers,
illegal pumping and dumping of garbage. In addition, animals (esp. carabaos) are frequenting the earth canals which cause damage and collapse of the canal side slopes which can result in more serious problem such as reduction in capacity and increase in
maintenance costs. In some cases, there are misplaced or damaged structures (concrete turnouts or division boxes) which need immediate restoration to maintain its designated
functions. The technical aspects included in the analysis consists of the effect of lining on water
distribution efficiency which in turn affects water delivery service as most downstream users complain of inadequate water in their areas. Most unlined canals are also silted

194 | P a g e
which reduces the discharge capacity of the distribution systems. Water losses and low capacity are the main technical reasons for poor water service delivery. That is why a
comparison between unlined/lined canals and pipe network was presented in Table 57 to explore the potential of pipe use because of its high efficiency (low conveyance
losses due to seepage and percolation) and low maintenance costs. This will be part of the recommendations.
The above key issues identified during the site visits need to be addressed to improve performance of the NIS cases considered. As to the deliverables or expectations from
the NIS component, the following conclusions are drawn as per objectives of the project as follows:
Objective 1: Characterize the distribution of all the NIS; examine the trends and patterns of performance indicators of NIS across the different systems in the country, based on
primary and secondary sources. The distribution of NIS performance across all systems in the Philippines, is clearly
explained by the results of PCA which indicates which IAs in every NIS have shown low, moderate and high performance. The analysis was done using both secondary data
(from NISPER/CO) and primary data (from IAs questionnaire survey and field visits and water flow and quality measurements). The distribution of IAs performance is reflected in the GIS maps for the whole country and results show that almost all IAs in
Visayas and Mindanao are showing low level of performance based on the combined effects of Technical/Institutional, SocioEconomic and Environmental factors.
In reference to the trends and patterns of performance, indicators such as Irrigation intensity (II), Cropping Intensity (CI), ratio of irrigated area to service area, ISF
collection and viability index, were used to assess the different NIS in the country. Except for Manupali RIS, most of the target NIS in Mindanao has relatively higher
Irrigation Intensities. Irrigation Intensity is generally increasing in Jalaur-Suage RIS, Mlang RIS with a slight dip in 2014 and 2015, Marbel RIS, Banga RIS with a slight dip in 2013-2015, and Padada RIS, was fluctuating in Mambusao RIS, Sibalom-Tigbauan
RIS, Capayas IS and Bayongan IS. The average irrigation intensity (2013-2017) for the target NIS in Bohol ranges from 96% to 144%.
For the Cropping Intensity, the average CI (2010-2014) for MARIIS ranges from 184% to 226%. The high cropping intensity was due to third cropping and QTA in some
sections of the irrigated area. The average CI for the Ambayoan-Diplao RIS, on the other hand was quite low ranging from 86 to 109% (2010-2014). The reason is that
structures were destroyed during 2014 typhoon and there are canals that have become shallow due to siltation. In the Dumacaa RIS, average CI ranges from 142% to 168% (2010-2014). Other than problems with canal lining, another reason for the relative ly
low cropping intensity was the declining water intake. Actual irrigated area was lower than FUSA even in the existence of intake and reuse dams within the service area. The
average CI for Bukidnon NIS ranges from 81% to 186% (2013-2017). The main reason reason for the relatively low cropping intensity were siltation and low water supply. On the other hand, the average CI for South Cotabato NIS ranges from 178% to 186%
(2013-2017). The relatively higher cropping intensity may be attributed to high percentage of lined canals and the synchronized scheduling of irrigation.
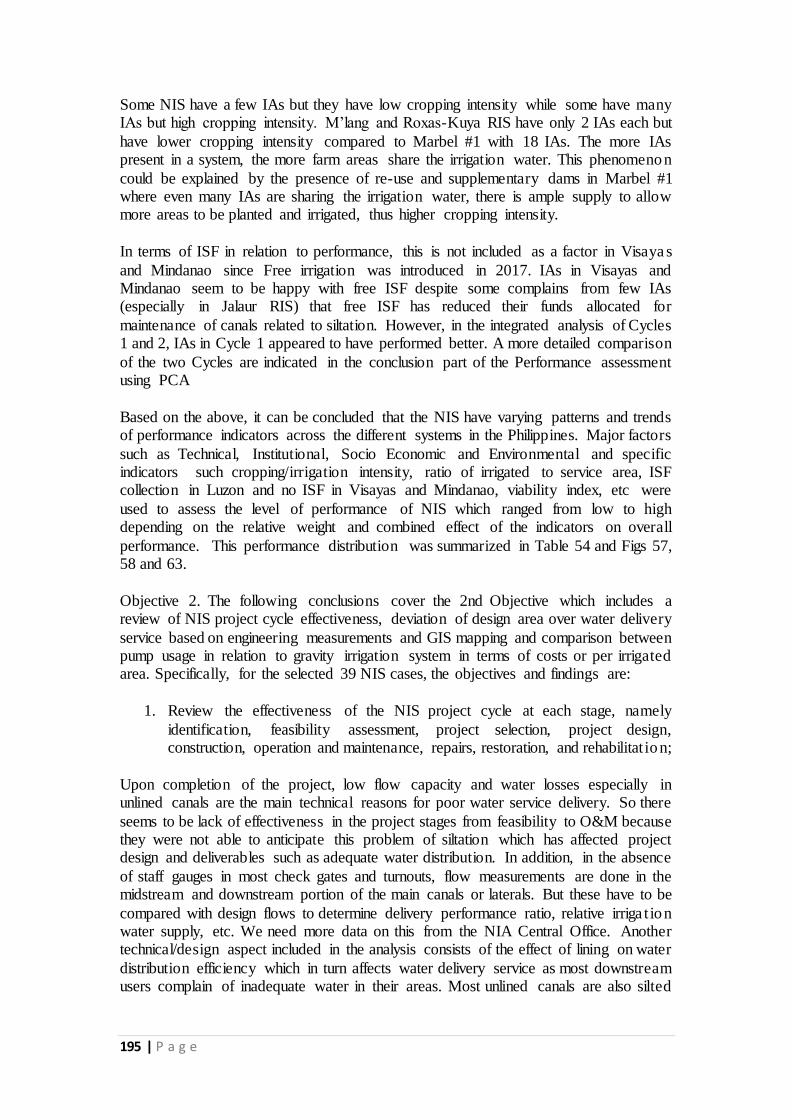
195 | P a g e
Some NIS have a few IAs but they have low cropping intensity while some have many IAs but high cropping intensity. M’lang and Roxas-Kuya RIS have only 2 IAs each but
have lower cropping intensity compared to Marbel #1 with 18 IAs. The more IAs present in a system, the more farm areas share the irrigation water. This phenomenon
could be explained by the presence of re-use and supplementary dams in Marbel #1 where even many IAs are sharing the irrigation water, there is ample supply to allow more areas to be planted and irrigated, thus higher cropping intensity.
In terms of ISF in relation to performance, this is not included as a factor in Visaya s
and Mindanao since Free irrigation was introduced in 2017. IAs in Visayas and Mindanao seem to be happy with free ISF despite some complains from few IAs (especially in Jalaur RIS) that free ISF has reduced their funds allocated for
maintenance of canals related to siltation. However, in the integrated analysis of Cycles 1 and 2, IAs in Cycle 1 appeared to have performed better. A more detailed comparison
of the two Cycles are indicated in the conclusion part of the Performance assessment using PCA
Based on the above, it can be concluded that the NIS have varying patterns and trends of performance indicators across the different systems in the Philippines. Major factors
such as Technical, Institutional, Socio Economic and Environmental and specific indicators such cropping/irrigation intensity, ratio of irrigated to service area, ISF collection in Luzon and no ISF in Visayas and Mindanao, viability index, etc were
used to assess the level of performance of NIS which ranged from low to high depending on the relative weight and combined effect of the indicators on overall
performance. This performance distribution was summarized in Table 54 and Figs 57, 58 and 63.
Objective 2. The following conclusions cover the 2nd Objective which includes a review of NIS project cycle effectiveness, deviation of design area over water delivery
service based on engineering measurements and GIS mapping and comparison between pump usage in relation to gravity irrigation system in terms of costs or per irrigated area. Specifically, for the selected 39 NIS cases, the objectives and findings are:
1. Review the effectiveness of the NIS project cycle at each stage, namely
identification, feasibility assessment, project selection, project design, construction, operation and maintenance, repairs, restoration, and rehabilitat ion;
Upon completion of the project, low flow capacity and water losses especially in unlined canals are the main technical reasons for poor water service delivery. So there
seems to be lack of effectiveness in the project stages from feasibility to O&M because they were not able to anticipate this problem of siltation which has affected project design and deliverables such as adequate water distribution. In addition, in the absence
of staff gauges in most check gates and turnouts, flow measurements are done in the midstream and downstream portion of the main canals or laterals. But these have to be
compared with design flows to determine delivery performance ratio, relative irriga t ion water supply, etc. We need more data on this from the NIA Central Office. Another technical/design aspect included in the analysis consists of the effect of lining on water
distribution efficiency which in turn affects water delivery service as most downstream users complain of inadequate water in their areas. Most unlined canals are also silted

196 | P a g e
which reduces the discharge capacity of the distribution systems. This is part of O&M in the project cycle which seems to be ineffective.
New projects with available funds build new infrastructures which could be
implemented and laid out according to new design and expected outputs. Rehabilita t ion of old projects, on the other hand, could have constraints, which may include more rehabilitation expenses, allocated funds have been used up, etc.
In NIS, the trend of focusing on new projects instead of finishing up old/incomple te
projects seem to demonstrate the lack of commitment to comply with old project deliverables. But the contract should have been followed until completion. This may be in part due to lack of budget to finish up the incomplete projects or it could be that
the feasibility of opening new projects with new budget seem more promising.
The annual growth of new irrigated areas seems to go on a slow pace despite the huge investments introduced for development projects. This may be in part due to the low irrigation potential of the available agricultural lands for expansion which is commonly
constrained by slope, soil and productivity limitations. So proper land suitability assessment and classification may be needed to enhance the expansion and growth rate
of new irrigation areas. Moreover, land conversion to give way for industrial and residential area expansion seem to be having priority from developers. Based on the above, a conclusion can be drawn that some stages of the project cycle,
most especially O&M, are showing some drawbacks and ineffectiveness as evidenced by canal siltation, too much water losses in unlined canals, non functional gauges and
devices, etc.
2. Characterize and explain deviations, if any, from design area and intended water
service delivery, based on technical evaluation, engineering measurements, GIS mapping, site visits (including walk-through), and key informant interviews
especially of irrigators’ association (IA) members; By using GIS map overlay, the study is able to show the unsuitability of significant
proportions of NIS service areas to irrigated rice farming. A representative example from the NIS in Luzon is the case of MARIIS—a huge system with about 80,000
hectares of service area (see erosion map, Figure 3), which shows a reduction in Firmed-Up Service Area (FUSA) by 16 percent because of soil erodibilityalone. Meanwhile, the overlaid maps which incorporates other attributes such as built up areas,
slope, soil type, and erodibility, indicate that only 54 percent of the total FUSA in MARIIS is most suitable to irrigated rice agriculture based on GIS mapping (Figure 4).
Conversely, 46 percent is unsuitable, which may be the reason why suboptimal yields are obtained within the system.
Similarly, diagnostics are performed for the other systems, with varying estimates of irrigated rice suitability.. GIS maps also documented the degraded state of some NIS
watersheds which also accounted for the heavy siltation in these systems. During the design stage, system performance considered was based from the design
standards that all canals were lined, and canal structures were in place. However, after construction, most of the NIS in the country were actually completed if compared to
the original design. Most of the deviations were unlined canal and reduced area covered.

197 | P a g e
Thus, it resulted in the deviation between designed service area and actual irrigated area. Moreover, there were no interactions between design and O&M engineers of
irrigation system (David, 2004). Problems related to design during operations were not properly conveyed to the designers. This is evident in the problems encountered by the
NIS designed in the 1970s and those designed in the early 2000s which encountered the same operational problems such as canal seepage, siltation and lack of or non functiona l structures.
On the issue of overlapping of new and old service areas, during the time with ISF, the
area is under declared to reduce payment because collection is based on area. With free ISF, areas have increased to have higher subsidy since it is based on area irrigated. To address the overlapping areas, GIS mapping of boundaries should be performed to
identify the areal scope and verify justification of each IA. As such no double declaration of areas can occur for subsidy allocation.
Based on the above, it can concluded that there are some deviations/descripanc ies between design and irrigated areas and this was due to the reduction in service area
because of the effects of slope, soil erodibility, soil type and built up areas which were captured by GIS mapping of the watershed. So GIS would be an important tool to
determine suitable areas for irrigation project design and development.
3. Characterize and evaluate the incidence of individual pump usage within or in
the vicinity of the selected NIS, in terms of effectiveness and cost, in relation to gravity irrigation users.
Pump usage to access water from shallow wells and groundwater has been documented in some NIS cases in Luzon Visayas and Mindanao. It was found that pumping costs
per irrigated area are commonly higher than gravity irrigation (e.g. TGIS, Magapit PIS, Libmanan-Cabusao PIS and Solana PIS in Luzon Mambusao RIS, Malinao, Capayas,
Bayongan IS in Visayas, etc.). This could be due to the higher costs of fuel or electric ity involved in pumping which is closely related to the depth of groundwater source. But ground water is a good alternative for conjunctive use of water resources, that is why
maps of ground water potentials are shown in specific NIS cases. Most cases of installation of shallow tube wells can be observed in Visayas and Mindanao NIS such
as in Jalaur-Suage RIS, Barotac Viejo RIS, Mambusao RIS, Padada RIS and Pulangui RIS.
An additional feature of NIS evaluation is the inclusion of water quality as an indicator of irrigation performance, considering its effect on rice yield, as evidenced by previous
studies. So in addition to water flow measurements, irrigation water quality parameters such as pH, dissolved oxygen (DO), and Electrical conductivity (EC) in main canals and laterals, using water quality kits, was measured in canals whose water is coming
from surface and ground water systems. It was found that most of the water in NIS main canals and laterals exhibited reasonably good water quality as reflected in EC
<300 uS/cm, DO > 6 ppm and neutral pH (5 to 7). But some cases of low water quality were observed in Luzon especially those pumping ground water (e.g. TGIS) and due to sea water intrusion (e.g. Magapit PIS), where salinity is a problem (i.e. EC is > 300
uS/cm). This is another issue associated with pumping saline shallow wells and groundwater since it can pose serious effects on crop development and yield if not
properly addressed.

198 | P a g e
Another important water quality indicator which affects photosynthesis and thus biomass production is DO which was found to be low (i.e. 6 < ppm) in some NIS case
(e.g. downstream of Vaca dam and PDRIS end of downstream. This can be attributed to the thick aquatic vegetation just upstream of the Vaca dam which has caused the
reduction of DO downstream. Also, few systems in Iloilo (e.g. Sibalom-Tigbauan RIS), Bohol (e.g. Capayas and Bayongan IS), Davao del Sur (e.g Padada RIS), North Cotabato (e.g MalMar 2), Bukidnon (all NIS) are showing low water quality as per
threshold values. The effects on crop development and yield in areas showing low DO and high EC and high pH may have been exhibited in some NIS where rice yield have
ranged from 70 to 100 cavans per hectare compared to other sites with high production (i.e. 150 cavan per ha). For instance, in Barotac Viejo and Sibalom NIS sites in Iloilo, yield was as low as 70 and 100 cavans per hectare respectively during first cropping
due to high EC (> 400) and high pH (> 7). This was also true in Padada, Davao del Sur and Marbel, Cotabato where yield was only 110 and 80 cavans per hectare respectively
and this can be due to the effect of high EC and pH and low Do (<6ppm) to name a few.
Based on the above, it can be concluded that although pumping ground water for irrigation purposes is more expensive than gravity irrigation system, it can however be
used for conjunctive use purposes, especially when there is shortage in surface water supply. But its potential should be assessed to establish its safe yield and also consider water quality issues associated with saline groundwater.
Objective 3: Undertake an overall review of the effectiveness of the NIS project cycle
based on Objectives (1) and (2) and state recommendations to improve project identification, selection, design, implementation, operations, and maintenance.
On the performance assessment in Cycle 2 covering Visayas and Mindanao NIS, PCA results indicate that around 32% of IAs have low performance compared to 47% in
Cycle 1. Only 12% showed high performance in Cycle 1 and it was 23% in Cycle 2 and these are found to be located at the upstream part which receive adequate water supply compared to the downstream part which are the ones showing low performance. So
basically, even limited technical data on flows are included in the analysis of indicators, it is already showing that water delivery is one major factor which is causing low
performance. The inadequacy of water supply in the downstream part of the system can be attributed again to the technical issue on canal siltation which has reduced its delivery capacity, thus affecting the tail end users. Also, the separate analysis for Cycle
1 and 2 has shown that IAs in Cycle 2 seem to be performing better than IAs in Cycle 1. It should be noted that in Cycle 1, ISF was being collected and collection fee was
one of the indicators of performance. Since ISF is free in Cycle 2, it appears that farmers who composed the IAs are quite happy since they can use their savings from free irrigation for other purposes. But some isolated cases reported that with no ISF,
funds seem inadequate for managing their canals to control or reduce siltation.
In the development of Irrigation Performance Index (IPI) based on the total sample size of 151 IAs throughout the Philippines, results show that only 22% of the samples have high level of irrigation performance while those having moderate to low performance
are 33% and 45%, respectively. Most of the low performing IAs are from Visayas and Mindanao. It should be noted in the integrated analysis, a dummy variable representing
ISF (i.e. whether IAs are collecting ISF or not) was used and results imply that ISF is a

199 | P a g e
significant factor that is likely to increase IAs performance. Results also indicate that there still remains a high percentage of the systems which needs improvement in their
performance and recommendations on how to address the issues affecting the NIS performance, are suggested in the recommendation.
It should be noted that IPI also reflects the technical and Institutional effectiveness of the project cycle from project identification, feasibility up to O&M since the factors
and questions related to these stages of the project are captured in the PCA. Moreover, the IPI is more than just Technical and Institutional dimension of irriga t ion
management because it also includes socio-economic and environmental indicators that affect irrigation systems performance and effectiveness. That is why our irriga t ion evaluation approach is more comprehensive and encompassing since it covers both the
effectiveness and overall performance of the systems based on 4 major indicators.
However, in every approach or methodology, there is of course some drawbacks and limitations. This is addressed in the recommendation section.
6.3.Recommendations
The major technical issues confronting the NIS covered consist of siltation and poor
water distribution and delivery especially in the downstream areas. The poor water distribution in most NIS cases is mainly due to water losses especially in earth canals
where seepage and percolation losses could be high. Irrigation service is also adversely affected by illegal settlers, dumping of garbage, and illegal pumping. Some recommendations to address the above concerns are as follows:
1. Good watershed management is needed as a preventive approach to address the
siltation problems in water courses and, thus, improve discharge capacity of water distribution canals.
Watershed management could also improve water intake into NIS diversion dams. However, the control of the watershed of irrigation systems should be transferred first
to the NIA. Watershed management is under the jurisdiction of the Department of Environment and Natural Resources (DENR). NIA should conduct a better assessment
of the state of the watersheds for each NIS project and properly factor the results in the system design and O&M (as short- and medium-term recommendations). Watershed management is already part of the NIA’s charter. However, it will require allocation of
substantial resources and not just “coordination” with the DENR. A more comprehensive approach called Integrated Watershed Management (IWM) can be
adopted with the following objectives: (1) control damaging runoff and degradation and, thereby, conserve soil and water; (2) protect and conserve the watershed for more efficient and sustained production; (3) protect and enhance the water resource
originating from the watershed; (4) control soil erosion in the watershed and reduce the effect of sedimentation in downstream areas, including water courses and canals and
(5) increase infiltration of rainwater and improve soil and ground water recharge, wherever applicable.
2. In view of the perennial problem of poor water distribution in NIS cases due to
lack of maintenance and siltation of main canals and laterals, it is being contemplated to adopt pipe irrigation system in NIS.

200 | P a g e
Based on Table 57, it is worth exploring on investing for pipe network since the cost of maintenance is low, and conveyance/distribution efficiency is high. Also, evaporation loss especially during summer is basically nil since it’s an enclosed system. But the
return to investment can be obtained after several years of operation. A detailed cost analysis is needed to estimate the investment needed and when the cost will be
recovered. A pilot project is recommended to establish its feasibility and viability with respect to economic, technical and social implications. Also, in case pipe use is preferred, it is recommended to implement pipe system in small laterals and farm
ditches (main and supplementary). Pipe system will support land consolidation. This is to facilitate farm operations, especially mechanization activities.
3. Canal and its appurtenant structures require additional maintenance and
rehabilitation (i.e., lining of canals) to improve efficiency in water allocation
and distribution from upstream to downstream users.
NIA should allocate realistic resources for O&M and formulate effective policies and incentive systems, so as not to defer O&M until the problem becomes a major
rehabilitation project. The target is to establish the system condition near its design condition (i.e., conveyance losses to its minimum and control structures working properly). The poor water distribution in most NIS cases is mainly due to water losses,
especially in earth (unlined) canals. However, canal lining, although effective in reducing water losses, should be evaluated to confirm its long-term efficiency in
comparison with unlined canals. Some background papers from the Mapping System and Services for Canal Operation Techniques or MASSCOTE showed that 2–3 years after lining, the efficiency of lined canals are no different from unlined canals.
The Irrigation Performance Index (IPI) has also shown that the technical aspect of
irrigation management is a major indicator of performance which implies that O&M should be given high priority by NIA especially focusing on reduction of siltation (as per # 1), reduction of water losses via pipe use or canal lining (as per # 2 and 3) and
proper monitoring of water flows (as per # 4). With these measures, adequate and equitable water distribution and allocation will be enhanced.
4. Water flow is a basic measure critical to system management. However, this
information could not be obtained due to the non-operational check gauges.
NIA should have a regular monitoring of structures so timely repair or replacement, of
damaged or non-functional devices are done on schedule. Water quality on the other hand which are characterized by some indicators such as dissolved oxygen (DO), pH and electrical conductivity (EC) which is related to salinity level, are showing
acceptable levels in most NIS in Cycle 2. However, this should be checked seasonally and should be part of monitoring and evaluation programs of NIA to become a basis
for policy formulation. This is to avoid water quality deterioration in the future which could have an effect on yield as was reported in Literature and somehow linked in this study.
5. The use of GIS analysis was useful in mapping the location of structures, measurements, and spatial analysis of erosion, groundwater potential, flooding,
and distribution of IA performance.

201 | P a g e
GIS applications can be further enhanced in targeting interventions (i.e., in helping the NIA and the Department of Agriculture improve land productivity) and in determining
suitable areas for irrigation. It can also be used as a tool for project identificat ion, selection, design and implementation based on suitability of lands for irriga t ion
development as reflected in slope, soil erosion and ground water potential maps. On the issue of overlapping of new and old service areas, this can be related with the
ISF. During the time with ISF, the area is under declared to reduce payment because collection is based on area. With free ISF, areas have increased to have higher subsidy
since it is based on area irrigated. To address the overlapping areas, GIS mapping of boundaries should be performed to identify the areal scope and verify justification of each IA. As such no double declaration of areas can occur for subsidy allocation.
6. Estimation of ground water recharge seems to be out of scope in the present
study since it needs more time and intensive data gathering related to groundwater balance components such as rainfall, runoff, evapotranspirat ion, subsurface inflow and outflow and deep percolation and upward flux. This
entails another independent study since we need to have the measured data from the NIS sites covered. In this regard it is proposed to undertake a separate
research project in the future which focuses on detailed hydrologic data gathering and modeling of ground water balance.
Moreover, there is a need to reevaluate the definition of potential irrigable areas, including the assessment of water supply sources and comprehensive land use plans of
the local government units. In estimating potential irrigable areas, improved data collection and management is required. In all the feasibility studies of all the NIS in the country, data adequacy and quality are always the constraints to proper estimation of
irrigable areas. Although soil texture and land suitability to certain type of crops were being considered during the design, reliable and adequate data in the field were not
collected. Science-based information hydrologic data should include smaller rivers and creeks. Water supply and water demand projections using new climate change scenarios can be useful in identifying new and potential sites for irrigation development.
7. It was mentioned that the Irrigation Performance Index (IPI), which is
determined by multi variate analysis of all the factors that affect irriga t ion system performance, could have some limitations. The main drawback in estimating IPI is the adequacy of data related to the numerous factors under each
principal component or major indicator (i.e., Technical, Institutiona l, SocioEconomic and Environmental). In effect, if those data are not sufficient or
the quality is in question, then it could render the findings to be not conclusive. Therefore to address this limitation and improve the analysis and results, we should consider in future studies/analyses the seasonal variation in water supply
and quality as well as increase and enhance water flow and quality measurements by upgrading structures/devices, and further improve
questionnaires to cover all aspects of irrigation management. 8. Regular monitoring and proper implementation of policies related to illega l
activities that affect irrigation system functionality (e.g. illegal settlers,
pumping, and waste disposal) should be enforced and penalties are meted to violators).

202 | P a g e
The above recommendations somehow reflect the 3rd Objective of the NIS component, that is, state recommendations to improve project identification, selection, design,
implementation, operations, and maintenance. It was evident that there was some ineffectiveness in each stage of the Project Cycle with more drawbacks being
encountered or showing up in the O&M phase of the Project Cycle. Specifically, the observed problems in almost all NIS cases in the country are related to O&M which include non operational canal structures/devices, canal siltation,and reduced water flow
capacity, among others, which resulted in inequitable distribution of water. The downstream users are the ones mostly affected since they don’t usually get enough
water or non at all, when it is most needed. In effect these areas showed poor irriga t ion performance across all systems which often led to low yield and poor income of the farmers. So to address this problem, that is to improve O&M of the project cycle, NIA
needs to prioritize the recommendations above, in terms of fund allocation and proper implementation.and monitoring.

203 | P a g e
References
AQUINO, AP, VAA LIM, PAB ANI. 2013. December 30, 2013. Republic Act 7607: Empowering
Smallhold Farmers in their Economic Endeavors.
BELONIO, AT. 2006. Dictionary of Agricultural Engineering.
BHALAGE, P, BB JADIA, ST SANGALE. 2015. Case Studies of Innovative Irrigation Management
Techniques. International Conference on Water Resources, Coastal and Ocean
Engineering (ICWRCOE 2015). Aquatic Procedia 4: 1197 – 1202.
CLEMENTE, RS and Tiewtoy, S. 2013. Assessment of Irrigation Sustainability in Tha Chin Basin
Thailand and Development of a Framework for Water Management in the Basin.
2013. Paper Presented at a Training Workshop on Climate Change Adaptation in
Watersheds for Water, Food, and Environmental Security which was held at SEARCA,
UP Los Banos from Oct. 15 to Oct 18 2013
COLLINS ENGLISH DICTIONARY. Copyright © HarperCollins Publishers
DAVID, WP. 2003. Averting the Water Crisis in Agriculture: Policy and Program Framework for
Irrigation Development in the Philippines. Diliman, Quezon City: University of the
Philippines Press. 168 p.
DAVID WP, MF DELOS REYES, MG VILLANO, AL FAJARDO. 2012. Design shortcomings of the
headwork and water distribution and control facilities of the canal irrigation systems
of Ilocos Norte, Philippines. Philipp Agric Scientist 95 (1):61–75.
DAVID, WP. 1986. Policy Issues on Irrigation. Agenda for Action for the Philippine Rural Sector,
Green book of the Center for Policy and Developmental Study. College, Laguna,
Philippines: University of the Philippines Los Baños. p. V.28-V.56
DAVID, WP. 2004. Water Resources and Irrigation Policy Issues in Asia. Asian Journal of
Agriculture and Development 1 (1): 76-97.
DAVID, WP. 2008. Irrigation (Chapter 6). In: Dy Rolando T, Gonzales Leonardo A, Bonifacio
Manuel F, David Wilfredo P, De Vera III J Prospero E, Lantican Flordeliza A, Llanto
Gilberto M, Martinez Lydia O, Tan Eleonora E, editors. Modernizing Philippine
Agriculture and Fisheries: The AFMA Implementation Experience. Manila: University
of Asia and the Pacific. p.85-128
DAVID, WP. 2009. Impact of AFMA on irrigation and irrigated agriculture. Philipp Agric
Scientist 91 (3):315–328. [DA] Department of Agriculture. 1998. Implementing Rules
and Regulations. Republic Act 8435 Agriculture and Fisheries Modernization Act
(AFMA). Administrative Order 2-A. Diliman, Quezon City.

204 | P a g e
FANG, S, R JIA, W TU, Z SUN. 2017. Assessing Factors Driving the Change of Irrigation Water-
Use Efficiency in China Based on Geographical features. An open Access Journal,
College of Civil Science and Engineering, Yangzhou University, Yangzhou China.
FERGUSON, C. 1987. Returns to Irrigation Intensification in Philippine Gravity Systems. [Ph.D.
Dissertation]. Ithaca, New York: Cornell University. 584 p.
GAO, J, F DUAN, B XIANG. (n.d). The application of principal component analysis to agriculture
soil contamination assessment.
HORST, L. 1998. The Dilemmas of Water Division: Considerations and Criteria for Irrigation
Systems Design. Colombo, Sri Lanka: International Water Management Institute.
231 p.
HUYNH, VK, M YABE. 2012. Rice Yield Loss Due to Industrial Pollution in Vietnam.
Journal of US-China Public Administration, Vol. 9, No. 3, 248-256.
INOCENCIO, A.B., D.D. ELAZEGUI, R.A. LUYUN JR., A.C. ROLA. 2018. Agricultural Water
Management Issues in the Philippines, in Water Policy in the Philippines: Issues,
Initiatives, and Prospects. Agnes C. Rola, Juan M. Pulhin, Rosalie Arcala Hall (editors).
Global Issues in Water Policy book series (GLOB, volume 8). Springer International
Publishing AG. 285 pp.
KAZMI, SI, MW ERTSEN, MR ASI. 2012. The impact of conjunctive use of canal and tube well
water in Lagar irrigated area, Pakistan. Physics and Chemistry of the Earth 47–48: 86–
98.
LAND RECLAMATION AND IMPROVEMENT (ILRI) Wageningen, The Netherlands. Retrieved
March 2003 www.waterlog.info.
LANKFORD, B. 2012. Fictions, fractions, factorials and fractures; on the framing of irrigation
efficiency. Agricultural Water Management 108: 27– 38.
MOYA, T. 2014. Analysis of technical assumptions and processes of evaluating feasibility of
irrigation projects. Philippine Institute for Development Studies. Policy Notes # 2014
-11
OOSTERBAAN, RJ. 2003. Lecture Notes on Alkaline-Sodic soils and Acid-Sulphate soils.
International Course on Land Drainage (ICLD) International Institute for
PAGASA. n.d. El Niño in the Philippines. Retrieved from the Official Gazette of the Republic of
the Philippines website September 12, 2018 from http://www.officialgazette.gov.ph
/laginghanda/el-nino/

205 | P a g e
PLUSQUELLEC, H. 2002. How Design, Management and Policy Affect the Performance of
Irrigation Projects. Bangkok, Thailand: FAO Regional Office for Asia and the Pacific.
156 p.
SHAH, M, A ALI, AA ANWAR, AR BELL, ZU HAQ. 2016. Equity in a tertiary canal of the Indus
Basin Irrigation System (IBIS). Agricultural Water Management, 178: 201–214.
TABIOS, G III, C DAVID. 2014. Appraisal of methodology in estimating irrigable areas and the
processes of evaluating feasibility of irrigation projects. Philippine Institute for
Development Studies. Policy Notes # 2014 -13
THE NEW ZEALAND DIGITAL LIBRARY. n. d. University of Waikato, New Zealand. Control
Structures.
TIEWTOY, S, RS CLEMENTE, S PERRET, MS BABEL, S WEESAKUL. 2011. Irrigation Sustainability
Assessment of Selected Projects in Ha Chin Basin, Thailand. Irrig. and Drain. 60: 296–
307 (2011) Published online 6 October 2010 in Wiley Online Library
(wileyonlinelibrary.com) DOI: 10.1002/ird.583
TRUNG, T, A GUPTA, M BABEL, RS CLEMENTE. 2005. Assessment of Different Irrigation
Management Models in Vietnam, International Journal of Water Resources
Development, 21: 3, 525-535
VILLAR, M. 2005. An Act to Enhance Farm Productivity by Providing Strategic Farm Irrigation
Supports and for Other Purposes
WANG, X, Y XING. 2017. Evaluation of the effects of irrigation and fertilization on tomato fruit
yield and quality:a principal component analysis.
RUNYAN, WR. 2011. "Deep Well Pump." 1001 Words and Phrases You Never Knew You Didn’t
Know. 11 Sep. 2018 https://www.thefreedictionary.com/Deep+Well+Pump
WORLD BANK. 1992. Philippines: Irrigated Agriculture Sector Review. Report No. 9848-PH.
Washington, D.C.: The World Bank. 225 p.
Zhi, M. 2000. Water efficient irrigation and environmentally sustainable irrigated rice
production in China. Proceedings of the 8th ICID Drainage Workshop, India 2000.

206 | P a g e
Glossary
Agriculture and Fisheries Modernization Act or AFMA (RA 8435) - It is a policy instrument
defining measures to modernize Philippine agriculture for the country to compete in
the global market. The law has broad based provisions covering: 1) production and
marketing support services; 2) human resource development; 3) rese arch
development and extension; 4) rural non-farm employment; 5) trade and fiscal
incentives; and 6) general provisions.
Communal Irrigation System (CIS) - It is an irrigation system that is managed by a
bonafide Irrigator’s Association.
Control Structures - ensure adequate water levels, dissipate energy, provide accurate
distribution, and deliver water to the field without erosion.
Conveyance Loss - Loss of water from a channel or pipe during transport, including losses
due to seepage, leakage, evaporation, and transpiration by plants growing in or near
the channel.
Conveyance Structures - They are used to transport irrigation water from the source to the
farm ditches
Crop Irrigation Requirement - Quantity of water, exclusive of effective precipitation, that
is needed for crop production.
Deep Well Pump - A pump designed for pumping water from wells with water levels more
than about twenty five feet below the pump location. Such pumps are designed so
that the pump cylinder is near the well water level and the water is forced to the surface
rather than being sucked to it.
Discharge - The volume of water pumped per unit time.[ASAE] the area where conveyed
material is discharged from the machine.
Dissolved Oxygen (DO) - indicates the amount of oxygen dissolved in a body of water.
Effective Rainfall - It is the total rainfall minus the amount which cannot be stored or used
in the paddy field.
Electrical Conductivity (EC) - a measure of the water salinity or the total salt content of
water based on the flow of electrical current through the sample.
El Niño – It is the unusual warming in the Central and Eastern Equatorial Pacific. It occurs
in the Pacific basin every 2-9 years, usually starts between December to February. It
causes drought and delays the onset of rainy season.
Emergency Spillway - Auxiliary channel which transmit flood water exceeding the capacity
of the principal spillway.
Evapotranspiration - The combined effects of evaporation from the soil and plant surfaces
and transpiration from plants.
Farm Water Requirement - It is the sum of irrigation requirement and farm ditch losses.
Flooding frequency – How often the farmers have ever experienced flood in their fields.
Flood Irrigation - Method of irrigation where water is applied to the soil surface without flow
controls, such as furrows, borders or corrugations.

207 | P a g e
Free Irrigation Act [Republic Act No. 10969] - an act providing free irrigation service,
amending for the purpose Republic Act No. 3601, as amended, appropriating funds
therefor and for other purposes
Groundwater - underground water that has come mainly from the seepage of surface water
and is held in pervious rock; can be a source of useable water through certain
extraction methods
Inverted Siphon - A closed conduit with end sections above the middle section used for
crossing below a depression or under a highway.
Irrigable Lands - Are lands which display marked characteristics justifying the operation of
an irrigation system.
Irrigated Area – (Irrigable Area) Area capable of being irrigated, principally as regards to
availability of water, suitable soils, and topography of land.
Irrigation - It is the application of water to soil for the purpose of supplying moisture
essential to plant growth.
Irrigation Check - Small dike or dam used in the furrow alongside an irrigation border to
make the water spread evenly across the border.
Irrigation Efficiency - The ratio of the average depth of irrigation water that is beneficially
used to the average depth of irrigation water applied, expressed as a percent.
Irrigation Scheduling - Careful choice of irrigation application rates and timing to help
irrigators maintain yields with less water.
Irrigation System - All equipment required to apply water to the design area.
Irrigation Water Requirement - It is the quantity of water, exclusive of precipitation
required to maintain desired soil moisture and salinity level during the crop season.
Irrigator’s Association (IA) - Is an association of farmers within a contiguous area served by
a National Irrigation System or Communal Irrigation System.
La Niña - characterized by unusually cold surface temperatures of the ocean. It is
associated with anomalies in rainfall, temperature, and tropical cyclone
activities. It favors the formation of tropical cyclones over the western Pacific, thus
increasing the number of tropical cyclones.
Magna Carta of Small Farmers (RA 7607) - aims in realizing equitable distribution of benefits
and opportunities through the empowerment of the small farmers. The law
recognizes the country’s responsibility for the welfare and development of small
farmers by giving them support in attaining their socioeconomic goals. The law
encourages the participation of small farmers, farm workers, farmers’ cooperatives
and organizations to enjoin in the planning, organization, management and
implementation of agricultural programs and projects.
Main and Submain - The water delivery pipelines that supply water from the control station
to the manifolds.
Main Canal - Is the channel where diverted water from a source flows to the intended area to
be irrigated.
National Irrigation System (NIS) - Is a major irrigation system managed by the National
Irrigation Administration.
Parshall Flume - A calibrated device used to measure the flow of water in open channels,
based on the principle of critical flow (formerly called the improved Venturi flume).

208 | P a g e
Peak flow (qp) - It is used to determine the magnitude of floods and a valuable consideration
in the design of structures.
Peak/Off-peak Rates - Rates charged in accordance with the most and least popular hours of
water use during the day.
pH - is a measure of the acidity or alkalinity of water. Water is acidic if pH is between 1 to 7,
whereas alkaline for the range between 7 to 14
Secondary Canal - It is the channel connected to the main canal which distributes irrigation
to specific areas.
Shallow Tubewell (STW) – a tube or shaft vertically set into the ground for the purpose of
bringing groundwater to the soil surface from a depth of less than 20 meters by
suction lifting.
Siltation – is the pollution of water by the increased concentration of suspended sediments
such as silt
Spillway - Is a structure for passing out water not needed for storage or diversion.
Surface Irrigation - Broad class of irrigation methods in which water is distributed over the
soil surface by gravity flow.
Total dissolved solid (TDS) - represents the total amount of salts in the water.
Turnout - It is the structure built at the point where a farm ditch branches out from a
distributary canal to regulate or control the water flowing into the farm ditch.