Assessing the Quality of Local Government in South Africa
34
Assessing the Quality of Local Government in South Africa Barak D. Hoffman Center on Democracy, Development, and the Rule of Law Stanford University [email protected] Abstract The African National Congress (ANC) came into power in South Africa in 1994 promising an ambitious program to expand access to public services, regardless of ability to pay, in order to redress the inequities the apartheid system created. The ANC delegated to local governments significant responsibility to implement this policy by placing them in change of providing access to vital services, such as electricity, primary health care, sanitation, and water. In a stunning reversal, however, the current policy of the ANC government rather than encouraging local governments to provide affordable services for all seems to embrace almost the opposite: local governments should treat access to services like private commodities by charging citizens market rates. At one level, this new system has been remarkably successful: using local government data from South Africa, I find that citizens’ willingness to pay for local services is by far the most important factor that determines access to them. At the same time, this policy may be undermining political accountability, as data show that neither political competition nor the quality of the civil service influences access to local services.
Transcript of Assessing the Quality of Local Government in South Africa
Assessing the Quality of Local Government in South Africa
Barak D. HoffmanCenter on Democracy, Development, and the Rule of Law
Stanford [email protected]
Abstract
The African National Congress (ANC) came into power in South Africa in 1994 promising an ambitious program to expand access to public services, regardless of ability to pay, in order to redress the inequities the apartheid system created. The ANC delegated to local governments significant responsibility to implement this policy by placing them in change of providing access to vital services, such as electricity, primary health care, sanitation, and water. In a stunning reversal, however, the current policy of the ANC government rather than encouraging local governments to provide affordable services for all seems to embrace almost the opposite: local governments should treat access to services like private commodities by charging citizens market rates. At one level, this new system has been remarkably successful: using local government data fromSouth Africa, I find that citizens’ willingness to pay for local services is by far the most important factor that determines access to them. At the same time, this policy may be undermining political accountability, as data show that neither political competition nor the quality of the civil service influences access to local services.
Assessing the Quality of Local Government in South Africa
Introduction
In 1994, the African National Congress (ANC) won South Africa’s first democratic
election and made redressing the poverty and inequities the apartheid regime created a
top priority. A central part of this policy was an ambitious program to expand access to
local services, such as electricity, water, and health care, regardless of ability to pay.
Ten years later, at the local level, the picture looks very different. Currently, local
governments, rather than working to reduce poverty by providing affordable services to
all, act more like sellers of them to those who can afford to pay (McDonald and Pape
2002).
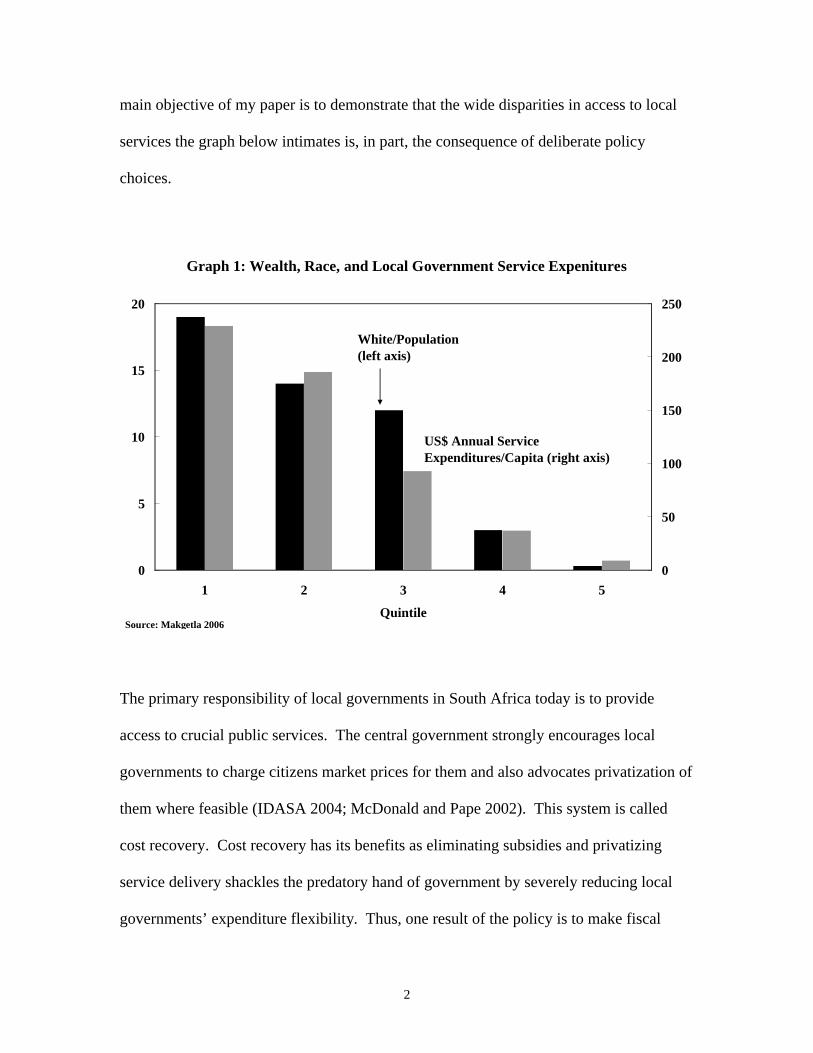
The graph below illustrates the situation. On the X-axis, I have grouped local
governments by quintile, from the wealthiest (number one) to the poorest (number five).
On the left axis, I have the percent of the population in the district that is white. On the
right axis, I have local government service expenditures in US dollars per person per
year, a close approximation of the effectiveness of local governments in South Africa.
The graph demonstrates two key points. One, despite the vast changes that have occurred
in South Africa over the past decade and a half, wealth and race in South Africa still
highly correlate with the quality of local government. Two, a vast gap exists between the
expenditures of wealthy and poor local governments in providing access to services. The
2
main objective of my paper is to demonstrate that the wide disparities in access to local
services the graph below intimates is, in part, the consequence of deliberate policy
choices.
Graph 1: Wealth, Race, and Local Government Service Expenitures
0
5
10
15
20
1 2 3 4 5
Quintile
0
50
100
150
200
250
White/Population (left axis)
US$ Annual Service Expenditures/Capita (right axis)
Source: Makgetla 2006
The primary responsibility of local governments in South Africa today is to provide
access to crucial public services. The central government strongly encourages local
governments to charge citizens market prices for them and also advocates privatization of
them where feasible (IDASA 2004; McDonald and Pape 2002). This system is called
cost recovery. Cost recovery has its benefits as eliminating subsidies and privatizing
service delivery shackles the predatory hand of government by severely reducing local
governments’ expenditure flexibility. Thus, one result of the policy is to make fiscal

3
accountability, the link between taxation and government expenditure, very strong. At
the same time, the expenditure constraints that cost recovery induces places strict limits
on the capacity of elected local officials to respond to citizen demands (McDonald 2002).
As a result, while fiscal accountability at the local level in South Africa is quite rigid, it
has come at the price of largely tying the hands of elected local officials.
I present my argument in six sections. First, I examine the history of local government in
South Africa to place the issues I am discussing in their proper context. Next, I describe
the current functions of local government and their sources of finance. I then discuss the
theory of cost recovery, as well as alternative hypotheses I test to account for variation in
access to services. Next, I discuss how I measure the effectiveness of government in
providing services. I subsequently show my quantitative results and end with some
concluding observations.
History of Local Government in South Africa
In order to understand the importance of local government in South Africa today, it is
useful to begin with examining it during the apartheid era as many of the most explosive
protests against the regime had their roots over local issues, such as lack of services. One
of the most popular anti-apartheid slogans, “one city, one tax base,” reflects the salience
of local issues to those who suffered at the hands of the white-led government. The
reason for this is because many of the most unjust aspects of the system were most visible
4
at the local level (Beall et al. 2002, Bond 2000a, McDonald and Pape 2002, Tomlinson et
al. 2003).
On the one hand, whites wanted to exploit the political inequality of blacks to subsidize
white living standards through using blacks as a source of cheap labor and employing
legislation to encourage them to shop at white-owned stores.1 Consequently, economic
integration was quite common. On the other hand, economic integration caused a
problem because if blacks were to work for whites and shop at stores whites owned, they
would need to live near whites as well. Such a situation went against the central tenet of
apartheid, political and social segregation. The apartheid government came up with a
“solution” of a sort to this problem by creating buffers between black residential
communities and white ones (Tomlinson et al. 2003, Wittenberg 2003).2
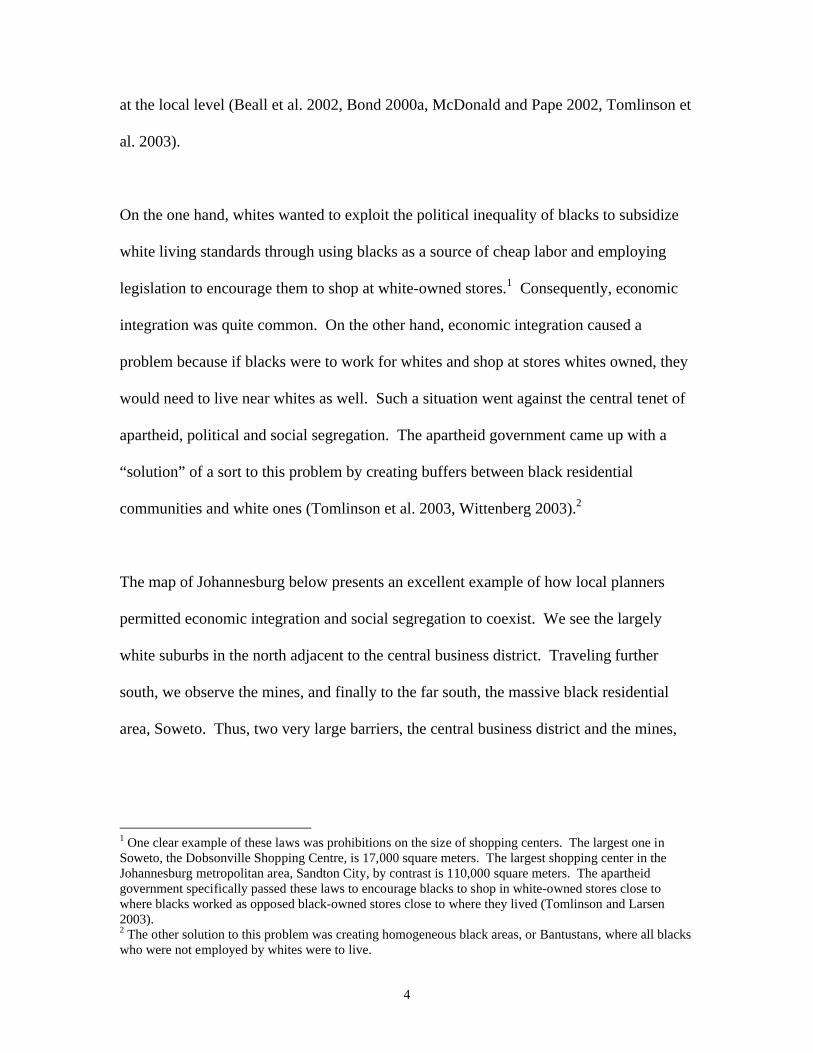
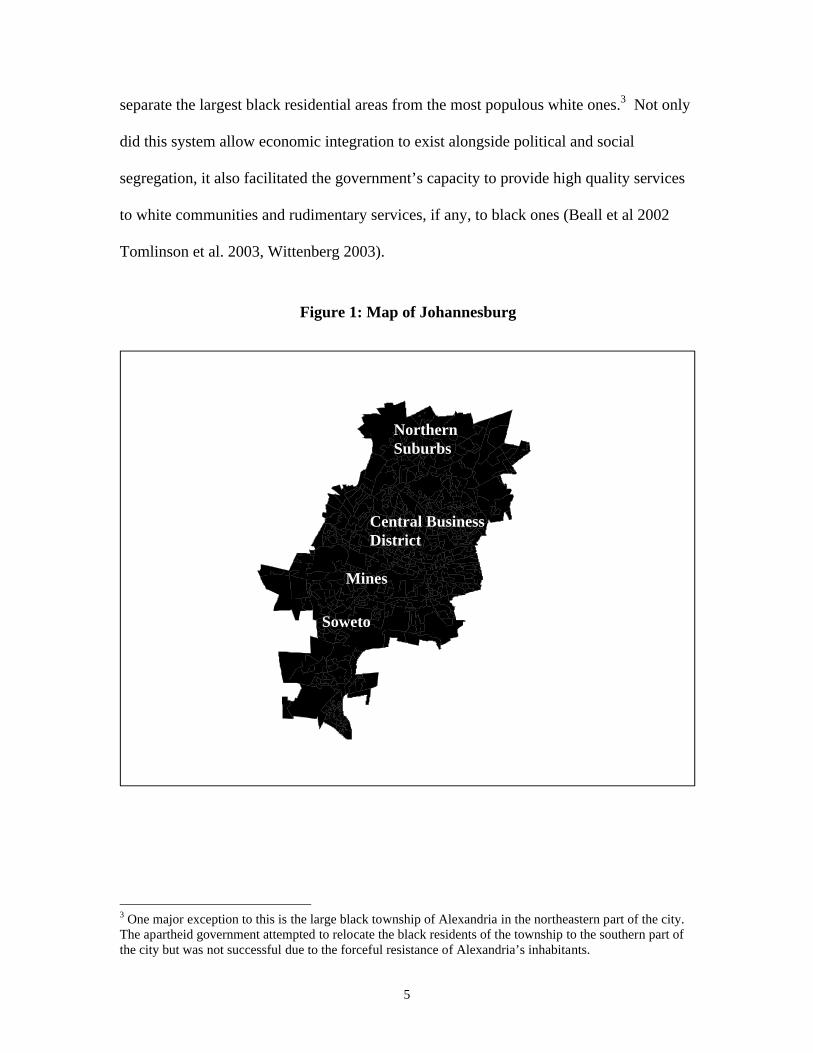
The map of Johannesburg below presents an excellent example of how local planners
permitted economic integration and social segregation to coexist. We see the largely
white suburbs in the north adjacent to the central business district. Traveling further
south, we observe the mines, and finally to the far south, the massive black residential
area, Soweto. Thus, two very large barriers, the central business district and the mines,
1 One clear example of these laws was prohibitions on the size of shopping centers. The largest one in Soweto, the Dobsonville Shopping Centre, is 17,000 square meters. The largest shopping center in the Johannesburg metropolitan area, Sandton City, by contrast is 110,000 square meters. The apartheid government specifically passed these laws to encourage blacks to shop in white-owned stores close to where blacks worked as opposed black-owned stores close to where they lived (Tomlinson and Larsen 2003). 2 The other solution to this problem was creating homogeneous black areas, or Bantustans, where all blacks who were not employed by whites were to live.
5
separate the largest black residential areas from the most populous white ones.3 Not only
did this system allow economic integration to exist alongside political and social
segregation, it also facilitated the government’s capacity to provide high quality services
to white communities and rudimentary services, if any, to black ones (Beall et al 2002
Tomlinson et al. 2003, Wittenberg 2003).
3 One major exception to this is the large black township of Alexandria in the northeastern part of the city. The apartheid government attempted to relocate the black residents of the township to the southern part of the city but was not successful due to the forceful resistance of Alexandria’s inhabitants.
Northern Suburbs
Central Business District
Mines
Soweto
Figure 1: Map of Johannesburg

6
Economic integration combined with political and social segregation, unsurprisingly,
proved to be a combustible local combination. The system made it quite evident to
blacks that the economic value they created through working for whites and shopping in
white-owned stores was subsidizing the lifestyle of whites. The slogan “one city, one tax
base” clearly articulated this frustration. In this context, it is very important to point out
that before the mid-1980s ANC-organized “rolling mass actions,” the movement
typically did not organize demonstrations against the apartheid government. Rather,
grass-roots groups commonly led protests over local issues, such as public transport,
housing, and services (Butler 2006, Tomlinson et al. 2003).
Local Government in Contemporary South Africa
When the ANC took power in 1994, two of its most important priorities were to reduce
economic inequality and increase political accountability (McDonald and Pape 2002). To
carry out these efforts at the local level, the ANC government allocated local
governments important political and economic powers (RSA 1998, RSA 2004).
Economically, the central government delegated to local governments the responsibility
to provide almost all public services, with the exception of education and housing. The
government attempted to create strong political accountability, and hence the incentive
for local governments to provide these services, through direct elections for local
councilors.4
4 Voters in local elections in South Africa cast two ballots, one for a ward councilor and one for a party. Thus, single member districts and proportional representation comprise local councils in South Africa.
7
To facilitate the new economic and political roles of local government, the ANC
government implemented a wide range of administrative reforms at the local level as
well. They created four levels of administration: national, provincial, district, and
municipal. There are currently 283 municipalities and the government divides them into
three categories, A, B, and C. Category A encompasses the six largest cities.5 Category B
consists of all other inhabited areas. Category C municipalities have populations that are
very small and widely scattered. In this paper I focus on the 243 category B
municipalities as the three types of municipalities are not comparable to each other: those
in Category A have far more expansive responsibilities than those in Category B and
Category C municipalities possess very few powers. There are approximately 130,000
people in each Category B municipality and one ward councilor for about 3,000 voters
(Gaffney’s 2004; IDASA 2004; MDB 2003; RSA 2003).
Local Government Finance and Functions
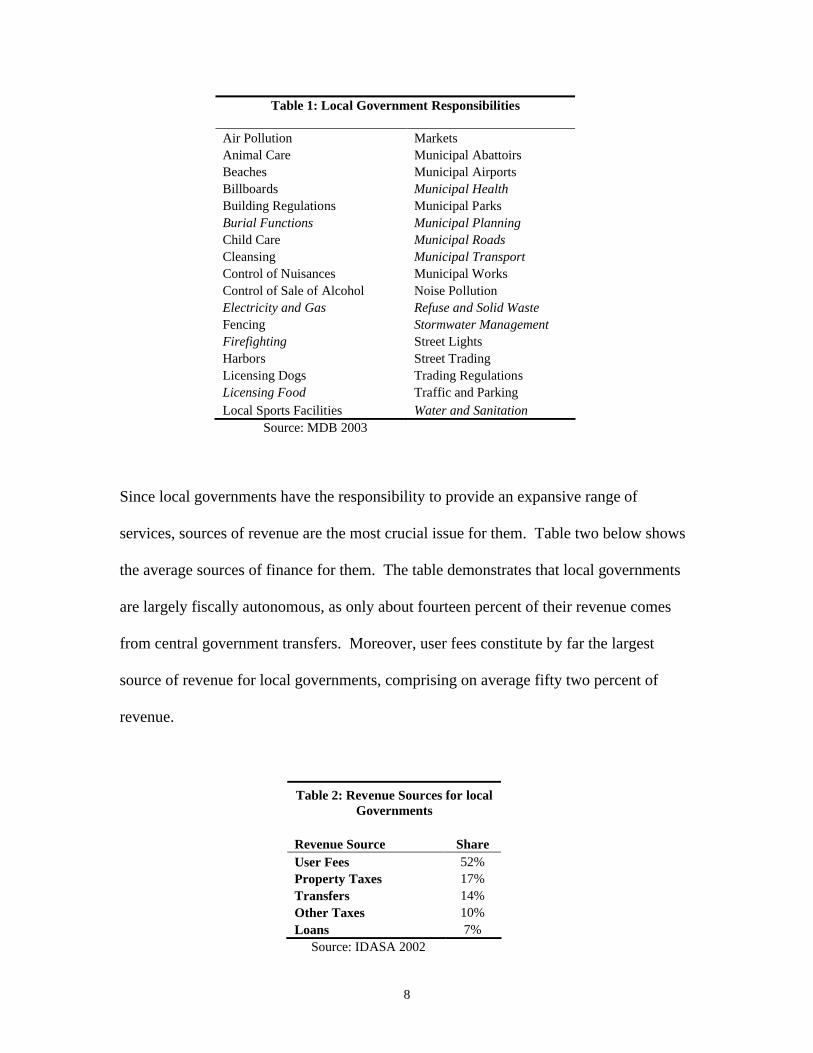
The table below lists all of the functions that Category B local governments are to fill.
The entries in italics are the core responsibilities the central government assigns to local
ones and hence budgetary allocations are to go first to these areas (MDB 2003).
5 These are Cape Town, Durban, East Rand, Johannesburg, Port Elizabeth, and Pretoria.
8
Table 1: Local Government Responsibilities
Air Pollution MarketsAnimal Care Municipal AbattoirsBeaches Municipal AirportsBillboards Municipal HealthBuilding Regulations Municipal ParksBurial Functions Municipal PlanningChild Care Municipal RoadsCleansing Municipal TransportControl of Nuisances Municipal WorksControl of Sale of Alcohol Noise PollutionElectricity and Gas Refuse and Solid WasteFencing Stormwater ManagementFirefighting Street LightsHarbors Street TradingLicensing Dogs Trading RegulationsLicensing Food Traffic and ParkingLocal Sports Facilities Water and Sanitation
Source: MDB 2003
Since local governments have the responsibility to provide an expansive range of
services, sources of revenue are the most crucial issue for them. Table two below shows
the average sources of finance for them. The table demonstrates that local governments
are largely fiscally autonomous, as only about fourteen percent of their revenue comes
from central government transfers. Moreover, user fees constitute by far the largest
source of revenue for local governments, comprising on average fifty two percent of
revenue.
Table 2: Revenue Sources for localGovernments
Revenue Source ShareUser Fees 52%Property Taxes 17%Transfers 14%Other Taxes 10%Loans 7%
Source: IDASA 2002
9
Cost Recovery
Since user fees are by far the most important source of revenue for local governments, it
is important to discuss how local governments collect them. The central government
encourages local governments to charge these fees according to cost recovery, a system
that charges a citizen the full cost for services he or she consumes. Privatization, or
treating the service as a private commodity, is the archetypical form of cost recovery and
is quite common at the local level in South Africa today (Bond 2000a, McDonald 2002).
Thus, cost recovery is an extreme manifestation of fiscal accountability. While fiscal
accountability contends that taxation leads to good governance (e.g., Levi 1988), cost
recovery amounts to receiving the quality of governance one is willing to purchase.
While the central government is not able to force local governments to use cost recovery,
it has many levers to encourage local governments to follow this policy. To begin with,
local governments must purchase electricity and water, the two most basic services, from
commercial distributors at market rates (Eskom 2006, Loftus 2005).6 In addition, local
governments have a strong incentive to generate profits from selling at least some
services to raise revenue for expenditures that are not amenable to cost recovery, such as
administrative costs and employee benefits, since they are largely fiscally autonomous
(McDonald and Pape 2002). Moreover, the central government can refuse to extend
discretionary transfers to municipal governments that do not pursue the policy
6 Due to the high fixed costs of electricity and water, this policy means that residents of rural areas face the highest per-unit cost of services while those who live in densely populated urban areas where most residents are connected to the electricity and water distribution systems (i.e., wealthy areas) encounter the lowest per-unit cost (Eskom 2006, RTI 2001).

10
preferences of the center (McDonald and Smith 2004). Finally, the central government
allows local governments to privatize any services and private firms can make a profit
from providing a number of them, such as electricity, firefighting, gas, municipal
transport, refuse removal, sanitation, and water (McDonald and Smith 2004).7
Proponents of cost recovery typically cite two advantages of the system. The first is that
it shackles the predatory hand of government (McDonald 2002). This is most evident
through privatization. When local governments privatize service delivery, private
enterprises are in charge of collecting payments and undertaking the expenditures to
maintain the infrastructure. Cost recovery thus minimizes the ability of the government
to charge citizens for services and divert the revenue for expenditures that do not provide
any benefits for taxpayers, such as higher salaries for municipal employees. A second
argument advocates of cost recovery cite is that it encourages efficient consumption
while subsidizes typically lead to over-consumption (IDASA 2002).
Critics of cost recovery argue that the policy possess numerous economic and political
shortcomings. Economically, they maintain that the policy is completely unsuitable for
reducing poverty and inequality because shackling the predatory hand of government
means constrains its capacity to redistribute. Moreover, these detractors claim that given
the vast poverty and inequality that currently exists in South Africa and the country’s
history of social exclusion, equal access to services is essential for political stability in
addition to increasing standards of living (Atkinson 2006, McDonald 2002). Finally,
7 One unique facet of privatization of local services is South Africa is a consequence of the country’s very high rate of crime. While police services are primarily a national function, fire fighting is a local one. Due to the high level of security services that private firms provide, private fire fighting service is common.

11
opponents of the system contend that it undermines political accountability severely
constrains the capacity for elected officials to respond to citizen demand for services
(Bond 2000a, 2000b).
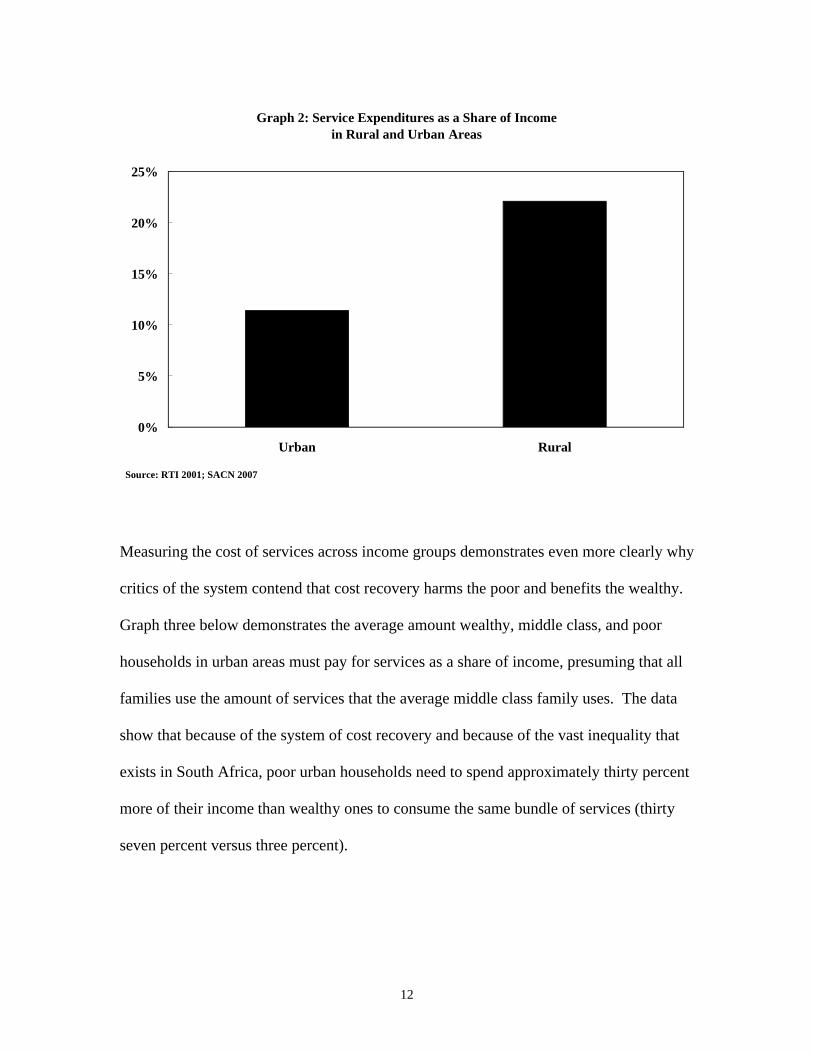
Perhaps the best way to begin to evaluate both sides of the argument is to examine the
data. Graph two below shows the percent of income that the average middle-class
household pays in service fees as a share of its income in rural and in urban areas. The
chart makes clear that because the cost of providing services is higher in rural areas than
in urban ones and because incomes are lower in rural areas than in urban ones, for the
same bundle of services, rural families must spend twice as much their income than urban
ones to consume the same quantity of services.8
8 On average, urban incomes are about fifty percent higher than rural ones.
12
Graph 2: Service Expenditures as a Share of Income in Rural and Urban Areas
0%
5%
10%
15%
20%
25%
Urban Rural
Source: RTI 2001; SACN 2007
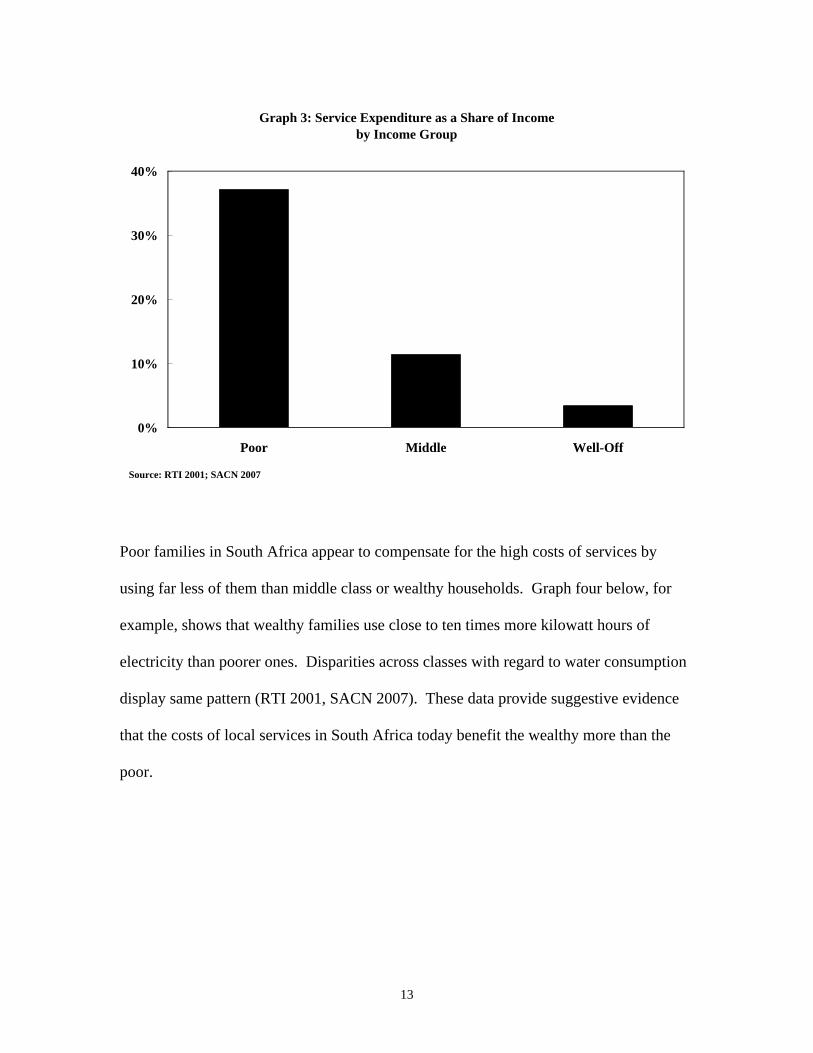
Measuring the cost of services across income groups demonstrates even more clearly why
critics of the system contend that cost recovery harms the poor and benefits the wealthy.
Graph three below demonstrates the average amount wealthy, middle class, and poor
households in urban areas must pay for services as a share of income, presuming that all
families use the amount of services that the average middle class family uses. The data
show that because of the system of cost recovery and because of the vast inequality that
exists in South Africa, poor urban households need to spend approximately thirty percent
more of their income than wealthy ones to consume the same bundle of services (thirty
seven percent versus three percent).
13
Graph 3: Service Expenditure as a Share of Income by Income Group
0%
10%
20%
30%
40%
Poor Middle Well-Off
Source: RTI 2001; SACN 2007
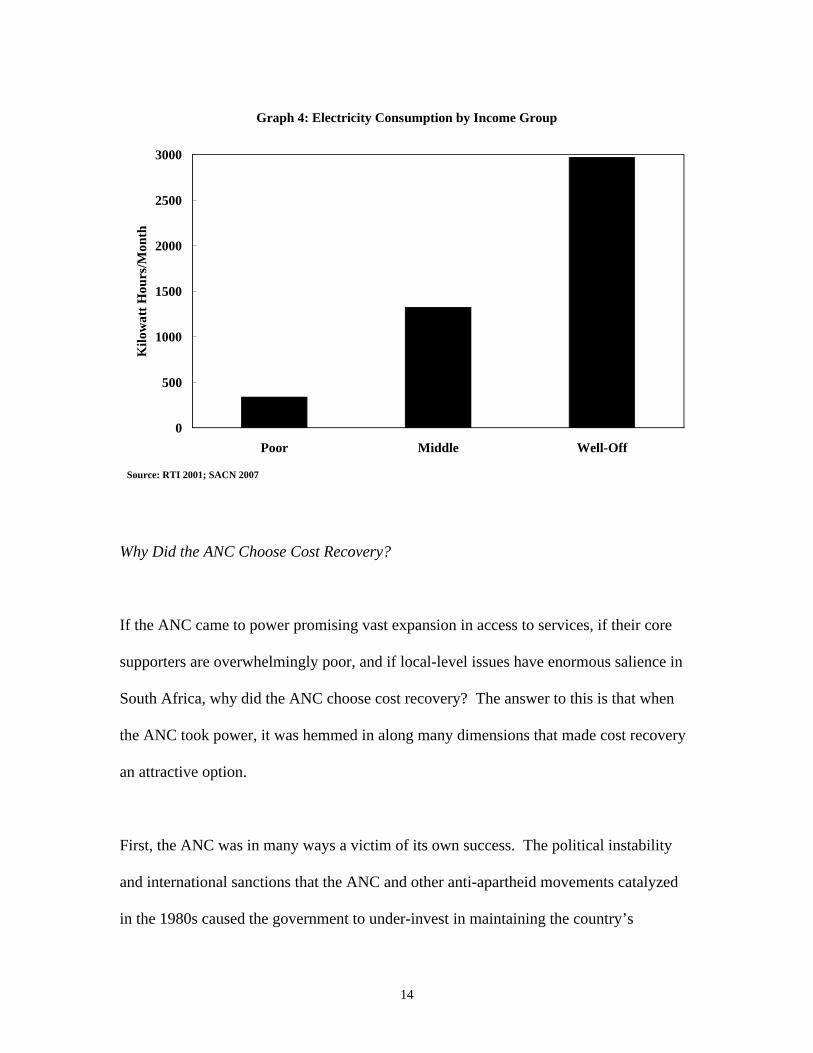
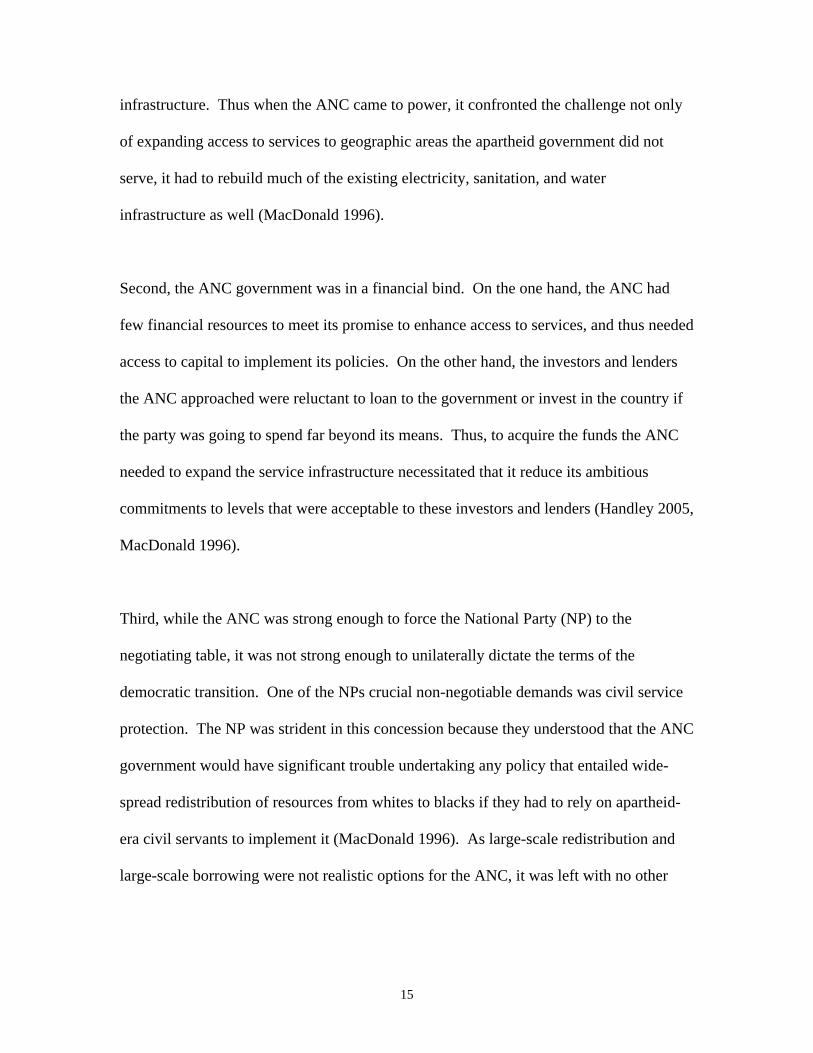
Poor families in South Africa appear to compensate for the high costs of services by
using far less of them than middle class or wealthy households. Graph four below, for
example, shows that wealthy families use close to ten times more kilowatt hours of
electricity than poorer ones. Disparities across classes with regard to water consumption
display same pattern (RTI 2001, SACN 2007). These data provide suggestive evidence
that the costs of local services in South Africa today benefit the wealthy more than the
poor.
14
Graph 4: Electricity Consumption by Income Group
0
500
1000
1500
2000
2500
3000
Poor Middle Well-Off
Source: RTI 2001; SACN 2007
Kil
owat
t H
ours
/Mon
th
Why Did the ANC Choose Cost Recovery?
If the ANC came to power promising vast expansion in access to services, if their core
supporters are overwhelmingly poor, and if local-level issues have enormous salience in
South Africa, why did the ANC choose cost recovery? The answer to this is that when
the ANC took power, it was hemmed in along many dimensions that made cost recovery
an attractive option.
First, the ANC was in many ways a victim of its own success. The political instability
and international sanctions that the ANC and other anti-apartheid movements catalyzed
in the 1980s caused the government to under-invest in maintaining the country’s
15
infrastructure. Thus when the ANC came to power, it confronted the challenge not only
of expanding access to services to geographic areas the apartheid government did not
serve, it had to rebuild much of the existing electricity, sanitation, and water
infrastructure as well (MacDonald 1996).
Second, the ANC government was in a financial bind. On the one hand, the ANC had
few financial resources to meet its promise to enhance access to services, and thus needed
access to capital to implement its policies. On the other hand, the investors and lenders
the ANC approached were reluctant to loan to the government or invest in the country if
the party was going to spend far beyond its means. Thus, to acquire the funds the ANC
needed to expand the service infrastructure necessitated that it reduce its ambitious
commitments to levels that were acceptable to these investors and lenders (Handley 2005,
MacDonald 1996).
Third, while the ANC was strong enough to force the National Party (NP) to the
negotiating table, it was not strong enough to unilaterally dictate the terms of the
democratic transition. One of the NPs crucial non-negotiable demands was civil service
protection. The NP was strident in this concession because they understood that the ANC
government would have significant trouble undertaking any policy that entailed wide-
spread redistribution of resources from whites to blacks if they had to rely on apartheid-
era civil servants to implement it (MacDonald 1996). As large-scale redistribution and
large-scale borrowing were not realistic options for the ANC, it was left with no other
16
choice than to moderate its promises and affordable local services was one of them
(MacDonald 1996, McDonald 2002).
Hypotheses and Data for Government Performance
In this section, I first discuss the main hypothesis in this paper, that cost recovery is the
principal factor that determines access to local services in South Africa today, and how I
test it. I then describe alternative hypotheses and the data I employ to evaluate them.
Main Hypothesis: Cost Recovery
The principal hypothesis I test in this paper is that a single economic criterion, people’s
willingness to pay for services, is the main factor that determines access to them.
However, for me to show that cost recovery is the principal issue requires that a number
of other conditions hold as well. To begin with, other considerations, such as political
competition, the quality of the bureaucracy, and/or social heterogeneity, should have no
direct effect on access to services. In addition, I also must show that local governments
do not subsidize service provision from other sources of revenue. If these conditions
hold, they will demonstrate that local governments allocate access to services solely by
how much people are willing to pay for them and that governments are not incurring
large financial losses in providing them, the essence of cost recovery. My measure of
cost recovery is the log of service fees per capita, or how much, on average, citizens in
17
the municipality are willing to spend on services the local government provides. These
data come from the National Treasury.
It is important for me to note one qualification to my test. Average municipal user fees
per capita do not allow me to rule out that local governments may charge dissimilar rates
to different citizens (i.e., the wealthy more than the poor).9 Nonetheless, even if local
governments engage in this practice, such a system would not violate cost recovery if
they cap the aggregate quantity of services they provide by the amount of service fees
they collect.
Alternative Hypotheses
Initial Conditions. Initial conditions may also determine the quality of local
governments, such as urbanization or level of development (e.g., Lipset 1959). For
example, perhaps local governments in wealthier areas provide greater access to
services because more affluent people are more capable of articulating their demands.
Moreover, since many wealthy areas have sizable white populations who had
effective local governments during the apartheid era (Wittenberg 2003), it is possible
that current performance simply reflect experience with local government. In these
cases, effective cost recovery policies may be correlated with wealth and/or
experience with local government but have nothing to do with the current policy. I
measure initial conditions by the log of per capita GDP, the percent of the population
that is urban, and the percent of the population in the municipality that is white. 9 Progressive utility rates are a typical example of such a subsidy (McDonald 2002).
18
These data come from the 2001 census. I also use the local government’s
performance in 2002, the year after the ANC government created the new system of
local government, to control for initial effectiveness.
Political Competition. Local governments may be more effective when electoral
contests are strong as councilors should be more attentive to their constituents’ needs
when political competition is intense than when it is weak (e.g., Besley and Preston
2002). I measure political competition by the effective number of parties in the
municipality and the vote share of the dominant ANC. These data come from the
2001 election.
Social Heterogeneity. South Africa is a highly polarized society in terms of class and
race. Moreover, numerous scholars have noted that social polarization can inhibit the
effectiveness of governments in providing public services (e.g., Easterly and Levine
1997, Sokoloff and Engerman 2000). To measure the effect of these conditions, I use
municipal income inequality (Gini Coefficient) and racial fragmentation.10 These
data come from the 2001 Census.
Civil Service Quality. Local government performance may be better where civil
service quality is higher. In other words, government performs better when more
competent people run it (e.g., Evans 1995). I measure the quality of the civil service
10 I employ the standard measure of ethnic fragmentation (the probability that two random people will belong to the same ethnic group) using the four main races in South Africa: Asian, Black, Colored, and White. I utilize these categories, rather than ethnic and/or language fragmentation since race, rather than ethnicity or language, has been the dominant cleavage in South African politics.
19
by the log of the average number of years of government experience among the top
four civil servants. These civil servants are the municipal manager, finance manager,
service manager, and technical services manager. These data come from the South
African Municipal Demarcation Board.
Central Government Transfers. Central government transfers may affect the quality
of local governments. This is not so much a test of a theory but of central
government policy, since the main tool the central government currently employs to
reduce inequities across municipalities is greater transfers to poorer municipal
governments than wealthy ones. I measure the consequences of this policy by the log
of per capita transfers. These data come from the National Treasury.
Dependent Variable: The Performance of Local Government
Having discussed hypotheses to account for the performance of local government in
South Africa, I now describe how I measure this variable. At the local level in South
Africa, quantifying the quality of local government is straightforward. Table one that I
displayed earlier was a comprehensive list of local government responsibilities. South
Africa’s Constitution and subsequent government documents clearly articulate what local
governments must do to implement these tasks successfully, thus allowing us to define
comprehensively the constitutional obligations of local government (MDB 2003). The
South African Municipal Demarcation Board (MDB) annually assesses the performance
of each local government in every area of its jurisdiction and renders a yes or no
20
judgment on whether it is meeting its obligations for that function (MDB 2003).
Consequently, it is reasonable to use the percent of functions that a local government
undertakes successfully as an indicator of its quality.
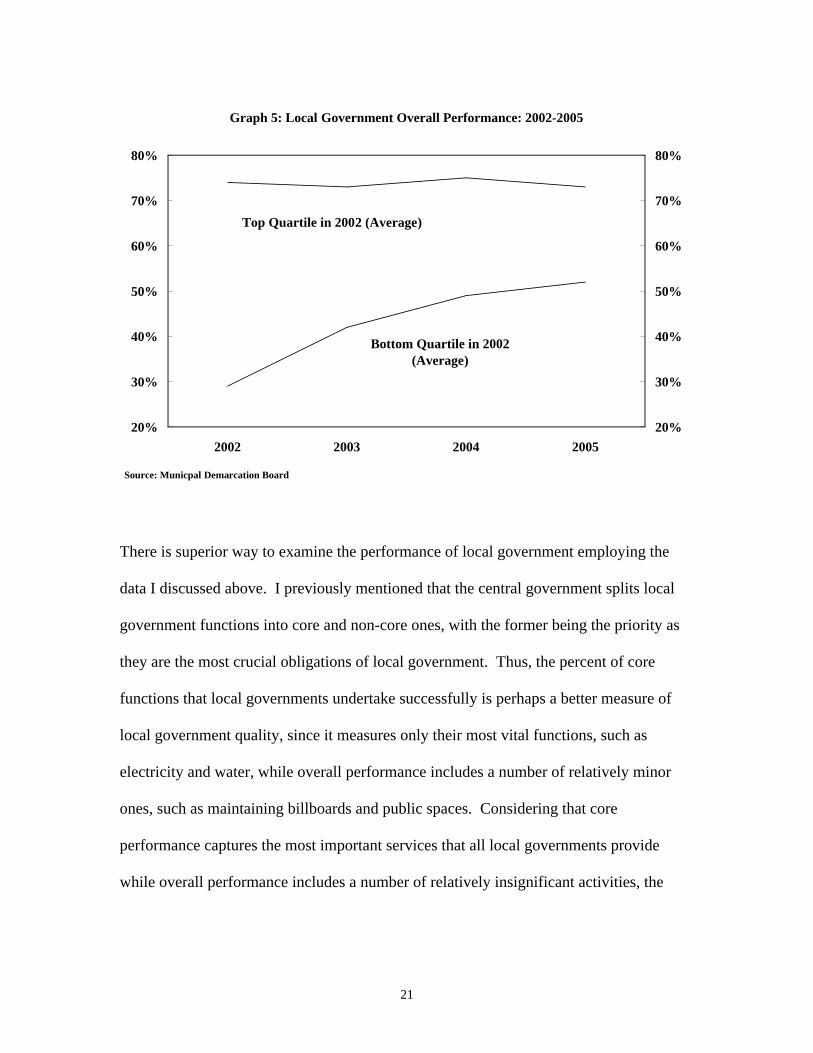
Graph five below traces the evolution of the overall effectiveness of local governments in
the bottom and top quartiles from 2002, the first year the MDB began tracking local
government performance, to 2005, the most recent data. I have split out the data by the
top and bottom quartiles to give a sense of the range of their quality and how the top and
bottom quartiles perform relative to each other. Overall, their performance appears
mediocre. On the one hand, local governments in the bottom quartile have made
impressive strides since 2002, increasing the percent of functions they perform
successfully by close to twenty percent in two years. However, their rate of improvement
seems to have stalled at a fairly low level of performance as they successfully perform
only about half of their functions. While performance in the top quartile is much higher,
these local governments show no signs of improvement. On average, local governments
perform only about sixty percent of their functions successfully.
21
Graph 5: Local Government Overall Performance: 2002-2005
20%
30%
40%
50%
60%
70%
80%
2002 2003 2004 2005
Source: Municpal Demarcation Board
20%
30%
40%
50%
60%
70%
80%
Bottom Quartile in 2002(Average)
Top Quartile in 2002 (Average)
There is superior way to examine the performance of local government employing the
data I discussed above. I previously mentioned that the central government splits local
government functions into core and non-core ones, with the former being the priority as
they are the most crucial obligations of local government. Thus, the percent of core
functions that local governments undertake successfully is perhaps a better measure of
local government quality, since it measures only their most vital functions, such as
electricity and water, while overall performance includes a number of relatively minor
ones, such as maintaining billboards and public spaces. Considering that core
performance captures the most important services that all local governments provide
while overall performance includes a number of relatively insignificant activities, the
22
former is the one I employ in my quantitative analysis. Specifically, my dependent
variable is core performance in 2005, the most recent year of these data.
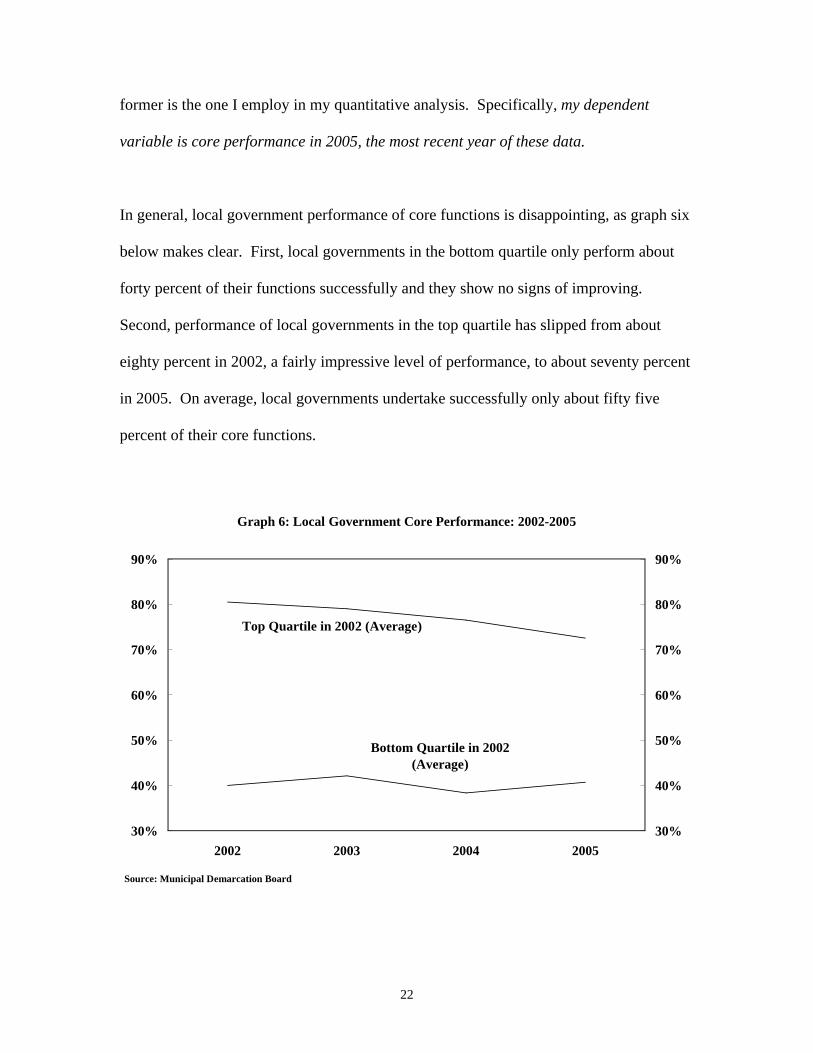
In general, local government performance of core functions is disappointing, as graph six
below makes clear. First, local governments in the bottom quartile only perform about
forty percent of their functions successfully and they show no signs of improving.
Second, performance of local governments in the top quartile has slipped from about
eighty percent in 2002, a fairly impressive level of performance, to about seventy percent
in 2005. On average, local governments undertake successfully only about fifty five
percent of their core functions.
Graph 6: Local Government Core Performance: 2002-2005
30%
40%
50%
60%
70%
80%
90%
2002 2003 2004 2005
Source: Municipal Demarcation Board
30%
40%
50%
60%
70%
80%
90%
Bottom Quartile in 2002(Average)
Top Quartile in 2002 (Average)

23
Empirical Tests and Results
In this section, I report the results of my empirical tests of the determinants of local
government quality (core performance in 2005) employing the hypotheses and data I
described in the data and hypotheses section. The main results are in table three below
and overall they are exactly what one would expect under an effective system of cost
recovery. First, economic factors, social conditions, and experience with local
government (i.e., the percent of the population that is white), have no consistent or strong
effect after accounting for service fee expenditures and initial performance.
Second, political competition, the quality of the civil service (average log years of
experience of the top four civil servants), and central government transfers do not affect
the quality of local governments. In a system of cost recovery, that political competition
and the quality of the civil service have no effect government performance is not
surprising as the central feature of the policy is to take the power to allocate public
services away from government officials. It is important to note, however, since I am
using results from South Africa’s first democratic election at the local level and since the
vast majority of elected local councilors never held public office prior to that election, the
results on political competition may also reflect the inexperience of these officials. The
insignificance effects of transfers suggest that local governments are not using this source
of revenue to enhance access to services.
24
Third, other than initial performance, cost recovery is the only variable that has consistent
and strong support. Moreover, the results on service fees hold even after accounting for
initial performance and economic conditions. In addition, when I add performance of the
district government (which the MDB also measures), the level of government above the
municipality and one that has strong oversight and sanctioning power, the results also
hold.11 Further, the results also hold when I regress the change in performance from
2002 to 2005 on the change in service fees over the same period (not shown).
It is important to note that the results do not reflect a more general link between taxation
and good governance and/or that local governments subsidize access to services through
other sources of revenue. In models seven and eight I use the log of per capita taxes (i.e.,
local revenue that is derived from sources other than user fees, such as property taxes) as
an additional explanatory variable for the quality of local government. When I include
taxes alone (model seven), they are highly insignificant. When I include them with
service fees (model eight), the coefficient on service fees remains positive and significant
at the one percent level, while taxes are statistically significant but have a negative sign.
Thus, I can rule out that my results reflect a broad manifestation of taxation leading to
good governance, as well as that local governments subsidize access to services through
alternative sources of revenue. These results, along with the insignificant effect of
transfers, also suggest that allowing local governments more flexibility in how they
charge for services will not necessarily lead to more effective local government. Hence,
despite the constraints that cost recovery imposes on local governments, I am not able to
provide any evidence that greater flexibility will lead to wider access to services. In sum, 11 The results also hold if I use district dummy variables rather than their performance.
25
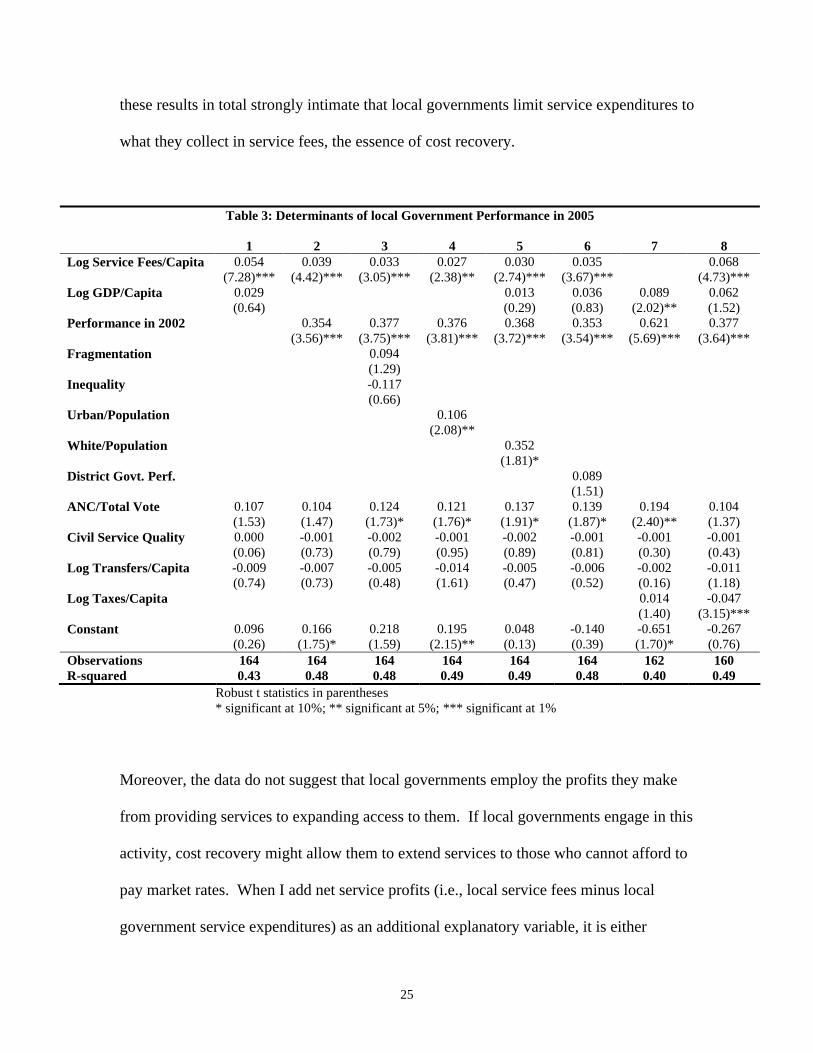
these results in total strongly intimate that local governments limit service expenditures to
what they collect in service fees, the essence of cost recovery.
Table 3: Determinants of local Government Performance in 2005
1 2 3 4 5 6 7 8Log Service Fees/Capita 0.054 0.039 0.033 0.027 0.030 0.035 0.068
(7.28)*** (4.42)*** (3.05)*** (2.38)** (2.74)*** (3.67)*** (4.73)***Log GDP/Capita 0.029 0.013 0.036 0.089 0.062
(0.64) (0.29) (0.83) (2.02)** (1.52)Performance in 2002 0.354 0.377 0.376 0.368 0.353 0.621 0.377
(3.56)*** (3.75)*** (3.81)*** (3.72)*** (3.54)*** (5.69)*** (3.64)***Fragmentation 0.094
(1.29)Inequality -0.117
(0.66)Urban/Population 0.106
(2.08)**White/Population 0.352
(1.81)*District Govt. Perf. 0.089
(1.51)ANC/Total Vote 0.107 0.104 0.124 0.121 0.137 0.139 0.194 0.104
(1.53) (1.47) (1.73)* (1.76)* (1.91)* (1.87)* (2.40)** (1.37)Civil Service Quality 0.000 -0.001 -0.002 -0.001 -0.002 -0.001 -0.001 -0.001
(0.06) (0.73) (0.79) (0.95) (0.89) (0.81) (0.30) (0.43)Log Transfers/Capita -0.009 -0.007 -0.005 -0.014 -0.005 -0.006 -0.002 -0.011
(0.74) (0.73) (0.48) (1.61) (0.47) (0.52) (0.16) (1.18)Log Taxes/Capita 0.014 -0.047
(1.40) (3.15)***Constant 0.096 0.166 0.218 0.195 0.048 -0.140 -0.651 -0.267
(0.26) (1.75)* (1.59) (2.15)** (0.13) (0.39) (1.70)* (0.76)Observations 164 164 164 164 164 164 162 160R-squared 0.43 0.48 0.48 0.49 0.49 0.48 0.40 0.49
Robust t statistics in parentheses* significant at 10%; ** significant at 5%; *** significant at 1%
Moreover, the data do not suggest that local governments employ the profits they make
from providing services to expanding access to them. If local governments engage in this
activity, cost recovery might allow them to extend services to those who cannot afford to
pay market rates. When I add net service profits (i.e., local service fees minus local
government service expenditures) as an additional explanatory variable, it is either
26
marginally significant at the ten percent level or insignificant but has no effect on the
significance of service fees (not shown).12 Thus, while there is some evidence that local
governments at the margins may be employing the profits they can make from charging
market rates for services to enhance access to them, the practice is not common and the
effect is not strong.
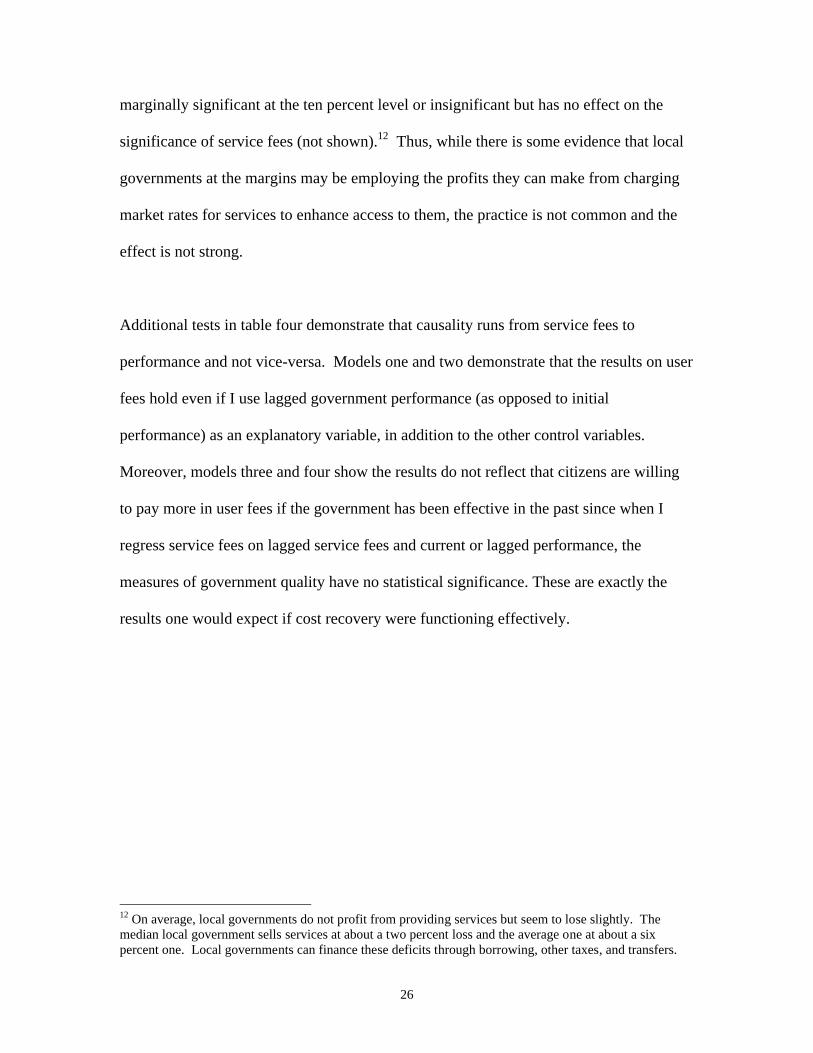
Additional tests in table four demonstrate that causality runs from service fees to
performance and not vice-versa. Models one and two demonstrate that the results on user
fees hold even if I use lagged government performance (as opposed to initial
performance) as an explanatory variable, in addition to the other control variables.
Moreover, models three and four show the results do not reflect that citizens are willing
to pay more in user fees if the government has been effective in the past since when I
regress service fees on lagged service fees and current or lagged performance, the
measures of government quality have no statistical significance. These are exactly the
results one would expect if cost recovery were functioning effectively.
12 On average, local governments do not profit from providing services but seem to lose slightly. The median local government sells services at about a two percent loss and the average one at about a six percent one. Local governments can finance these deficits through borrowing, other taxes, and transfers.
27
Table 4: Additional Checks
DV: Performance DV: Service Fees/Capita1 2 3 4
Log Service Fees/Capita 0.033(4.90)***
Log Lagged Service Fees/Capita 0.038 1.058 1.084(5.27)*** (28.05)*** (31.25)***
Performance 0.61(1.61)
Lagged Performance 0.435 0.451 0.218(5.85)*** (6.22)*** (0.46)
Log GDP/capita 0.018 0.020 -0.099 -0.094(0.57) (0.60) (0.68) (0.71)
ANC/Total Vote 0.064 0.082 0.241 0.287(1.25) (1.61) (0.68) (0.80)
Civil Service Quality 0.003 0.003 0.009 0.011(1.91)* (2.09)** (1.24) (1.61)
Log Transfers/Capita 0.003 0.002 -0.008 -0.008(0.29) (0.24) (0.26) (0.23)
Constant -0.047 -0.110 -0.245 -0.225(0.18) (0.41) (0.22) (0.23)
Observations 164 168 163 163R-squared 0.66 0.67 0.93 0.93
Robust t statistics in parentheses* significant at 10%; ** significant at 5%; *** significant at 1%
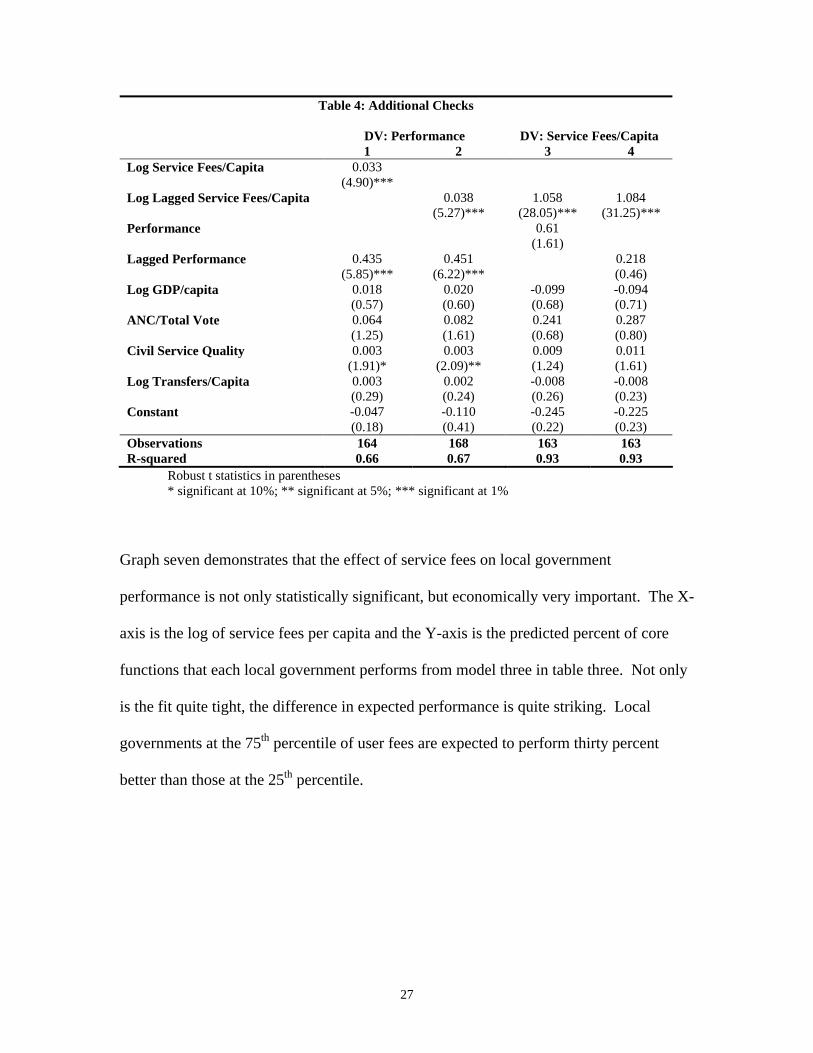
Graph seven demonstrates that the effect of service fees on local government
performance is not only statistically significant, but economically very important. The X-
axis is the log of service fees per capita and the Y-axis is the predicted percent of core
functions that each local government performs from model three in table three. Not only
is the fit quite tight, the difference in expected performance is quite striking. Local
governments at the 75th percentile of user fees are expected to perform thirty percent
better than those at the 25th percentile.
28
20
40
60
80
Pre
dict
ed
Co
re P
erfo
rma
nce
0 2 4 6 8Log Per Capita Service Fees
Graph Seven: Effect of Service Fees on Core Performance
Conclusion
The most important point to take away from this paper is that local governments in South
Africa today allocate access to services following a market logic that appears largely
immune to political discretion. However, it is not surprising that political competition
has no effect on access to services, since cost recovery leaves elected officials with very
little power to facilitate this outcome. It would appear that the ANC, with the active
support of key foreign aid agencies, have sacrificed a large measure of democratic policy
making for economic efficiency. To state it bluntly, while democratic elections exist at
the local level, strong fiscal accountability severely minimizes the substantive content of
29
those elections by predetermining how local governments will allocate services, their
most crucial function.
At the same time, it is important to underscore that my quantitative results showed no
evidence that permitting local governments more flexibility would improve their
performance. Nonetheless, embracing the view that greater flexibility might lead to less
effective local government inexorably implies that these entities cannot be part of the
solution to reducing poverty and inequality in South Africa. While such a stance may
justify current policy, it absolves elected local officials from the responsibility of
improving the welfare of their constituents.
These results do not gainsay that massive positive changes have taken place in South
Africa over the past fifteen years, such as universal suffrage, democratic elections, and
civil liberties for all. However, these are central government issues, not local government
ones, and the central government, by policy design, has encouraged local governments to
restrict the quantity of services they provide by the amount they can collect from user
fees and ignore larger political considerations. While this policy undoubtedly is an
improvement over the apartheid system where poor blacks paid taxes to subsidize the
lifestyle of whites, it does little to support democratic policy making at the local level.

30
References
Atkinson, Doreen (2006), “Taking to the Streets: Had Developmental Local Government
Failed in South Africa?” in Buhlungu et al (eds.) State of the Nation: South Africa
2007. Cape Town: Human Sciences Research Council.
Beall, Jo, Owen Crankshaw, and Susan Parnell (2002), Uniting a Divided City. London:
Earthscan.
Besley Timothy and Ian Preston (2002), Accountability and Political Competition:
Theory and Evidence. Working Paper, London: London School of Economics.
Bond, Patrick (2000a), Cities of Gold, Townships of Coal. Trenton, NJ: Africa World
Press.
Bond, Patrick (2000b), Elite Transition: From Apartheid to Neoliberalism in South
Africa. Durban: University of Natal Press.
Butler, Anthony (2006), “The State of the African National Congress,” in Buhlungu et al
(eds.) State of the Nation: South Africa 2007. Cape Town: Human Sciences
Research Council.
Easterly, William and Ross Levine (1997), “Africa’s Growth Tragedy: Polices and Ethnic
Divisions,” Quarterly Journal of Economics 112 (4): 1203-1250.
Eskom (2006), Tariffs and Charges Effective from 1 April 2006 – 31 March 2007.
Johannesburg: Eskom.
Evans, Peter (1995), Embedded Autonomy: States and Industrial Transformation.
Princeton: Princeton University Press.

31
Gaffney’s (2004), Gaffney’s Local Government in South Africa. Johannesburg: Gaffney’s
Group.
Handley, Antoinette (2005), “Business, Government and Economic Policymaking in the
New South Africa, 1990-2000,” Journal of Modern African Studies 43 (2): 211-
239.
IDASA (2002), Local Government Revenue, Pretoria: Institute for Democracy in South
Africa.
IDASA (2004), Local Government Powers and Functions (Revised Version), Pretoria:
Institute for Democracy in South Africa.
Levi, Margaret (1988), Of Rule and Revenue. Berkeley: University of California Press.
Lipset, Seymour (1959), “Some Social Requisites of Democracy: Economic
Development and Political Legitimacy,” American Political Science Review 53
(1): 69-105.
Loftus, Alex (2005), “Free Water as a Commodity: The Paradoxes of Durban’s Water
Services Transformations,” in McDonald (ed.), Age of Commodity: Water
Privatization in Southern Africa. Toronto: Earthscan Canada.
MacDonald, Michael (1996), “Power Politics in the New South Africa,” Journal of
Southern Africa Studies 22 (2): 221-233.
Makgetla, Neva (2006), “Local Government Budgets and Development: A Tale of Two
Towns,” in Buhlungu et al (eds.) State of the Nation: South Africa 2007. Cape
Town: Human Sciences Research Council.
32
McDonald, David (2002), “The Theory and Practice of Cost Recovery in South Africa,”
in McDonald and Pape (eds.) Cost Recovery and the Crisis of Service Delivery in
South Africa. Cape Town: Human Sciences Research Council. 2002
McDonald, David and John Pape (2002), “Introduction,” in McDonald and Pape (eds.)
Cost Recovery and the Crisis of Service Delivery in South Africa. Cape Town:
Human Sciences Research Council.
McDonald, David and Laila Smith (2004), “Privatizing Cape Town: From Apartheid to
Neoliberalism in the Mother City,” Urban Studies 41 (8): 1461-1484.
MDB (2003), Local Government Functions: Definitions of Norms and Standards.
Pretoria: Municipal Demarcation Board, Government of the Republic of South
Africa.
RSA (1998), The White Paper on Local Government. Pretoria: Ministry for Local
Government and Provincial Affairs, Government of the Republic of South Africa.
RSA (2003), Local Government Fact Book. Pretoria: Department of Provincial and Local
Government, Government of the Republic of South Africa.
RTI (2001), South Africa Local Government Financial Reform Project. Research
Triangle Park, NC: RTI International.
SACN (2007), State of the Cities Report. Johannesburg: South Africa Cities Network.
Sokoloff, Kenneth and Stanley Engerman (2000), “History Lessons: Institutions, Factor
Endowments, and Paths of Development in the New World,” Journal of
Economic Perspectives 14 (3): 217-232.
33
Tomlinson, Richard and Pauline Larsen (2003), “The Race, Class, and Space of
Shopping,” in Tomlinson, et al (eds.) Emerging Johannesburg, New York:
Routledge.
Tomlinson, Richard, Robert Beauregard, Lindsay Bremner, and Xolela Mangcu (2003),
“The Postapartheid Struggle for an Integrated Johannesburg,” in Tomlinson, et al
(eds.) Emerging Johannesburg, New York: Routledge.
Wittenberg, Martin (2003), Decentralization in South Africa, Working Paper,
Johannesburg: University of the Witswatersrand.