Assessing the mechanisms respons ible for differences in...
29
1 Assessing the mechanisms responsible for differences in nitrogen 1 requirements between Saccharomyces cerevisiae wine yeasts in 2 alcoholic fermentation 3 Claire Brice 1,2,3 , Isabelle Sanchez 1,2,3 , Catherine Tesnière 1,2,3 , Bruno Blondin 1,2,3 4 5 1 INRA, UMR1083 Science pour l’Œnologie, 2 Place Viala, F-34060 Montpellier, France. 6 7 2 Montpellier SupAgro, UMR1083 Science pour l’Œnologie, Place Viala, F-34060 8 Montpellier, France. 9 10 3 Université Montpellier 1, UMR1083 Science pour l’Œnologie, 2 Place Viala, F-34060 11 Montpellier, France. 12 13 14 Address correspondence to Bruno Blondin, [email protected] 15 Received: 16 Accepted: 17 Number of tables: 1 18 Number of figures: 7 19 Supplemental material: 7 20 21 22 23 24 25 26 27 28 29 30 31 32 AEM Accepts, published online ahead of print on 13 December 2013 Appl. Environ. Microbiol. doi:10.1128/AEM.03856-13 Copyright © 2013, American Society for Microbiology. All Rights Reserved. on May 15, 2018 by guest http://aem.asm.org/ Downloaded from
Transcript of Assessing the mechanisms respons ible for differences in...

1
Assessing the mechanisms responsible for differences in nitrogen 1
requirements between Saccharomyces cerevisiae wine yeasts in 2
alcoholic fermentation 3
Claire Brice1,2,3, Isabelle Sanchez1,2,3, Catherine Tesnière1,2,3, Bruno Blondin1,2,3 4
5
1 INRA, UMR1083 Science pour l’Œnologie, 2 Place Viala, F-34060 Montpellier, France. 6
7 2 Montpellier SupAgro, UMR1083 Science pour l’Œnologie, Place Viala, F-34060 8
Montpellier, France. 9
10 3 Université Montpellier 1, UMR1083 Science pour l’Œnologie, 2 Place Viala, F-34060 11
Montpellier, France. 12
13
14
Address correspondence to Bruno Blondin, [email protected] 15
Received: 16
Accepted: 17
Number of tables: 1 18
Number of figures: 7 19
Supplemental material: 7 20
21
22
23
24
25
26
27
28
29
30
31
32
AEM Accepts, published online ahead of print on 13 December 2013Appl. Environ. Microbiol. doi:10.1128/AEM.03856-13Copyright © 2013, American Society for Microbiology. All Rights Reserved.
on May 15, 2018 by guest
http://aem.asm
.org/D
ownloaded from

2
Abstract 33
Nitrogen is an essential nutrient for wine yeast during alcoholic fermentation, and its 34
abundance determines the fermentation rate and duration. The capacity to ferment in 35
conditions of nitrogen deficiency differs between yeasts. A characterization of the nitrogen 36
requirements of a set of 23 strains revealed large differences in their fermentative 37
performances under nitrogen deficiency, and these differences reflect the “nitrogen 38
requirements” of the strains. We selected and compared two groups of strains, one with low 39
nitrogen requirements (LNR) and the other with high nitrogen requirements (HNR). A 40
comparison of various physiological traits indicated that the differences are not related to the 41
ability to store nitrogen or the protein content. No differences in protein synthesis activity 42
were detected between strains with different nitrogen requirements. Transcriptomic analysis 43
revealed expression patterns specific to each of the two groups of strains with an 44
overexpression of stress genes in HNR strains and a stronger expression of biosynthetic genes 45
in LNR. Our data suggest that differences in glycolytic flux may originate from variation in 46
sensing and signaling nitrogen in condition of starvation. 47
Introduction 48
Alcoholic fermentation for wine-making is conducted in an environment that is stressful (high 49
ethanol content, nutrient starvation, low pH) for Saccharomyces cerevisiae yeasts. The 50
availability of diverse nutrients in grape musts (vitamins, sterols, unsaturated fatty acids, 51
pantothenic acid, or nitrogen) is often limited, restricting yeast cell growth. Nitrogen 52
limitation is by far the most frequent growth limitation encountered during wine fermentation 53
(1). Various nitrogen sources are available in grape musts, including ammonium ions, amino 54
acids and peptides. Only ammonium ions and the alpha-amino nitrogen (free amino acids 55
except proline) are used by yeasts in fermentation. Grape musts have diverse nitrogen 56
compositions and the concentration of assimilable nitrogen ranges from 60 to 500 mg liter-1 57
(2). The nitrogen content is dependent on many factors including rootstock, climate, vine 58
growing conditions, grape variety and grape processing (3). Nitrogen availability in musts is a 59
major determinant of the maximal fermentation rate (1), and also affects the size of the total 60
yeast cell population; however, the effect on fermentation rate is mainly independent on the 61
population size (2). Indeed, low assimilable nitrogen concentrations can lead to slow 62
fermentations (4-10). In enological conditions musts are considered as nitrogen-limited when 63
the assimilable nitrogen content is below 150 mg liter-1 (2, 11). 64
on May 15, 2018 by guest
http://aem.asm
.org/D
ownloaded from
3
The ability to ferment under conditions of low nitrogen availability differs between yeast 65
strains. This variability is manifested by differences in the capacity to maintain the 66
fermentation rate during the stationary phase. Indeed, most alcoholic fermentation occurs 67
during the stationary phase and the ability to ferment strongly during this phase has a large 68
effect on the total fermentation time. These differences of performance between yeast strains 69
have been reported as “nitrogen requirement” for alcoholic fermentation (1, 12). Various 70
approaches have been used to assess nitrogen requirements, for example measuring the 71
nitrogen flux required to support a constant fermentation rate (13, 14). According to these 72
measures, wine yeasts can be classified as high or low nitrogen-requiring strains. 73
The stationary phase, critical for fermentation, results from nitrogen depletion from yeast; 74
yeast cells adjust their metabolism and the fermentation rate drops more or less progressively 75
(14). The molecular mechanisms leading to the slow-down of the fermentation flux during 76
starvation are still unclear. Several studies have reported a link between the drop of the 77
fermentation rate and sugar transporter activity: nitrogen depletion and the shutdown of 78
protein synthesis results in the catabolic inactivation and degradation of sugar transporters 79
(10). However, the details of the consequences for the fermentation rate of such regulation 80
during starvation are not known. The onset of nitrogen starvation triggers massive 81
physiological changes involving in autophagy, nitrogen recycling systems, a decrease of 82
protein synthesis and the reorientation of the carbon flux to favor glycogen and trehalose 83
storage. Substantial transcriptional remodeling associated with the entry into starvation during 84
wine alcoholic fermentations has been described (15, 16), and includes the development of a 85
general stress response. In addition, specific depletion of amino acids induces genes encoding 86
enzymes of amino-acid biosynthesis (17-19). Many of these transcriptional changes are 87
controlled by the TOR pathway which senses the nitrogen status of the cell and adapts the 88
nitrogen metabolism to nutrient availability (20, 21). This control allows transition from the 89
use of rich sources of nitrogen to that of poor nitrogen sources. 90
Entry into stationary phase is also characterized by changes in protein abundance, which 91
generally decreases, despite some neosynthesis of stationary phase-specific or stress-induced 92
proteins (16). This neosynthesis implies mechanisms for recycling nitrogen compounds, such 93
as autophagy and ribophagy. Piggott et al. (22) have shown that autophagy is critical for yeast 94
fitness in alcoholic fermentation, illustrating the role of nitrogen reallocation under starvation. 95
Although the yeast response to nitrogen status in alcoholic fermentation has been described, 96
the molecular mechanisms underlying the differences in nitrogen requirement between strains 97
on May 15, 2018 by guest
http://aem.asm
.org/D
ownloaded from
4
are unknown. We report here an investigation of a set of wine yeast strains with different 98
nitrogen requirements with the aim of elucidating the underlying molecular mechanisms. We 99
combined a physiological analysis with a transcriptomic study and found that differences in 100
nitrogen requirement may be linked to differences in signaling in response to nitrogen 101
starvation. 102
103
MATERIALS AND METHODS 104
Yeast strains and inoculation. The eight S. cerevisiae strains used in this study were 105
acquired from various laboratory and industrial sources, and are listed in Table 1. When no 106
published data was available, species identification was checked by ITS restriction with 107
HaeIII (23). Among these strains, EC1118 is a reference wine yeast strain, since its genome 108
has been fully sequenced and characterized (24). The strains were stored and plated on YEPD 109
plates for single colony isolation. To inoculate experimental cultures, a preculture was 110
prepared by transferring a single colony from the agar plate to 50-ml YEPD medium in a 250-111
ml Erlenmeyer flask. This inoculum was grown overnight in an incubator at 28°C, with 112
shaking (280 rpm). One aliquot from this preculture to inoculate fermenters to a density of 113
1.106 cells ml-1. 114
Synthetic culture medium. Yeast was cultured in the synthetic medium (SM) described by 115
Bely et al. (2). It contains 200 g liter-1 glucose and its amino acid composition simulates the 116
nitrogen content of a standard grape juice. For these fermentations, we used a medium 117
containing only glucose to overcome the already known effects of variations in fructose 118
uptake (36) that were out of the scope of the present study. The standard SM, called “normal 119
medium”, contained 425 mg liter-1 assimilable nitrogen (SM425), and another SM with a 120
lower nitrogen content was also used (100 mg liter-1 assimilable nitrogen; SM100). In both 121
SM425 and SM100, the nitrogen source consisted of ammonium salts (30%) and α-amino 122
acids (70%) which, except proline, were considered as assimilable nitrogen. 123
Fermentation conditions, kinetics, and cycloheximide treatment. The fermenters (1.2 liter, 124
containing 1 liter of medium) were closed with fermentation locks (CO2 bubbling outlets 125
filled with water). The filling conditions were controlled and fermentations were carried out 126
under isothermal conditions (28°C), with permanent stirring (300 rpm). All fermentations 127
were run in duplicate or triplicate. 128
The amount of CO2 released during fermentation was calculated from automatic 129
measurements (taken every 20 min) of fermenter weight (25). The CO2 production rate was 130
on May 15, 2018 by guest
http://aem.asm
.org/D
ownloaded from
5
calculated by polynomial smoothing of the last 10 measurements of fermenter weight loss. 131
The numerous acquisitions of weight and the precision of weighing (0.1 to 0.01 g) allowed the 132
CO2 production rate to be calculated with accuracy (1). 133
To test the involvement of protein synthesis, cell cultures in SM100 were treated at the 134
beginning of the stationary phase with cycloheximide (Sigma, St Louis MO, USA) (100 µg 135
ml-1). Cycloheximide is an inhibitor of eukaryotic protein synthesis and acts by blocking the 136
elongation-factor-2-mediated translocation of peptidyl-tRNA from the A site to the P site on 137
the 60S ribosomal subunit. The efficiency of cycloheximide inhibition was verified by 138
measuring the rate incorporation rate of L-[35S] methionine in a control strain as a marker of 139
protein synthesis. 140
Quantification of yeast strain nitrogen requirement. One approach to determining the 141
yeast nitrogen requirement is to add, throughout fermentation in nitrogen-limited medium, the 142
amount of assimilable nitrogen necessary to maintain the CO2 production at a constant rate 143
during the stationary phase (13, 14). Fermentations were performed in SM100. When the CO2 144
production rate decreased, diammonium phosphate (DAP; 300 mg liter-1, equivalent to 63 mg 145
liter-1 assimilable nitrogen atoms) was added using a GILSON peristaltic pump. The amount 146
of nitrogen added to maintain the CO2 production rate constant is proportional to the 147
fermentation rate. The effects of the nitrogen additions were quantified by plotting the amount 148
added against CO2 produced and calculating the mean nitrogen consumption between 10 and 149
50 g liter-1 of CO2 produced (P10-50). 150
Biomass, nitrogen and protein determinations. The yeast population was characterized by 151
determining the number of cells after sonication using an electronic particle counter 152
(Multisizer 3 Coulter Counter; Beckman Coulter), and by measuring the dry weight. 153
The total nitrogen concentration was determined by distillation and back-titration according to 154
the Kjeldhal mineralization method (26). The residual ammonium concentration in the 155
medium was measured by spectrophotometry (Enzytec fluid Ammonia, R-Biopharm, 156
Darmstadt, Germany) with glutamate dehydrogenase (GLDH) according to the 157
manufacturer’s instructions. Residual free amino acids in the medium were assayed by cation-158
exchange chromatography followed by post-column derivatization with ninhydrin (Biochrom 159
30, Biochrom, Cambridge, U.K.). Total available nitrogen (TAN) and the residual nitrogen 160
(RN) present in the medium at the end of the fermentation were determined as the sums of 161
ammoniacal nitrogen and nitrogen from amino acids as determined before and after 162
on May 15, 2018 by guest
http://aem.asm
.org/D
ownloaded from
6
fermentation, respectively. Total yeast assimilable nitrogen (TYAN) was calculated as the 163
difference between TYAN and the RN. 164
Total cell protein was determined with the bicinchoninic acid protein assay (BCA method), 165
which is a modified Biuret method. In brief, proteins were extracted from cells by incubation 166
with 50% (vol/vol) DMSO for one hour at 100°C, and quantified with a BC Assay kit (Sigma-167
Aldrich, France). Bovine Serum Albumin (BSA) was used as the standard for calibration. 168
Protein synthesis determination. Protein synthesis rates were estimated by measurement of 169
the incorporation of L-[35S]methionine into the acid-precipitable protein fraction: 100-µl of 170
culture medium (containing 5.106 cells) was added to 10-µl of L-[35S]methionine (1µCi). 171
Incorporation was stopped either immediately (controls) or after incubation for 30 min at 172
25°C by adding 20-µl of the samples (cells + L-[35S]methionine) to 1-ml of cold 10% 173
trichloroacetic acid and 100-µl of BSA (1mg BSA ml-1) as a carrier protein to precipitate the 174
proteins. The samples were incubated 30 min on ice. The precipitable material was collected 175
by filtration through a 0.2-µm-pore-size Nucleopore filter and washed with 30-ml of cold 176
10% trichloroacetic acid. The radioactivity was measured in a liquid scintillation counter. 177
RNA extraction, labeling and microarray hybridization. The eight were subjected to 178
whole-genome expression analysis. EC1118 is considered as the reference strain. Two 179
biological replicates were performed for each strain. Total RNA was isolated from cultures at 180
45 g liter-1 of CO2 production (50% fermentation progress), by the TRIzol® method 181
according to Chomczynski and Sacchi (27). For each RNA extraction, 1.109 cells were 182
pelleted by centrifugation (3000 rpm, 2 min) and lysed mechanically by vortexing with glass 183
beads (d=0.3 mm) in 400-µl TRIzol® (GIBCO BRL) at 4°C for 8 min. The liquid phase was 184
collected and TRIzol® added to give a final volume of 4-ml; the samples were incubated for 5 185
min at room temperature, and 800-µl chloroform was added. The mixture was vortexed and 186
incubated for 2 min at temperature room, then centrifuged (10000 rpm, 15 min). An equal 187
volume of cold (-20°C) isopropanol was added to the aqueous phase to precipitate the RNA. 188
The samples were incubated for 10 min at room temperature and centrifuged (10000 rpm, 10 189
min). The resulting nucleic acid pellet was washed twice with 2-ml 75% ethanol / DEPC-190
treated water and then dissolved in 150-µl of nuclease-free water (Qiagen, USA). The RNA in 191
100 µg aliquots of these preparations was purified with the RNeasy® mini kit (Qiagen, USA) 192
following the RNA cleanup protocol, including membrane DNase digestion. Fluorescent 193
cDNAs were synthesized from 100 ng of total RNA using the one-color RNA Spike-in kit 194
(Agilent Technologies, Santa Clara, CA, USA) according to the manufacturer’s 195
on May 15, 2018 by guest
http://aem.asm
.org/D
ownloaded from

7
recommendation (indirect labeling of mRNAs with Cyanin 3 dCTP dye). Labeled cDNA was 196
purified with the RNeasy® mini kit (Qiagen, USA). 197
Agilent 8x15k gene expression microarrays with specific designs were obtained from Agilent 198
Technologies (Agilent Technologies, Santa Clara, CA, USA) and used for microarray 199
hybridization. The array design was based on ID 038619 with the addition of 39 genes from 200
the new regions of EC1118 ((24); available on GEO under the accession number GPL17690). 201
600 ng of labeled cRNA was hybridized on the slide for 17 hours in a rotating oven (10 rpm) 202
at 65°C using the Agilent technologies kit, according to the manufacturer’s instruction and 203
then washed. A Genepix 4000B scanner (Axon Instrument Inc.) was used for array 204
digitalization, and data were analyzed with Genepix Pro7 (Axon Instruments). 205
Statistical analyses 206
R.2.14.2 software (28) was used for statistical analyses. To obtain a general overview of the 207
profile of the high and low nitrogen-requiring strains, principal components analysis (PCA) 208
was performed using the FactoMineR package (29) with the following parameters: maximal 209
fermentation rate (Rmax), fermentation rate at 50% sugar consumption (R50), total fermentation 210
duration (Fd) and the quantified nitrogen requirement (QNr). The limma package (30-32) was 211
used to normalize and analyze the microarray data (quantile method for normalization 212
between arrays). To identify differential gene expression between strains with high and low 213
nitrogen requirements, a modified t-test was applied by filtering on confidence at p < 0.05, 214
using the Benjamini and Hochberg false discovery rate as multiple testing correction of the t-215
test p-values (33). Only genes with a log fold difference greater than 1 (positive or negative) 216
were taken into consideration. The genes for which expression differed were grouped 217
according to Gene Ontology (GO) process terms using Funspec with the Bonferroni 218
correction at a p-value cutoff of 0.05 (32). Hierarchical clustering was used to group the 219
selected genes by similarity of expression profiles using cluster version 3.0 (applying centered 220
correlation and complete-linkage clustering) and the results were loaded into JavaTreeView 221
version 1.1.5r2 for data display (34, 35). The complete data set is available through the Gene 222
Expression Omnibus database (accession number GSE50626). 223
Results 224
Yeast nitrogen requirements during the stationary phase. Twenty-three Saccharomyces 225
cerevisiae strains from various origins were screened to determine their abilities to ferment in 226
a must with a low nitrogen content (Fig. S1). Their nitrogen requirements were quantified (by 227
calculating the average slope between 10 and 50 g liter-1 of CO2 released after nitrogen 228
on May 15, 2018 by guest
http://aem.asm
.org/D
ownloaded from

8
addition) according to the constant rate fermentation procedure (CRF) described by Manginot 229
et al (14) (see the Materials and Methods). The distribution of the phenotype “nitrogen 230
requirement” shows substantial diversity between the strains; the distribution of the strains 231
according to nitrogen requirement was a continuum, indicating that it is a quantitative trait 232
involving several genes. These results are consistent with the findings of Manginot et al (14). 233
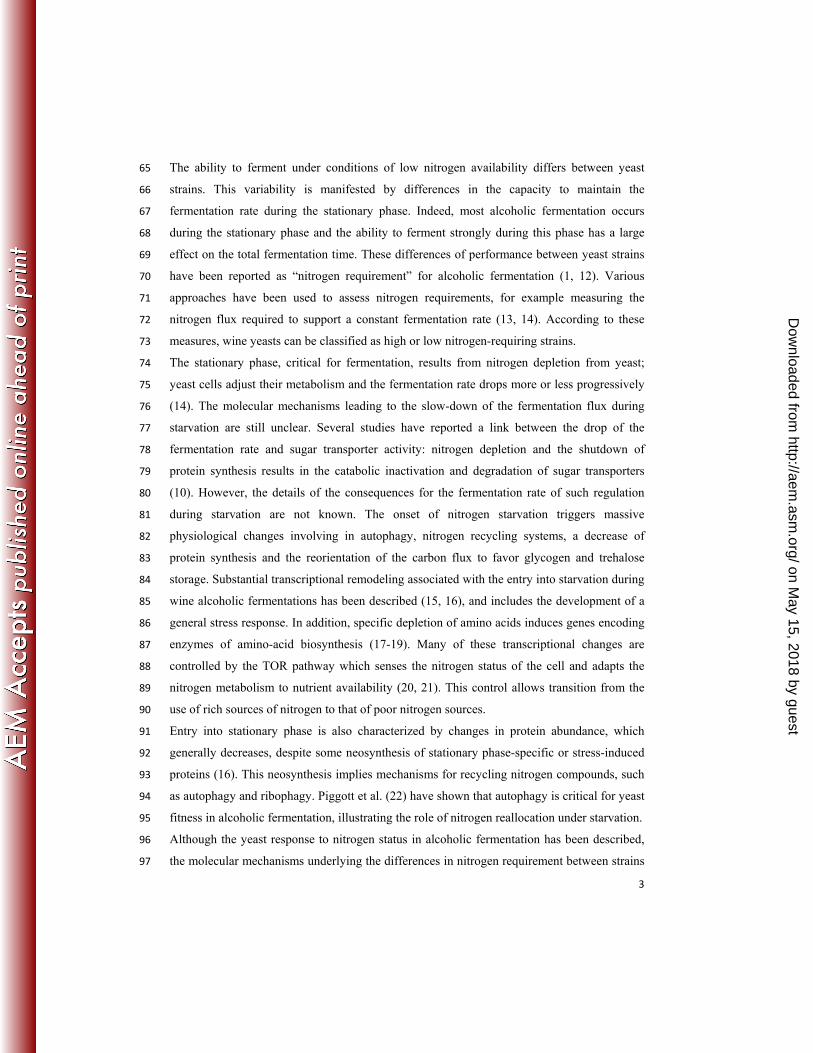
Eight strains of the 23 strains were selected for their extreme nitrogen requirements (low and 234
high): five strains (4CAR1, L2868, EC1118, Fermiflor, Zymasil) exhibited a low nitrogen 235
requirement (P10-50 close to 1 mg N g-1 CO2; Fig. 1), and three strains (K1M, 7013, MTF1782) 236
showed a high nitrogen requirement (P10-50 between 2.2 mg and 2.5 mg N g-1 CO2; Fig. 1). 237
These selected strains were thus representatives of strains with a low (LNR) or a high nitrogen 238
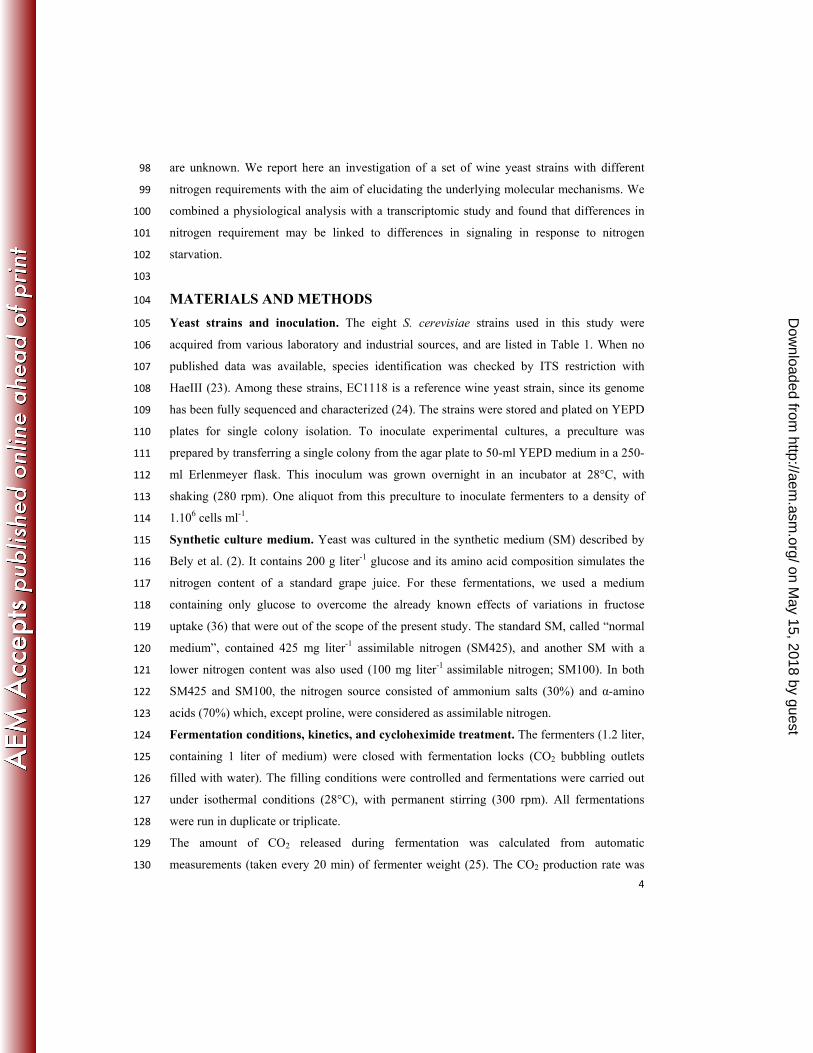
requirements (HNR). The fermentation kinetics for the eight strains on a nitrogen-limited 239
medium (SM100) were studied (Fig. 2). The results showed that all the strains exhibited low 240
fermentation rates and long durations of fermentation. The Rmax did not differ greatly between 241
the strains and did not correlate with nitrogen requirement; similarly, the cell population size 242
was not correlated with the nitrogen requirement of the strains (Fig. S2). However, during the 243
stationary phase, after the growth had stopped, the fermentation profiles of the strains 244
diverged substantially, such that by 70 hours of fermentation the two groups of strains were 245
clearly segregated: the strains with-low nitrogen requirements exhibited a higher fermentation 246
rate than strains with high nitrogen requirements. This is consistent with the classification of 247
the strains based on the measurement of nitrogen requirements by ammonium addition. We 248
verified that the HNR strains did not exhibit any intrinsic fermentation capacity defect by 249
examining their behavior in nitrogen-rich must (SM425): in these conditions, there were only 250
small differences in the fermentation profiles between the strains (Fig. S3). 251
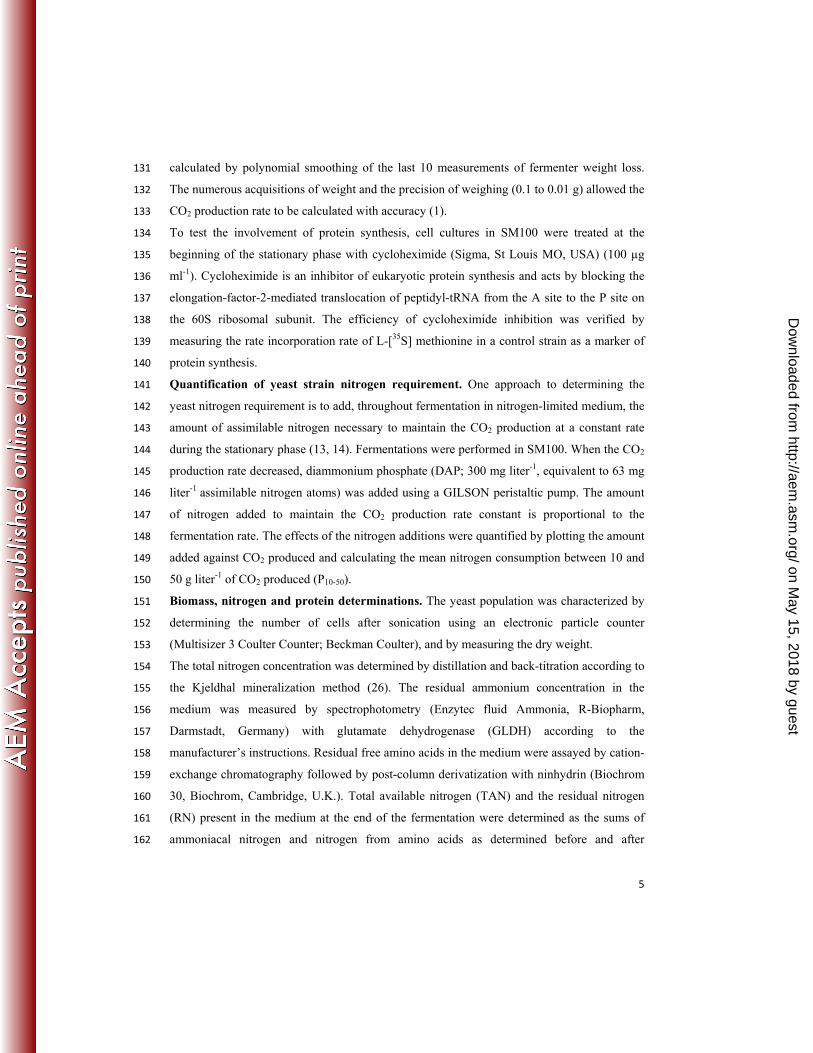
Analysis of the relationships between traits. We investigated the relationships between the 252
phenotypic traits of the eight yeasts, by principal components analysis (PCA) (Fig. 3A, 3B). 253
We considered four measures to build the variable factor map: Rmax, R50, Tf, QNr. The 254
projection on the two principal axes preserves 95% of the information and explains 255
respectively 88% and 7% of this variation. The PCA of kinetic measures allowed the 256
discrimination of strains according to their nitrogen requirement. Also, there was a strong 257
correlation between the strain nitrogen requirement and total fermentation duration, in 258
agreement with the observations of Bely et al (2). PCA also indicated that nitrogen 259
requirement and total fermentation duration were not correlated with the R50 and Rmax. These 260
on May 15, 2018 by guest
http://aem.asm
.org/D
ownloaded from

9
results are consistent with notion that the ability of cells to maintain a high fermentation rate 261
in stationary phase is linked to their nitrogen requirement. 262
Comparisons of physiological traits. We examined whether differences in nitrogen 263
requirement were associated with variations in the cellular content of yeast cells. We 264
measured total nitrogen, protein content and dry mass of yeast cells at various stages of the 265
fermentation process (Fig. S4). For all the measures, differences between the LNR and HNR 266
groups are small and they are not statistically different. There was no clear segregation of the 267
nitrogen content between LNR and HNR strains (Fig. S4A). There are also, no significant 268
differences between strains in the protein content at mid-fermentation (Fig. S4B) or at 80% 269
fermentation progression (Fig. S4C). At the end of fermentation there were small differences, 270
and although several LNR strains displayed a slightly greater protein content, this was not the 271
case for the Fermiflor strain. Higher protein content was thus not a general feature of LNR 272
strains. For all strains, dry mass values increase between mid-fermentation and the end of 273
fermentation, in agreement with previous reports (Fig. S4D, S4E) (37). However, HNR and 274
LNR strains showed slightly different behaviors, with a larger increase in dry mass for HNR 275
strains than LNR strains during the stationary phase. The increase in dry mass was consistent 276
with the storage of carbohydrates (glycogen, trehalose) at this stage, as previously 277
demonstrated by Manginot et al (14). We also checked the utilization of the nitrogen sources 278
by the strains. All the nitrogen sources (except proline) were metabolized by all the strains 279
during the first 20 hours of fermentation (data not shown). This excludes the possibility that 280
the differences in nitrogen requirements were consequences of differences in the uptake of 281
nitrogen sources. 282
Assessment of the role of protein synthesis. The ability of yeast strains to maintain a high 283
fermentation rate during the stationary phase can be dependent on their capacity to synthesize 284
proteins. We therefore examined the effects of inhibiting protein synthesis on the fermentation 285
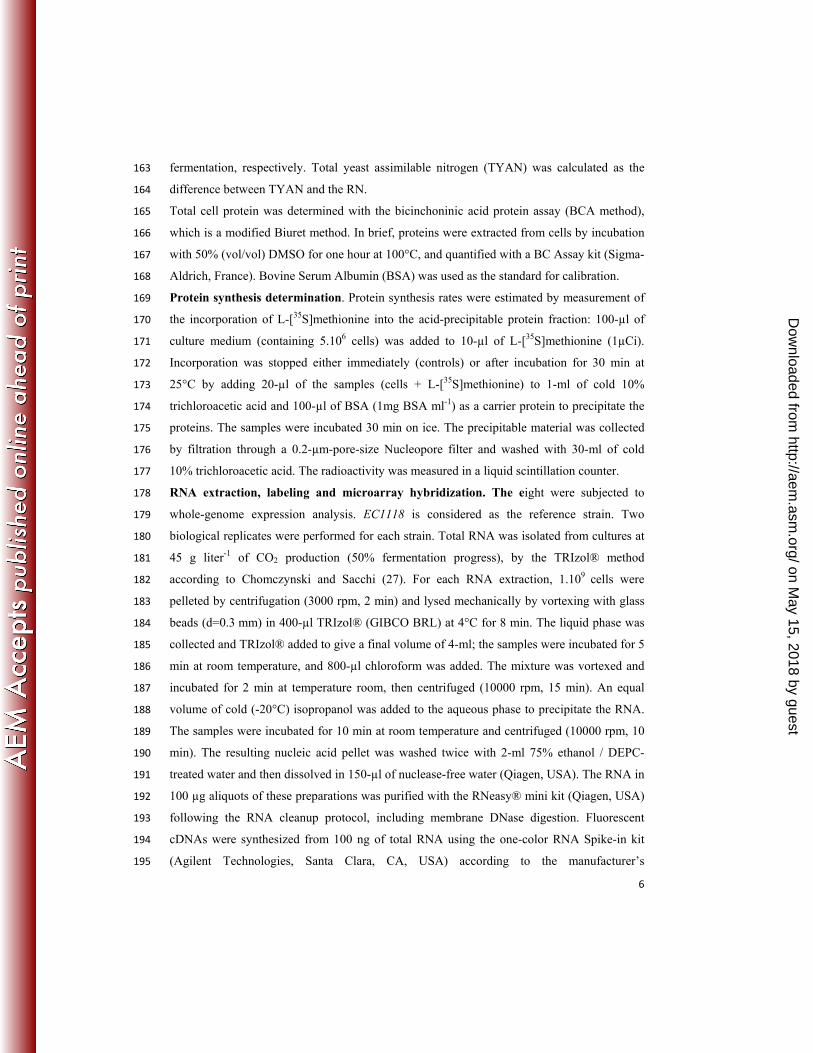
kinetics. We added the protein synthesis inhibitor cycloheximide to cultures of the seven 286
strains on SM100 at the beginning stationary phase (47 hours of fermentation); as cell growth 287
had already stopped by this time, any effects of the drug could not be due to inhibition of 288
growth. Cycloheximide modified the fermentation profiles confirming the involvement of 289
protein synthesis. Cycloheximide triggered a large and rapid decrease of the fermentation rate 290
of the LNR strain L2868 immediately after its addition (Fig. 4). Its effect on the fermentation 291
rate of HNR strain MTF1782 was smaller, and the kinetic profile remained similar to that of 292
the control (Fig. 4). Furthermore, the kinetic profiles of the strains L2868 and MTF1782 293
on May 15, 2018 by guest
http://aem.asm
.org/D
ownloaded from

10
become very similar after cycloheximide addition. It was thus possible that the differences in 294
behavior were due to more protein synthesis in LNR than in HNR strains. We therefore 295
compared the protein synthesis activities by measuring the rate of L-[35S] methionine 296
incorporation into L2868 and MTF1782 (Fig. S5). Protein synthesis was very similar in the 297
two strains (difference of 5%). The differences in kinetic profile are therefore not caused by 298
differences in overall protein synthesis activity. We also confirm that cycloheximide inhibited 299
protein synthesis in these conditions. These results suggested the involvement of other 300
mechanisms in the differences of the glycolytic flux between strains during the stationary 301
phase of alcoholic fermentation. 302
Transcriptomic analysis 303
Gene expression is a major determinant of phenotypic diversity (17) and may contribute to 304
differences in strain fermentation properties. The analysis of gene expression patterns can 305
provide insights into the molecular and physiological mechanisms associated with differences 306
in fermentation capacities. We therefore examined the gene expression profiles of the eight 307
selected strains. The transcriptomes were analyzed in cells fermenting in a nitrogen-limited 308
medium (SM100) and harvested at stationary phase (45g liter-1 of CO2 produced and 309
corresponding to 6% ethanol). At this stage, the strains exhibited differences in fermentation 310
rates. In addition, the transcriptome has been shown to be stable at this stage when growth has 311
stopped for all cells and nutrients have been depleted (15). We compared the global 312
expression patterns by microarray, using two biological replicates for each strain. Intraclass 313
coefficients of correlation (ICC) were 94.6% to 99.1% (data not shown), indicating good 314
reproducibility of data. 315
Assessing variations in gene expression in the yeast population. Four hundred and fifty 316
four genes were differentially expressed between the two groups of strains (HNR and LNR), 317
with an absolute logFC greater than 1; 248 genes were overexpressed in LNR strains and 206 318
genes in HNR strains. The set of genes overexpressed in HNR strains was enriched in genes 319
related to the stress response and encoding proteins involved in the production of reserve 320
carbohydrates including trehalose and glycogen (TPS1, TPS2, TPS3, UGP1, TLS1, PGM2, 321
GLG1, GLG2) (Fig. 5A); in response to nitrogen starvation, these strains overexpressed genes 322
involved in the metabolism of amino acids such as arginine (ARG1), serine (CHA1), alanine 323
(ALD2), glutathione (GLO1), and also genes involved in glutamate biosynthesis (GAD1, 324
GDH2) and sulfate metabolism (MET5, SUL2). Conversely, the set of genes overexpressed in 325
LNR strains included many encoding proteins involved in protein synthesis (Fig. 5B). This 326
on May 15, 2018 by guest
http://aem.asm
.org/D
ownloaded from
11
suggests that in LNR strains, genes encoding rRNA processing, were less susceptible to stress 327
caused by nitrogen starvation. 328
Hierarchical clustering analysis. A global comparison of the expression patterns of all the 329
strains revealed 2484 genes that were differentially expressed (adjP < 0.05). The aim of this 330
analysis was to observe a tendency of gene expression in a strain group. Hierarchical 331
clustering of gene expression profiles identified eight clusters of expression profiles for which 332
there was a tendency in segregation between LNR and HNR strains (Fig. S6). In fact, the 333
segregation is not totally perfect between the two groups of strains. For example, Fermiflor 334
LNR strain showed similarity to HNR strain in cluster II and a part of cluster III (Fig. 6), and 335
with a neutral position for other clusters. Interestingly, EC1118 strain also classified as LNR 336
strain, presented a HNR transcriptomic response for all the clusters. For the others strains, 337
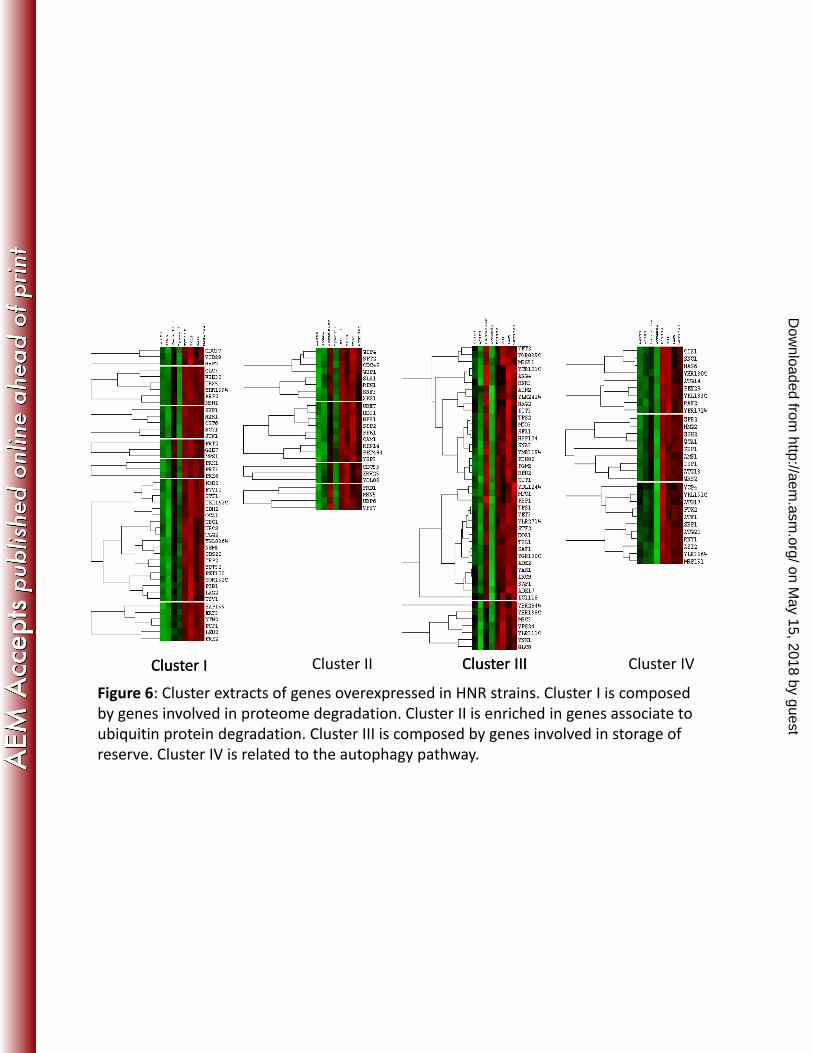
observations showed generally four clusters (clusters I, II, III, IV) including groups of genes 338
overexpressed in HNR strains (Fig. 6). Cluster I contains genes involved in proteasome 339
degradation (PRE2, PRE3, PRE6) and cluster II is enriched in genes involved in the ubiquitin 340
protein degradation pathway. Cluster III is composed of two small sub-clusters with similar 341
profiles, and includes genes involved in storage of reserves, such as trehalose and glycogen 342
(TPS1, TPS2, TSL1, PGM2, GLC8). Cluster IV contains genes associated with autophagy. 343
Thus, protein degradation and nitrogen recycling both appear to be more active in HNR than 344
LNR strains. Indeed, the four clusters contain genes controlled by NCR (Nitrogen Catabolite 345
Repression) and the TOR pathway (VID30 in cluster I, GDH3 in cluster II, PUT1 in cluster 346
III, ATG14 in cluster IV). Four clusters (V, VI, VII, VIII) included genes overexpressed in 347
LNR strains. They contain genes involved in ribosome biogenesis, for example of the RPS 348
and RPL families, and families of genes involved in RNA processing (UTP, NOP, IMP, RRP, 349
RPF family genes). These data indicate that there is a very common mechanism: a stronger 350
expression of genes involved in protein and ribosome synthesis, transcription and RNA 351
metabolism in the LNR than HNR strains. But the expression data obtained for EC1118 strain 352
reveal a different behavior and suggest that additional mechanisms are involved. EC1118 353
transcriptomic data present an exception since it has a physiological profile of a LNR strain, 354
but a transcriptomic profile similar to HNR strains. This suggest that the EC1118 355
fermentation ability in nitrogen-deficient condition origins from a mechanism different from 356
the other strains. There is also evidence that the fermentation rate does not determine the 357
transcriptomic profile of the strain. 358
on May 15, 2018 by guest
http://aem.asm
.org/D
ownloaded from

12
The genes overexpressed in LNR strains include 25 of the 39 new genes identified in three 359
regions (A, B and C) of the EC1118 strain genome, originating from horizontal transfer (27). 360
The A region is not differentially expressed between LNR and HNR strains (Fig. S7). The B 361
region is present in four strains, three LNR strains (L2868, 4CAR1, EC1118) and a HNR 362
strain (K1M). The presence/absence of the introgressions was verified by PCR on multiple 363
genes in the region (data not shown). Expression data show that only LNR strains expressed 364
genes containing in this region (Fig. S7). Concerning the C region, three strains containing the 365
totality of the introgression (L2868, 4CAR1, EC1118) and for two strains, we have controlled 366
he absence of these regions (7013, MTF1782). Three strains contain only three genes of the C 367
region (Fermiflor, Zymail, K1M). Expression data show that these three genes are expressed 368
in all the LNR strains, but also in the HNR strain K1M (Fig. S7). These are the genes FOT1 369
and FOT2 corresponding to two fungal oligopeptide transporters (38) and the SEO1 gene 370
corresponding by sequence homology to a putative permease, member of the allantoate 371
transporter subfamily (27). Although the expression of these three genes in all LNR strains 372
might suggest a role in the nitrogen requirement, a similar behavior in the HNR strain K1M 373
contradicts this hypothesis. 374
Correlation between gene expression and fermentation rates. The expression of a total of 375
282 genes was found to correlate with fermentation rate (R50): 129 positively and 153 376
negatively. Only the set of positively correlated genes was enriched in particular functions 377
(Fig. 7). From these data, high fermentation rates on nitrogen-deficient medium were 378
associated with the overexpression of genes involved in protein synthesis, transcription and 379
rRNA processing. These genes belong to different clusters with genes overexpressed in LNR 380
strains. There was no detectable functional enrichment among the set of genes negatively 381
correlated with R50; nevertheless, various genes involved in the metabolism of energy reserves 382
(GLC2, GLC3, YPI1) are member of this group. 383
Discussion 384
The fermentation capacities of yeast strains in media with low nitrogen content differ (12, 14, 385
38). We screened 23 strains of different origins for their nitrogen requirements and confirmed 386
here the variability of this character. The nitrogen requirements of the strains varied more than 387
2.5 fold and were associated with diversity in fermentation duration on a nitrogen-limited 388
medium. Through the characterization of fermentation properties of eight strains with 389
contrasted nitrogen requirements, we confirm that the differences are linked to how well the 390
strains maintain a high fermentation rate after the entry into stationary phase in conditions of 391
on May 15, 2018 by guest
http://aem.asm
.org/D
ownloaded from

13
nitrogen starvation. We checked that the differences in fermentation performances were not 392
triggered by differences in the utilization of the available nitrogen sources: all the strains 393
consumed the assimilable nitrogen sources during the first hours of the fermentation, in 394
agreement with previous observations (39). There were only small differences between high 395
nitrogen-requiring (HNR) and low nitrogen-requiring (LNR) strains in term of cellular 396
contents: we did not find any correlations between strain fermentation capacity and abilities to 397
store nitrogen, consistent with the report by Julien et al (38); and we could not differentiate 398
HNR and LNR strains on the basis of protein content. The total dry mass during starvation at 399
the end of the fermentation was higher for HNR than LNR strains, consistent with greater 400
accumulation of storage carbohydrate. This observation is in agreement with Manginot et al 401
(13) that reported that the amount of glycogen was directly correlated to the nitrogen 402
requirement of the strains and thus higher in HNR strains. Therefore, the only difference in 403
cellular contents we could find to be related to the nitrogen requirements was greater storage 404
of carbohydrates in HNR than LNR. 405
Protein synthesis can be a determinant of yeast fermentation capacity. We confirmed that 406
protein biosynthesis was required to maintain the fermentation rate in stationary phase. 407
However, the rates of protein synthesis in representative HNR and LNR strains were similar, 408
and could not explain the differences in fermentation rate between these two strains. 409
The transcriptomic study revealed expression patterns that were common to the strains of each 410
group (HNR and LNR), (except for EC1118 strain), indicating that their member strains 411
display similar physiological responses. However, there were large differences between the 412
two groups of strains: genes involved in synthetic processes (protein synthesis, RNA 413
processing, etc) were overexpressed in LNR strains whereas genes involved in protein 414
degradation, nitrogen recycling and the stress response were more strongly expressed in HNR 415
strains. Except for the EC1118 strain, it seems that a common mechanism allows 416
distinguishing LNR and HNR strains. The HNR strains exhibit a pattern characteristic of 417
nutrient-starved and stressed cells whereas LNR strains exhibit a clearly weaker starvation 418
response. The higher expression of genes involved in ribosome biogenesis in LNR strains 419
indicates that the TOR pathway is more active than it is in HNR strains, and therefore that 420
nitrogen starvation is less severe. The stress response genes controlled by Msn2/Msn4, 421
including genes for the synthesis of the storage carbohydrates glycogen and trehalose, were 422
expressed more strongly in the HNR than LNR strains, and there was an increase in storage 423
carbohydrates. This is consistent with the previous observation that the dry mass for HNR 424
on May 15, 2018 by guest
http://aem.asm
.org/D
ownloaded from

14
strains was greater than that for LNR strains, presumably due to the accumulation of glycogen 425
and trehalose as demonstrated in a previous study (14). In nitrogen limited conditions, the 426
HNR yeasts were more sensitive to nitrogen-starvation, resulting in a stronger stress response, 427
weaker expression of biosynthetic genes and lower fermentation rate. The susceptibility to 428
nitrogen-starvation could correspond to a sensitivity threshold, which would be more 429
important in HNR strains. This sensitivity to nitrogen could also be the result of a nitrogen 430
dose effect in the medium. Ethanol production at this stage was identical for the two groups of 431
strains, ruling out a possible role in the differences in stress response. 432
These differences may be consequences of differences in the nitrogen sensing signaling 433
systems. The differences in gene expression and the physiological responses are reminiscent 434
of the observations of Watanabe et al (41) who analyzed the effects of a mutated form of the 435
PAS kinase RIM15 in sake yeast. They showed that the altered form of RIM15 reduced the 436
yeast stress response and the amount of storage carbohydrate, and enhanced the fermentation 437
rate. RIM15 is involved in nitrogen signaling downstream from TOR, which senses the 438
nitrogen status of the cell (42, 43). Nitrogen starvation leads to activation of Rim15p resulting 439
in induction of the quiescent program and a stress response (44, 45). This suggests that 440
differences in sensing and nitrogen signaling between HNR and LNR strains could contribute 441
to differences in fermentation rates during starvation. Such a mechanism is consistent with the 442
absence of differences in the amount and synthesis of protein between the two groups of 443
strains. How diversity in nitrogen sensing/signaling modulates the glycolytic flux is unclear, 444
although reducing the stress response in sake yeast could increase the fermentation rate (39, 445
45, 46). This implies a link between nitrogen signaling and the fermentation rate that could 446
explain differences in behavior between the two groups of strains. The data obtained from 447
EC1118 strain suggest that other mechanisms may also be involved in the nitrogen 448
requirement. Moreover, this strain possesses several introgressed non-Saccharomyces 449
cerevisiae regions. We examined whether they could play a role in fermentative capacity in 450
nitrogen-limited conditions. We observed that only three out the five LNR strains expressed 451
genes of these regions indicating that these regions are not necessary to expression of the 452
phenotype “low nitrogen requirement”. However we cannot rule out the contribution of these 453
regions in a given strain. 454
Thus, HNR yeasts may be more sensitive to nitrogen-starvation stress, limiting protein 455
synthesis and decreasing their fermentation rate. In conclusion, the nitrogen requirements of a 456
wine strain may correspond to a common mechanism that could be its ability to sense nitrogen 457
on May 15, 2018 by guest
http://aem.asm
.org/D
ownloaded from

15
starvation and develop a quiescent program that reduces the flow of energy and increases its 458
adaptation to stress. Further work is required to identify the genes and mechanisms underlying 459
these phenomena. The nitrogen requirement of a strain is a quantitative trait, so it may be 460
possible to identify the genes responsible for the phenotype by a genetic approach. 461
ACKNOWLEDGMENTS 462
This work was supported by the ANR project ALIA 2009. We are grateful to Christian Brion 463
for assistance with microarray preparation. We thank Jean-Marie Sablayrolles for critical 464
reading of this manuscript. 465
References 466
1. Bely M, Sablayrolles JM, Barre P. 1990. Automatic detection of assimilable nitrogen 467
deficiencies during alcoholic fermentation in oenological conditions. J. Ferment. Bioeng. 468
70:246-252. 469
2. Bely M, Sablayrolles JM, Barre P. 1990. Description of alcoholic fermentation kinetics: 470
its variability and significance. Am. J. Enol. Vitic. 159:25-32. 471
3. Lafon-Lafourcade S, Peynaud E. 1959. Dosage microbiologique des acides aminés des 472
moûts de raisins et de vins. Vitis 2:45-46. 473
4. Bezenger MC, Navarro JM. 1987. Influence de l’azote sur la fermentation alcoolique en 474
milieu modèle simulant les conditions de l’oenologie. Sci. Alim. 7:41-60. 475
5. Blateyron L, Sablayrolles JM. 2001. Stuck and slow fermentations in enology: statistical 476
study of causes and effectiveness of combined additions of oxygen and diammonium 477
phosphate. J. Biosci. Bioeng. 91:184-189. 478
6. Kunkee RE. 1991. Relationship between nitrogen content in must and sluggish 479
fermentation, p. 148-155. In J. M. Rantz (ed), Proceedings of the international symposium 480
on nitrogen in grapes and wine. American Society for Enology and Viticulture, Davis, CA. 481
7. Maisonnave P, Sanchez I, Moine V, Dequin S, Galeote V. 2013. Stuck fermentation: 482
development of a synthetic stuck wine and study of a restart procedure. Int. J. Food 483
Microbiol. 163:239‑247. 484
8. Monk PR. 1982. Effect of nitrogen and vitamin supplements on yeast growth and rate of 485
fermentation of rhine riesling grape juice. Food Technol. 34:328-332. 486
9. Rozes N, Cuzange B, Larue F, Ribéreau-Gayon P. 1988. Incidence sur la fermentation 487
alcoolique d’une supplémentation du moût de raisin en sulfate d’ammonium. Conn. Vigne 488
Vin. 22:163-167. 489
on May 15, 2018 by guest
http://aem.asm
.org/D
ownloaded from
16
10. Salmon JM. 1989. Effect of sugar transport inactivation in Saccharomyces cerevisae on 490
sluggish and stuck oenological fermentation. Appl. Environ. Microbiol. 55:933-958. 491
11. Agenbach WA. 1977. A study of must nitrogen content in relation to incomplete 492
fermentations, yeast production and fermentation activity, p. 66-68. In Beukman, E.F (ed), 493
Proceedings of the South African Society of Enology and Viticulture, South Africa: 494
Stellenbosch. 495
12. Gutiérrez A, Chiva R, Sancho M, Beltran G, Arroyo-López FN, Guillamon JM. 2012. 496
Nitrogen requirements of commercial wine yeast strains during fermentation of a synthetic 497
grape must. Food Microbiol. 31:25‑32. 498
13. Manginot C, Sablayrolles JM, Roustan JL, Barre P. 1997. Use of constant rate 499
alcoholic fermentations to compare the effectiveness of different nitrogen sources added 500
during the stationary phase. Enzyme Microb. Tech. 20:373-380. 501
14. Manginot C, Roustan JL, Sablayrolles JM. 1998. Nitrogen demand of different yeast 502
strains during alcoholic fermentation. Importance of the stationary phase. Enzyme Microb. 503
Tech. 23:511-517. 504
15. Rossignol T, Dulau L, Julien A, Blondin B. 2003. Genome-wide monitoring of wine 505
yeast gene expression during alcoholic fermentation. Yeast. 20:1369–1385. 506
16. Rossignol T, Kobi D, Jacquet-Gutfreud L, Blondin B. 2009. The proteome of a wine 507
yeast strain during fermentation, correlation with the transcriptome. J. Appl. Microbiol. 508
107:47-55. 509
17. Gasch AP, Spellman PT, Kao CM, Carmel-Harel O, Eisen MB, Storz G, Botstein D, 510
Brown PO. 2000. Genomic expression programs in the response of yeast cells to 511
environmental changes. Mol. Biol. Cell. 11:4241-4257. 512
18. Jia MH, Larossa RA, Lee JM, Rafalski A, Derose E, Gonye G, Xue Z. 2000. Global 513
expression profiling of yeast treated with an inhibitor of amino acid biosynthesis, 514
sulfometuron methyl. Physiol. Genomics. 3:83‑92. 515
19. Natarajan, K, Meyer MR, Jackson BM, Slade D, Roberts C, Hinnebusch AG, Marton 516
MJ. 2001. Transcriptional profiling shows that Gcn4p is a master regulator of gene 517
expression during amino acid starvation in yeast. Mol. Cell. Biol. 21:4347‑4368. 518
20. Cardenas ME, Cutler NS, Lorenz MC, Di Como CJ, Heitman J. 1999. The TOR 519
signaling cascade regulates gene expression in response to nutrients. Genes Dev. 13:3271-520
3279. 521
on May 15, 2018 by guest
http://aem.asm
.org/D
ownloaded from

17
21. Hardwick JS, Kuruvilla FG, Tong JK, Shamji AF, Schreiber SL. 1999. Rapamycin-522
modulated transcription defines the subset of nutrient-sensitive signaling pathways directly 523
controlled by the tor proteins. Proc. Natl. Acad. Sci. USA. 96:14866-14870. 524
22. Piggott N, Cook MA, Tyers M, Measday V. 2011. Genome-wide fitness profiles reveal a 525
requirement for autophagy during yeast fermentation. G3 (Bethesda). 1:353‑367. 526
23. White TJ, Lee S, Taylor J. 1990. PCR Protocols. A guide to methods and applications. 527
In Amplification and Direct Sequencing of Fungal Ribosomal RNA Genes for 528
Phylogenetics, p. 315.322. In In MA Innis, Gelfand DH, Sninsky JJ, White TJ (ed), 529
Academic Press, San Diego, California. 530
24. Novo M, Bigey F, Beyne E, Galeote V, GavoryF, Mallet S, Cambon B, Legras JL, 531
Wincker P, Casaregola S, Dequin S. 2009. Eukaryote-to-eukaryote gene transfer events 532
revealed by the genome sequence of the wine yeast Saccharomyces cerevisiae EC1118. 533
Proc. Natl. Acad. Sci. USA. 106:16333–16338. 534
25. Sablayrolles JM, Barre P, Grenier P. 1987. Design of laboratory automatic system for 535
studying alcoholic fermentations in an isothermal oenological condition. Biotech. Tech. 536
1:181-184. 537
26. Scheiner D. 1976. Determination of ammonia and kjeldhal nitrogen by endophenol 538
method. Water Res. 10:31-36. 539
27. Chomczynski P, Sacchi N. 1987. Single-step method of RNA isolation by acid guanidium 540
thiocyanate-phenol-chloroform extraction. Anal Biochem. 162:156-159. 541
28. R Development Core Team. 2008. R: A language and environment for statistical 542
computing. R Foundation for Statistical Computing, Vienna, Austria. 543
29. Lê S, Josse J, Husson F. 2008. FactoMineR: An R package for multivariate analysis. J. 544
Stat. Softw. 25:1-18. 545
30. Smyth GK. 2004. Linear model and empirical Bayes methods for assessing differential 546
expression in microarray experiments. Statis. Appl. Genet. Mol. Biol. 3:1-26. 547
31. Smyth GK, Michaud J, Scott H. 2005. The use of within-array replicate spots for 548
assessing differential expression in microarrays experiments. Bioinformatics. 21:2067-549
2075. 550
32. Smyth GK, Speed TP. 2003. Normalization of cDNA microarray data. Methods. 31:265-551
273. 552
33. Benjamini Y, Dray D, Elmer G, Kafkafi N, Golani I. 2001. Controlling the false 553
discovery rate in behavior genetics research. Behav. Brain Res. 125:279-284 554
on May 15, 2018 by guest
http://aem.asm
.org/D
ownloaded from

18
34. de Hoon MJ, Imoto S, Nolan J, Miyano S. 2004. Open Source Clustering Software. 555
Bioinformatics. 20:1453-1454. 556
35. Saldanha AJ. 2004. Java Treeview extensible visualization of microarray data. 557
Bioinformatics. 20:3246-3248 558
36. Guillaume C, Delobel P, Sablayrolles JM, Blondin B. 2007. Molecular basis of fructose 559
utilization by the wine yeast Saccharomyces cerevisiae: a mutated HXT3 allele enhances 560
fructose fermentation. Appl. Environ. Microbiol. 73:2432‑2439. 561
37. Varela C, Pizarro F, Agosin E. 2004. Biomass content governs fermentation rate in 562
nitrogen-deficient wine musts. Appl. Environ. Microbiol. 6:3392-3400. 563
38. Damon C, Vallon L, Zimmermann S, Haider MZ, Galeote V, Dequin S, Luis P, 564
Fraissinet-Tachet L, Marmeisse R. 2011. A novel fungal family of oligopeptide 565
transporters identified by functional metatranscriptomics of soil eukaryotes. ISME J. 566
5:1871‑1880. 567
39. Novo MT, Beltran G, Rozes N, Guillamon JM, Mas A. 2005. Effect of nitrogen 568
limitation and surplus upon trehalose metabolism in wine yeast. Appl. Microbiol. 569
Biotechnol. 66:560-566. 570
40. Julien A, Roustan JL, Dulau L, Sablayrolles JM. 2000. Comparison of nitrogen and 571
oxygen demands of enological yeasts: technological consequences. Am. J. Enol. Vitic. 572
51:215-222. 573
41. Watanabe D, Araki Y, Zhou Y, Maeya N, Akao T, Shimoi H. 2012. A loss-of-function 574
mutation in the PAS kinase Rim15p is related to defective quiescence entry and high 575
fermentation rates of Saccharomyces cerevisiae sake yeast strains. Appl. Environ. 576
Microbiol. 78:4008‑4016. 577
42. Pedruzzi I, Dubouloz F, Cameroni E, Wanke V, Roosen J, Winderickx J, De Virgilio 578
C. 2003. TOR and PKA signaling pathways converge on the protein kinase Rim15 to 579
control entry into G0. Mol. Cell. 12:1607‑1613. 580
43. Swinnen E, Wanke V, Roosen J, Smets B, Dubouloz F, Pedruzzi I, Cameroni E, De 581
Virgilio C, Winderickx J. 2006. Rim15 and the crossroads of nutrient signalling pathways 582
in Saccharomyces cerevisiae. Cell Div. 1:3. 583
44. Klosinska, MM, Crutchfield CA, Bradley PH, Rabinowitz JD, Broach JR. 2011. Yeast 584
cells can access distinct quiescent states. Genes Dev. 25:336‑349. 585
on May 15, 2018 by guest
http://aem.asm
.org/D
ownloaded from

19
45. Noguchi C, Watanabe D, Zhou Y, Akao T, Shimoi H. 2012. Association of constitutive 586
hyperphosphorylation of Hsf1p with a defective ethanol stress response in Saccharomyces 587
cerevisiae sake yeast strains. Appl. Environ. Microbiol. 78:385‑392. 588
46. Watanabe D, Wu H, Noguchi C, Zhou Y, Akao T, Shimoi H. 2011. Enhancement of the 589
initial rate of ethanol fermentation due to dysfunction of yeast stress response components 590
Msn2p and/or Msn4p. Appl. Environ. Microbiol. 77:934‑941. 591
592
593
Figures legends and supplemental material legend 594
Figure 1: Comparison of nitrogen requirements of 8 wine yeast strains. The measure is 595
expressed in mg nitrogen g-1 CO2 based on the amount of nitrogen necessary to support a 596
constant fermentation rate between 10 and 50 g L -1 CO2 (P10-50). LNR: strains with low 597
nitrogen requirements; HNR: strains with high nitrogen requirements. Reproducibility of 598
this technique was tested for two strains (L2868 and MTF1782) and variations are 599
indicated on the graph with error bars. 600
Figure 2: Fermentation profiles of eight different wine yeast strains with contrasted 601
nitrogen requirement in a nitrogen limited medium (SM100). 602
Figure 3: Principal component analysis (PCA) of (A) kinetic traits (Tf: Total fermentation 603
duration; NQr: Quantified nitrogen requirement; Rmax: Maximun fermentation rate; R50: 604
Fermentation rate at 50% sugar consumption) and (B) individuals strains. The values were 605
obtained from fermentation profiles performed on SM100 at 24°C. 606
Figure 4: Effects of cycloheximide addition at 10 g L-1 h-1 of CO2 produced on the 607
fermentation in SM100. Comparison between a strain with low nitrogen requirement 608
(L2868) and a strain with high nitrogen requirement (MTF1782). 609
Figure 5: Analysis of transcriptomic data (mean of two repetitions): enrichment of gene 610
functions among strains with high nitrogen requirement (A) and strains with low nitrogen 611
requirement (B). The values correspond to the number of genes in the Funspec functional 612
category (Bonferroni correction and p-value 0.05). The p-values are indicated for each 613
category. 614
Figure 6: Cluster extracts of genes overexpressed in HNR strains. Cluster I is composed 615
by genes involved in proteome degradation. Cluster II is enriched in genes associate to 616
on May 15, 2018 by guest
http://aem.asm
.org/D
ownloaded from
20
ubiquitin protein degradation. Cluster III is composed by genes involved in storage of 617
reserve. Cluster IV is related to the autophagy pathway. 618
Figure 7: Analysis of transcriptomic data (mean of two repetitions): enrichment of gene 619
functions among genes positively correlated with the fermentation rate (R50). The values 620
correspond to the number of genes in the Funspec functional category (Bonferroni 621
correction and p-value 0.05). The p-values are indicated for each category. 622
Figure S1: Nitrogen requirement (NQr) of different yeast strains. The NQr was mesured 623
by constant fermentation rate method, by the amount of nitrogen necessary to regulate the 624
fermentation rate between 10-50g L-1 CO2 (P10-50) in mg nitrogen g-1 CO2. 625
Figure S2: Comparison between cell populations of yeasts strains with contrasted nitrogen 626
requirements, during fermentation on SM100. 627
Figure S3: Comparison between fermentation profiles of eight yeasts strains with 628
contrasted nitrogen requirements. Specific CO2 production rate according to time of 629
fermentation on SM425. 630
Figure S4: Comparison of physiological traits between strains with contrasted nitrogen 631
requirements. (A) Nitrogen content of the yeast cells at 50% fermentation progression on 632
SM100 (B) Protein content of the yeast cells at 50% fermentation progression on SM100 633
(C) Protein content of the yeast cells at 80% fermentation progression on SM100 (D) Dry 634
mass of the yeast calls at 50% fermentation progression on SM100 (E) Dry mass content 635
of yeast cells at 80% fermentation progression on MS100. ( ) Mean values for LNR 636
strains; (- - -) mean values for HNR strains. 637
Figure S5: Mesure of the rate of L-[35S] methionine incorporation in two strains (L2868 638
and MTF1782) with contrasted nitrogen requirements. The average compound to absolute 639
mean values (c.p.m) of three replicates with or without (control) cycloheximide treatment. 640
Figure S6: Global clustering analysis 641
Figure S7: Genes recently identified in EC1118 strain. Genes in grey are differentially 642
expressed in LNR and HNR strains. 643
644
645
646
647
648
649
on May 15, 2018 by guest
http://aem.asm
.org/D
ownloaded from

21
650
651
652
653
654
655
656
657
on May 15, 2018 by guest
http://aem.asm
.org/D
ownloaded from
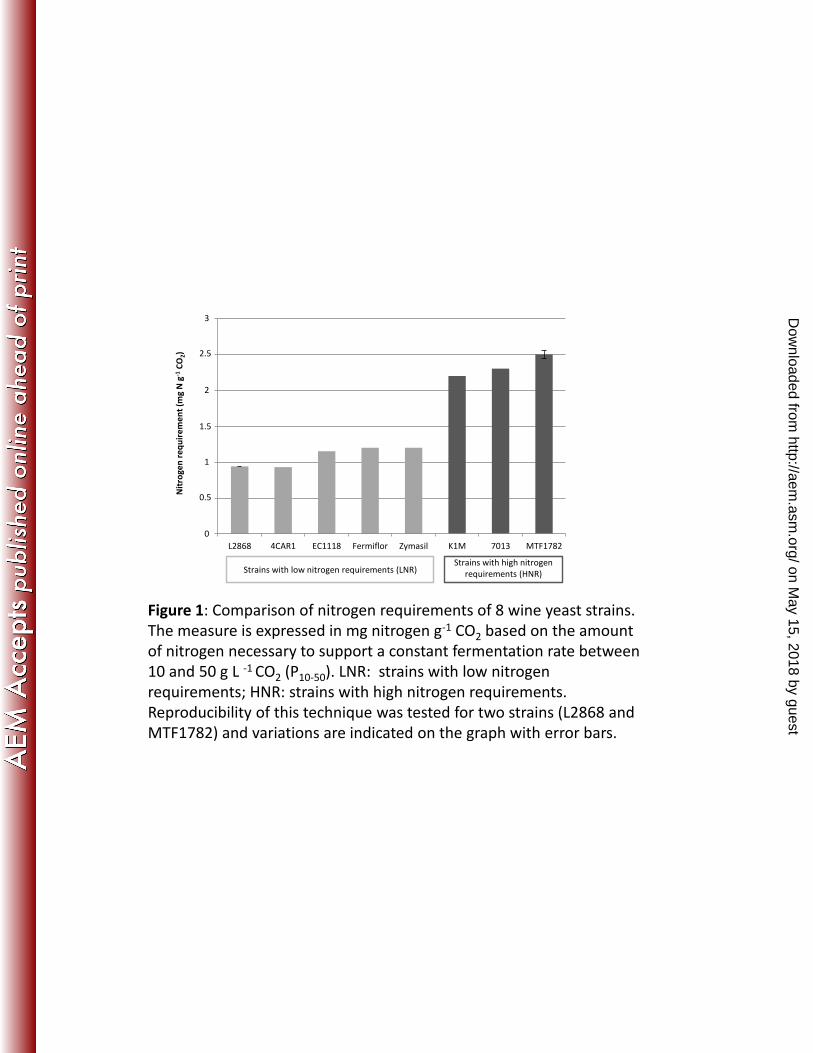
Figure 1: Comparison of nitrogen requirements of 8 wine yeast strains. The measure is expressed in mg nitrogen g-1 CO2 based on the amount of nitrogen necessary to support a constant fermentation rate between 10 and 50 g L -1 CO2 (P10-50). LNR: strains with low nitrogen requirements; HNR: strains with high nitrogen requirements. Reproducibility of this technique was tested for two strains (L2868 and MTF1782) and variations are indicated on the graph with error bars.
Strains with low nitrogen requirements (LNR) Strains with high nitrogen
requirements (HNR)
0
0,5
1
1,5
2
2,5
3
L2868 4CAR1 EC1118 Fermiflor Zymasil K1M 7013 MTF1782
Nit
roge
n r
eq
uir
em
en
t (m
g N
g-1
CO
2)
0.5
1.5
2.5
on May 15, 2018 by guest
http://aem.asm
.org/D
ownloaded from

Figure 2: Fermentation profiles of eight different wine yeast strains with contrasted nitrogen requirement in a nitrogen limited medium (SM100).
0
0,1
0,2
0,3
0,4
0,5
0,6
0,7
0 50 100 150 200 250 300 350 400
dC
O2
dt-1
(gL-1
h-1
)
Time (h)
L2868
4CAR1
EC1118
Fermiflor
Zymasil
K1M
7013
MTF1782
0.7
0.6
0.5
0.4
0.3
0.2
0.1
on May 15, 2018 by guest
http://aem.asm
.org/D
ownloaded from

Figure 3: Principal component analysis (PCA) of (A) kinetic traits (Tf: Total fermentation duration; NQr: Quantified nitrogen requirement; Rmax: Maximun fermentation rate; R50: Fermentation rate at 50% sugar consumption) and (B) individuals strains. The values were obtained from fermentation profiles performed on SM100 at 24°C.
A B
Tf
on May 15, 2018 by guest
http://aem.asm
.org/D
ownloaded from
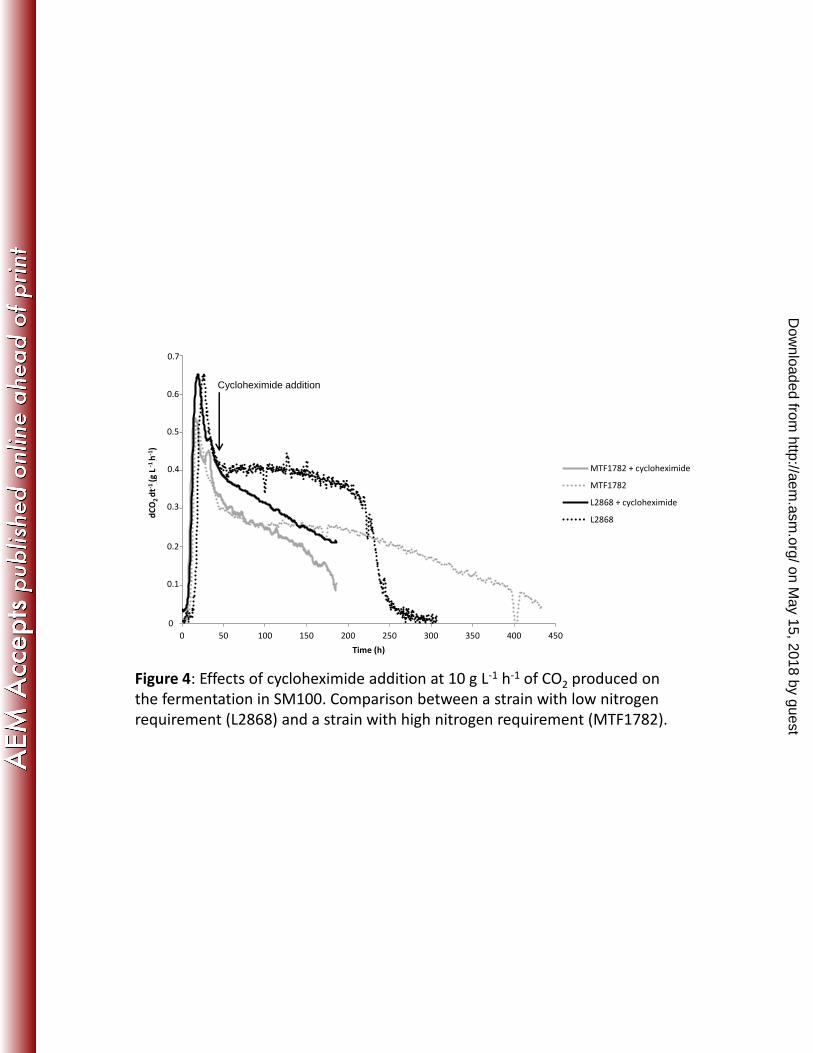
Figure 4: Effects of cycloheximide addition at 10 g L-1 h-1 of CO2 produced on the fermentation in SM100. Comparison between a strain with low nitrogen requirement (L2868) and a strain with high nitrogen requirement (MTF1782).
Cycloheximide added
0
0,1
0,2
0,3
0,4
0,5
0,6
0,7
0 50 100 150 200 250 300 350 400 450
dC
O2
/dt
(g/l
/h)
Time (h)
MTF1782 + cycloheximide
MTF1782
L2868 + cycloheximide
L2868
0.1
0.7
0.6
0.5
0.4
0.3
0.2
dC
O2 d
t-1 (g
L -
1 h
-1)
Cycloheximide addition
on May 15, 2018 by guest
http://aem.asm
.org/D
ownloaded from

0 10 20 30 40 50
oxidation-reduction process
response to stress
trehalose biosynthetic process
metabolic process
carbohydrate metabolic process
glycogen biosynthetic process
cellular response to oxidative stress
glucose metabolic process
0 10 20 30 40 50 60
ribosomal large subunit biogenesis
ribosome biogenesis
rRNA processing
maturation of 18S rRNA
endonucleolytic cleavage at A-prime
endonucleolytic cleavage at A1
endonucleolytic cleavage at A2
ribosomal large subunit assembly
ribosomal small subunit biogenesis
positive regulation of transcription from Pol I promoter
GMP biosynthetic process
maturation of 5.8S rRNA from tricistronic rRNA transcript
maturation of LSU-rRNA from tricistronic rRNA transcript
A
B
Figure 5: Analysis of transcriptomic data (mean of two repetitions): enrichment of gene functions among strains with high nitrogen requirement (A) and strains with low nitrogen requirement (B). The values correspond to the number of genes in the Funspec functional category (Bonferroni correction and p-value 0.05). The p-values are indicated for each category.
1.668e-08
5.079e-06
1.309e-05
2.894e-08
6.064e-12
1.668e-08
2.726e-07
5.84e-07
1.077e-06
1.061e-13
<1e-14
<1e-14
<1e-14
6.063e-06
3.471e-07
1.568e-07
3.648e-09
1.306e-10
5.165e-11
4.333e-10
1.088e-14
on May 15, 2018 by guest
http://aem.asm
.org/D
ownloaded from
Cluster I Cluster II Cluster III Cluster IV
Figure 6: Cluster extracts of genes overexpressed in HNR strains. Cluster I is composed by genes involved in proteome degradation. Cluster II is enriched in genes associate to ubiquitin protein degradation. Cluster III is composed by genes involved in storage of reserve. Cluster IV is related to the autophagy pathway.
Cluster I Cluster III
on May 15, 2018 by guest
http://aem.asm
.org/D
ownloaded from

Figure 7: Analysis of transcriptomic data (mean of two repetitions): enrichment of gene functions among genes positively correlated with the fermentation rate (R50). The values correspond to the number of genes in the Funspec functional category (Bonferroni correction and p-value 0.05). The p-values are indicated for each category.
0 5 10 15 20 25 30
ribosome biogenesis
rRNA processing
ribosomal large subunit biogenesis
maturation of 18S rRNA
ribosomal large subunit export from cell nucleus
5.723e-11
<1e-14
3.804e-06
1.997e-06
<1e-14
on May 15, 2018 by guest
http://aem.asm
.org/D
ownloaded from

Table 1: Saccharomyces cerevisiae strains used in this study.
Strain Origin
L2868 IFV
4CAR1 IFV
Fermiflor BNIC
Zymasil BNIC
MTF1782 Wine isolate
K1M Lallemand SA
7013 BNIC
EC1118 Lallemand SA
on May 15, 2018 by guest
http://aem.asm
.org/D
ownloaded from