Assessing the Local Economic Impacts of Draft Basin Plan ...
30
Arche Consulting T + 61 0421 274076 32/88 Phillip St Sydney NSW 2000 www.arche.com.au ABN 35 131 934 337 ASSESSING THE LOCAL ECONOMIC IMPACTS OF THE DRAFT BASIN PLAN OUTCOMES REPORT Prepared For Prepared by in association with Gillespie Economics November 2011
Transcript of Assessing the Local Economic Impacts of Draft Basin Plan ...

Arche Consulting T + 61 0421 274076
32/88 Phillip St Sydney NSW 2000
www.arche.com.au
ABN 35 131 934 337
ASSESSING THE LOCAL ECONOMIC IMPACTS OF THE DRAFT BASIN PLAN
OUTCOMES REPORT
Prepared For
Prepared by
in association with
Gillespie Economics
November 2011
Page i
ASSESSING THE LOCAL ECONOMIC IMPACTS OF THE DRAFT BASIN PLAN
OUTCOMES REPORT
Company: Arche Consulting Pty Ltd ABN 35 131 934 337
Contact Person: John Madden
Address: GPO Box 1320 Sydney NSW 2001
Telephone Number: 0421 274 076
E-mail address: [email protected]
Web www.arche.com.au
Page ii
© Copyright Commonwealth of Australia 2011.
This work is copyright. With the exception of the photographs, any logo or emblem, and any trademarks, the work may be stored, retrieved and reproduced in whole or in part, provided that it is not sold or used for commercial benefit. Any reproduction of information from this work must acknowledge the Murray–Darling Basin Authority, the Commonwealth of Australia or the relevant third party, as appropriate, as the owner of copyright in any selected material or information. Apart from any use permitted under the Copyright Act 1968 (Cth) or above, no part of this work may be reproduced by any process without prior written permission from the Commonwealth. Requests and inquiries concerning reproduction and rights should be addressed to the MDBA Copyright Administration, Murray-Darling Basin Authority, GPO Box 1801, Canberra ACT 2601 or by contacting + 61 2 6279 0100.
Disclaimer
This document has been prepared for the Murray-Darling Basin Authority and is made available for general use and to assist public knowledge and discussion regarding the integrated and sustainable management of the Basin’s natural water resources. The opinions, comments and analysis (including those of third parties) expressed in this document are for information purposes only. This document does not indicate the Murray-Darling Basin Authority’s commitment to undertake or implement a particular course of action, and should not be relied upon in relation to any particular action or decision taken. Users should note that developments in Commonwealth policy, input from consultation and other circumstances may result in changes to the approaches set out in this document.

Page iii
TABLE OF CONTENTS
1 Context and purpose of this study ............................................................... 1
2 Approach to assessing impacts ................................................................... 2
2.1 Limitations ..................................................................................... 3
2.2 Key assumptions ............................................................................... 4
3 Summary of case study results & sensitivity ................................................... 7
3.1 Gross impact of Draft Basin Plan 2800 GL and water savings from infrastructure investment ............................................................................................. 7
3.2 Impacts accounting for buy back to date ................................................ 10
3.3 impacts and regional context .............................................................. 11
4 Conclusions ......................................................................................... 13
Appendix A – LGA maps ................................................................................ 15
Appendix B - Key assumptions ....................................................................... 23
Baseline ................................................................................................ 23
Estimating impacts of landuse change on agricultural labour ................................ 24
Acronyms and abbreviations .......................................................................... 26
TABLES
Table 1 Before Trade – 2,800 GL including infrastructure savings ........................... 8
Table 2 After Trade – 2800 GL including infrastructure savings .............................. 9
Table 3 Before Trade – 2800 GL including infrastructure savings less buybacks to date 10
Table 4 After Trade – 2800 GL including infrastructure savings less buybacks to date .. 11
Table 5 Total population – 5 year estimates .................................................... 12
Table 6 Baseline economic indicators by LGA .................................................. 23
Table 7 Estimated reduction in water use under baseline and SDL 2,800 GL with water savings investment and no trade ....................................................... 24
Table 8 Assumptions on employment in agricultural industries ............................. 24
Table 9 LGA total employment ................................................................... 25
Page 1
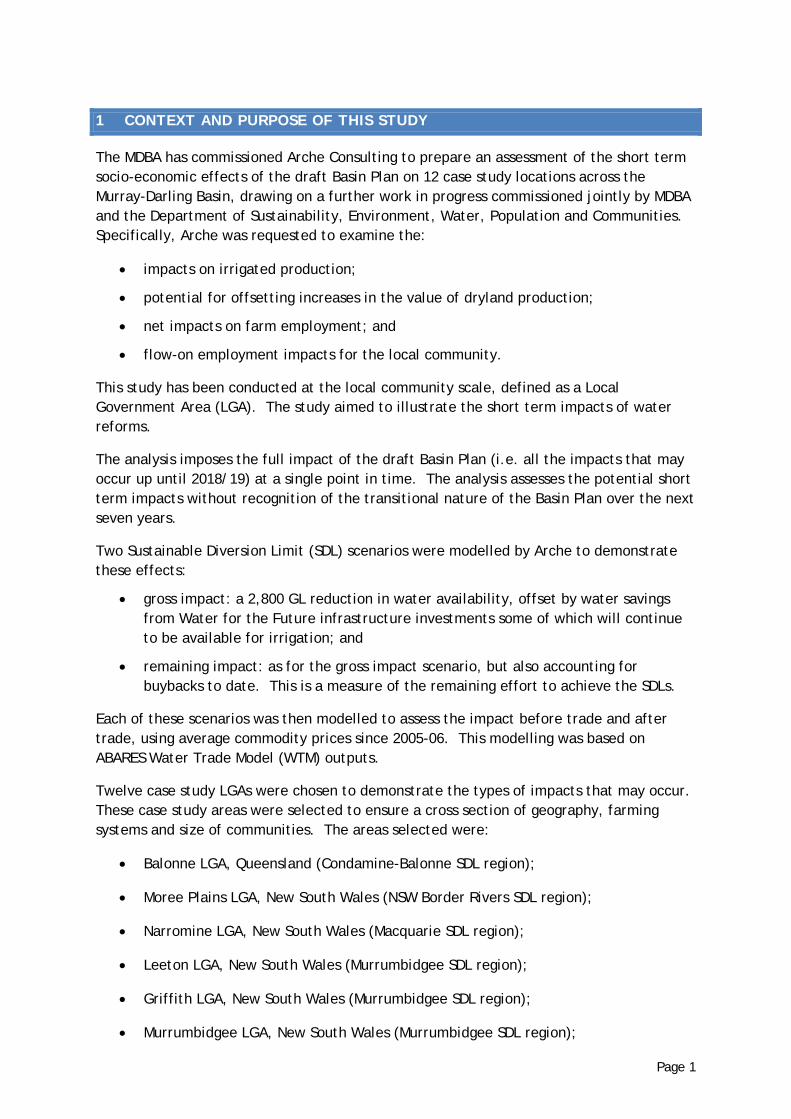
1 CONTEXT AND PURPOSE OF THIS STUDY
The MDBA has commissioned Arche Consulting to prepare an assessment of the short term socio-economic effects of the draft Basin Plan on 12 case study locations across the Murray-Darling Basin, drawing on a further work in progress commissioned jointly by MDBA and the Department of Sustainability, Environment, Water, Population and Communities. Specifically, Arche was requested to examine the:
impacts on irrigated production;
potential for offsetting increases in the value of dryland production;
net impacts on farm employment; and
flow-on employment impacts for the local community.
This study has been conducted at the local community scale, defined as a Local Government Area (LGA). The study aimed to illustrate the short term impacts of water reforms.
The analysis imposes the full impact of the draft Basin Plan (i.e. all the impacts that may occur up until 2018/19) at a single point in time. The analysis assesses the potential short term impacts without recognition of the transitional nature of the Basin Plan over the next seven years.
Two Sustainable Diversion Limit (SDL) scenarios were modelled by Arche to demonstrate these effects:
gross impact: a 2,800 GL reduction in water availability, offset by water savings from Water for the Future infrastructure investments some of which will continue to be available for irrigation; and
remaining impact: as for the gross impact scenario, but also accounting for buybacks to date. This is a measure of the remaining effort to achieve the SDLs.
Each of these scenarios was then modelled to assess the impact before trade and after trade, using average commodity prices since 2005-06. This modelling was based on ABARES Water Trade Model (WTM) outputs.
Twelve case study LGAs were chosen to demonstrate the types of impacts that may occur. These case study areas were selected to ensure a cross section of geography, farming systems and size of communities. The areas selected were:
Balonne LGA, Queensland (Condamine-Balonne SDL region);
Moree Plains LGA, New South Wales (NSW Border Rivers SDL region);
Narromine LGA, New South Wales (Macquarie SDL region);
Leeton LGA, New South Wales (Murrumbidgee SDL region);
Griffith LGA, New South Wales (Murrumbidgee SDL region);
Murrumbidgee LGA, New South Wales (Murrumbidgee SDL region);

Page 2
Murray / Deniliquin LGAs, New South Wales (NSW Murray SDL region);
Gannawarra LGA, Victoria (Victorian Murray SDL region);
Mildura LGA, Victoria (Victorian Murray SDL region);
Greater Shepparton LGA, Victoria (Goulburn-Broken SDL region);
Berri-Barmera LGA, South Australia (SA Murray SDL region); and
Murray Bridge LGA, South Australia (SA Murray SDL region).
Maps of the case study LGAs are provided in Appendix A.
This report represents the first stage of a more substantial piece of work, which is still in progress, commissioned by the Department of Sustainability, Environment, Water Population and Communities and the Murray Darling Basin Authority. The broader study aims to assess the socio-economic impacts of the Basin Plan and Water for the Future, in particular, the offsetting impacts of Water for the Future, by examining the potential impacts on 12 local communities1.
This study complements work by ABARES commissioned by the MDBA on ABARES on macroeconomic modelling of the Basin Plan and Water for the Future2. The LGA scale analysis in this project draws on information from ABARES models to determine the baseline water use.
2 APPROACH TO ASSESSING IMPACTS
To assess the impact of an action or a policy it is necessary to assess it with respect to a baseline. The baseline aims to reflect a future without the action or policy intervention. Each scenario can then be tested against this baseline, to estimate the impact of the change. The assessment of impacts requires:
specification of irrigated agriculture for each LGA;
articulation of the likely government actions (SDL, investment in buyback and infrastructure);
identification of the types of irrigators that are likely to be affected by the change and the ways in which they might respond; and
identification of the secondary (or flow-on) effects that might arise.
Direct impacts are assessed by estimating the gross value of irrigated agriculture (GVIAP) and associated expenditure.
The flow-on effects of direct agricultural sector impacts on the local economy are assessed using multiplier analysis. These multipliers were based on input/output models that characterised the economic activity of each LGA. Models were developed for each
1 Arche Consulting 2011, Assessing the Socio-Economic Impacts of Sustainable Diversion Limits and Water for the Future Investments: An Assessment of The Short-Term Impacts at a Local Scale, unpublished. 2 ABARES 2011, Modelling the economic effects of the Murray–Darling Basin Plan, ABARES report to client prepared for Murray–Darling Basin Authority, Canberra, November.
Page 3
case study LGA based on the impacts of a scenario of 2,800 GL SDL, offset by Water for the Future savings through infrastructure investment remaining in production. For each LGA, multipliers were estimated for each industry affected, based on enterprise expenditure profiles. For this analysis, these were then used to calculate the indirect impacts of the scenarios examined. Given the similarity of the direct agricultural impact modelling under various scenarios the results using the multipler analysis remain consistent with those using a specific input output model.
2.1 LIMITATIONS
The assessment of the direct impacts in this study is based on gross margin budgets and the impact of a reduced regional enterprise profile. This approach to modelling direct impacts at an LGA level has limitations. The approach does not examine the number of irrigators affected by change, viability or any significant alteration in overhead costs.
Additionally, any downstream effects on the viability of associated processing activities are not captured. Assessment of viability of this type requires direct examination on a case by case basis, as it will vary by each LGA and a range of other circumstances.
The type of analysis used in this study enables an initial comparison across a range of diverse LGAs, by enabling common characterisation of impacts and their likely flow-on effects.
The economic structure of each LGA and multipliers (flow-on impacts) for each sector of the economy are used to estimate the employment impacts across the scenarios and sensitivity testing in this report. The model construction means that the analysis is static (fixed) and is representative of the local economy at a single point in time.
There are limitations to input/output and multiplier analysis. For example, potential regional impacts such as changes in demographics, a change in the viability of services (education, health, banking); town growth or decline; costs to local and state governments; changes in community identity, sense of place, quality of life; and psychological and health impacts are not assessed.
Furthermore, the approach provides only a short term analysis and does not cover the transition that is occurring, both now and in the future, in all economies in the Basin due to a range of other factors. These other factors may include exchange rates, commodity price changes and demographic changes due to an ageing population and the aggregation of smaller farm holdings.
The analysis conducted for this report does not take into account the offsetting stimulus effects from the Australian Government’s Water for the Future program. More broadly, the assessment does not examine the prospects for economic growth in an LGA or the on-going process of structural adjustment across sectors.
Page 4
2.2 KEY ASSUMPTIONS
A key challenge in this study is the availability of data at the appropriate (i.e. LGA) scale. To conduct the case study analysis, assumptions have been made by Arche Consulting to:
specify the baseline of the current level of water extraction, crop types and gross margins, and irrigated area;
define the policy scenario of SDLs and Water for the Future investment; and
estimate irrigator responses.
SPECIFYING THE BASELINE
For this study, a baseline for an LGA includes:
average annual water extracted for irrigation (ML);
area of land devoted to irrigated agriculture and crop mix (ha);
Gross Value of Irrigated Agriculture Production - GVIAP ($ per year); and
expenditures associated with irrigated agriculture ($ per year).
Baseline data on the average annual water extracted for irrigation and associated area of land devoted to irrigated enterprises at an LGA level is not available. To ensure compatibility with the ABARES modelling, the water extracted for irrigation in each LGA is assumed to be a proportion of the catchment baseline, in line with previous water use reported by ABS for 2005/063. This estimate has been adjusted where relevant data and knowledge is available, such as irrigation delivery company reports.
The area of irrigated agriculture was developed using publicly available estimates of crop areas and water usage in relevant areas. This is combined with the ABARES baseline irrigated water use and estimated crop water requirements to construct a typical annual crop profile for an LGA.
The baseline GVIAP and associated regional expenditure profiles is based on information sources including irrigated crop area statistics, commodity price information and locally developed gross margin budgets. Detailed assumptions on irrigated crop profiles are provided in Appendix B.
3 Irrigation volume applied (ML) sourced from sourced from ABS National Regional Profile, 2005 - 2009 (catalogue 1379.0.55.001).
Page 5
DEFINING THE POLICY SCENARIOS
The estimates required to specify the impacts of the policy scenarios at an LGA level include:
SDL impacts (reduction in ML available for irrigation); and
infrastructure investment profile (ML saved and available for irrigation).
Each WTM outcome provided by ABARES included a percentage reduction in water extraction for each SDL region. These percent reductions were then applied to the estimated usage in each case study LGA, to ensure compatibility with ABARES. The WTM result incorporates the effectiveness of these Australian Government investments in saving water. ABARES has incorporated water savings of approximately 695 GL, which is 7% of the baseline across the entire Basin. Arche has apportioned these to the LGA level in line with the share of catchment total water use. So if an LGA typically uses 40% of the total water within an SDL Region, it is assumed that this LGA will capture 40% of water savings investments.
ABARES models scenarios before trade and after trade. The before trade scenario is effectively the SDL reductions proposed by the MDBA for each region, with pro rata apportioning of the downstream component. This results in a relatively even reduction in surface water availability across catchments in percentage terms, particularly within the southern MDB. The after trade scenario uses information about demand for water and commodity prices to estimate where water trading might occur within the Basin, subject to hydrological constraints.
The after trade WTM results reporting in the Arche analysis reflect average prices received for various commodity in the period 2006–07 to 2011–12. In this period a number of commodities experienced a peak in prices, including, cereals (wheat), hay, and dairy. At the same time there was a significant decline in the grape price relative to that of other commodities.
As noted by ABARES ‘future trade flows remain subject to a range of uncertainties. In practice, trade flows will be determined by the relative profitability of different activities and will be influenced by changes in commodity prices, technologies, and capital investment patterns, as well as any changes to prevailing water trading rules’4.
ESTIMATING IRRIGATOR RESPONSES
To model the direct impacts of change in GVIAP and direct employment in agriculture, an estimation of aggregated responses across the irrigation sector is required. Arche has made assumptions relating to:
changes in enterprise mix (irrigated activity forgone and potential for transition to dryland enterprises); and
associated impacts of landuse change on agricultural labour.
4 ABARES 2011, Modelling the economic effects of the Murray–Darling Basin Plan, ABARES report to client prepared for Murray–Darling Basin Authority, Canberra, November. pg 27.
Page 6
In each of the case study LGAs, there are either one or two dominant enterprises. In most circumstances where an enterprise dominates the water use in a region, it is reasonable to use this enterprise to assess the impact of reductions on the area. In some LGAs crops that return a lower gross value per ML have been removed from the irrigated crop profile. In many cases these are minor components of a typical irrigated crop profile and their removal does not ‘cover’ all of the reduction in water availability. Selection of which crops will not be irrigated is not simple or certain. Other factors including agronomic and social considerations will influence the change in cropping profiles, as water is one of many inputs in irrigated farming systems5.
For this assessment, it is assumed that where possible, land that was previously irrigated will be used for dryland production in the long run. In most cases it is assumed that grazing is the most likely alternative dryland enterprise. There are two exceptions to this. In Moree, cereal cropping is assumed as the replacement enterprise. In the southern irrigated areas of the Berri-Barmera and Mildura LGAs, anecdotal information supports the assumption that horticulture blocks will remain vacant once water has been sold.
Irrigated enterprises have a higher intensity of labour per unit of land than substitute dryland enterprises. For each major irrigated cropping and replacement dryland enterprise, an estimate of the employees per 1,000 hectares of irrigated land has been made. These estimates are reported in Appendix B.
5 Given the existence of contestable water markets in the Murray-Darling Basin, the notion that water resources are irrationally allocated to low value enterprises should be treated with caution. Net returns adjusted for market risk, existence of sunk capital, production uncertainty and so on should move towards equilibrium over time.

Page 7
3 SUMMARY OF CASE STUDY RESULTS & SENSITIVITY
The following section provides a summary of estimated impacts across the case study areas, after water recovery through the buyback and infrastructure investment for each of the following scenarios:
gross impact: a 2,800 GL reduction in water availability, offset by Water for the Future savings through infrastructure investment some of which will continue to be available for irrigation; and
remaining impact: as for the gross impact scenario but accounting for buybacks to date – this is a measure of the remaining effort to achieve the SDLs.
The decrease in GVIAP is reported against the typical GVIAP that is generated with current water use and associated irrigated crop profile. The net decrease in direct farm employment includes the offsetting impacts of employment from dryland agricultural enterprises. In most case this positive offset is minor, in some cases zero.
The final estimate of direct and indirect employment is estimated using employment multipliers that are specific to each LGA.
3.1 GROSS IMPACT OF DRAFT BASIN PLAN 2800 GL AND WATER SAVINGS FROM INFRASTRUCTURE INVESTMENT
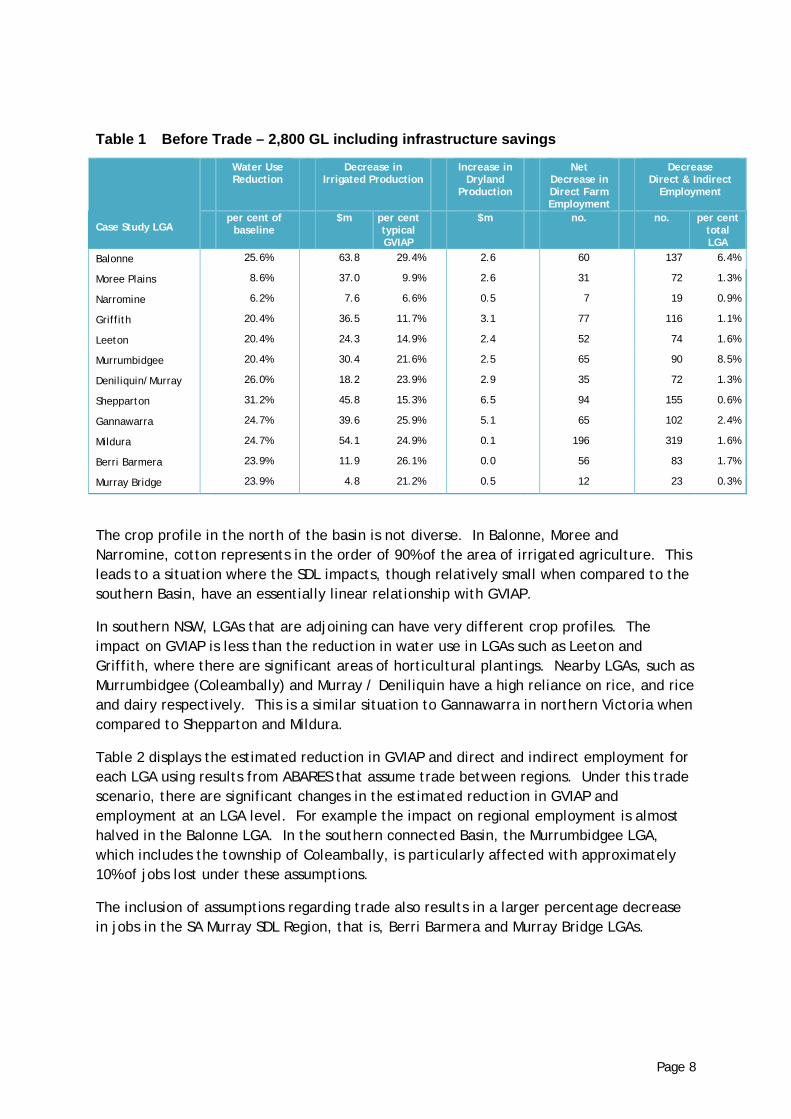
Table 1 displays the estimated reduction in GVIAP and direct and indirect employment for each LGA. Under the gross impact scenario, the reduction in GVIAP is similar to the percentage in reduction in water use, unless an LGA has a diverse cropping mix where one enterprise has a lower gross value per ML than others. This is in contrast to the ABARES macroeconomic modelling where, in aggregate across the Basin, a 19% reduction in water available for irrigation is estimated to result in a 9% reduction in GVIAP.
This difference in the initial impacts is a result of the reduced scope to remove various crops out of the irrigated crop profile when looking at a smaller (LGA) scale versus an entire region in the ABARES modelling. When examining an LGA, the area of lower gross value crops, on a per ML basis, is often minor. If this is the case, a reduction in water for extraction cannot be fully met by the reducing the area devoted to one crop. Thus, areas of higher value irrigated enterprises such as winegrapes and citrus also experience significant reductions using the Arche approach.
Page 8
Table 1 Before Trade – 2,800 GL including infrastructure savings
Case Study LGA
Water Use Reduction
Decrease in Irrigated Production
Increase in Dryland
Production
Net Decrease in Direct Farm Employment
Decrease Direct & Indirect
Employment
per cent of
baseline $m per cent
typical GVIAP
$m no. no. per cent total LGA
Balonne 25.6% 63.8 29.4% 2.6 60 137 6.4%
Moree Plains 8.6% 37.0 9.9% 2.6 31 72 1.3%
Narromine 6.2% 7.6 6.6% 0.5 7 19 0.9%
Griffith 20.4% 36.5 11.7% 3.1 77 116 1.1%
Leeton 20.4% 24.3 14.9% 2.4 52 74 1.6%
Murrumbidgee 20.4% 30.4 21.6% 2.5 65 90 8.5%
Deniliquin/Murray 26.0% 18.2 23.9% 2.9 35 72 1.3%
Shepparton 31.2% 45.8 15.3% 6.5 94 155 0.6%
Gannawarra 24.7% 39.6 25.9% 5.1 65 102 2.4%
Mildura 24.7% 54.1 24.9% 0.1 196 319 1.6%
Berri Barmera 23.9% 11.9 26.1% 0.0 56 83 1.7%
Murray Bridge 23.9% 4.8 21.2% 0.5 12 23 0.3%
The crop profile in the north of the basin is not diverse. In Balonne, Moree and Narromine, cotton represents in the order of 90% of the area of irrigated agriculture. This leads to a situation where the SDL impacts, though relatively small when compared to the southern Basin, have an essentially linear relationship with GVIAP.
In southern NSW, LGAs that are adjoining can have very different crop profiles. The impact on GVIAP is less than the reduction in water use in LGAs such as Leeton and Griffith, where there are significant areas of horticultural plantings. Nearby LGAs, such as Murrumbidgee (Coleambally) and Murray / Deniliquin have a high reliance on rice, and rice and dairy respectively. This is a similar situation to Gannawarra in northern Victoria when compared to Shepparton and Mildura.
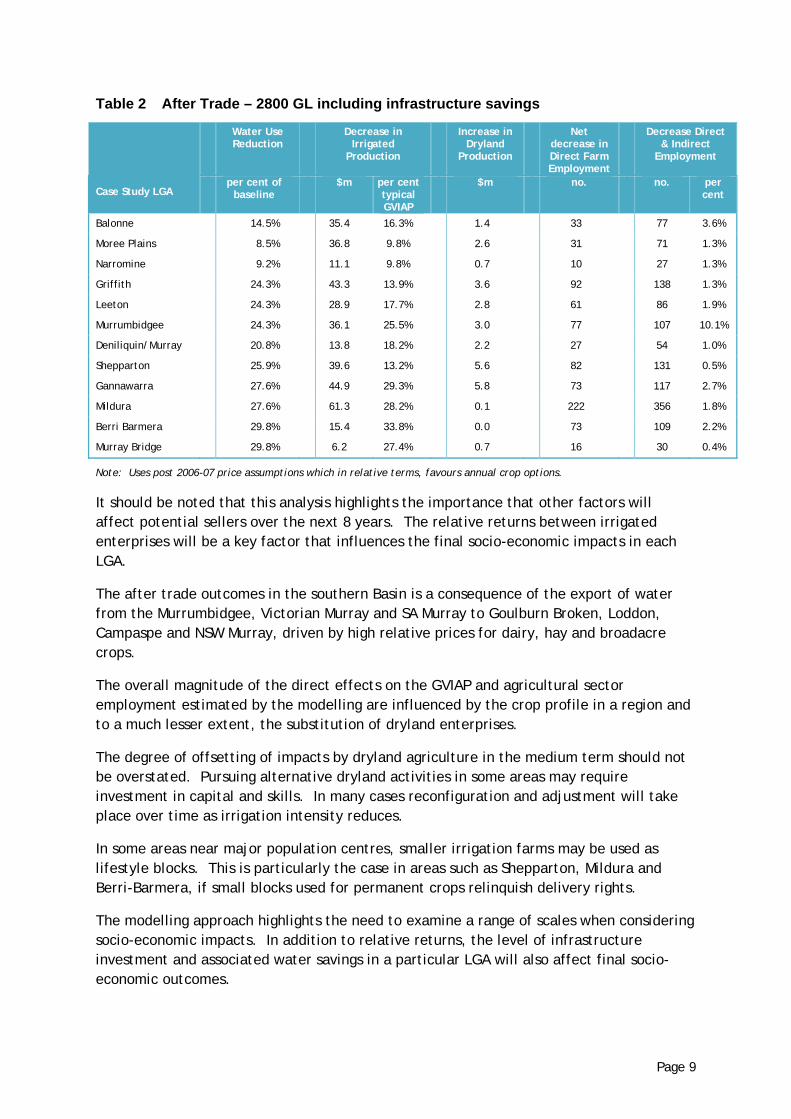
Table 2 displays the estimated reduction in GVIAP and direct and indirect employment for each LGA using results from ABARES that assume trade between regions. Under this trade scenario, there are significant changes in the estimated reduction in GVIAP and employment at an LGA level. For example the impact on regional employment is almost halved in the Balonne LGA. In the southern connected Basin, the Murrumbidgee LGA, which includes the township of Coleambally, is particularly affected with approximately 10% of jobs lost under these assumptions.
The inclusion of assumptions regarding trade also results in a larger percentage decrease in jobs in the SA Murray SDL Region, that is, Berri Barmera and Murray Bridge LGAs.
Page 9
Table 2 After Trade – 2800 GL including infrastructure savings
Case Study LGA
Water Use Reduction
Decrease in Irrigated
Production
Increase in Dryland
Production
Net decrease in Direct Farm Employment
Decrease Direct & Indirect
Employment
per cent of
baseline $m per cent
typical GVIAP
$m no. no. per cent
Balonne 14.5% 35.4 16.3% 1.4 33 77 3.6%
Moree Plains 8.5% 36.8 9.8% 2.6 31 71 1.3%
Narromine 9.2% 11.1 9.8% 0.7 10 27 1.3%
Griffith 24.3% 43.3 13.9% 3.6 92 138 1.3%
Leeton 24.3% 28.9 17.7% 2.8 61 86 1.9%
Murrumbidgee 24.3% 36.1 25.5% 3.0 77 107 10.1%
Deniliquin/Murray 20.8% 13.8 18.2% 2.2 27 54 1.0%
Shepparton 25.9% 39.6 13.2% 5.6 82 131 0.5%
Gannawarra 27.6% 44.9 29.3% 5.8 73 117 2.7%
Mildura 27.6% 61.3 28.2% 0.1 222 356 1.8%
Berri Barmera 29.8% 15.4 33.8% 0.0 73 109 2.2%
Murray Bridge 29.8% 6.2 27.4% 0.7 16 30 0.4%
Note: Uses post 2006-07 price assumptions which in relative terms, favours annual crop options.
It should be noted that this analysis highlights the importance that other factors will affect potential sellers over the next 8 years. The relative returns between irrigated enterprises will be a key factor that influences the final socio-economic impacts in each LGA.
The after trade outcomes in the southern Basin is a consequence of the export of water from the Murrumbidgee, Victorian Murray and SA Murray to Goulburn Broken, Loddon, Campaspe and NSW Murray, driven by high relative prices for dairy, hay and broadacre crops.
The overall magnitude of the direct effects on the GVIAP and agricultural sector employment estimated by the modelling are influenced by the crop profile in a region and to a much lesser extent, the substitution of dryland enterprises.
The degree of offsetting of impacts by dryland agriculture in the medium term should not be overstated. Pursuing alternative dryland activities in some areas may require investment in capital and skills. In many cases reconfiguration and adjustment will take place over time as irrigation intensity reduces.
In some areas near major population centres, smaller irrigation farms may be used as lifestyle blocks. This is particularly the case in areas such as Shepparton, Mildura and Berri-Barmera, if small blocks used for permanent crops relinquish delivery rights.
The modelling approach highlights the need to examine a range of scales when considering socio-economic impacts. In addition to relative returns, the level of infrastructure investment and associated water savings in a particular LGA will also affect final socio-economic outcomes.
Page 10
3.2 IMPACTS ACCOUNTING FOR BUY BACK TO DATE
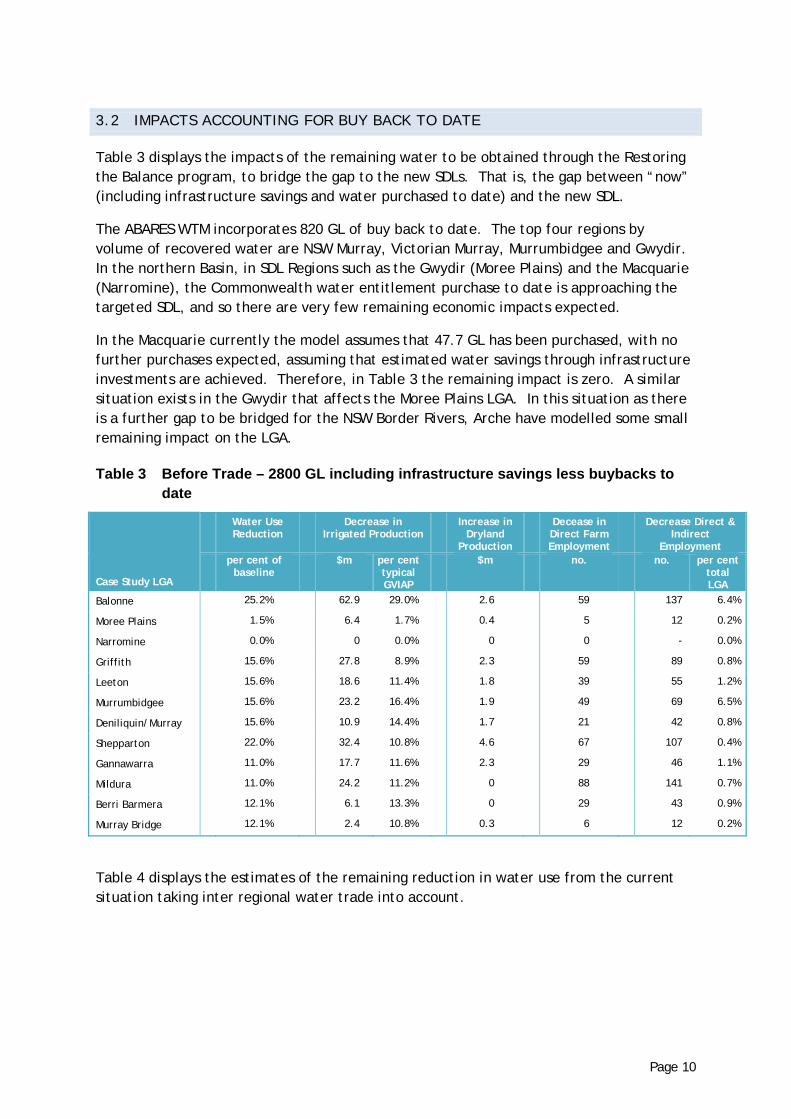
Table 3 displays the impacts of the remaining water to be obtained through the Restoring the Balance program, to bridge the gap to the new SDLs. That is, the gap between “now” (including infrastructure savings and water purchased to date) and the new SDL.
The ABARES WTM incorporates 820 GL of buy back to date. The top four regions by volume of recovered water are NSW Murray, Victorian Murray, Murrumbidgee and Gwydir. In the northern Basin, in SDL Regions such as the Gwydir (Moree Plains) and the Macquarie (Narromine), the Commonwealth water entitlement purchase to date is approaching the targeted SDL, and so there are very few remaining economic impacts expected.
In the Macquarie currently the model assumes that 47.7 GL has been purchased, with no further purchases expected, assuming that estimated water savings through infrastructure investments are achieved. Therefore, in Table 3 the remaining impact is zero. A similar situation exists in the Gwydir that affects the Moree Plains LGA. In this situation as there is a further gap to be bridged for the NSW Border Rivers, Arche have modelled some small remaining impact on the LGA.
Table 3 Before Trade – 2800 GL including infrastructure savings less buybacks to date
Case Study LGA
Water Use Reduction
Decrease in Irrigated Production
Increase in Dryland
Production
Decease in Direct Farm Employment
Decrease Direct & Indirect
Employment
per cent of
baseline $m per cent
typical GVIAP
$m no. no. per cent total LGA
Balonne 25.2% 62.9 29.0% 2.6 59 137 6.4%
Moree Plains 1.5% 6.4 1.7% 0.4 5 12 0.2%
Narromine 0.0% 0 0.0% 0 0 - 0.0%
Griffith 15.6% 27.8 8.9% 2.3 59 89 0.8%
Leeton 15.6% 18.6 11.4% 1.8 39 55 1.2%
Murrumbidgee 15.6% 23.2 16.4% 1.9 49 69 6.5%
Deniliquin/Murray 15.6% 10.9 14.4% 1.7 21 42 0.8%
Shepparton 22.0% 32.4 10.8% 4.6 67 107 0.4%
Gannawarra 11.0% 17.7 11.6% 2.3 29 46 1.1%
Mildura 11.0% 24.2 11.2% 0 88 141 0.7%
Berri Barmera 12.1% 6.1 13.3% 0 29 43 0.9%
Murray Bridge 12.1% 2.4 10.8% 0.3 6 12 0.2%
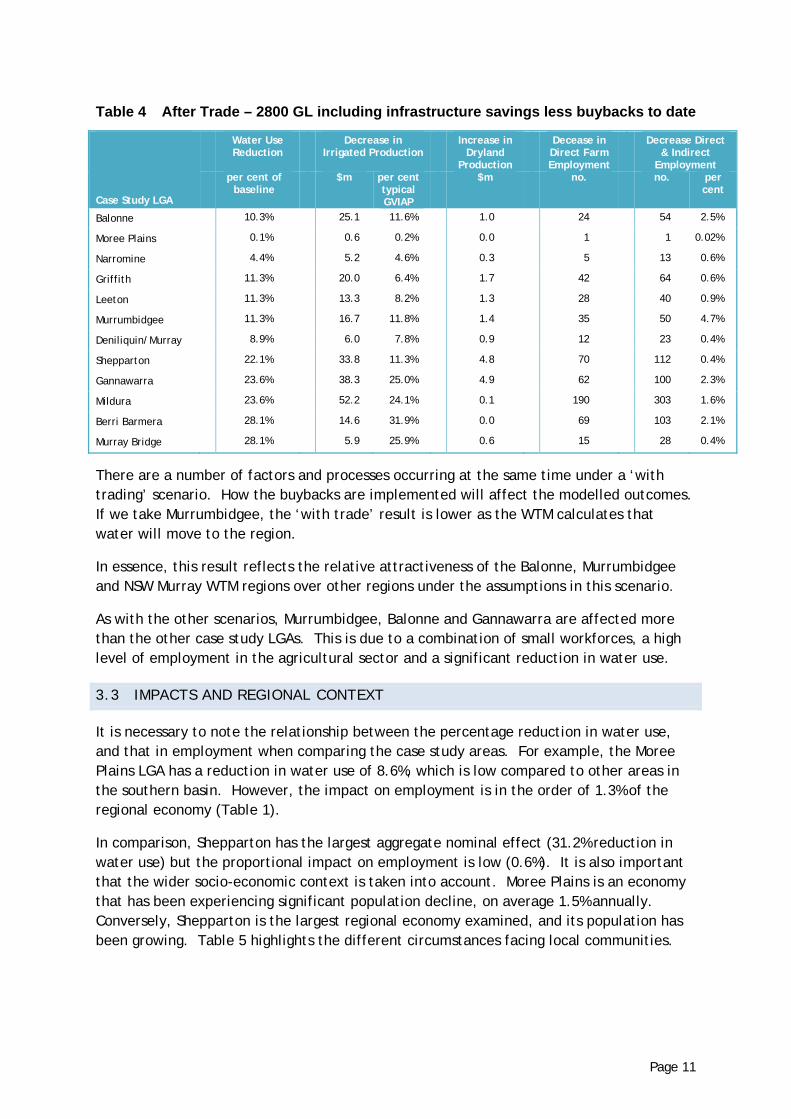
Table 4 displays the estimates of the remaining reduction in water use from the current situation taking inter regional water trade into account.
Page 11
Table 4 After Trade – 2800 GL including infrastructure savings less buybacks to date
Case Study LGA
Water Use Reduction
Decrease in Irrigated Production
Increase in Dryland
Production
Decease in Direct Farm Employment
Decrease Direct & Indirect
Employment
per cent of
baseline $m per cent
typical GVIAP
$m no. no. per cent
Balonne 10.3% 25.1 11.6% 1.0 24 54 2.5%
Moree Plains 0.1% 0.6 0.2% 0.0 1 1 0.02%
Narromine 4.4% 5.2 4.6% 0.3 5 13 0.6%
Griffith 11.3% 20.0 6.4% 1.7 42 64 0.6%
Leeton 11.3% 13.3 8.2% 1.3 28 40 0.9%
Murrumbidgee 11.3% 16.7 11.8% 1.4 35 50 4.7%
Deniliquin/Murray 8.9% 6.0 7.8% 0.9 12 23 0.4%
Shepparton 22.1% 33.8 11.3% 4.8 70 112 0.4%
Gannawarra 23.6% 38.3 25.0% 4.9 62 100 2.3%
Mildura 23.6% 52.2 24.1% 0.1 190 303 1.6%
Berri Barmera 28.1% 14.6 31.9% 0.0 69 103 2.1%
Murray Bridge 28.1% 5.9 25.9% 0.6 15 28 0.4%
There are a number of factors and processes occurring at the same time under a ‘with trading’ scenario. How the buybacks are implemented will affect the modelled outcomes. If we take Murrumbidgee, the ‘with trade’ result is lower as the WTM calculates that water will move to the region.
In essence, this result reflects the relative attractiveness of the Balonne, Murrumbidgee and NSW Murray WTM regions over other regions under the assumptions in this scenario.
As with the other scenarios, Murrumbidgee, Balonne and Gannawarra are affected more than the other case study LGAs. This is due to a combination of small workforces, a high level of employment in the agricultural sector and a significant reduction in water use.
3.3 IMPACTS AND REGIONAL CONTEXT
It is necessary to note the relationship between the percentage reduction in water use, and that in employment when comparing the case study areas. For example, the Moree Plains LGA has a reduction in water use of 8.6%, which is low compared to other areas in the southern basin. However, the impact on employment is in the order of 1.3% of the regional economy (Table 1).
In comparison, Shepparton has the largest aggregate nominal effect (31.2% reduction in water use) but the proportional impact on employment is low (0.6%). It is also important that the wider socio-economic context is taken into account. Moree Plains is an economy that has been experiencing significant population decline, on average 1.5% annually. Conversely, Shepparton is the largest regional economy examined, and its population has been growing. Table 5 highlights the different circumstances facing local communities.
Page 12
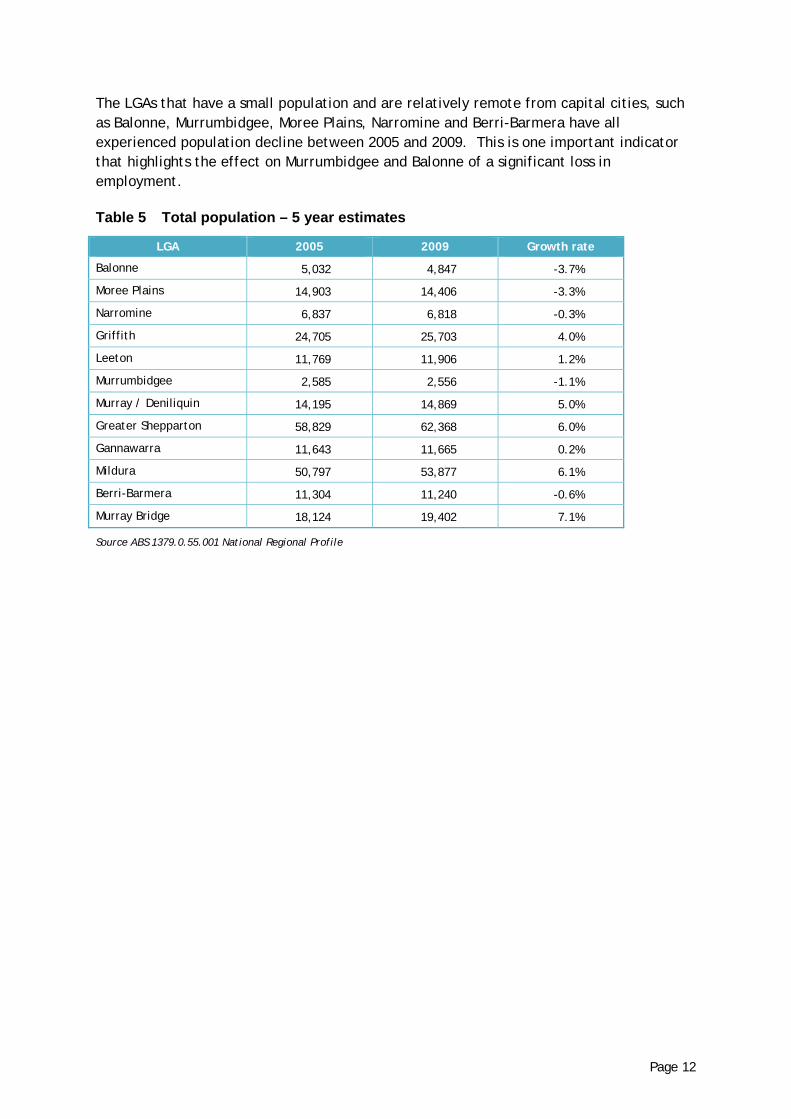
The LGAs that have a small population and are relatively remote from capital cities, such as Balonne, Murrumbidgee, Moree Plains, Narromine and Berri-Barmera have all experienced population decline between 2005 and 2009. This is one important indicator that highlights the effect on Murrumbidgee and Balonne of a significant loss in employment.
Table 5 Total population – 5 year estimates
LGA 2005 2009 Growth rate
Balonne 5,032 4,847 -3.7%
Moree Plains 14,903 14,406 -3.3%
Narromine 6,837 6,818 -0.3%
Griffith 24,705 25,703 4.0%
Leeton 11,769 11,906 1.2%
Murrumbidgee 2,585 2,556 -1.1%
Murray / Deniliquin 14,195 14,869 5.0%
Greater Shepparton 58,829 62,368 6.0%
Gannawarra 11,643 11,665 0.2%
Mildura 50,797 53,877 6.1%
Berri-Barmera 11,304 11,240 -0.6%
Murray Bridge 18,124 19,402 7.1%
Source ABS 1379.0.55.001 National Regional Profile
Page 13
4 CONCLUSIONS
There are a number of conclusions that can be drawn from this study.
LGAs within an SDL Region can be very different in terms of the crops that are grown and the structure of their economies. This study examines these differences using a structured framework to analyse irrigated agriculture in each LGA. This study has highlighted that the scale of analysis is important. Impact assessments conducted at a catchment or regional scale are necessary, however, they may hide pockets where there will be high level of reduction in GVIAP and employment will be relatively higher than other areas.
There are some LGAs that are highly dependent on agriculture, and any reduction in areas irrigated will have significant impacts on employment. When assumptions regarding water trading are included in the analysis, those LGAs examined in this study that will experience relatively larger impacts are Balonne, Murrumbidgee and Gannawarra6.
The extent of trade within ABARES’ WTM has a significant effect on economic outcomes. This illustrates the importance of relative returns to various commodities over the lifetime of the water reforms in determining where adjustment will take place. Inter-regional trade in the ABARES’ WTM is assumed to have a negative effect on Berri-Barmera and a positive effect on LGAs such as Leeton, Murrumbidgee and Griffith when compared to the no trade scenario. This is because the WTM incorporates price assumptions which in relative terms, favour broad-acre cropping (eg rice) over horticulture production. The final effects that occur will be dependent on other factors that drive relevant returns, as it will be these that influence an entitlement holder to become a “willing seller”.
Importantly, ABARES’ WTM only analyses trade between SDL Regions. It is likely that water trade will result in the outcomes presented above being significantly different in LGAs within a region. A comparison of Gannawarra and Mildura in the Victorian Murray SDL Region highlights this. ABARES’ modelling estimates that Gannawarra and Mildura will be subject to similar reductions in water use in percentage terms. These two LGAs have quite different cropping profiles. The relative performance of irrigated enterprises (along with other factors) will influence the volume of water able to be bought from ‘willing sellers’.
In practical terms, it is likely that the buyback may be more concentrated in areas within an SDL region, meaning that reductions in water use, and thus impact of the reforms, may be much higher in specific towns. As the buyback process to bridge the gap continues, these areas will become increasingly apparent.
There are a number of limitations to the analysis conducted in this study.
For example, the estimated impact on relative employment in Leeton is around 1.6%. This estimate does not take into account the potential effect on the changes on the processing sector. The modelled of reduction in GVIAP in Leeton is based on a reduction of 74,000 tonnes of rice production (32% of baseline levels). Any change in regional income and employment resulting from changes to processing are not included in the analysis. 6 Based on the analysis presented in Table 2.
Page 14
The degree to which dryland agriculture offsets the impacts of the reforms in the medium term should not be overstated. In many cases, as irrigation intensity reduced, reconfiguration and adjustment will take place over time. In some areas, pursuing alternative dryland activities may require investment in capital and skills.
In some areas near major population centres, smaller irrigation properties that sell entitlement and relinquish delivery rights may change use from agriculture to lifestyle blocks. This is particularly likely in areas such as Shepparton, Mildura and Berri-Barmera, and such a structural change will have long term effects on local economies.
When considering the regional impacts of water reforms, it is relevant to understand some of the trends that are occurring in regional economies in Australia. These include:
loss of significant industries such as abattoirs and timber mills from many rural areas;
increased mechanisation and innovation in agriculture industries resulting in the loss of employment opportunities in this sector (for example cotton industry over the past decade);
the need to remain globally competitive for most agricultural industries; and
the preference of Australians for coastal living, particularly for retirement.
The result of these and other factors is that there has been declining population growth in many statistical local areas that are located in non-coastal statistical subdivisions (ABS 3218.0). There has also been a decline in the population of smaller towns, even in regions that have been growing, with an increase in the population of regional centres, often at the expense of smaller towns.
It is important to take into account the wider socio-economic context of regions and towns when making policy decisions. It is also noted that there have been a number of socio-economic studies carried out at a range of scales and using a range of methods. This study has highlighted some of the data limitations associated with conducting impact analysis on a local scale. There are opportunities for information collection processes to be improved to support future decision making.
There is no one correct estimate of impact, and a range of factors will influence the actual socio-economic outcomes over time. However, an understanding of local economies and the common and different challenges they may face is important to consider when making policy decisions.
Finally, it is expected that incorporation of the effects of the Australian Government’s Water for the Future programs (buybacks and infrastructure) would reduce the impacts by providing addition revenue streams and economic stimulus for communities.

Page 15
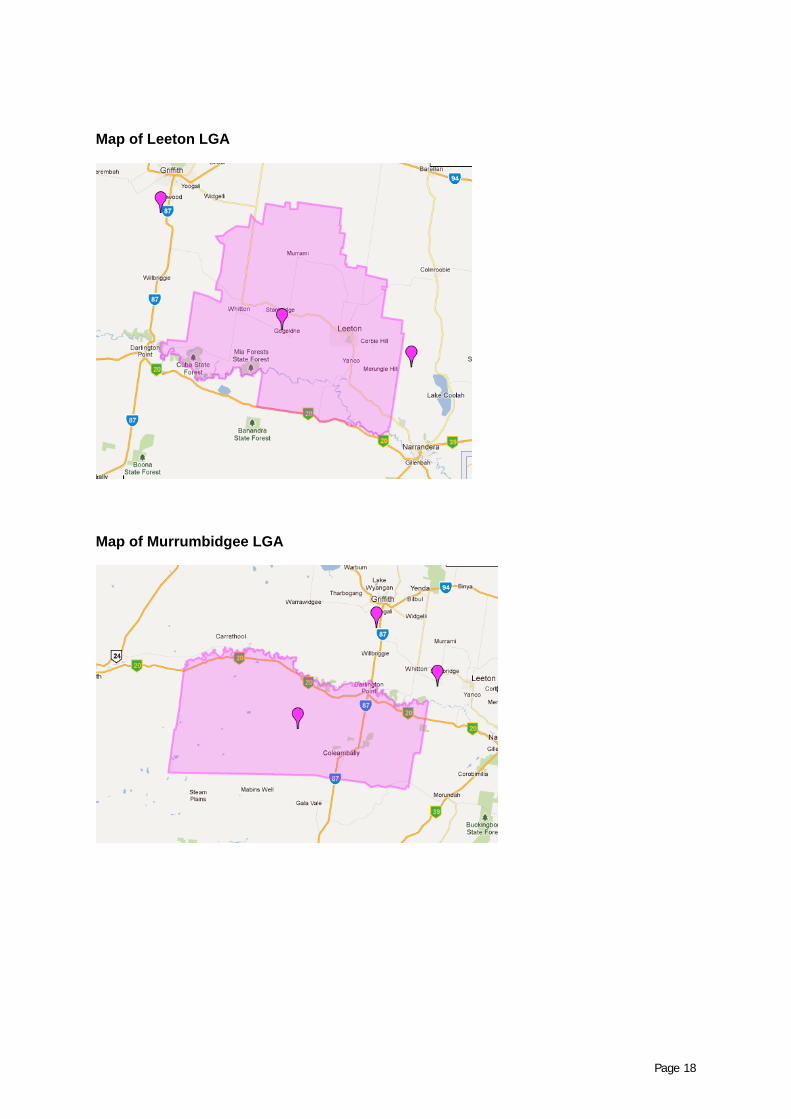
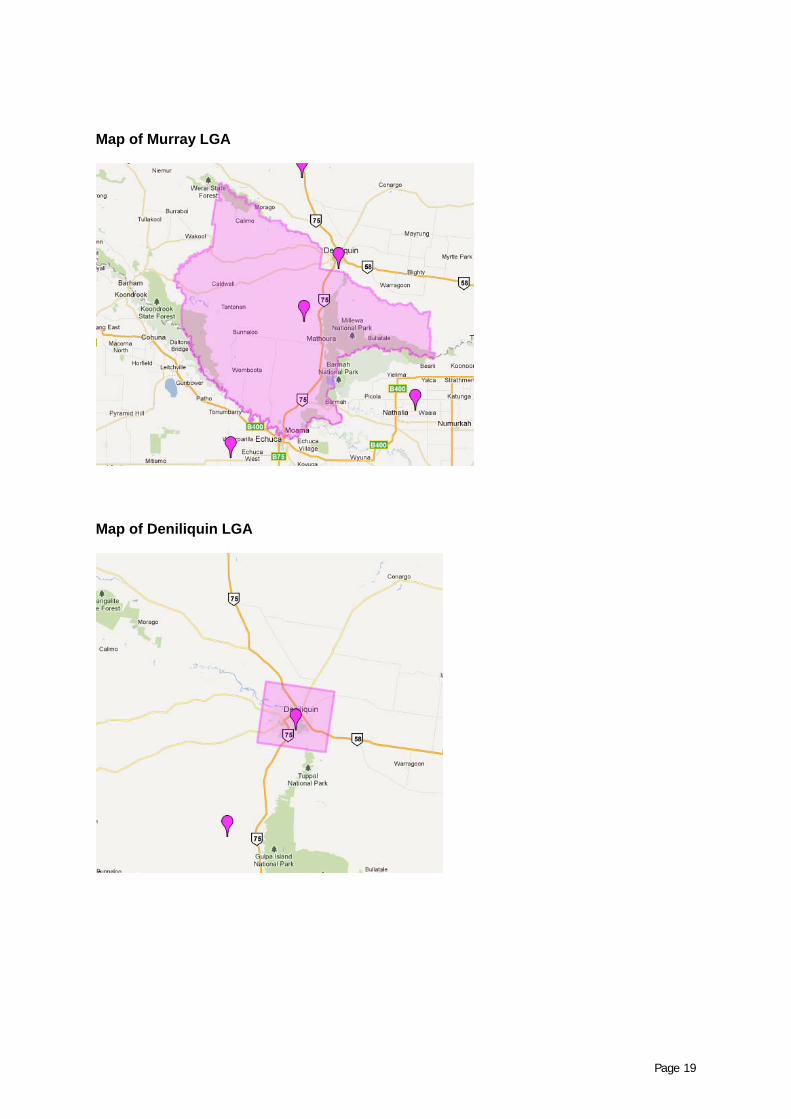
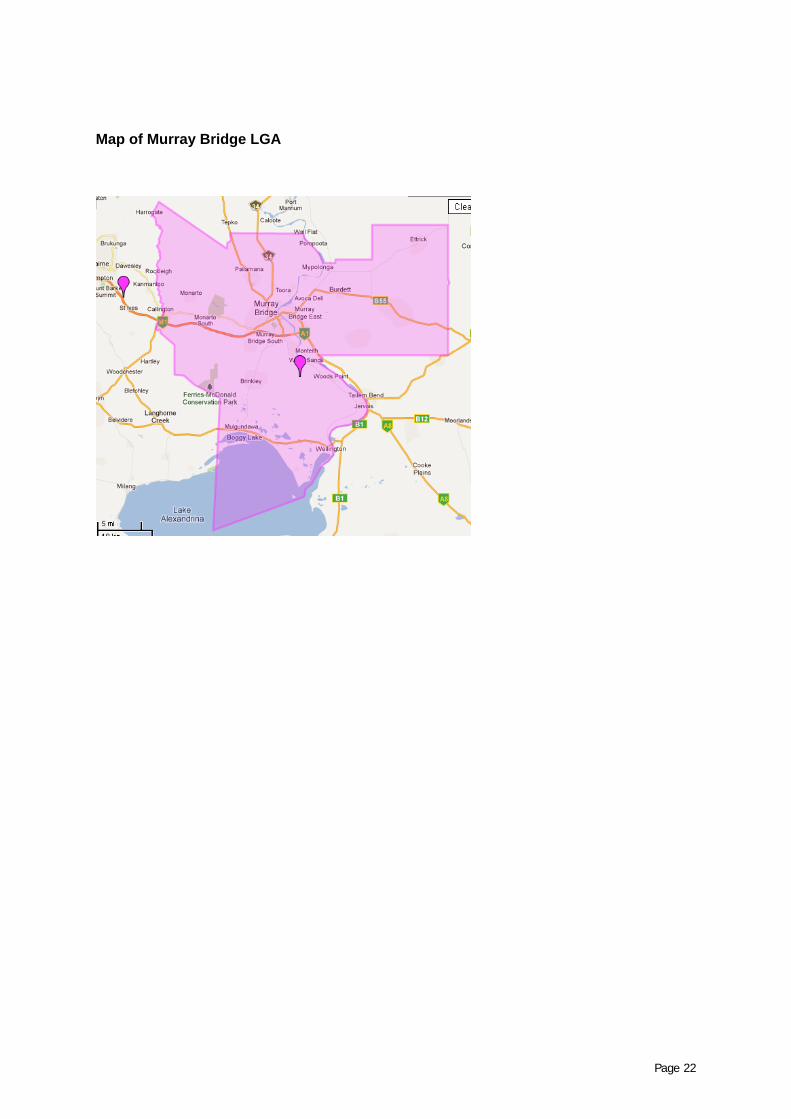
APPENDIX A – LGA MAPS
These maps are sourced from the ABS website.
Map of Balonne LGA
Map of Moree Plains LGA

Page 16

Page 17
Map of Narromine LGA
Map of Griffith LGA
Page 18
Map of Leeton LGA
Map of Murrumbidgee LGA
Page 19
Map of Murray LGA
Map of Deniliquin LGA

Page 20
Map of Greater Shepparton LGA
Map of Gannawarra LGA

Page 21
Map of Mildura LGA
Map of Berri Barmera LGA
Page 22
Map of Murray Bridge LGA

Page 23
APPENDIX B - KEY ASSUMPTIONS
BASELINE
Baseline data on the average annual water extracted for irrigation and associated area of land devoted to irrigated enterprises at an LGA level is not available.
ABS has publicly reported this information for the 2006 year based on the Agricultural Census in 2006. ABARES has developed a synthesised baseline for its WTM for each SDL region. The estimates of water available for agricultural production in a typical year have been developed using the ABARES baseline, ABS data to estimate a proportional share of regional diversions and available local information.
The area of irrigated agriculture is estimated by using publicly available estimates of crop areas and water usage in relevant areas. This is combined with the ABARES baseline irrigated water use and estimated water requirements to estimate a typical annual crop profile for an LGA.
Table 6 Baseline economic indicators by LGA
LGA Area of land devoted to irrigated
agriculture (ha)
Water extracted for irrigation
(ML/yr)
Baseline annual GVIAP ($ m)
Baseline expenditure profile ($)
Balonne 54,500 435,454 245.8 137.0
Moree Plains 81,800 738,360 375.0 207.8
Narromine 24,500 209,255 114.0 63.5
Griffith 70,000 677,036 311.6 170.5
Leeton 41,750 451,360 163.4 86.2
Murrumbidgee 55,500 564,197 141.2 67.7
Deniliquin / Murray 34,850 238,109 76.1 40.5
Gannawarra 61,700 377,168 153.3 101.4
Greater Shepparton 46,500 309,504 299.0 193.3
Mildura 26,550 212,157 217.2 104.4
Berri-Barmera 6,050 49,713 45.7 21.4
Murray Bridge 4,800 39,770 22.6 14.6
The irrigated crop profiles vary between case study areas. Balonne, Moree Plains and Narromine have a high reliance on cotton. Griffith and Leeton have a mix of rice and horticultural crops. Murrumbidgee and Murray/Deniliquin have a predominance of rice and in Murray some dairy production. Shepparton has a mix of permanent horticultural plantings and dairy production. Gannawarra has large areas of dairy in the southern part of the LGA and mixed cropping in the north. Mildura and Berri-Barmera have a high reliance on winegrapes, with limited areas of citrus and vegetables grown. In Murray Bridge dairy and vegetables and some small areas of winegrapes are grown.
Page 24
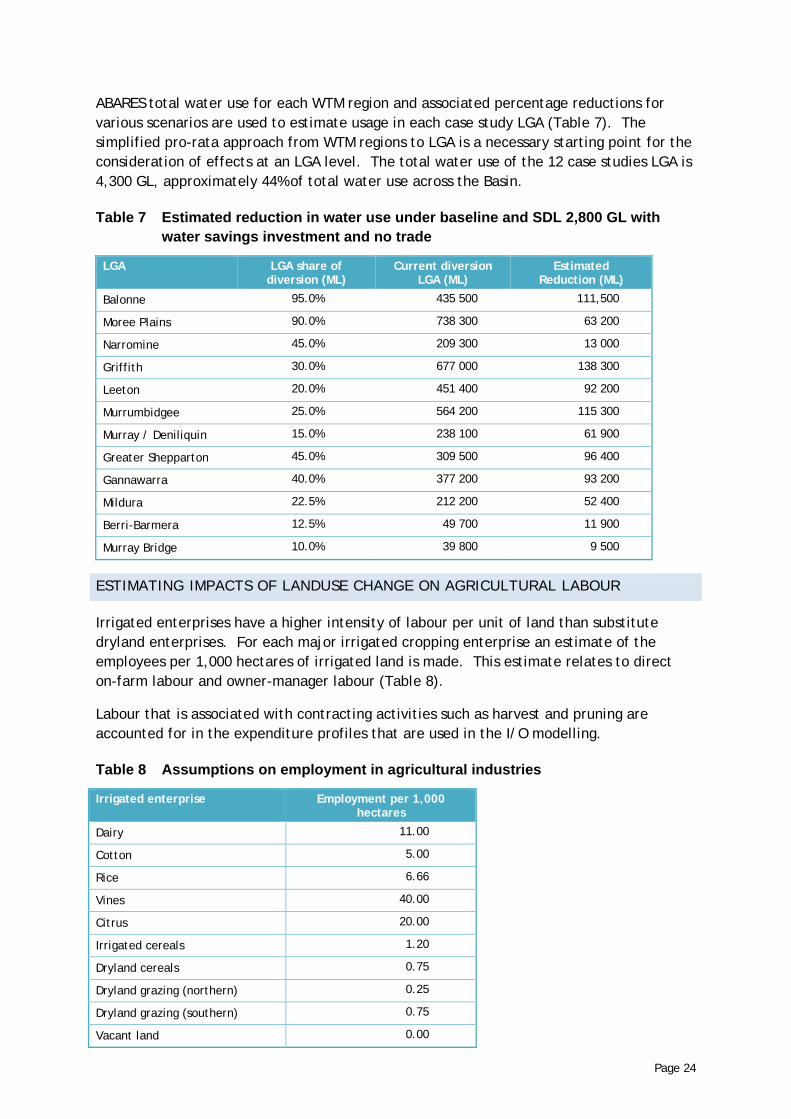
ABARES total water use for each WTM region and associated percentage reductions for various scenarios are used to estimate usage in each case study LGA (Table 7). The simplified pro-rata approach from WTM regions to LGA is a necessary starting point for the consideration of effects at an LGA level. The total water use of the 12 case studies LGA is 4,300 GL, approximately 44% of total water use across the Basin.
Table 7 Estimated reduction in water use under baseline and SDL 2,800 GL with water savings investment and no trade
LGA LGA share of diversion (ML)
Current diversion LGA (ML)
Estimated Reduction (ML)
Balonne 95.0% 435 500 111,500
Moree Plains 90.0% 738 300 63 200
Narromine 45.0% 209 300 13 000
Griffith 30.0% 677 000 138 300
Leeton 20.0% 451 400 92 200
Murrumbidgee 25.0% 564 200 115 300
Murray / Deniliquin 15.0% 238 100 61 900
Greater Shepparton 45.0% 309 500 96 400
Gannawarra 40.0% 377 200 93 200
Mildura 22.5% 212 200 52 400
Berri-Barmera 12.5% 49 700 11 900
Murray Bridge 10.0% 39 800 9 500
ESTIMATING IMPACTS OF LANDUSE CHANGE ON AGRICULTURAL LABOUR
Irrigated enterprises have a higher intensity of labour per unit of land than substitute dryland enterprises. For each major irrigated cropping enterprise an estimate of the employees per 1,000 hectares of irrigated land is made. This estimate relates to direct on-farm labour and owner-manager labour (Table 8).
Labour that is associated with contracting activities such as harvest and pruning are accounted for in the expenditure profiles that are used in the I/O modelling.
Table 8 Assumptions on employment in agricultural industries
Irrigated enterprise Employment per 1,000 hectares
Dairy 11.00
Cotton 5.00
Rice 6.66
Vines 40.00
Citrus 20.00
Irrigated cereals 1.20
Dryland cereals 0.75
Dryland grazing (northern) 0.25
Dryland grazing (southern) 0.75
Vacant land 0.00

Page 25
The estimates are based on a range of resources and estimates by Arche Consulting based on various financial surveys and ABS statistics.
Table 9 shows the total employment in each LGA that is derived from the construction of input outputs models using ABS data.
Table 9 LGA total employment
LGA Employment (no.)
Balonne 2,143
Moree Plains 5,676
Narromine 2,155
Griffith 10,512
Leeton 4,489
Murrumbidgee 1,063
Murray / Deniliquin 5,616
Greater Shepparton 25,160
Gannawarra 4,313
Mildura 19,414
Berri-Barmera 5,020
Murray Bridge 7,413
Total 92,974

Page 26
ACRONYMS AND ABBREVIATIONS
ABS Australian Bureau of Statistics ABARES Australian Bureau of Agricultural and Resource Economics and Sciences GL Gigalitres
GVIAP Gross Value of Irrigated Agricultural Production
ha Hectares
LGA Local Government Area
MDB Murray-Darling Basin
MDBA Murray-Darling Basin Authority
ML Megalitres
DSEWPaC Department of Sustainability, Environment, Water, Population and Communities
SDLs Sustainable Diversion Limits