Assessing the Impact of Digital Media on Student Achievement
39
Assessing the Impact of Digital Media on Student Achievement PBS LearningMedia | AASL 2015
Transcript of Assessing the Impact of Digital Media on Student Achievement

Assessing the Impact of Digital Media on Student Achievement
PBS LearningMedia | AASL 2015

John Sessler Tami Mount Sarah Knutson Morgan Nickolai
Guest Speakers

Part I Introduction to the 2014 PBS LearningMedia impact study
design & objectives Part II Examination of study results A Look Inside the Classroom with Sarah and Morgan Part III Audience Q&A
Today’s Discussion

A Look Inside PBS LearningMedia
Engaging Content includes videos, lesson
plans, interactive games, audio clips, essays, and discussion questions
Comprehensive Offers over 100,000 resources for
students in grades PreK-13+ Custom service offers additional
content, tools and analytics
Impact Standards aligned Research-based content
Presenter
Presentation Notes
Talking Points: PBS LearningMedia is engaging, comprehensive and impacts classrooms nationwide. PBS LearningMedia’s 87,000 resources span a range of types – from lesson plans to interactives – and are aligned to standards, including state standards for Custom Service users. In addition, PBS LearningMedia was recognized with 2 CodiE awards in 2013.

Additional Premium Resources
State Standards-based content alignment
Content management system (CMS)
User management tools
Enhanced analytics and reporting features
Free training and timely updates about news, content, and virtual events
PBS LearningMedia Custom
Presenter
Presentation Notes
These are the features that are available to users who access to PBS LearningMedia Custom

10,000 additional Premium resources with a focus on Early Childhood, STEM, Social Studies and Spanish Language
Custom Service: Premium Content
Early Childhood STEM Instruction Social Studies
Presenter
Presentation Notes
Talking Points: For those users who have the Custom Service, you have access to even more content, including 10,000 premium resources that cover a range of subject areas and grade levels from shows such as Super Why, Scientific American, and Nature. In addition, Premium content includes full episodes of popular PBS series, such as Ken Burns’ Civil War and The Roosevelts.

The Impact Study: Premise, Structure, Results

Study Design
Purpose: To understand PBS LearningMedia’s potential as a teaching and learning tool in the classroom
Approach: Sustained, purposeful, implementation of co-designed curriculum in optimal conditions over a 6- to 10-week period
Timeframe: 2014 – 2015 school year Data collection: Mixed methods approach using assessments,
surveys, instructional logs, classroom observations, and informal interviews
Data analysis: qualitative and quantitative approaches

Sample
2 states (New Jersey and California) 3 school districts 3 grade levels (6th, 7th, 8th) 4 schools 4 subject areas (science, social studies, math, English language
arts) 43 teachers (regular and special education) 36 classrooms 2,211 students

Research Questions
1. How does the use of these resources affect: 1) teachers’ classroom practices? 2) quality of instruction? 3) student learning?
2. How do educators use and implement resources from the service?

Perceived Impacts on Teachers’ Instructional Practices
38%
46%
62%
62%
31%
46%
46%
46%
46%
62%
77%
69%
90%
70%
50%
50%
90%
100%
55%
73%
82%
73%
82%
73%
0% 20% 40% 60% 80% 100%
I am creating more technology-basedassessments
I am more deliberate about what digitalmedia resources I use in my classroom
I feel more comfortable integrating digitalmedia into my lessons
My technology integration skills haveimproved
I am more likely to integrate digital mediainto my lessons
I spend less time lecturing during class
Percentage of Teachers who Agree or Strongly Agree
Science (N=11)
Social Studies (N=10)
Math (n=13)
ELA (N=13)

Perceived Impacts on Quality of Teachers’ Instruction
31%
31%
92%
54%
38%
85%
70%
80%
80%
73%
55%
100%
0% 20% 40% 60% 80% 100%
I am delivering more student-centeredlessons
I am delivering more lessons that includecollaborative activities
I have more resources to draw from
Percentage of Teachers who Agree or Strongly Agree
Science (N=11)
Social Studies (N=10)
Math (N=13)
ELA (N=13)
Over 50% of science and social studies students said that compared to last year, their classes were more interesting, more fun, and that they learned more.

Impact on Student Learning
On average, and across subject areas, students’ performance on content assessments increased by 8 percentage points over the course of the study.
Participating students outperformed national and state norms for the content assessments by an average of 10 and 11 percentage points at the end of the study, respectively.
More than half the students who participated in this study (56%) reported increases in the frequency with which they engaged in critical-thinking practices.

Student Assessment Scores
49%
48%
44%
48%
64%
63%
52%
49%
44%
30%
51%
56%
0% 20% 40% 60% 80% 100%
8th Grade ELA (N=210)†
7th Grade ELA (N=188)
6th Grade ELA (N=225)
Math (N=246)*
Social Studies (N=620)*
Science (N=731)*
Mean Percentage of Correct Responses
Pre-TestPost-Test
* Pre-test scores significantly different from post-test scores (p<0.001) † Pre-test scores significantly different from post-test scores (p<0.002)

Student Assessment Scores Compared to a National Comparison Group
Math Assessment Social Studies Assessment
64%
52%
57%
0% 20% 40% 60% 80% 100%
Study Sample Post-Test
Study Sample Pre-Test
National Comparison Group
Mean Percent Correct (13 items)
Social Studies Assessment National Comparison: Mean Percentage of
Items Answered Correctly
49%
25%
43%
0% 20% 40% 60% 80% 100%
Study Sample Post-Test
Study Sample Pre-Test
National Comparison Group
Mean Percentage (6 items)
Math Assessment National Comparison: Mean Percentage of
Items Answered Correctly

Student Assessment Scores Compared to a National Comparison Group
58%
47%
42%
0% 10% 20% 30% 40% 50% 60% 70% 80% 90% 100%
Study Sample Post-Test
Study Sample Pre-Test
National Norm
Mean Percent Correct (9 items)
Science Assessment National Comparison: Mean Percentage of Items Answered Correctly

Student Assessment Scores Compared to State Comparison Groups
Science Assessment Math Assessment
53%
25%
41%
0% 20% 40% 60% 80% 100%
Study Sample Post-Test
Study Sample Pre-Test
NJ Comparison Group
Mean Percentage (4 items)
Math Assessment NJ State Comparison: Mean Percentage of
Items Answered Correctly
64%
54%
37%
0% 20% 40% 60% 80% 100%
Study Sample Post-Test
Study Sample Pre-Test
NJ Comparison Group
Mean Percentage (5 items)
Science Assessment NJ State Comparison: Mean Percentage of
Items Answered Correctly

State Assessment Scores Compared to State Comparison Groups
59%
56%
50%
59%
55%
50%
62%
62%
62%
0% 20% 40% 60% 80% 100%
8th Grade (N=210)
7th Grade (N=188)
6th Grade (N=225)
Mean Percentage (4 items)
ELA Assessment State Comparison: Mean Percentage of Items Answered Correctly
CA State Comparison Group
Study Sample Pre-Test
Study Sample Post-Test

Student Scores on Critical Thinking Scale
73.65
76.31
73.31
71.35
75.37
71.78
71.58
69.84
72.57
73.97
0 20 40 60 80 100
8th Grade ELA (N=210)†
7th Grade ELA (N=188)*
6th Grade ELA (N=225)*
Math (N=249)
Science and Social Studies (N=733)*
Mean Score on 20 Items
Pre-Test
Post-Test
* Pre-test scores significantly different from post-test scores (p<0.001) † Pre-test scores significantly different from post-test scores (p=.008)

How can educators most effectively integrate PBS LearningMedia resources into their classroom?
Lessons Learned for Educators
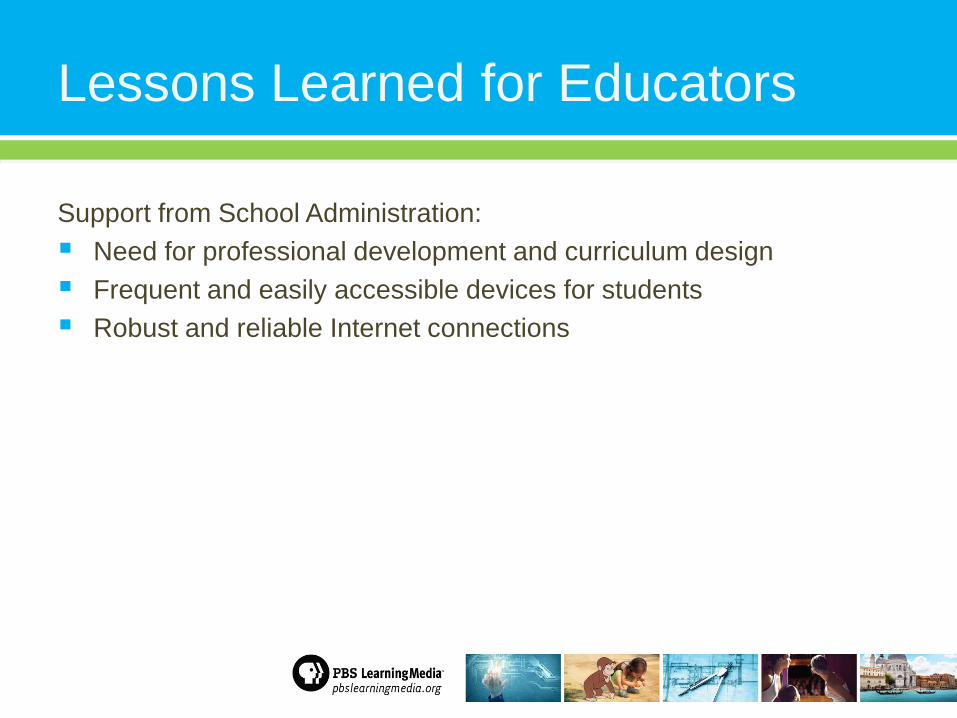
Lessons Learned for Educators
Support from School Administration: Need for professional development and curriculum design Frequent and easily accessible devices for students Robust and reliable Internet connections

MATH Approximating Square Roots of Nonperfect Squares (video 2:10) Square Roots (interactive) SOCIAL STUDIES Daily Life In Early Georgia (video 6:30) The Reasons for establishing the colony of Georgia (illustration)
SCIENCE The Periodic Table (interactive) The Atom (interactive)
ELA How to make a Popplet (video 7:52)
Lessons Learned for Educators: Integration of PBS LearningMedia
Resources with Impact
Presenter
Presentation Notes
In asurvey, teachers rated resources (1-5) according to: Usefulness of resource Perceived student attitudes towards the resource Contribution to instructional practices Contribution to student learning These resources are among the high scorers. MATH Teachers used small group instruction by placing activity stations around the room for students participate. Activities included video, working with manipulatives and interactive digital work during which they also took notes. in a number of differentiated learning. Here are some examples of content from LM that created a successful lessons on Square Roots and Irrational Numbers. HISTORY Comment from Students: “I liked the video representations because they show what it would be like to be living in that time period.” “Not only did I enjoy them, I learned an excessive amount from them.” ELA In the student research guide, this video on how to make a mind map with Popple stood out with 4 and 5 stars.

Implications for the Classroom: Inside Sarah’s Classroom

Inside Sarah’s Classroom
American Canyon Middle School English Language Arts Teacher for six years
Has designed district assessments and ELA
curriculum Tech-infused curriculum and instruction at our site
since 2012 Worked with a team of ELA teachers to create
curriculum around argumentative writing in Fall 2014
Implemented 6-8 week units across three grade
levels in Winter 2015
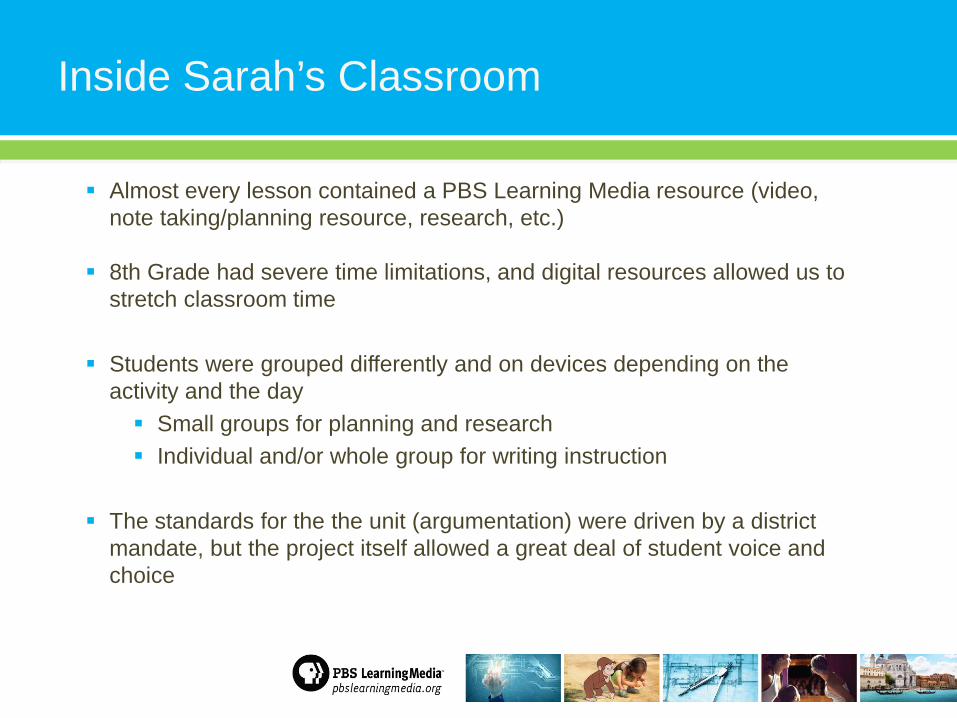
Almost every lesson contained a PBS Learning Media resource (video, note taking/planning resource, research, etc.)
8th Grade had severe time limitations, and digital resources allowed us to
stretch classroom time Students were grouped differently and on devices depending on the
activity and the day Small groups for planning and research Individual and/or whole group for writing instruction
The standards for the the unit (argumentation) were driven by a district
mandate, but the project itself allowed a great deal of student voice and choice
Inside Sarah’s Classroom
Benefits and Challenges
The lesson were planned, linked, and converted to Google Docs in advance of the project launch
Allowed for differentiation and reinforcement of concepts as well as
introduction of concepts Resources (workshops) were designed by and for us (both a benefit and a
challenge) Students accessed resources repeatedly and from home
Students were engaged in lessons because they were technology infused
and allowed for more than listening to the teacher’s voice

Benefits and Challenges
Occasional technology challenges such as wi-fi outages, slow netbook device
HUGE time crunch at one grade level
Challenges based on the relevance of resource (led to customized
resources, which is not always possible) Research-based resources were either irrelevant, outdated, or hard to find
The project still required a great deal of outside research and discussion
Interactive activities were not useful in a highly tech-oriented site

Impact on Student Learning
Students could take control of their own learning (access to resources as often as they needed)
Students were able to understand the writing process and apply that to
write better essays than in the past Students felt more confident about their writing
Student interest/engagement = better writing products

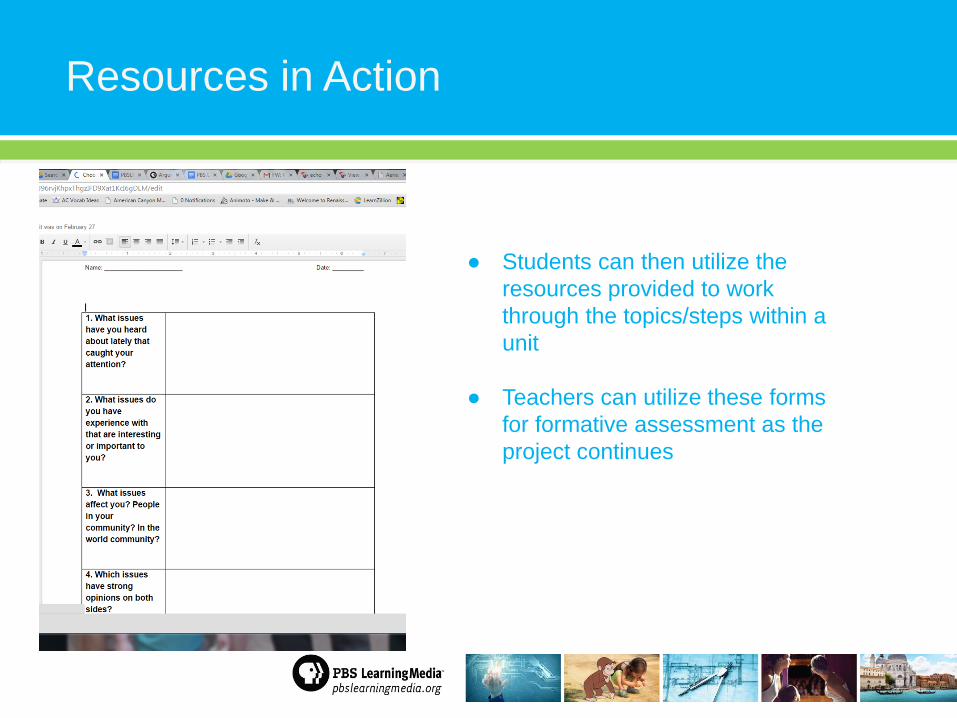
Resources in Action
● How-to videos also link to related videos to help with self-paced instruction
● Support materials include demo and blank worksheets that will help students use the information
Resources in Action
● Students can then utilize the resources provided to work through the topics/steps within a unit
● Teachers can utilize these forms
for formative assessment as the project continues

Have paper copies of handouts available as needed Preview the resources for relevancy to topic/grade level Have digital resources at the ready (workshops, etc.) that fit with
planned content After identifying student topics for research, know which topics are easily
found and which topics might need additional research Possibly consider offering students choice from a list of topics that have
readily found, reliable resources in the PBSLM library Explore the student resources in each video/resource and use as
guides/scaffolds for student work and/or for formative assessment
Tips for Classroom Use

Implications for the Classroom: Inside Morgan’s School

Reliability and credibility of resource and/or content provider Accessibility Quality and quantity of resources Engagement Cost
Criteria to Consider When Incorporating Digital Media into the Classroom

Pros Students are more engaged Ability to differentiate lessons more easily Collaborative features Increased accessibility to resources Less behavioral issues
Digital Media Pros and Cons

Cons Reliability of school’s technology infrastructure Access to devices Lack of technology knowledge Student boredom due to overexposure of same type of digital
content
Digital Media Pros and Cons

Engage with PBS LearningMedia
Virtual and Live Events
Email & Newsletter
Social Media • facebook.com/pbslearningmedia • twitter.com/PBSLrnMedia • plus.google.com/+PBSlearningmediaORG/ • pinterest.com/pbslm/ • youtube.com/pbslearningmedia
We engage and communicate with educators through:
Presenter
Presentation Notes
Talking Points: PBS LearningMedia provides ongoing professional development through virtual and live events. Look for more information in our newsletter and follow PBS LearningMedia on social media for news and updates.

Get Your Tech On with PBS
Digital Resources, Webinars and More! Visit getyourtechon2015.com to access tech- themed lesson plans, games, and videos, and sign up for PD webinars
Enter the Sweepstakes! Complete a one-time entry form to win…
local PD trainings
a trip to Austin to attend TCEA
Chromebooks and a document camera for your class
Presenter
Presentation Notes
PBS LearningMedia is ready to help you GET YOUR TECH ON this school year with a power-packed mix of free tools, support, and professional development to help you navigate the digital age of learning! Visit GetYourTechOn2015.com to access tech-themed lesson plans, games, and videos, sign up for PD webinars, and enter the GET YOUR TECH ON sweepstakes for a chance to win prizes for you and your classroom. The more resources you explore, the more chances you have to win: - A trip to Austin, Texas to attend the TCEA Conference - Trainings for your school with PBS edtech experts - A fully teched-out classroom with a Google Chromebook for each student and a document printer for your class

Are you an edtech pioneer, ground-breaker, and trendsetter using digital media and technology to drive student achievement at your school? GET RECOGNIZED for your outstanding efforts and apply for the 2016 PBS Digital Innovator Program! Visit GetYourTechOn2015.com to learn more. PBS will begin accepting applications starting December 1, 2015.
PBS Digital Innovators Program
Presenter
Presentation Notes
Are you an edtech pioneer, ground-breaker, and trendsetter using digital media and technology to drive student achievement at your school? GET RECOGNIZED for your outstanding efforts and apply for the 2016 PBS Digital Innovator Program! PBS Digital Innovators gain entry into an exclusive professional learning community and GET ACCESS to a year of professional development, premium resources, and networking opportunities with peers and thought leaders. If you’re recognized as a “Lead Innovator”, you will also be invited to attend the 2016 PBS LearningMedia Digital Summit to ENGAGE WITH EXPERTS leading the way in education and technology. Visit GetYourTechOn2015.com to learn more about this exciting professional development opportunity. PBS will begin accepting applications starting December 1, 2015.
CG: ® & © 2014 Universal Studios and/or HMH. All Rights Reserved. FOR PROMOTIONAL USE ONLY.