ASSESSING THE FEASIBILITY OF USING LOCAL …drm.cenn.org/Local_Case_studies/Assessing the...
79
ASSESSING THE FEASIBILITY OF USING LOCAL SPATIAL KNOWELDGE IN DISASTER RISK MANAGEMENT IN GEORGIA NINO KHELADZE March, 2011 SUPERVISORS: Dr. M. K. McCall Dr. C. J. van Westen
Transcript of ASSESSING THE FEASIBILITY OF USING LOCAL …drm.cenn.org/Local_Case_studies/Assessing the...
ASSESSING THE FEASIBILITY OF
USING LOCAL SPATIAL
KNOWELDGE IN DISASTER RISK
MANAGEMENT IN GEORGIA
NINO KHELADZE
March, 2011
SUPERVISORS:
Dr. M. K. McCall
Dr. C. J. van Westen

i
Thesis submitted to the Faculty of Geo-Information Science and Earth Observation of the University of Twente in partial fulfilment of the requirements for the degree of Master of Science in Geo-information Science and Earth Observation. Specialization: Governance and Spatial Information Management (GSIM) SUPERVISORS: Dr. M. K. McCall Dr. C. J. van Westen THESIS ASSESSMENT BOARD: Prof.Dr.Ing. P.Y. Georgiadou (Chair) Dr. J.A. Martinez (External Examiner, ITC)
ASSESSING THE FEASIBILITY OF
USING LOCAL SPATIAL
KNOWELDGE IN DISASTER RISK
MANAGEMENT IN GEORGIA
NINO KHELADZE
Enschede, The Netherlands, March, 2011

ii
DISCLAIMER This document describes work undertaken as part of a programme of study at the Faculty of Geo-Information Science and Earth Observation of the University of Twente. All views and opinions expressed therein remain the sole responsibility of the author, and do not necessarily represent those of the Faculty

i
ii
ABSTRACT
Disaster risk management as an issue at stake worldwide shifts its emphases from post disaster to pre-disaster phases. Management activities required in pre-disaster phases, such as risk assessment, preparedness or preventive measures needs detailed information about hazard characteristics, social, economic, structural vulnerability and capacity. Usually, that information is not available in many countries, as is the case in Georgia. Based on the international experiences and practices presented in the literature, local spatial knowledge can be assumed as an alternative for the detailed information acquisition, thus contributing to effective disaster risk management. So, more community oriented disaster risk management and assessment emerged as an approach. Participation of the local communities that are prone to hazards, their knowledge and practices can lead to better understandings of risk and informed governance for risk reduction. Consequently, as Georgia is highly prone to natural hazards and lack the information that is essential for effective disaster risk management, due to limited financial or human resources, this research aims to assess the feasibility for acquiring and utilising the local knowledge in disaster risk management using participatory method. First, an analysis regarding disaster risk management is performed to identify the situation in Georgia, its legal and institutional framework, key institutions in disaster risk management, information availability in the pre-disaster phase activities and the attitude of the government officials towards the usage of local knowledge. Secondly, a case study was carried with field work in the Georgian village of Gonio for the collection of local knowledge about hazard, vulnerability and coping capacity. The results are structured, visualised and tested, how it can be incorporated with expert knowledge. Thirdly, based on the literature study and open – ended interviews with government officials’, the relevant tools, institutions and governed levels are identified as well the main opportunities and constrains for using local knowledge in Georgia is determined. Finally, general conclusion on the basic findings of the research, its limitation and recommendations for farther research are presented. Keywords: Local Spatial Knowledge, Disaster Risk Management, Hazard, Vulnerability, Capacity
iii
ACKNOWLEDGEMENTS
First of all, I would like to express my gratitude to the Nuffic for giving me an opportunity to expand the knowledge. My special thanks to my supervisors Dr. M. K. McCall and Dr. C. J. van Westen, for all the important advice, supervision, and encourage during the stressful period, which help me to conclude this report. I would like to express my gratitude to Drs. J.C. (Johan) de Meijere for his attention and advices, and interesting lectures during the study period. My great gratitude to Giorgi Gaprindashvili who helped me to make the landslide susceptibility map for Gonio village. As well to everyone who I interview or who provide me with the necessary data for the research. I would like to thank, my sister and my relatives who helped me during the fieldwork, especially to Dato Kakabadze – the local from Gonio who often accompanied me to the fieldwork. I would like to express my special thanks to Irvin T. Feliciano Santiago for his help, advices, attention and love received during the study period. My great thanks to my parents_Nani Esakia and Teimuraz Kheladze, my sister Lina Kheladze, my niece Mariam Gogadze, my grandmother Lili Shengelia and to all my close relatives and friends who always support me. Special thanks to all the Georgians in ITC with whom I share majority of the time, especially to Maka zumbulidze and Natia Bulalauri.
iv
ABBREVIATIONS
ADPC Asian Disaster Preparedness Center ACF Advocacy Coalition Framework CENN Caucasus Environmental NGO Network CBDRM Community Based Disaster Risk Management CBDRR Community Based Disaster Risk Reduction CIS Collaborative information system CT CyberTracker DB Data Base DLG Government service land and water use under the Ministry of Agriculture DRM Digital Risk Management DRR Digital Risk Reduction EMD Emergency Management Department EWG Environmental Working Group GDP Gross Domestic Product GIS Geographical Information System GIT Geographical Information Technology GNCDRR Georgian National Committee of Disaster Risk Reduction GPS Global Positioning System HFA Hyogo Framework for Action HH Households ISDR International Strategy for Disaster Reduction ILWIS Integrated Land and Water Information System ICT Information and communications technology IK Indigenous Knowledge IRFC International Federation of Red Cross and Red Crescent Societies ITC Faculty of Geo-Information Science and Earth Observation of the University of Twente ITK Indigenous Technical Knowledge LSK Local Spatial Knowledge MIA Ministry of Internal affairs MoE Ministry on Environmental Protection and Natural Resources MS Microsoft NEA National Environmental Agency NGO Non-Governmental Organization NSC National Security Council NSEA Netherlands Commission for Environmental Assessment P3DM Participatory 3-Dimensional Modelling PGIS Participatory Geographic Information System PC Personal Computer PDA Personal Digital Assistant PRA Participatory Rural Appraisal PLA Participatory Learning and Action PVA Participatory Vulnerability Assessment KFW Kreditanstalt für Wiederaufbau RS Remote Sensing SPSS Statistical Package for the Social Sciences SDI Spatial Data Infrastructure SDC Sustainable Development Commission TEK Traditional Environmental Knowledge TK Traditional Knowledge UN United Nations UNDP United Nations Development Programme UNICEF United Nations Children's Fund UNU-EHS The United Nations University – Institute for Environment and Human Security

v
USAID United States Agency for International Development UTM Universal Transverse Mercator VCA Vulnerability and Capacity Assessment WGS World Geodetic System WB World Bank

vi
TABLE OF CONTENTS
1. General Introduction ........................................................................................................................................... 1
1.1. Introduction .................................................................................................................................................................1 1.2. Research Background .................................................................................................................................................1 1.3. Problem definition ......................................................................................................................................................2 1.4. Research objectives .....................................................................................................................................................2 1.5. Research questions ......................................................................................................................................................2 1.6. Research methodology ...............................................................................................................................................3 1.7. The research in the Matra project.............................................................................................................................3 1.8. Research Outline .........................................................................................................................................................3 1.9. Research framework ...................................................................................................................................................4
2. Review of DRM and LSK concepts .................................................................................................................. 5
2.1. Introduction .................................................................................................................................................................5 2.2. Natural Disaster Risk ..................................................................................................................................................5 2.3. Natural Disaster Risk Management and Disaster Risk Reduction .....................................................................8 2.4. Governance and DRM ...............................................................................................................................................9 2.5. Shift in paradigm toward LSK .................................................................................................................................9 2.6. Local Spatial Knowledge ........................................................................................................................................ 11 2.7. Implication of using local knowledge in institutions.......................................................................................... 11 2.8. LSK and DRM .......................................................................................................................................................... 12 2.9. PGIS tools for DRM ............................................................................................................................................... 13 2.10. Summary .................................................................................................................................................................... 14
3. Country analysis regarding DRM ..................................................................................................................... 15
3.1. Introduction .............................................................................................................................................................. 15 3.2. Georgia profile .......................................................................................................................................................... 15 3.3. DRM History and progress .................................................................................................................................... 15 3.4. Legislative framework in DRM .............................................................................................................................. 16 3.5. Institutional framework in DRM ........................................................................................................................... 16 3.6. LSK in key institutions ............................................................................................................................................ 19 3.7. LSK in Non-government institutions and mass media ..................................................................................... 20 3.8. Summary .................................................................................................................................................................... 21
4. Study areas and Methods of LSK acquisition ............................................................................................... 23
4.1. Introduction .............................................................................................................................................................. 23 4.2. Study area description and related hazard problems .......................................................................................... 23 4.3. Secondary data acquisition ...................................................................................................................................... 24 4.4. Workshop in Khelvachauri municipality .............................................................................................................. 24 4.5. LSK collection during Gonio fieldwork ............................................................................................................... 25 4.6. LSK acquisition tools during Mleta fieldwork and open-ended interviews with DRM actors ................... 28 4.7. Summary .................................................................................................................................................................... 29
5. Mapping Local Spatial Knowledge In Gonio ................................................................................................ 31
5.1. Introduction .............................................................................................................................................................. 31 5.2. Gonio filed work data structuring ......................................................................................................................... 31 5.3. Respondents general information .......................................................................................................................... 31 5.4. Hazrad information based on the respondents ................................................................................................... 32 5.5. Hazard information from government institutions ............................................................................................ 34 5.6. Hazard mapping ....................................................................................................................................................... 35 5.7. Mapping social and economic vulnerability ......................................................................................................... 37 5.8. Household coping mechanisms and needs .......................................................................................................... 38 5.9. Summary .................................................................................................................................................................... 40
6. Reviewing the opportunities and constraints of using LSK in DRM in Georgia .................................... 41
vii
6.1. Introduction .............................................................................................................................................................. 41 6.2. Shifting focus toward pre disaster activities in Georgia .................................................................................... 41 6.3. LSK for strengthening DRM in Georgia ............................................................................................................. 42 6.4. LSK acquisition tools ............................................................................................................................................... 42 6.5. Procedure for LSK acquisition and utilisation .................................................................................................... 44 6.6. Constraints and opprtunities for LSK acquisition and utilisation in institutions in Georgia...................... 46
7. Conclusions and Recommendations .............................................................................................................. 49
7.1. Conclusions ............................................................................................................................................................... 49 7.2. Recommendations for future research ................................................................................................................. 50
viii
LIST OF FIGURES
Figure 1-1: Research methodology. ............................................................................................................................ 3
Figure 1-2: Research framework. ................................................................................................................................ 4
Figure 2-1: Natural disaster impacts (Mechler, 2004). ............................................................................................. 5
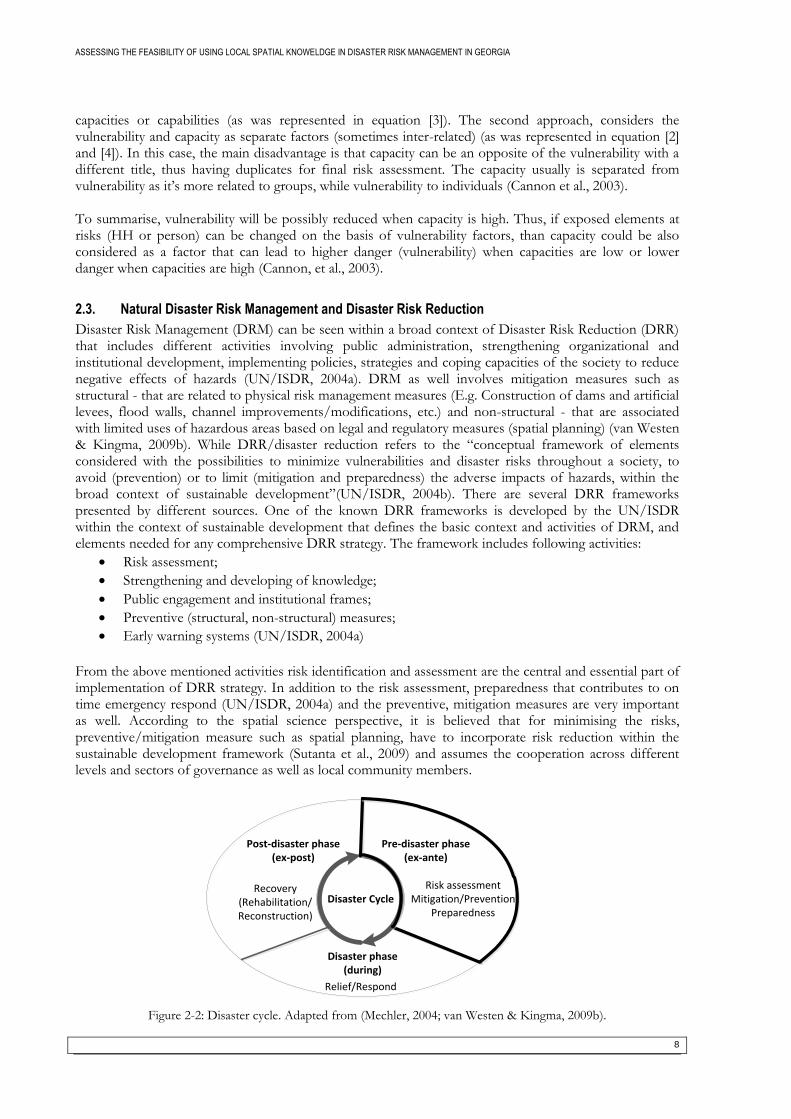
Figure 2-2: Disaster cycle. Adapted from (Mechler, 2004; van Westen & Kingma, 2009b). ............................ 8
Figure 2-3: Framework of shift in paradigm oriented toward LSK. ................................................................... 10
Figure 3-1: Administrative units of Georgia. .......................................................................................................... 15
Figure 3-2: Organizational structure of DRM at different levels of governance (Gogitidze, et al., 2008) ... 16
Figure 3-3: Achieve of the remaining records of historical disaster events in NEA. Source: Cees van
Westen ........................................................................................................................................................................... 17
Figure 3-4: Webpage interface for reporting disaster events in Georgia. ........................................................... 20
Figure 4-1: Study area. ................................................................................................................................................ 24
Figure 4-2: Mayor's perception of hazard intensity (a) and hazard types (b) (Mayor’s photo mapping). ..... 25
Figure 4-3: Sampled households. .............................................................................................................................. 26
Figure 5-1: Age (a) and residence (b) distribution of the respondents (fieldwork interviews). ...................... 31
Figure 5-2: Hazards clustered based on the hazard types (a) and months (b) (fieldwork interviews). .......... 32
Figure 5-3: Khelvachauri rainfall data in 2005 & 2008 per months (Giorgi Gaprindashvili, personal
communication). .......................................................................................................................................................... 33
Figure 5-4: High hazard frequency (a) & intensity (b) perceived by the HH (fieldwork interviews). ........... 34
Figure 5-5: Landslide Susceptibility Map overplayed with sampled points (Giorgi Gaprindashvili). ............ 35
Figure 5-6: water depth (a) and flood duration (b) construction using Kriging method. ................................ 37
Figure 5-7: Social vulnerability (a) and economic vulnerability (b) (fieldwork interviews). ............................ 38
Figure 5-8: Basic needs for preventive measures perceived by the HHs (fieldwork interviews). .................. 39
Figure 6-1: General procedure form LSK acquisition and utilisation for hazard, vulnerability capacity
assessment. ................................................................................................................................................................... 45
Figure 6-2: General procedure form LSK acquisition and utilisation for hazard/Incident reporting .......... 46
ix
LIST OF TABLES
Table 3-1: Commune level information used during emergency response (Besik Sanaia, personal
communication) .......................................................................................................................................................... 18
Table 5-1: Number of interviews per hazard type (Based on the fieldwork interviews). ............................... 31
Table 5-2: Khelvachauri peak rainfall data in August 2005 & September 2008 (Giorgi Gaprindashvili,
personal communication). ......................................................................................................................................... 33
Table 5-3: Triggering factors reported by the local community members (fieldwork interviews). ............... 33
Table 5-4: Number of buildings per susceptibility zones. .................................................................................... 35
Table 5-5: Landslide intensity perceived by the respondent matched with the landslide susceptibility. ...... 36
Table 5-6: Coping mechanisms applied by the community members (fieldwork interviews). ...................... 39
Table 6-1: LSK contribution for DRM strengthening.......................................................................................... 42
Table 6-2: PGIS tools experienced during the fieldwork ..................................................................................... 43


ASSESSING THE FEASIBILITY OF USING LOCAL SPATIAL KNOWELDGE IN DISASTER RISK MANAGEMENT IN GEORGIA
1
1. GENERAL INTRODUCTION
1.1. Introduction
The first chapter of the thesis presents the background of the research with a justification and the research problem definition. Then its presents methods and data used to answer the research questions and to achieve the set objectives of the thesis. After that the chapter describes the research as part of the Matra project and finally it ends with describing the structure of the research and presents the research framework.
1.2. Research Background
The frequency and impact of natural hazard events are growing and causing disasters with negative impacts on humans, economy and environment. Many areas in the world are prone to one or several natural hazards. Hazard events result in disasters when risk factors such as hazard, vulnerability and inadequate capacity (coping capabilities) overlaps in space and time. Avoiding or reducing the impact of disasters can be reached by reducing the disaster risk. Consequently, focusing on Disaster Risk Reduction (DRR) is an issue at stake worldwide (UN/ISDR, 2005). DRR is linked to sustainable development as both are linked to problems related to the same issues like environmental protection, economic growth and social equity, thus are dominant academicals topics (Encyclopedia of Sustainable Development, 2001). Good governance for risk reduction needs collaborative and participatory approaches within the different levels and actors of DRM during planning and decision making (UN/ISDR, 2005). In order to achieve better results regarding saving and protecting finances, lives or human livelihood, more effort and money have to be invested in the activities before disasters occur, rather than concentrating all efforts only on disaster response. Consequently, in the past years there was a shift from disaster response and recovery to risk management, prevention and mitigation. The shift concentrates more on vulnerability issues and thus collaborating not only with (non)governmental institutions but with local communities and households (HH) as well (Salter, 1998), to identify and analyse their vulnerabilities and capacities (Venton & Hansford, 2006), incorporate their knowledge and practices at the planning stage for disaster mitigation (in the short term or in long term such as in spatial planning) and find the optimal solutions to meet their needs. Thus, Community Based Disaster Risk Reduction (CBDRR) and Community Based Disaster Risk Management (CBDRM) appeared as important approaches in DRR that are embedded in participatory approaches. Any DRR strategy has as its central element risk identification and assessment. Comprehensive risk assessment needs detailed information about hazard characteristics, vulnerabilities and coping capacity of local communities. In many countries usually the relevant risk information is not available due to several reasons (lack of resources and technology). However, it is essential to know what the possible hazards are and where they are geographically located, how frequent they are likely to occur, how they will affect the community, what the likely consequences are, where the most vulnerable people are located and what their capacities are. Participation of the local communities that are prone to hazards, their knowledge and practices can improve the understanding of risk for government officials and lead to more informed management and decision making in DRR (Peters et al., 2009). The literature regarding collection and incorporation of accumulated Local Spatial Knowledge (LSK) for DRR using Participatory Geographic Information System (PGIS) has been increased recently. Examples are: hazard and vulnerability mapping, identification of coping mechanisms, overall risk/hazard assessment, vulnerability and capacity analysis and they can be found in(McCall, 2008). There has to be mentioned that PGIS is the most relevant method for LSK collection that developed out of participatory approaches such as Participatory Rural Appraisal (PRA) and Participatory Learning and Action (PLA) and is combined with Geo-Information Technology (GIT) tools. PGIS ranges from simple

ASSESSING THE FEASIBILITY OF USING LOCAL SPATIAL KNOWELDGE IN DISASTER RISK MANAGEMENT IN GEORGIA
2
maps drawn in the sand to complex on-line data collection. PGIS includes using of sketch maps, participatory 3D Models (P3dM), aerial and satellite images, Global Positioning Systems (GPS), Geographic Information System (GIS) (Rambaldi et al., 2006) and Personal Digital Assistances (PDAs) (with installed software like ArcPad or Cybertracker(CT)). A PGIS process, that is based on community’s local knowledge, contributes for better governance, empowers communities and thus strengthens their accountability, equity, and legitimacy (McCall, 2003).
Among other countries, Georgia as well is highly prone to natural hazards such as mudflows, landslides, floods and drought which causes disasters and negatively affects communities, their livelihoods, infrastructure and the environment. Natural hazards are happening all over Georgia’s territory, but mostly are dominating in mountainous regions. Situation in the country regarding disaster impacts got worse after Georgia broke up from the Soviet Union. The country weakened in financial, administrative and political capacity and introduced poor practise of management and planning in all government sectors (disaster management among them). Georgia adopted the Hyogo Framework for Action (HFA) in 2005, thus by default DRR should become a high priority for the national government and it should shift its concentration from emergency response to risk prevention and mitigation. Due to limited data availability on hazard characteristics, socio-economic or material vulnerability of exposed elements (especially on local level), the hazard identification and assessment are poor in Georgia and is challenging the attainment of DRR strategy (United Nations, 2010a).
1.3. Problem definition
As was mentioned above the knowledge of hazard risks, capacities and vulnerabilities is core of any DRR strategy, but in many countries (Georgia among them) this information is not usually available on the local level. There is also a lack of information at the government level, and a lack of interaction between local communities and government organisations. Therefore, this research aims to collect the necessary community knowledge on the local level and assess the feasibility of incorporating and using this information by relevant DRM actors.
1.4. Research objectives
The main objective of the proposed research is to assess the feasibility of using local spatial knowledge about hazard, vulnerability, and coping capacity in DRM in Georgia. To reach the main objective the following sub-objectives are defined:
1. Evaluate the existing situation in Georgia regarding DRM; 2. Critically review the methods of acquiring LSK from communities on hazards, vulnerability
and coping capacity in a selected study area; 3. Test the potential for mapping LSK integrated with scientific knowledge. 4. Review the opportunity of acquiring and utilising LSK for DRM activities at different
government levels.
1.5. Research questions
1. What is the legislative and institutional framework for DRM in Georgia? What is the existing (geo) information related to DRM used by the key institutions? What is the information gaps related to DRM of key institutions? What is the attitude of institutions regarding LSK?
2. What methods are suitable for acquiring LSK about DRM in study area? What LSK about DRM can be collected in the study area? What are the advantages and disadvantages of methods used for LSK collection?
3. What are the hazard/risk maps from different sources (LSK maps; scientific maps; Local official maps; Government Institution maps) potentially available in the study area? What are the differences between the maps? What LSK about vulnerability and coping capacity can be presented on the maps?
ASSESSING THE FEASIBILITY OF USING LOCAL SPATIAL KNOWELDGE IN DISASTER RISK MANAGEMENT IN GEORGIA
3
4. How can LSK be used in the national and local level DRM activities? What are the main institutional opportunities and constraints to use LSK in DRM in Georgia?
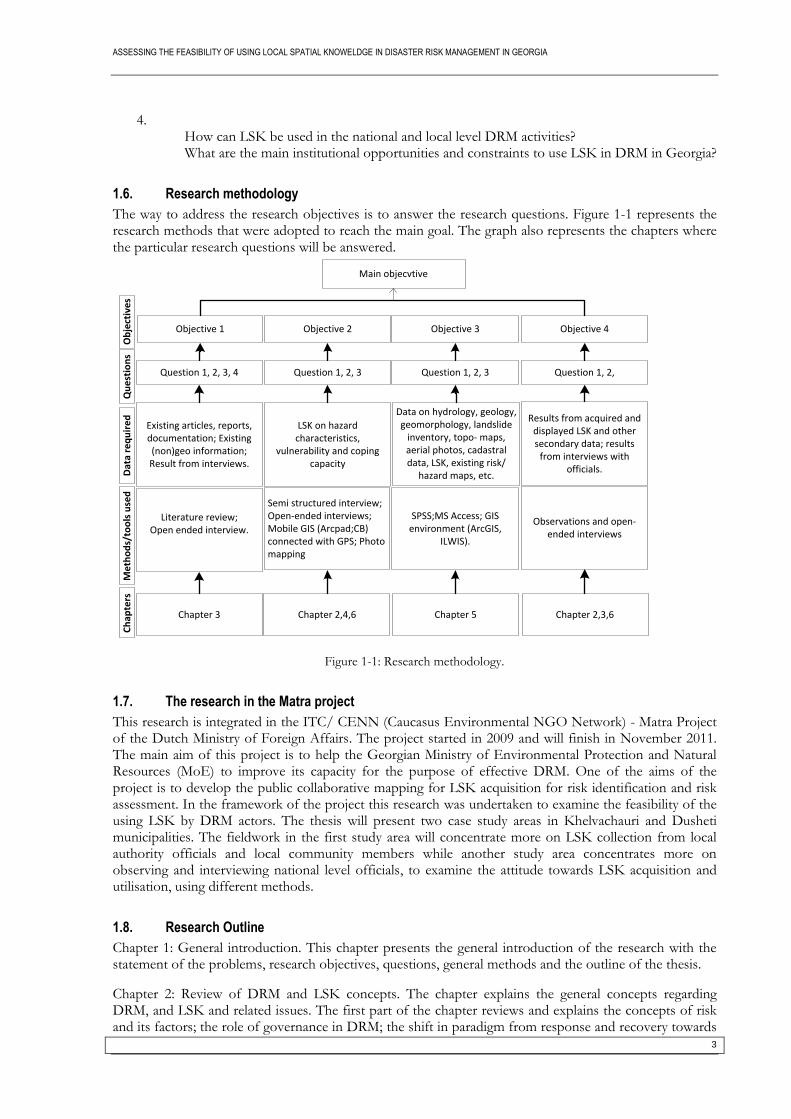
1.6. Research methodology
The way to address the research objectives is to answer the research questions. Figure 1-1 represents the research methods that were adopted to reach the main goal. The graph also represents the chapters where the particular research questions will be answered.
Objective 1 Objective 2 Objective 3 Objective 4
Existing articles, reports, documentation; Existing (non)geo information; Result from interviews.
LSK on hazard characteristics,
vulnerability and coping capacity
Results from acquired and displayed LSK and other secondary data; results
from interviews with officials.
Literature review;Open ended interview.
Semi structured interview;Open-ended interviews;Mobile GIS (Arcpad;CB) connected with GPS; Photo mapping
Data on hydrology, geology, geomorphology, landslide
inventory, topo- maps, aerial photos, cadastral data, LSK, existing risk/
hazard maps, etc.
SPSS;MS Access; GIS environment (ArcGIS,
ILWIS).
Ob
ject
ive
sD
ata
req
uir
ed
Me
tho
ds/
too
ls u
sed
Main objecvtive
Observations and open-ended interviews
Question 1, 2, 3, 4 Question 1, 2, 3 Question 1, 2, 3 Question 1, 2,
Qu
est
ion
sC
hap
ters
Chapter 3 Chapter 2,4,6 Chapter 5 Chapter 2,3,6
Figure 1-1: Research methodology.
1.7. The research in the Matra project
This research is integrated in the ITC/ CENN (Caucasus Environmental NGO Network) - Matra Project of the Dutch Ministry of Foreign Affairs. The project started in 2009 and will finish in November 2011. The main aim of this project is to help the Georgian Ministry of Environmental Protection and Natural Resources (MoE) to improve its capacity for the purpose of effective DRM. One of the aims of the project is to develop the public collaborative mapping for LSK acquisition for risk identification and risk assessment. In the framework of the project this research was undertaken to examine the feasibility of the using LSK by DRM actors. The thesis will present two case study areas in Khelvachauri and Dusheti municipalities. The fieldwork in the first study area will concentrate more on LSK collection from local authority officials and local community members while another study area concentrates more on observing and interviewing national level officials, to examine the attitude towards LSK acquisition and utilisation, using different methods.
1.8. Research Outline
Chapter 1: General introduction. This chapter presents the general introduction of the research with the statement of the problems, research objectives, questions, general methods and the outline of the thesis.
Chapter 2: Review of DRM and LSK concepts. The chapter explains the general concepts regarding DRM, and LSK and related issues. The first part of the chapter reviews and explains the concepts of risk and its factors; the role of governance in DRM; the shift in paradigm from response and recovery towards
ASSESSING THE FEASIBILITY OF USING LOCAL SPATIAL KNOWELDGE IN DISASTER RISK MANAGEMENT IN GEORGIA
4
the risk prevention and mitigation, thus more orientating on LSK. The second part of the chapter introduces the PGIS as relevant methods for LSK acquisition and continues to review its concepts and implications within DRM context.
Chapter 3: Country analysis regarding DRM. This chapter describes the history and the progress of Georgia regarding DRM, its legislative and institutional framework; Key actors in DRM, their responsibility, available (geo) information and the required information. Finally, the chapter ends with describing the experiences and attitudes regarding LSK acquisition and utilisation by key institutions.
Chapter 4: Methods of LSK acquisition in study area. This chapter starts by presenting the profile of the study area in Khelvachauri municipality regarding hazards and related problems. The chapter presents the details on how the fieldwork was performed and what LSK were collected in the study area; what method was used for collecting the LSK; additionally, the chapter 4 presents the attitude of the government officials toward the PGIS tool (CT).
Chapter 5: Mapping LSK in Gonio –This chapter presents the methods of mapping LSK on landslide and flood hazards by local authorities, local community members and expert. It also presents the mapping of HH vulnerabilities and their basic needs for coping mechanisms.
Chapter 6: Reviewing the opportunities and constraints of using LSK in DRM in Georgia. The chapter provides the appropriate suggestions for the incorporation of LSK in DRM activities at local and national level and discusses about the main limitations, strength and weaknesses of LSK incorporation.
Chapter 7: Conclusions and recommendations. The final chapter presents and summarises the major findings derived from the research and concludes with key recommendations for the future research.
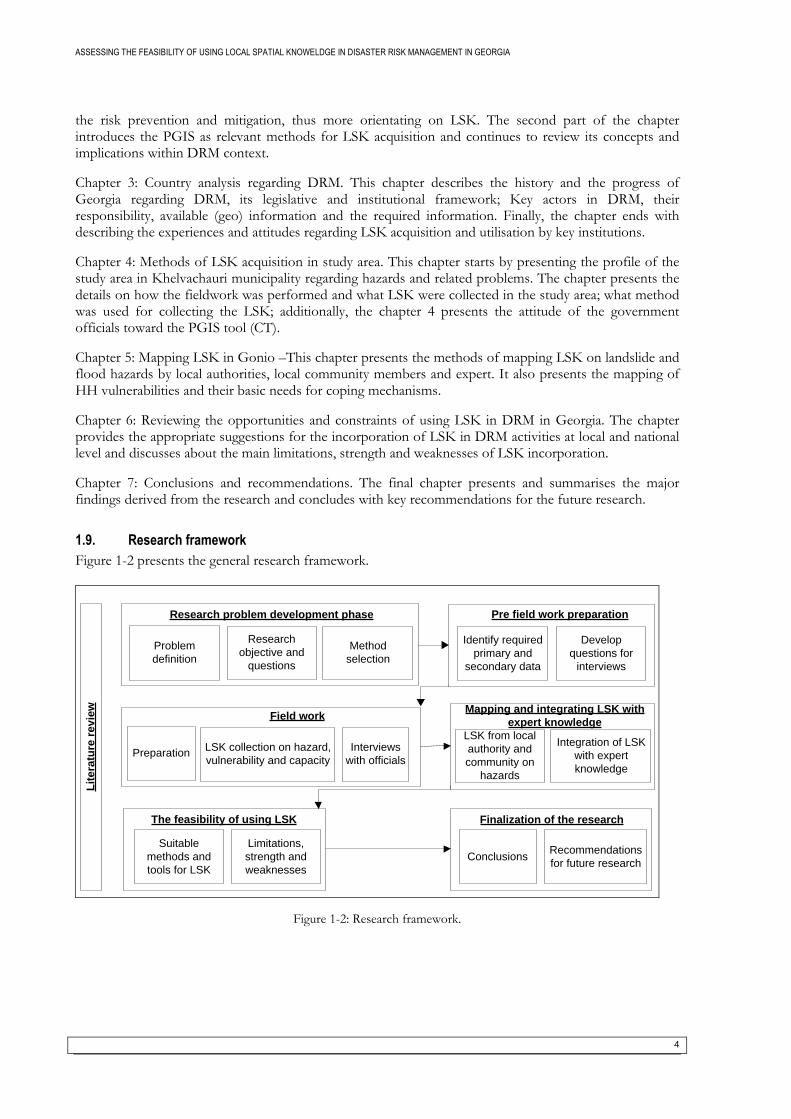
1.9. Research framework
Figure 1-2 presents the general research framework.
Identify required
primary and
secondary data
Pre field work preparation
Develop
questions for
interviews
Preparation
Field work
LSK collection on hazard,
vulnerability and capacity
Interviews
with officials
Lit
era
ture
re
vie
w
Conclusions
Finalization of the research
Recommendations
for future research
Mapping and integrating LSK with
expert knowledge
LSK from local
authority and
community on
hazards
Integration of LSK
with expert
knowledge
Research problem development phase
Research
objective and
questions
Method
selection
Problem
definition
The feasibility of using LSK
Limitations,
strength and
weaknesses
Suitable
methods and
tools for LSK
Figure 1-2: Research framework.
ASSESSING THE FEASIBILITY OF USING LOCAL SPATIAL KNOWELDGE IN DISASTER RISK MANAGEMENT IN GEORGIA
5
2. REVIEW OF DRM AND LSK CONCEPTS
2.1. Introduction
This chapter presents and explains general concepts used in this thesis: the definition of the risk and risk factors (hazard, vulnerability and capacity); General overview on natural Disaster Risk Management (DRM) and Disaster Risk Reduction (DRR); Governance and DRM; Shift in paradigm towards disaster risk prevention and mitigation from the disaster respond and recovery; General overview on Local Spatial; Implication of using LSK; LSK in DRM; and PGIS tools for DRM.
2.2. Natural Disaster Risk
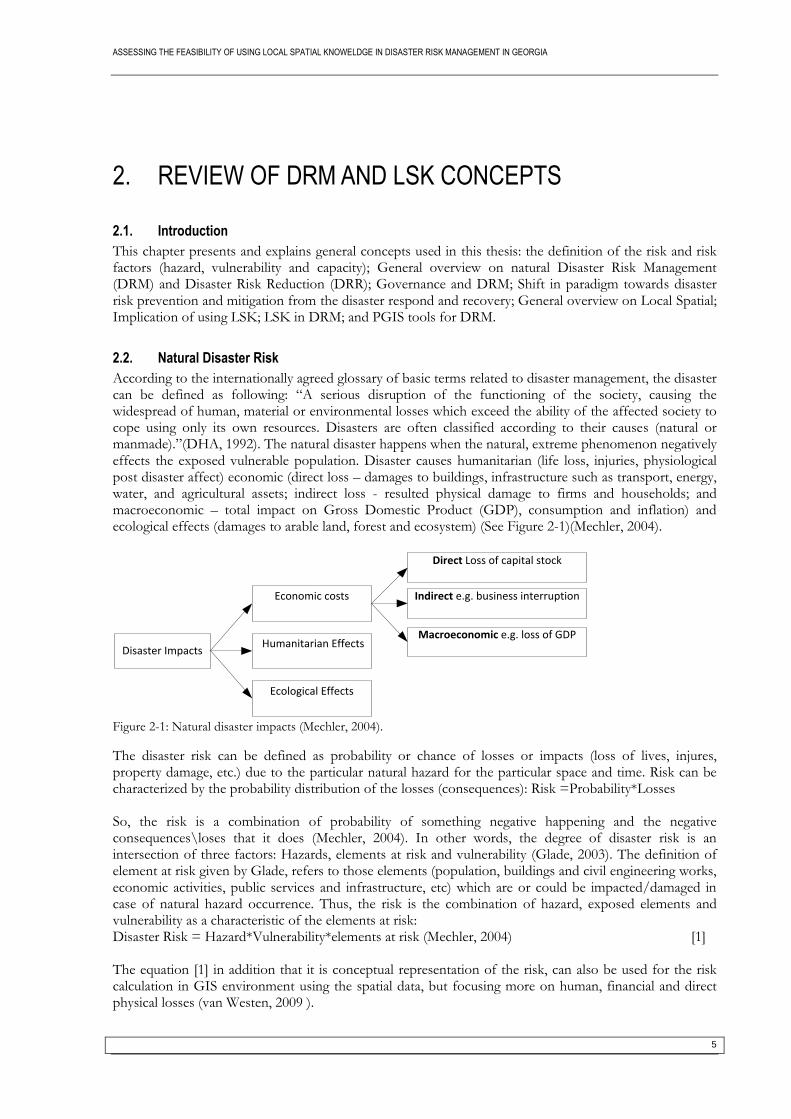
According to the internationally agreed glossary of basic terms related to disaster management, the disaster can be defined as following: “A serious disruption of the functioning of the society, causing the widespread of human, material or environmental losses which exceed the ability of the affected society to cope using only its own resources. Disasters are often classified according to their causes (natural or manmade).”(DHA, 1992). The natural disaster happens when the natural, extreme phenomenon negatively effects the exposed vulnerable population. Disaster causes humanitarian (life loss, injuries, physiological post disaster affect) economic (direct loss – damages to buildings, infrastructure such as transport, energy, water, and agricultural assets; indirect loss - resulted physical damage to firms and households; and macroeconomic – total impact on Gross Domestic Product (GDP), consumption and inflation) and ecological effects (damages to arable land, forest and ecosystem) (See Figure 2-1)(Mechler, 2004).
Disaster Impacts
Economic costs
Humanitarian Effects
Direct Loss of capital stock
Ecological Effects
Macroeconomic e.g. loss of GDP
Indirect e.g. business interruption
Figure 2-1: Natural disaster impacts (Mechler, 2004).
The disaster risk can be defined as probability or chance of losses or impacts (loss of lives, injures, property damage, etc.) due to the particular natural hazard for the particular space and time. Risk can be characterized by the probability distribution of the losses (consequences): Risk =Probability*Losses So, the risk is a combination of probability of something negative happening and the negative consequences\loses that it does (Mechler, 2004). In other words, the degree of disaster risk is an intersection of three factors: Hazards, elements at risk and vulnerability (Glade, 2003). The definition of element at risk given by Glade, refers to those elements (population, buildings and civil engineering works, economic activities, public services and infrastructure, etc) which are or could be impacted/damaged in case of natural hazard occurrence. Thus, the risk is the combination of hazard, exposed elements and vulnerability as a characteristic of the elements at risk: Disaster Risk = Hazard*Vulnerability*elements at risk (Mechler, 2004) [1] The equation [1] in addition that it is conceptual representation of the risk, can also be used for the risk calculation in GIS environment using the spatial data, but focusing more on human, financial and direct physical losses (van Westen, 2009 ).
ASSESSING THE FEASIBILITY OF USING LOCAL SPATIAL KNOWELDGE IN DISASTER RISK MANAGEMENT IN GEORGIA
6
Due to the emerging complexities between the nature and the society the new approach has emerged in risk understanding: Disaster Risk = Hazard * Vulnerability / Capacity [2] The question [2] is only conceptual, meaning that there is less vulnerability when there are more assets owned by the community that increases their capacities to cope with disaster risks. But the equation also allows to incorporate different conditions of vulnerability and capacity, e.g. using Spatial Multi-Criteria Evaluation (van Westen, 2009 ). Additionally, from the literature there are identified different approaches in representation of risk based on the different views on vulnerability concepts. For example:
Where the vulnerability is the set of unsafe conditions (physical, economic, social and environmental) of elements at risk that makes community more prone to hazard. Thus: Disaster risk = Hazard*Vulnerability (where the capacity is subsumed by vulnerability); [3]
Where the community or physical structures are prone to hazards equally no matter of conditions. Thus, vulnerability is based on the location of elements at risk and risk can be represented as following: Disaster Risk = Hazard*vulnerability/capacity(Where the capacity is separate variable)
(Caritas Czech Republic, 2009). [4]
The equation [4] looks like equation [2] but it is not the same in sense of vulnerability. In equation [4], vulnerability is based on the location of elements at risk and does not include different aspect/conditions of vulnerability when in equation [2] it does. Whether, equation [1] and [3] represent one and the same meaning. As can be observed, there are different risks representations and they change according to their factors and their descriptions. Defining and identifying risk and risk factors is important for the comprehensive risk assessment. Risk assessment according to UN/ISDR can be defined as following: Risk assessment is a process that is based on both, technical characteristics of hazard and people’s vulnerability conditions and their exposure while taking into consideration their coping capacities to predicted risk (UN/ISDR, 2004b).
2.2.1. Hazard
Based on the internationally agreed glossary of basic terms related to disaster management, the hazard can be defined as likelihood of occurrence of potentially damaging extreme event within a given time and space (DHA, 1992). Hazard can be natural (extreme geophysical and biological events), technological (major accidents) and contextual (global change). Natural hazards can be geologic (earthquakes, volcanic eruptions, landslides, avalanches), hydrologic (river floods, coastal floods, drought), atmospheric (cyclones, tornados, hail, ice and snow) and Biologic (epidemic diseases, wildfires). This research is related with geologic and hydrologic hazards, mainly landslides, mudflows and floods. Hazard has several technical characteristics such as triggering factors, spatial occurrence, duration of the event, time of onset, frequency, magnitude or intensity and secondary events (Alkema et al., 2009). Below is briefly explained two types of hazards (geological and hydrological phenomenon) that this thesis is related to. Landslide - is a geological event that mainly occurs in slope areas and includes movement of materials caused by the gravity forces. The landslide includes different categories of processes and ground movements such as mudflows, mudslides, debris avalanches, earth flow and rock falls. Landslides can be caused by the natural hazards such as heavy rains and earthquakes or induced by the man (land used changes or deforestation). Landslides can cause the other hazard (e.g. flood) if the material will falls in the river or drainage (canal). Usually high magnitude (intensity) landslide hazards are occurring with low frequency and vice versa (Alkema, et al., 2009). Flood - is a hydrological hazard and is an exceeded water body caused by the overflow of water from river, stream, or drainage ditch in the flood plain areas. Usually floods are caused by the high precipitation. Floods are of different types (Federal Emergency Management Agency, 1997). The flood, caused by the local drainage ditches, is the one that is presented in the study area (Gonio village) of this research.
ASSESSING THE FEASIBILITY OF USING LOCAL SPATIAL KNOWELDGE IN DISASTER RISK MANAGEMENT IN GEORGIA
7
Hazard is one of the needed factors for the purpose that disasters occur. However, the disaster can only occur and cause the humanitarian, economic and ecological effect when hazards intersect with exposed vulnerable elements at risk. The hazard, that occurs and does not cause any negative effects, will not become a disaster (Mechler, 2004).
2.2.2. Vulnerability
In different scientific disciplines, such as disaster management, social science, ecology or climate change, the concept of vulnerability is defined in different ways. The term is used so broadly that it is still challenging to make a careful universal description (Birkmann, 2006). The common definition of the vulnerability according to Blaikie et al (1994) is: “being prone or susceptible to damage or injury”. There are several definitions of vulnerability in relation to natural hazards. At the website of United Nations University - Institute for Environment and Human Security (UNU-EHS) the online glossary was created about core terminology of disaster reduction, were 37 vulnerability definition were compiled by (Thywissen, 2010) from different sources (the same variety of definitions can be retrieved about risk, exposure, capacity/coping, resilient/resilience, etc.). Mostly, all definitions on vulnerability states that the vulnerability is not related only to physical vulnerability (physical resistance of structure) but is also influenced by political, social-economic, physical and environmental factors. The mentioned factors thus determine the opportunity of a community to manage or recover from the negative effects of natural hazards. UN/ISDR (2004b) defines vulnerability as “The conditions determined by physical, social, economic, and environmental factors or processes, which increase the susceptibility of a community to the impact of hazards“. The factors influencing vulnerability is grouped in difference ways by different authors. Based on the above mentioned definition of vulnerability, the factors of vulnerability are grouped in four main categories (physical, economic, environmental, and social). Nowadays, there is developed several vulnerability frameworks. According to (van Westen & Kingma, 2009a) almost all these conceptual frameworks have several features in common:
Multi-dimensional (physical, social, economic, environmental, political, cultural, institutional, among other factors define vulnerability);
Dynamic (vulnerability is changing through time);
Scale-dependent (from local (HH, community) to national level);
Site-specific (Vulnerability varies across different regions and needs to be approached differently).
UNU-EHS with the help of Expert Working Group (EWG) tries to farther workout the vulnerability concept and make it clearer. EWG exchanges ideas about the concepts, frameworks and indicators of vulnerability and vulnerability measurements (theoretically and practically) to be able to communicate better and visualize vulnerable places to decision-makers (UNU-EHS, 2010). According to the definitions, vulnerability is a component of disaster risk and is characterises the element at risk. In addition to vulnerabilities, elements at risk can also possess capacities to cope with natural hazards.
2.2.3. Capacity
Similar to the vulnerability concept, there are also various definitions on capacity that can be used differently in vulnerability and risk conceptual representations. UN/ISDR (2004b) defines capacity as “A combination of all the strengths and resources available within a community, society or organization that can reduce the level of risk, or the effects of a disaster.” Similar to vulnerability, capacity as well may include physical, institutional, social or economic factors. Capacity can also be described as capability. Capability might be the strength or resources that possess person, HH or community and enables them to cope with, prevent, mitigate or recover from disasters. Capabilities are rooted in human resources (knowledge, attitude, skills). Capability to manage capacity is similar to coping capacity and can be developed over time (acquired through experiences or trainings) (Caritas Czech Republic, 2009). Alike vulnerability there are two different approaches in the concept of capacity. The first approach considers that capacity is an opposite of vulnerability. Thus, community or individual who are highly vulnerable have less capacity to cope (and vice versa) and there are not separate factors considering
ASSESSING THE FEASIBILITY OF USING LOCAL SPATIAL KNOWELDGE IN DISASTER RISK MANAGEMENT IN GEORGIA
8
capacities or capabilities (as was represented in equation [3]). The second approach, considers the vulnerability and capacity as separate factors (sometimes inter-related) (as was represented in equation [2] and [4]). In this case, the main disadvantage is that capacity can be an opposite of the vulnerability with a different title, thus having duplicates for final risk assessment. The capacity usually is separated from vulnerability as it’s more related to groups, while vulnerability to individuals (Cannon et al., 2003). To summarise, vulnerability will be possibly reduced when capacity is high. Thus, if exposed elements at risks (HH or person) can be changed on the basis of vulnerability factors, than capacity could be also considered as a factor that can lead to higher danger (vulnerability) when capacities are low or lower danger when capacities are high (Cannon, et al., 2003).
2.3. Natural Disaster Risk Management and Disaster Risk Reduction
Disaster Risk Management (DRM) can be seen within a broad context of Disaster Risk Reduction (DRR) that includes different activities involving public administration, strengthening organizational and institutional development, implementing policies, strategies and coping capacities of the society to reduce negative effects of hazards (UN/ISDR, 2004a). DRM as well involves mitigation measures such as structural - that are related to physical risk management measures (E.g. Construction of dams and artificial levees, flood walls, channel improvements/modifications, etc.) and non-structural - that are associated with limited uses of hazardous areas based on legal and regulatory measures (spatial planning) (van Westen & Kingma, 2009b). While DRR/disaster reduction refers to the “conceptual framework of elements considered with the possibilities to minimize vulnerabilities and disaster risks throughout a society, to avoid (prevention) or to limit (mitigation and preparedness) the adverse impacts of hazards, within the broad context of sustainable development”(UN/ISDR, 2004b). There are several DRR frameworks presented by different sources. One of the known DRR frameworks is developed by the UN/ISDR within the context of sustainable development that defines the basic context and activities of DRM, and elements needed for any comprehensive DRR strategy. The framework includes following activities:
Risk assessment;
Strengthening and developing of knowledge;
Public engagement and institutional frames;
Preventive (structural, non-structural) measures;
Early warning systems (UN/ISDR, 2004a)
From the above mentioned activities risk identification and assessment are the central and essential part of implementation of DRR strategy. In addition to the risk assessment, preparedness that contributes to on time emergency respond (UN/ISDR, 2004a) and the preventive, mitigation measures are very important as well. According to the spatial science perspective, it is believed that for minimising the risks, preventive/mitigation measure such as spatial planning, have to incorporate risk reduction within the sustainable development framework (Sutanta et al., 2009) and assumes the cooperation across different levels and sectors of governance as well as local community members.
Disaster Cycle
Post-disaster phase (ex-post)
Post-disaster phase (ex-post)
Recovery (Rehabilitation/Reconstruction)
Disaster phase (during)
Pre-disaster phase (ex-ante)
Relief/Respond
Risk assessmentMitigation/Prevention
Preparedness
Figure 2-2: Disaster cycle. Adapted from (Mechler, 2004; van Westen & Kingma, 2009b).
ASSESSING THE FEASIBILITY OF USING LOCAL SPATIAL KNOWELDGE IN DISASTER RISK MANAGEMENT IN GEORGIA
9
Usually, DRM includes number of activities made before, during and after the disaster. In disaster management three stages can be recognized: The pre-disaster, disaster and post-disaster stages. Respectively, different activities and measures needed to deal with disaster risk or disaster impact management are farther divided into three categories: risk management (ex-ante) relief/response (during) and rehabilitation/reconstruction (ex-post). See Figure 2-2.
2.4. Governance and DRM
It is widely recognized that the government system and its framework is responsible to protect civil society, their property, make their life more secure and provide with the essential services. Thus, laws and regulations protects life, property and citizen’s interests from the threats and sometimes even from themselves (restrictions to settle in hazard prone areas) (Honore, 1995). Usually, the national government is the main actor in DRM. From the economic perspective except civil society and private sector, the government is also exposed to natural disaster risk because of two basic functions: the allocation of public goods and services (such as education, security, clean environment) for the purpose of market failure (existence of externality, public goods, non-competitive markets, and imperfect information) and income distribution (Mechler, 2004). Thus, there are three major areas were government is highly responsible (see figure 2-1) such as protection of society, environment and an economy from negative impacts of a disaster. So disaster is a challenge for sustainable development. To rich sustainable development there are three aspects of governance that have to be integrated: Scales and levels (national, regional, local); Sectors and aspects (environmental, social and economic); Time and learning (problems and required policy responses, creating great uncertainty and necessity of continues learning over time) (Bressers & Rosenbaum, 2003). However, according to the Hyogo Framework for Action 2005-2015 in addition to the multi-sectoral and multi-level governance approaches that are needed to reach strategic goals mentioned in DRR framework, there is an extremely important to include society as volunteers, community based organisations, scientific community and private sectors at all levels of DRR implementation. In addition that risk is a complex term, it relates to something that did not happened yet. Risk is associated with the decision-making that needs to be made for future and relates to uncertainty (Cardona, 2004). DRM can be related to several obstacles: Firstly, lack of political will – without strong mandate from the higher level government hazards have a low priority (higher level government and their behaviour itself is determined by level of risk perception). Secondly, frequency of natural hazards - even though the number of natural hazards are increasing, it’s not as frequent to lead for continuous loses (are easily forgotten), so there is an ignorance by local authorities or communities due to the minor risk perception of natural hazards. Thirdly, society and private sector evasion of development rules - even if the higher and lower level government adopts strict rules and a regulation to mitigate loses from natural disasters the objectives will not be reached if there is an ignorance from property owners, land developers and builders. Fourthly, the lack of willingness of policy makers to allocate public resource for hazard reduction (hazard mitigation measures is quite costly), especially when there are difficulties to predict future hazards precisely. Fifthly, the absences of appropriate management capacities - there is a need of high expertise and knowledge that is often lacking in local government (Burby, 1998). And finally, as it was mentioned many times, one of the obstacles for effective DRM is the lack of detailed risk information at local level. As it can be seen, the risk perception of people (government officials, private sector representatives or civil society) is important in DRM as it determines the attitude and behaviours of people towards risks and measures to take for risk reduction.
2.5. Shift in paradigm toward LSK
In the past, the activities related to ex-post disaster management were dominated in different agencies (UN/WB) and in national or international decision-making. But as the concept of vulnerability appeared the paradigm changed towards ex-ante risk management. Thus, in DRR framework, presented by UN/ISDR, the risk reduction activities are concentrated not only for emergency respond and recovery but for disaster risk mitigation as well (Bankoff, 2004). Due to the fact that in many cases it is not possible to

ASSESSING THE FEASIBILITY OF USING LOCAL SPATIAL KNOWELDGE IN DISASTER RISK MANAGEMENT IN GEORGIA
10
modify hazard in order to reduce risk, it’s needed to modify conditions of vulnerability of the exposed elements. Thus, for disaster mitigation and prevention, the emphases are made for vulnerability reduction. However, it is mostly called as risk reduction (Cardona, 2004). Above mentioned shift is the purpose of emerged application such as CBDRM or CBDRR (Hilborst & Bankoff, 2004). In the context of DRM, a community is defined as group of people living in common geographical area, exposed to common hazards and having common knowledge in responding to hazards but having different perceptions and exposure of risk (Abarquez & Murshed, 2004). In this research the community refers to the village. Various tools and methods were developed in several manuals on vulnerability and capacity assessment by different organisations such as ActionAid, IRFC, ADPC, etc. There are several well-known approaches: Participatory Vulnerability Analysis (PVA); Vulnerability and Capacity Assessment (VCA); Participatory Disaster Risk Assessment; and Vulnerability Assessment Approach. All the toolkits related to CBDRR/CBDRM can be found at Provention web site (Provention, 2011). In CBDRM the local community knowledge and practices are the most important factors. Communities or HHs have different approaches to cope with the negative impacts of the hazards that are known as coping practices. Based on the patterns and the events that happened in the past, there is guidance for the action for similar events in future. Coping practices are identified as the local knowledge (Bankoff, 2004).
DRR/DRM
Pre-disaster phase activities in DRM
Hazard Vulnerability Capacity
LSK
Essential for effective
DisasterSustainable
development
Makes less damaging
Contributes to
Contributes for effective
Contribute for better identification of
Participatory approach (CBDRR/PGIS)
Useful method for acquisition of
Good governanceIn DRR
Contributes to
Contributes to
Figure 2-3: Framework of shift in paradigm oriented toward LSK.
Based on the theories deveoped above, there is presented DRR framework where ex-ante phase in disaster cycle is highly underlined and particularly disaster idendification and assesmsent. Comrehensive risk assessmet needs identification and assessmnet of hazard, vulnerabilitand and capacity at local level (usually requred data are not availabele in many countriess). Shifting towards ex-ante stage and apperance of vulnerability and capacity concepts moves toward to CBDRM applcations embeded in participatory approaches. Inclusion of community practices and their knowledge of vulnerability, capacity and hazard is necessary for effective DRM, especially in data poor environment. PGIS, as one of the well-known method developed from participatory approaches are widely used for LSK acquisition (not only for LSK collection purposes) in DRM. Based on the literature presented in previous sections, the Figure 2-3 was made by the author showing the bottom up framework of LSK contribution for effective DRM, finally leading to sustainable development.
ASSESSING THE FEASIBILITY OF USING LOCAL SPATIAL KNOWELDGE IN DISASTER RISK MANAGEMENT IN GEORGIA
11
2.6. Local Spatial Knowledge
Often terms, such as Indigenous Knowledge (IK), Traditional Knowledge (TK), Traditional Environmental Knowledge (TEK), Indigenous Technical Knowledge (ITK), folk knowledge, folk science, citizen science, community knowledge, rural people’s knowledge, farmers knowledge and local knowledge (sometimes referred as LSK) used interchangeable. Mostly rest are related to rural population (but not always) and are used to differentiate the knowledge developed by a particular community from the scientific knowledge (Bankoff, 2004; Dekens, 2007; Ifatimehin, 2009; Tripathi & Bhattarya, 2004).. According to the Babylon’s online dictionary, the local knowledge (as well IK, TK, TEK, etc.) refers to the oldest traditions and practices that are unique to certain regional, indigenous, or local communities. It also involves the wisdom, accumulated knowledge, and techniques of people/communities in particular geographic areas. Usually, local knowledge is passed from earlier generations orally, through stories, legends, folklore, rituals, songs, laws, etc. Additionally, people adapt and add to the transferred knowledge a new knowledge in dynamic environmental (Babylon's Online Dictionary, 2011). Thus, local knowledge is dynamic. Duerden & Kuhn (1996) describes LSK as “home and action space, is innate and sustained knowledge about the land, identifies issues of immediate significance, and encodes the information about the environment in a language a region’s inhabitants understand”. In this thesis the term LSK and local knowledge will be used interchangeable and mostly will be used LSK, as the research is oriented to collect not only attribute data (on hazard, vulnerability and capacity), but largely spatial data, that can be represented as maps in GIS after structuring and storing geo an non-geo data in database. Structure, organised and interpreted geo-information (e.g. maps) is wildly used by the government or non-government institutions that support, managers, experts or decision makers for better effective and informed governance (Molenaar, 2006). In Recent years, there are a growing scientific working papers about integrating local knowledge with the development projects in different scientific disciplines, first started in anthropology, sociology, geography and continued in the fields of ecology, soil science, forestry, human health, agricultural economics, information science, water resource management, etc (Agrawal, 1995). As well, there is a growing literature about incorporating local and scientific knowledge to produce better result than it is achieved without the integration (Failing et al., 2007; Fernandez-Gimenez et al., 2006; Raymond et al., 2010; Reed et al., 2007).
2.7. Implication of using local knowledge in institutions
As it is mentioned in the paper of Dekens, the use of local knowledge is a political issue. Incorporating local knowledge in policy framework needs institutional changes and it is related to several difficulties (Dekens, 2007). For example, institutional changes are long term process as they used to resist changes (institutional inertia). Institutions are created by society and are changing based on their changing views and perceptions. Institutional changes mainly are caused by influences from the powerful actors and outside interventions. Institutional changes leads in changes of rules, legislation and assigned tasks (policy making). Thus, institutional and policy changes are tied with each other. Policy developments itself are materialized very slowly and not immediately after institutional changes (Frantzeskaki et al., 2009). Policy processes as a social interaction involves 5 elements of governance: level and scale, actors and networks, perception of the problem and objectives, strategies and instrument and resource and organization. In governance system changes occur when the factors from outside will intervene to one of the five elements and will be adjusted to the new situation. Outside factors are itself depend on the factors of the actors such as: value (cognitions), motives (information) and resources (capacity, power) that is presented in Contextual Interaction Theory by (Bressers, 2007). The policy processes are well explained in the Advocacy Coalition Framework (ACF) that explains the role that scientific and technical information plays in the policy process, the influence of beliefs to policy making within policy sub-systems, coalitions, their structure and behaviour, etc. (Sabatier & Wieble, 2007). The constraints for information utilisation, such as policy beliefs, are subdivided in three hierarchical structures according to ACF: Deep core beliefs; Policy core beliefs/preferences; and secondary beliefs that are easier to change. At this level the scientific and technical information could contribute for learning and playing the a major role to change the policy participants beliefs and thus make a new policies (Sabatier & Wieble, 2007).
ASSESSING THE FEASIBILITY OF USING LOCAL SPATIAL KNOWELDGE IN DISASTER RISK MANAGEMENT IN GEORGIA
12
To acquire/provide and utilise the information within policy framework by decision makers there are several institutional constraints. The main are: availability of resource (financial, personal or expertise), legal requirements for certain type of data provision, the importance of the issue in policy agenda, ability to understand and the willingness to accept the information by decision-makers, high professional sense in dealing with certain issues, validity of the information based on the high quality research performed by credible and prestigious scientists (consistent with other scientists) that is delivered on time and in suitable way. However, even there exists the rule (informal or formal guidelines) about the provision of certain information routinely (that is likely to be more influential that not existence of such a rule), does not guarantee the influence on specific decisions. As well, even information is acquired by the agency staff it can be for the reason of protecting the agency from appeals in the court or just to increase general credibility to their superiors. Additionally, even the information is acquired and is highly credible will not guaranty legitimisation of decisions as it should not imply significant changes in existing policy tendency (Sabatier, 1978). Thus, mainly the information is ignored because of low validity or reliability issues and due to institutional beliefs system (even in case when information is acquired and assumed as valid). So, the LSK compared with scientific knowledge lacks attention by the policy analyst and tend to be ignored due to low credibility (Yanow, 2003). Besides above mentioned constraints regarding LSK, nowadays the ICT development makes easier to collect, store, retrieve and disseminate the local information from grass-root level and thus increasing the examples of demonstrating LSK usage. Internet (radio and mobile as well) has an increasing popularity (for the ones who has access to electricity and computer) because of its potential of information management. In the field of disaster management, among others, the Web base technologies (Web 2.0, Google Earth, OpenStreetMap ) and other social networks (Twitter, YouTube, Blogs, Wikipedia, Facebook) are widely used already, especially in the cities where the internet access is not an obstacle (Lagmay, 2009; Subedi, 2010; White et al., 2010).
2.8. LSK and DRM
The literature, regarding local knowledge in relation to natural hazards and disasters is also increasing. For example, Peters et al (2005), assessed and generated flood risk maps in a data poor environment by collecting historical flood information from the local community to reconstruct a past event based on the community knowledge and to calibrate and verify the results of modelling. At the end, the data collected about flood events was combined with the data collected about elements at risk to calculate the possible total damage during the particular hazard scenario. So, LSK is vital for building the models, calibrate and validate them and achieve the better results than without using LSK. Kienberger & Steinbruch (2005) underline that PGIS and local knowledge are well suited and even crucial for successful vulnerability assessment of the community at risk. Tran et al (2009) stresses the need of integrating the modern technology and local knowledge during the map making. They demonstrate the importance of using community knowledge during vulnerability analysis as it provides vital factual data and ideas about social and physical environment and enables local community to participate actively in the decision-making processes. Later on, Peters, et al (2009) demonstrated that local community knowledge related to flooding can be systematically structured into (non) spatial information within GIS environment, thus, making LSK accessible to external actors for better understanding the flood problems and foster debates to enhance the capacity for different flood events. Also, the article outlines that mapping capacities (coping strategies or manageability) helps authorities to understand and recognise those who are more vulnerable during the certain level of hazard and can be prioritised for assisting the external support. Moreover, the process framework was developed as the first important steps to combine local and external (scientific) knowledge for community vulnerability and environmental hazard reduction by Mercer et al (2010). Some disadvantages of local knowledge are:
Local knowledge can reflect local power. If local knowledge is designed by the dominant individuals in the community, than project/programme results will not be in favour of vulnerable people, and the information retrieved from locals will not represent all community priorities.
Beliefs that the scientific knowledge is superior to local knowledge;
Local knowledge is difficult to identify as they are complex, diverse and changeable(Dekens, 2007);
ASSESSING THE FEASIBILITY OF USING LOCAL SPATIAL KNOWELDGE IN DISASTER RISK MANAGEMENT IN GEORGIA
13
Local knowledge (unlike scientific knowledge) lack universal application and is relevant to specific environment (Bankoff, 2004).
The LSK usually collected from community members regarding hazards, vulnerability and capacity at HH level are: Hazard – hazardous event location, date, depth, duration, frequency, triggering factors, damaged caused, etc. (Peters, et al., 2009; Tran, et al., 2009). Vulnerability - Structural vulnerability for HHs can be the age of the house construction and its quality, material type and number of floors (Schneiderbauer & Ehrlich, 2006); The social and economic vulnerability at HH level includes demographic, social and economic issues: Age, income, health, physical and economic strength, HH saving and family insurance, dependency on subsistence farming, education and access to information (e.g. TV, Mobile, and internet) etc. All these parameters determine the physical or economic strength of the HH and its dependence on external help (Schneiderbauer & Ehrlich, 2006). Capacity - Individual’s health and education can partly explain the general coping capacity to deal with the hazards and disasters. The existence of social neighbourhood network can be a strong capacity for the HHs as well (Schneiderbauer & Ehrlich, 2006). The other information about the capacity of the HH level can be a good physical strength, savings, health or education that is the opposite of vulnerability and will be a repetition of the indicators if it will be included as a capacity. Thus, as was mentioned in section 2.2.3, this is a negative side of including the capacity as characteristics of elements at risk (HHs). So, between the two approaches of capacity incorporation for risk conceptualisation, the subsumed capacities in vulnerability factors can be assumed as a better solution (equation[1] and [3]), where can be added general qualitative descriptions about capacity/coping mechanisms oriented on group or at a whole community.
2.9. PGIS tools for DRM
PGIS is a method that enables to map community, HH or individuals priorities, values or perceptions, stimulates community involvment and avtivities towards the problem solution, enables LSK to be reahced to the outsiders (or higher level authorities) to make better informed decisions (McCall, 2010). The PGIS is assumed as an optimal method for LSK aqusiotion. The LSK aquisition using participatory methods are made usually on HHs (or individual) level using structured, semi-structured intrrviews or on group/communityr level during community meetings and discussions. Often the combination of both of them are needed. The LSK aquisition using participatory methods are made usually on HHs (or individual) level using structured, semi-structured intrrviews or on group/communityr level during community meetings and discussions. Often the combination of both of them are needed.Mainly, PGIS assumes using Mobile GIS during houhold interviews: Mobile GIS (ArcPad, CT) –Is a device that is connected to GPS via Bluetooth and is used on the field for data collection. The advantages of the tools are: entering the data easier (faster) than using papers and pans when performing the structured interviews; it is easier to transfer collected local knowledge to the data base; the data is geo-referenced. Some of the disadvantages are: if data is descriptive it is more difficult to record it via device; during the fieldwork the programme can fail technically (e.g. run out of battery) and cause the data loss. Within the tools ArcPad and CT there are several differences. Thus, the advantages of CT over ArcPad are: CT is more user friendly during data collection and more easier to use and learn than PDA and it does not require the knowledge of GIS (but requires basic knowledge of database when designing the sequences), as well the CT program is being free, it incorporates free Google images, the data can be transferred and used in free GIS software (e.g. ILWIS). However, ArcPad has its advantages over CT too: mapping, displaying and editing of objects are easier, more powerful in creating shape files and directly transferring data in GIS without modification. The tables of transferred data in database can be linked as in relational databases (but in CB data can be transfer in MS Access and restructured afterwards) (Beyers, 2004; Peters & McCall, 2010). During the community meetings and discussions are used as traditional participatory methods like seasonal calendar (to acquire information about seasonal activities, hazards and disasters), timeline (gather

ASSESSING THE FEASIBILITY OF USING LOCAL SPATIAL KNOWELDGE IN DISASTER RISK MANAGEMENT IN GEORGIA
14
the information about significant hazard events that occur in the village), and ranking (to priorities community problems, vulnerabilities or needs for the risk reduction) sketch mapping (displays the LSK of the community about hazards extend, social economic or community capacity data) (Abarquez & Murshed, 2004) as well more innovative methods using GPS, GIS or RS such as: P3DM is a PGIS tool that integrates LSK. The main advantages of the tool are: it is user friendly, gathered knowledge is scaled, geo-referenced, gathers people together to share and code their knowledge. The main disadvantages are: creating of 3D models are time consuming as are not portable; additionally, extracting the outputs with digital camera are not easy and requires time (Rambaldi, 2010). Photo mapping or satellite imagery mapping – The photo mapping has its advantages over satellite/aerial imagery mapping as photomaps are geometrically corrected by the aerial photographs that has the coordinate system while satellite imagery are not. Thus photomapping are user friendly and accurate tools for mapping the local knowledge. The main disadvantage of photo mapping is that usually they are not available or are too expensive while satellite imagery from Google Earth is free (but can be of bad quality for the particular areas) (Rambaldi, et al., 2006). Mobile phones and the Internet for LSK collecting: Can be designed a system in such a way that individual LSK can be collected though SMS or via Web that can be afterward classified and geo-referenced (Freifeld et al., 2010). Some other tools (individual or group) using internet for LSK mapping and sharing is Community Information system (CIS), where selected individuals are trained and together with other community members (elderly) record and share the LSK (iapad, 2004). Other participatory web-based mapping technologies that generate citizen, community knowledge was already mentioned in in section 2.7.
2.10. Summary
This chapter discusses the general concept regarding DRM and LSK. From the beginning the chapter was describing the terms related to natural disaster risk. It is obvious that in DRM there are various discourses about different concepts such as vulnerability and capacity that make it more complicated to conceptualise the risk itself. In the next part of the chapter, is presented the role of the governance in DRM and the shift in paradigm towards disaster prevention from disaster respond and recovery, thus more orienting on community based disaster risk reduction and community participation where local practices and knowledge are important factors. Later, chapter continues to discuss about local (spatial) knowledge, implications of using them and examples of using local knowledge for DRM. The chapter 2 also present several constraints of using LSK. LSK are usually ignored by the decision makers as are considered not reliable. Information acquisition and utilisation is largely depends on the institutional beliefs that can be changed due to several issues: perception of the problem (e.g. disaster and related issues) and the existing objectives in policy agenda, available resources in the institutions, the outside pressure and interventions by the actors, etc. the outside actors itself depends on the factors such as available recourses, perceptions, values and motivations. So, using LSK depends on mentioned factors and beliefs of civil society, private sector or government. The important fact that facilitates using LSK in institutions is ICT development and increasing examples of using local information from local level to higher level institutions. Finally, the chapter ends with discussing PGIS and its tools as the most relevant method for LSK. The next chapter presents the country analysis regarding DRM and LSK.
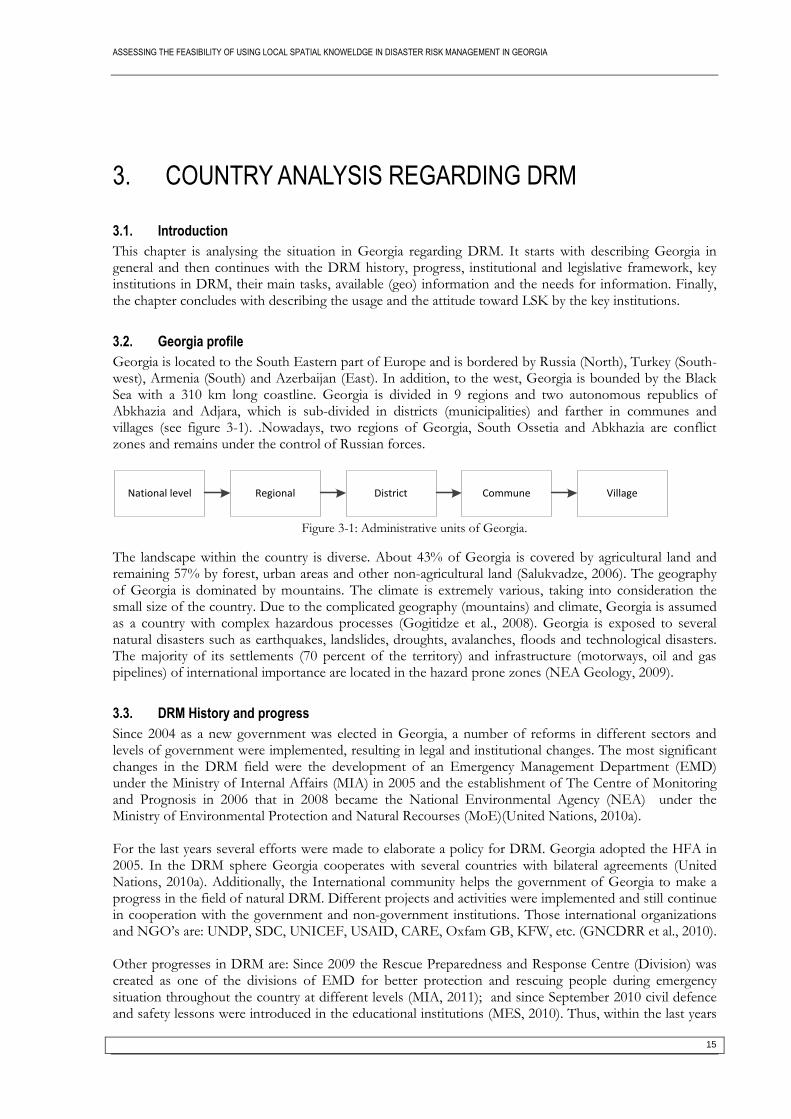
ASSESSING THE FEASIBILITY OF USING LOCAL SPATIAL KNOWELDGE IN DISASTER RISK MANAGEMENT IN GEORGIA
15
3. COUNTRY ANALYSIS REGARDING DRM
3.1. Introduction
This chapter is analysing the situation in Georgia regarding DRM. It starts with describing Georgia in general and then continues with the DRM history, progress, institutional and legislative framework, key institutions in DRM, their main tasks, available (geo) information and the needs for information. Finally, the chapter concludes with describing the usage and the attitude toward LSK by the key institutions.
3.2. Georgia profile
Georgia is located to the South Eastern part of Europe and is bordered by Russia (North), Turkey (South-west), Armenia (South) and Azerbaijan (East). In addition, to the west, Georgia is bounded by the Black Sea with a 310 km long coastline. Georgia is divided in 9 regions and two autonomous republics of Abkhazia and Adjara, which is sub-divided in districts (municipalities) and farther in communes and villages (see figure 3-1). .Nowadays, two regions of Georgia, South Ossetia and Abkhazia are conflict zones and remains under the control of Russian forces.
National level Regional District Commune Village
Figure 3-1: Administrative units of Georgia.
The landscape within the country is diverse. About 43% of Georgia is covered by agricultural land and remaining 57% by forest, urban areas and other non-agricultural land (Salukvadze, 2006). The geography of Georgia is dominated by mountains. The climate is extremely various, taking into consideration the small size of the country. Due to the complicated geography (mountains) and climate, Georgia is assumed as a country with complex hazardous processes (Gogitidze et al., 2008). Georgia is exposed to several natural disasters such as earthquakes, landslides, droughts, avalanches, floods and technological disasters. The majority of its settlements (70 percent of the territory) and infrastructure (motorways, oil and gas pipelines) of international importance are located in the hazard prone zones (NEA Geology, 2009).
3.3. DRM History and progress
Since 2004 as a new government was elected in Georgia, a number of reforms in different sectors and levels of government were implemented, resulting in legal and institutional changes. The most significant changes in the DRM field were the development of an Emergency Management Department (EMD) under the Ministry of Internal Affairs (MIA) in 2005 and the establishment of The Centre of Monitoring and Prognosis in 2006 that in 2008 became the National Environmental Agency (NEA) under the Ministry of Environmental Protection and Natural Recourses (MoE)(United Nations, 2010a). For the last years several efforts were made to elaborate a policy for DRM. Georgia adopted the HFA in 2005. In the DRM sphere Georgia cooperates with several countries with bilateral agreements (United Nations, 2010a). Additionally, the International community helps the government of Georgia to make a progress in the field of natural DRM. Different projects and activities were implemented and still continue in cooperation with the government and non-government institutions. Those international organizations and NGO’s are: UNDP, SDC, UNICEF, USAID, CARE, Oxfam GB, KFW, etc. (GNCDRR et al., 2010). Other progresses in DRM are: Since 2009 the Rescue Preparedness and Response Centre (Division) was created as one of the divisions of EMD for better protection and rescuing people during emergency situation throughout the country at different levels (MIA, 2011); and since September 2010 civil defence and safety lessons were introduced in the educational institutions (MES, 2010). Thus, within the last years

ASSESSING THE FEASIBILITY OF USING LOCAL SPATIAL KNOWELDGE IN DISASTER RISK MANAGEMENT IN GEORGIA
16
Georgia had a progress in DRM but still all the disaster management activities in Georgia are concentrated on emergency response (except introducing civil defence and safety lessons).
3.4. Legislative framework in DRM
Despite several limitations (lack of expertise, human resources and finances), the Georgian government is trying to progress to make a better legal framework in DRM. First legislative documentation in Georgia regarding DRR dates back after the World War II, and it was mainly oriented on technological hazards like nuclear exposure. However, as there were no technological hazards afterwards but damages caused by the natural hazards were increasing worldwide, in many developed countries varies national programs regarding natural DRM were implemented and Georgia joined in this process in 1995. Disaster management activities in Georgia are led by the two main legal and regulatory acts supported by several normative acts adopted in different years. The two main legal acts are:
“The law of Georgia on State of Emergency” (1997) concentrating on post disaster phases only.
“The law of Georgia on the protection of the territory and population from emergency situations caused by natural and technological disasters” (2007). This law is also oriented on disaster response and gives minor attention to pre disaster phases (United Nations, 2010a).
Overall, Georgian legislation related to natural DRM is very vague. Normative acts that are used as the terminology regarding DRM are incomplete and create problems for the further utilization of laws. The main reason for this are: limited resources, expertise and lack of participation and coordination throughout the government sectors. The allocation of responsibilities, subordination or accountability within different sectors and levels of government are not considered in laws or are not clearly defined. The issues about the public participation or information provision are not clearly defined as well (Gogitidze, et al., 2008). The Spatial data Infrastructure (SDI) within the government sectors is not defined by the legislation and even challenges the effective functioning of DRM.
3.5. Institutional framework in DRM
The institutional framework of natural DRM in Georgia is very complicated and creates obstacles for effective DRM. Institutions are scattered through several government sectors. The main institution in DRM which is responsible for policy making and advising the President is the National Security Council (NSC). According to the legislation, at different DRM phases different sectors of the government, individuals and legal entities are participating. The EMD MIA is responsible for the emergency management during natural or manmade disasters and in the short term of the post disaster period. The functions of monitoring, forecasting and the prevention of natural disasters are allocated to the MoE (that is a national focal point in implementation of the HFA 2005-2015), different legal entities of the public law in subordination of the Ministry, other legal entities and commission at different levels(Gogitidze, et al., 2008). The organizational structure of DRM at different levels of governance is presented in figure 3-2.
President Parliament MinistriesOther legal
entities
Local administration
(Chair)
Branch of ministries
Branch officies
Local administration (Mayor) and relevant services ( police, emergency, rescuers, fire brigade)
Mayor
Mayor representative
Permanent Commissions
Permanent Commissions
Temporal Commissions
Temporal Commissions
Temporal Commissions
National level
Regional level
Municipality level
Commune level
Village level
Figure 3-2: Organizational structure of DRM at different levels of governance (Gogitidze, et al., 2008)
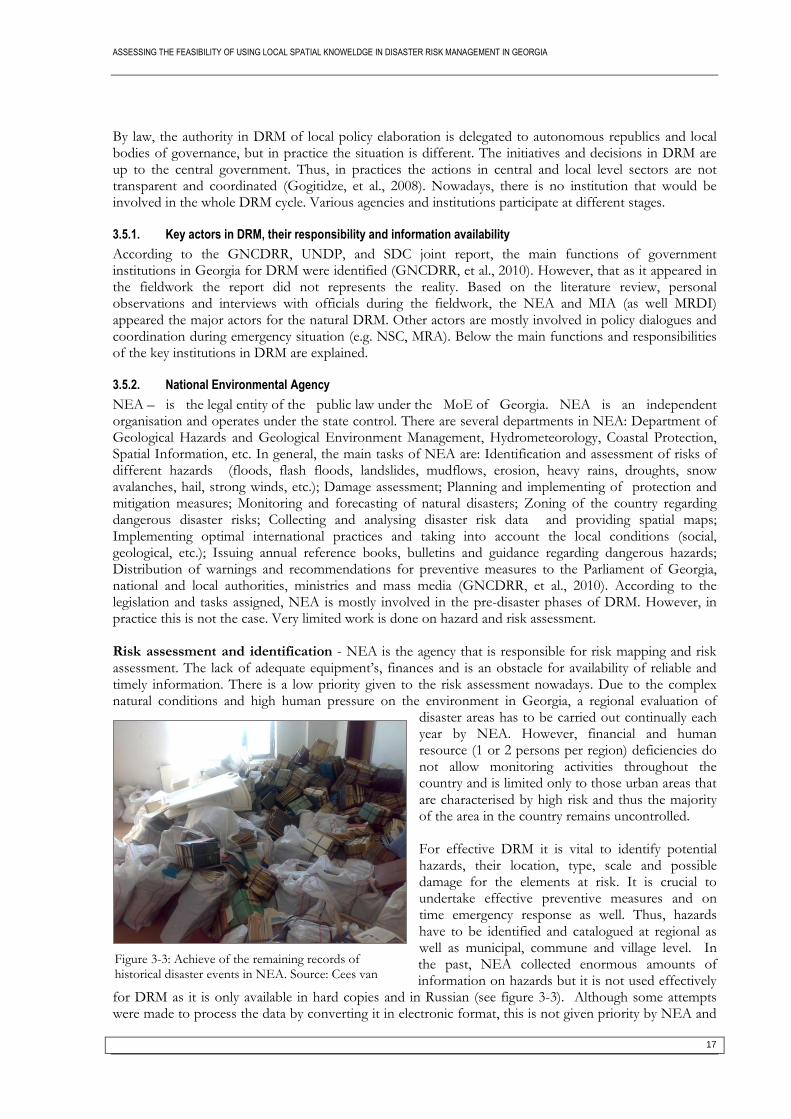
ASSESSING THE FEASIBILITY OF USING LOCAL SPATIAL KNOWELDGE IN DISASTER RISK MANAGEMENT IN GEORGIA
17
By law, the authority in DRM of local policy elaboration is delegated to autonomous republics and local bodies of governance, but in practice the situation is different. The initiatives and decisions in DRM are up to the central government. Thus, in practices the actions in central and local level sectors are not transparent and coordinated (Gogitidze, et al., 2008). Nowadays, there is no institution that would be involved in the whole DRM cycle. Various agencies and institutions participate at different stages.
3.5.1. Key actors in DRM, their responsibility and information availability
According to the GNCDRR, UNDP, and SDC joint report, the main functions of government institutions in Georgia for DRM were identified (GNCDRR, et al., 2010). However, that as it appeared in the fieldwork the report did not represents the reality. Based on the literature review, personal observations and interviews with officials during the fieldwork, the NEA and MIA (as well MRDI) appeared the major actors for the natural DRM. Other actors are mostly involved in policy dialogues and coordination during emergency situation (e.g. NSC, MRA). Below the main functions and responsibilities of the key institutions in DRM are explained.
3.5.2. National Environmental Agency
NEA – is the legal entity of the public law under the MoE of Georgia. NEA is an independent organisation and operates under the state control. There are several departments in NEA: Department of Geological Hazards and Geological Environment Management, Hydrometeorology, Coastal Protection, Spatial Information, etc. In general, the main tasks of NEA are: Identification and assessment of risks of different hazards (floods, flash floods, landslides, mudflows, erosion, heavy rains, droughts, snow avalanches, hail, strong winds, etc.); Damage assessment; Planning and implementing of protection and mitigation measures; Monitoring and forecasting of natural disasters; Zoning of the country regarding dangerous disaster risks; Collecting and analysing disaster risk data and providing spatial maps; Implementing optimal international practices and taking into account the local conditions (social, geological, etc.); Issuing annual reference books, bulletins and guidance regarding dangerous hazards; Distribution of warnings and recommendations for preventive measures to the Parliament of Georgia, national and local authorities, ministries and mass media (GNCDRR, et al., 2010). According to the legislation and tasks assigned, NEA is mostly involved in the pre-disaster phases of DRM. However, in practice this is not the case. Very limited work is done on hazard and risk assessment. Risk assessment and identification - NEA is the agency that is responsible for risk mapping and risk assessment. The lack of adequate equipment’s, finances and is an obstacle for availability of reliable and timely information. There is a low priority given to the risk assessment nowadays. Due to the complex natural conditions and high human pressure on the environment in Georgia, a regional evaluation of
disaster areas has to be carried out continually each year by NEA. However, financial and human resource (1 or 2 persons per region) deficiencies do not allow monitoring activities throughout the country and is limited only to those urban areas that are characterised by high risk and thus the majority of the area in the country remains uncontrolled. For effective DRM it is vital to identify potential hazards, their location, type, scale and possible damage for the elements at risk. It is crucial to undertake effective preventive measures and on time emergency response as well. Thus, hazards have to be identified and catalogued at regional as well as municipal, commune and village level. In the past, NEA collected enormous amounts of information on hazards but it is not used effectively
for DRM as it is only available in hard copies and in Russian (see figure 3-3). Although some attempts were made to process the data by converting it in electronic format, this is not given priority by NEA and
Figure 3-3: Achieve of the remaining records of historical disaster events in NEA. Source: Cees van Westen
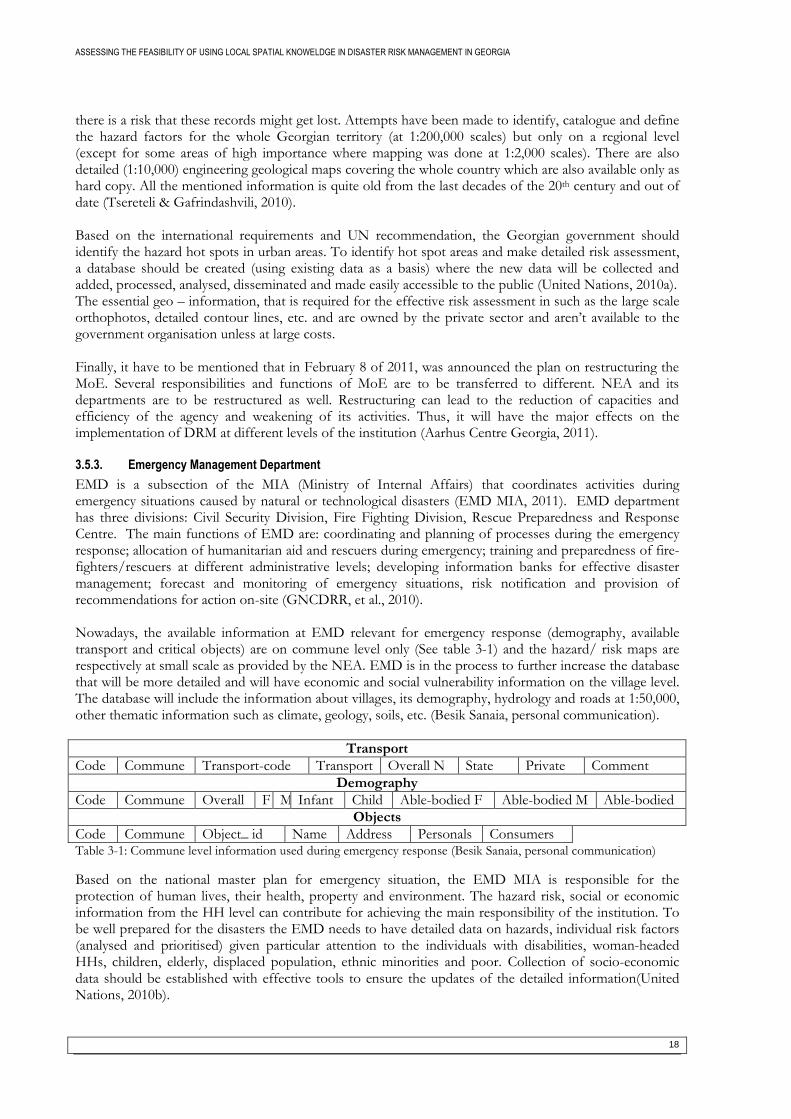
ASSESSING THE FEASIBILITY OF USING LOCAL SPATIAL KNOWELDGE IN DISASTER RISK MANAGEMENT IN GEORGIA
18
there is a risk that these records might get lost. Attempts have been made to identify, catalogue and define the hazard factors for the whole Georgian territory (at 1:200,000 scales) but only on a regional level (except for some areas of high importance where mapping was done at 1:2,000 scales). There are also detailed (1:10,000) engineering geological maps covering the whole country which are also available only as hard copy. All the mentioned information is quite old from the last decades of the 20th century and out of date (Tsereteli & Gafrindashvili, 2010). Based on the international requirements and UN recommendation, the Georgian government should identify the hazard hot spots in urban areas. To identify hot spot areas and make detailed risk assessment, a database should be created (using existing data as a basis) where the new data will be collected and added, processed, analysed, disseminated and made easily accessible to the public (United Nations, 2010a). The essential geo – information, that is required for the effective risk assessment in such as the large scale orthophotos, detailed contour lines, etc. and are owned by the private sector and aren’t available to the government organisation unless at large costs. Finally, it have to be mentioned that in February 8 of 2011, was announced the plan on restructuring the MoE. Several responsibilities and functions of MoE are to be transferred to different. NEA and its departments are to be restructured as well. Restructuring can lead to the reduction of capacities and efficiency of the agency and weakening of its activities. Thus, it will have the major effects on the implementation of DRM at different levels of the institution (Aarhus Centre Georgia, 2011).
3.5.3. Emergency Management Department
EMD is a subsection of the MIA (Ministry of Internal Affairs) that coordinates activities during emergency situations caused by natural or technological disasters (EMD MIA, 2011). EMD department has three divisions: Civil Security Division, Fire Fighting Division, Rescue Preparedness and Response Centre. The main functions of EMD are: coordinating and planning of processes during the emergency response; allocation of humanitarian aid and rescuers during emergency; training and preparedness of fire-fighters/rescuers at different administrative levels; developing information banks for effective disaster management; forecast and monitoring of emergency situations, risk notification and provision of recommendations for action on-site (GNCDRR, et al., 2010). Nowadays, the available information at EMD relevant for emergency response (demography, available transport and critical objects) are on commune level only (See table 3-1) and the hazard/ risk maps are respectively at small scale as provided by the NEA. EMD is in the process to further increase the database that will be more detailed and will have economic and social vulnerability information on the village level. The database will include the information about villages, its demography, hydrology and roads at 1:50,000, other thematic information such as climate, geology, soils, etc. (Besik Sanaia, personal communication).
Transport
Code Commune Transport-code Transport Overall N State Private Comment
Demography
Code Commune Overall F M Infant Child Able-bodied F Able-bodied M Able-bodied
Objects
Code Commune Object_ id Name Address Personals Consumers Table 3-1: Commune level information used during emergency response (Besik Sanaia, personal communication)
Based on the national master plan for emergency situation, the EMD MIA is responsible for the protection of human lives, their health, property and environment. The hazard risk, social or economic information from the HH level can contribute for achieving the main responsibility of the institution. To be well prepared for the disasters the EMD needs to have detailed data on hazards, individual risk factors (analysed and prioritised) given particular attention to the individuals with disabilities, woman-headed HHs, children, elderly, displaced population, ethnic minorities and poor. Collection of socio-economic data should be established with effective tools to ensure the updates of the detailed information(United Nations, 2010b).
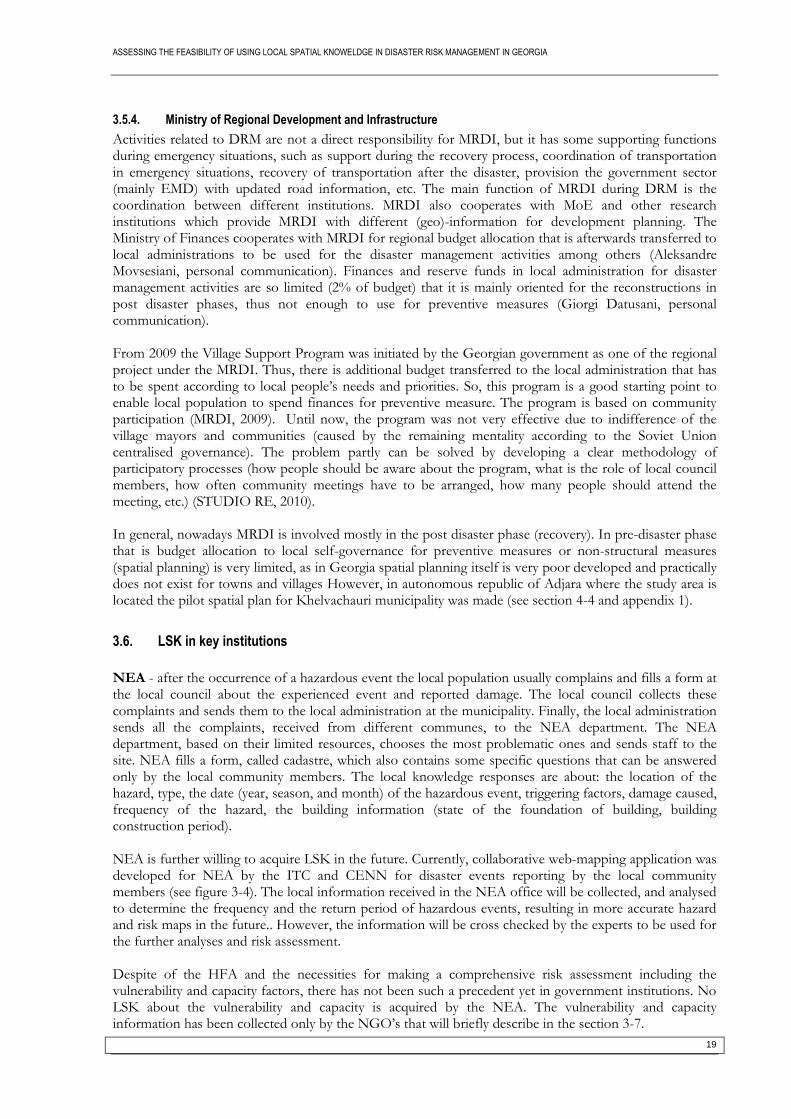
ASSESSING THE FEASIBILITY OF USING LOCAL SPATIAL KNOWELDGE IN DISASTER RISK MANAGEMENT IN GEORGIA
19
3.5.4. Ministry of Regional Development and Infrastructure
Activities related to DRM are not a direct responsibility for MRDI, but it has some supporting functions during emergency situations, such as support during the recovery process, coordination of transportation in emergency situations, recovery of transportation after the disaster, provision the government sector (mainly EMD) with updated road information, etc. The main function of MRDI during DRM is the coordination between different institutions. MRDI also cooperates with MoE and other research institutions which provide MRDI with different (geo)-information for development planning. The Ministry of Finances cooperates with MRDI for regional budget allocation that is afterwards transferred to local administrations to be used for the disaster management activities among others (Aleksandre Movsesiani, personal communication). Finances and reserve funds in local administration for disaster management activities are so limited (2% of budget) that it is mainly oriented for the reconstructions in post disaster phases, thus not enough to use for preventive measures (Giorgi Datusani, personal communication). From 2009 the Village Support Program was initiated by the Georgian government as one of the regional project under the MRDI. Thus, there is additional budget transferred to the local administration that has to be spent according to local people’s needs and priorities. So, this program is a good starting point to enable local population to spend finances for preventive measure. The program is based on community participation (MRDI, 2009). Until now, the program was not very effective due to indifference of the village mayors and communities (caused by the remaining mentality according to the Soviet Union centralised governance). The problem partly can be solved by developing a clear methodology of participatory processes (how people should be aware about the program, what is the role of local council members, how often community meetings have to be arranged, how many people should attend the meeting, etc.) (STUDIO RE, 2010). In general, nowadays MRDI is involved mostly in the post disaster phase (recovery). In pre-disaster phase that is budget allocation to local self-governance for preventive measures or non-structural measures (spatial planning) is very limited, as in Georgia spatial planning itself is very poor developed and practically does not exist for towns and villages However, in autonomous republic of Adjara where the study area is located the pilot spatial plan for Khelvachauri municipality was made (see section 4-4 and appendix 1).
3.6. LSK in key institutions
NEA - after the occurrence of a hazardous event the local population usually complains and fills a form at the local council about the experienced event and reported damage. The local council collects these complaints and sends them to the local administration at the municipality. Finally, the local administration sends all the complaints, received from different communes, to the NEA department. The NEA department, based on their limited resources, chooses the most problematic ones and sends staff to the site. NEA fills a form, called cadastre, which also contains some specific questions that can be answered only by the local community members. The local knowledge responses are about: the location of the hazard, type, the date (year, season, and month) of the hazardous event, triggering factors, damage caused, frequency of the hazard, the building information (state of the foundation of building, building construction period). NEA is further willing to acquire LSK in the future. Currently, collaborative web-mapping application was developed for NEA by the ITC and CENN for disaster events reporting by the local community members (see figure 3-4). The local information received in the NEA office will be collected, and analysed to determine the frequency and the return period of hazardous events, resulting in more accurate hazard and risk maps in the future.. However, the information will be cross checked by the experts to be used for the further analyses and risk assessment. Despite of the HFA and the necessities for making a comprehensive risk assessment including the vulnerability and capacity factors, there has not been such a precedent yet in government institutions. No LSK about the vulnerability and capacity is acquired by the NEA. The vulnerability and capacity information has been collected only by the NGO’s that will briefly describe in the section 3-7.
ASSESSING THE FEASIBILITY OF USING LOCAL SPATIAL KNOWELDGE IN DISASTER RISK MANAGEMENT IN GEORGIA
20
Figure 3-4: Webpage interface for reporting disaster events in Georgia.
EMD MIA uses Local Spatial Knowledge in post disaster phase. If the ministry receives a warning message about a hazardous event, for the purpose of investigation of the damaged area, the staff is sent to make a rapid survey. On the site they ask local people about damage caused by the event. The collected information is used to estimate the damage. EMD is willing to use community based generated information on hazards and vulnerability countrywide for better disaster preparedness and response. EMD is eager to create a data base for the purpose of effective emergency response, but as the data on economic or social vulnerability is dynamic, the database needs to be constantly updated. Updating process is difficult due to the lack of finances. EMD is looking for a method or tool that will generate and update local information in a timely and cost effective way (e.g. web mapping or mobile phones reports). MRDI basically uses LSK since 2009 when the Village Support Program was initiated. For example, coping capacity of the local people, their primary needs and priorities that they cannot manage by themselves and thus need external assistance. This kind of information is important on local administrative levels where the budget allocation has to be decided. The MRDI is eager to use local knowledge further to make better informed decisions by including the public priorities in activities needed for pre and post disaster phase.
3.7. LSK in Non-government institutions and mass media
According to the HFA apart from the government agencies, other actors should be involved in DRM including academic and research institutions, NGOs, mass media, civil society representatives, volunteers, etc. (United Nations, 2010a). Usually, national or international NGO’s (funded by the international organisations) are taking the leading role for assisting the Georgian government for effective DRM. Nowadays, several NGO’s are active in different DRM activates that uses the local knowledge. Some of the examples are: CENN is involved in majority of the activities of DRM phases, including recommendations to government, community based mitigation, response, recovery and educational and training programmes. CENN several times collected the LSK for DRM activities. For example, CENN made a fieldwork in Khelvachauri municipality to make a risk maps integrated with vulnerability factors on the commune level. It gathered the LSK from mayors and community members about hazards, as well about social and
ASSESSING THE FEASIBILITY OF USING LOCAL SPATIAL KNOWELDGE IN DISASTER RISK MANAGEMENT IN GEORGIA
21
economic vulnerability to enrich the fieldwork objective. Currently, CENN in cooperation with ITC is developing a web-site for collaborative mapping of disaster events, generated by the local people (Irakli Chachia, personal communication). Oxfam GB is also involved in several projects to strengthen the DRM in Georgia. Currently, Oxfam is implementing the project that aims to make a first precedent for the risk reduction (preventive measures) at village level. Oxfam collects the LSK from the community using PRA tools (seasonal calendar, timeline, ranking), thus prioritising the needs of the community for preventive measures and allocating the local administration finances (added to the project finances) according to their priorities. Also, the Oxfam GB, in cooperation with the government institutions of Georgia, is designing a common methodology for participatory risk assessment (Giorgi Datusani, personal communication). Except NGO’s the mass media is also an important actor in DRM. The hazardous events information passed by the Media such as Television and newspaper that is based on the local knowledge are sometimes recorded and used by the institutions (e.g. NEA). As NEA has limited resources and are not able to perform the monitoring throughout the country, the Media reports are used for necessary data gathering. For example, Rustavi 2 Georgian broadcasting company has a vast amount of accumulated information on hazardous events that could be optimally shared via web portal and used by the relevant DRM actors. Media has a high potential to increase the awareness about the local hazards, and may also stimulate the government activities.
3.8. Summary
This chapter described and analysed the situation in Georgia related to DRM and LSK. The main findings are:
In general, DRM is very weak in the country as the legislative and institutional framework is vague and unclear caused by lack of expertise, coordination and participation of different stakeholders across government sectors and level;
The local government is important for an effective local DRM, however in reality, the decisions are still up to the central government;
DRM in Georgia is more disaster response oriented than towards disaster prevention and mitigation;
The risk identification and assessment, as a core for the effective disaster management and risk reduction is weak and not prioritised by the government;
The coordination and the collaboration within government sectors (NEA, EMD) are not ideal. The tasks (e.g. damage assessment), the information provision and data share (SDI) is not clear or does not exists at all in legislation and often brings confusion and difficulties;
The key institutions lack information that is essential for an effective DRM and the resources are not adequate to acquire relevant information (owned by the private sectors).
Thus, as a solution, the necessary information (hazard, vulnerability, capacity) can be collected from the community members to fill the databases. The local knowledge about hazardous events is usually used by the government institutions such as EMD, NEA, MRDI (but not well structured) and by the NGO’s and Media. The next chapter explains how secondary and primary data regarding LSK about hazard, vulnerability and coping capacity was collected from community members, mayors and institutions.

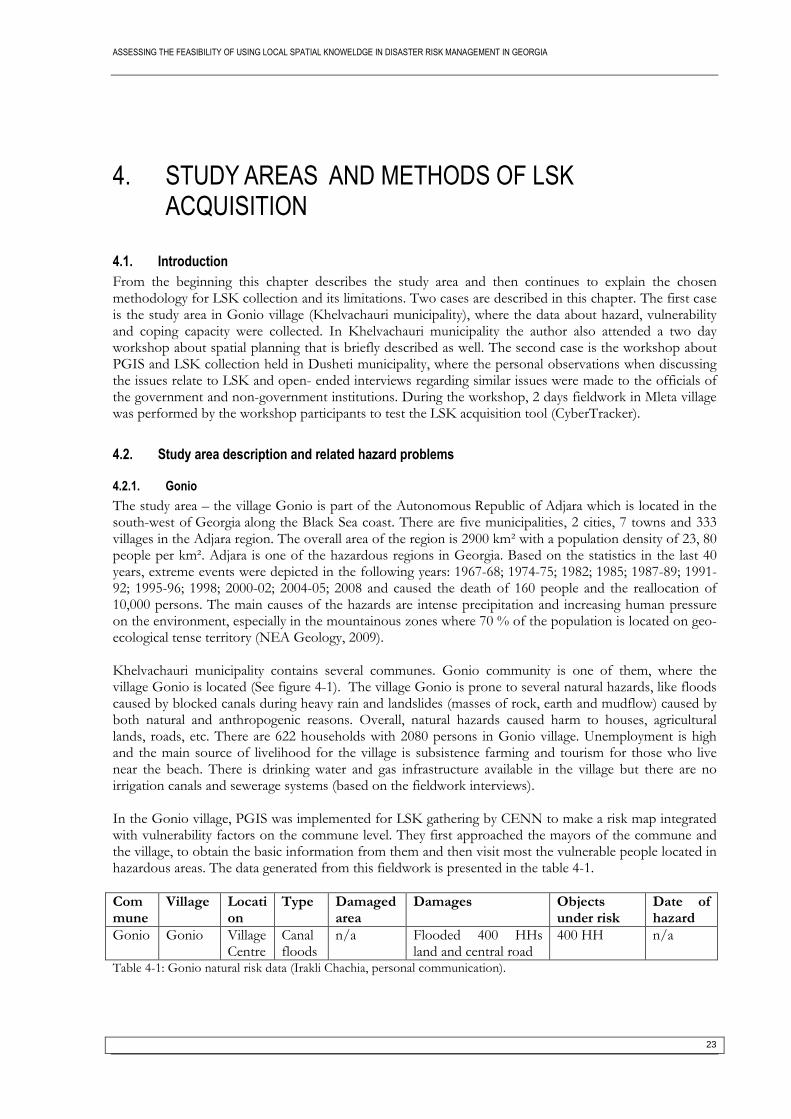
ASSESSING THE FEASIBILITY OF USING LOCAL SPATIAL KNOWELDGE IN DISASTER RISK MANAGEMENT IN GEORGIA
23
4. STUDY AREAS AND METHODS OF LSK ACQUISITION
4.1. Introduction
From the beginning this chapter describes the study area and then continues to explain the chosen methodology for LSK collection and its limitations. Two cases are described in this chapter. The first case is the study area in Gonio village (Khelvachauri municipality), where the data about hazard, vulnerability and coping capacity were collected. In Khelvachauri municipality the author also attended a two day workshop about spatial planning that is briefly described as well. The second case is the workshop about PGIS and LSK collection held in Dusheti municipality, where the personal observations when discussing the issues relate to LSK and open- ended interviews regarding similar issues were made to the officials of the government and non-government institutions. During the workshop, 2 days fieldwork in Mleta village was performed by the workshop participants to test the LSK acquisition tool (CyberTracker).
4.2. Study area description and related hazard problems
4.2.1. Gonio
The study area – the village Gonio is part of the Autonomous Republic of Adjara which is located in the south-west of Georgia along the Black Sea coast. There are five municipalities, 2 cities, 7 towns and 333 villages in the Adjara region. The overall area of the region is 2900 km² with a population density of 23, 80 people per km². Adjara is one of the hazardous regions in Georgia. Based on the statistics in the last 40 years, extreme events were depicted in the following years: 1967-68; 1974-75; 1982; 1985; 1987-89; 1991-92; 1995-96; 1998; 2000-02; 2004-05; 2008 and caused the death of 160 people and the reallocation of 10,000 persons. The main causes of the hazards are intense precipitation and increasing human pressure on the environment, especially in the mountainous zones where 70 % of the population is located on geo-ecological tense territory (NEA Geology, 2009). Khelvachauri municipality contains several communes. Gonio community is one of them, where the village Gonio is located (See figure 4-1). The village Gonio is prone to several natural hazards, like floods caused by blocked canals during heavy rain and landslides (masses of rock, earth and mudflow) caused by both natural and anthropogenic reasons. Overall, natural hazards caused harm to houses, agricultural lands, roads, etc. There are 622 households with 2080 persons in Gonio village. Unemployment is high and the main source of livelihood for the village is subsistence farming and tourism for those who live near the beach. There is drinking water and gas infrastructure available in the village but there are no irrigation canals and sewerage systems (based on the fieldwork interviews). In the Gonio village, PGIS was implemented for LSK gathering by CENN to make a risk map integrated with vulnerability factors on the commune level. They first approached the mayors of the commune and the village, to obtain the basic information from them and then visit most the vulnerable people located in hazardous areas. The data generated from this fieldwork is presented in the table 4-1.
Commune
Village Location
Type Damaged area
Damages Objects under risk
Date of hazard
Gonio Gonio Village Centre
Canal floods
n/a Flooded 400 HHs land and central road
400 HH n/a
Table 4-1: Gonio natural risk data (Irakli Chachia, personal communication).
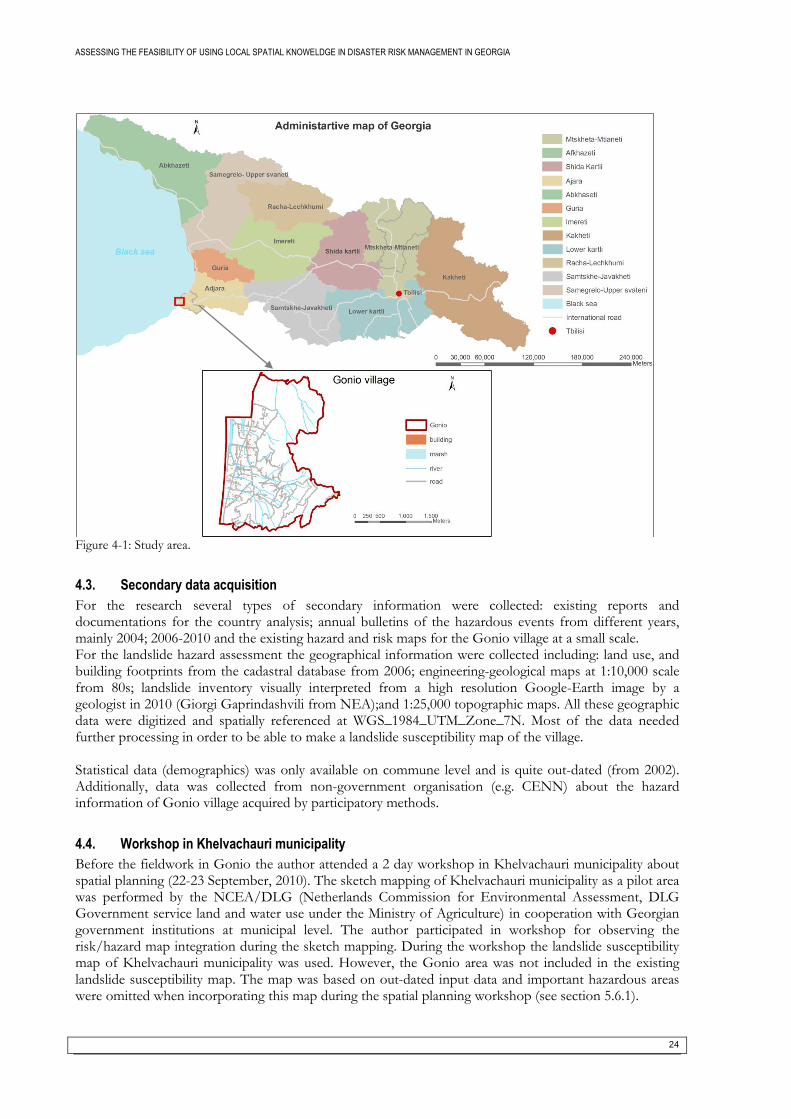
ASSESSING THE FEASIBILITY OF USING LOCAL SPATIAL KNOWELDGE IN DISASTER RISK MANAGEMENT IN GEORGIA
24
Figure 4-1: Study area.
4.3. Secondary data acquisition
For the research several types of secondary information were collected: existing reports and documentations for the country analysis; annual bulletins of the hazardous events from different years, mainly 2004; 2006-2010 and the existing hazard and risk maps for the Gonio village at a small scale. For the landslide hazard assessment the geographical information were collected including: land use, and building footprints from the cadastral database from 2006; engineering-geological maps at 1:10,000 scale from 80s; landslide inventory visually interpreted from a high resolution Google-Earth image by a geologist in 2010 (Giorgi Gaprindashvili from NEA);and 1:25,000 topographic maps. All these geographic data were digitized and spatially referenced at WGS_1984_UTM_Zone_7N. Most of the data needed further processing in order to be able to make a landslide susceptibility map of the village. Statistical data (demographics) was only available on commune level and is quite out-dated (from 2002). Additionally, data was collected from non-government organisation (e.g. CENN) about the hazard information of Gonio village acquired by participatory methods.
4.4. Workshop in Khelvachauri municipality
Before the fieldwork in Gonio the author attended a 2 day workshop in Khelvachauri municipality about spatial planning (22-23 September, 2010). The sketch mapping of Khelvachauri municipality as a pilot area was performed by the NCEA/DLG (Netherlands Commission for Environmental Assessment, DLG Government service land and water use under the Ministry of Agriculture) in cooperation with Georgian government institutions at municipal level. The author participated in workshop for observing the risk/hazard map integration during the sketch mapping. During the workshop the landslide susceptibility map of Khelvachauri municipality was used. However, the Gonio area was not included in the existing landslide susceptibility map. The map was based on out-dated input data and important hazardous areas were omitted when incorporating this map during the spatial planning workshop (see section 5.6.1).
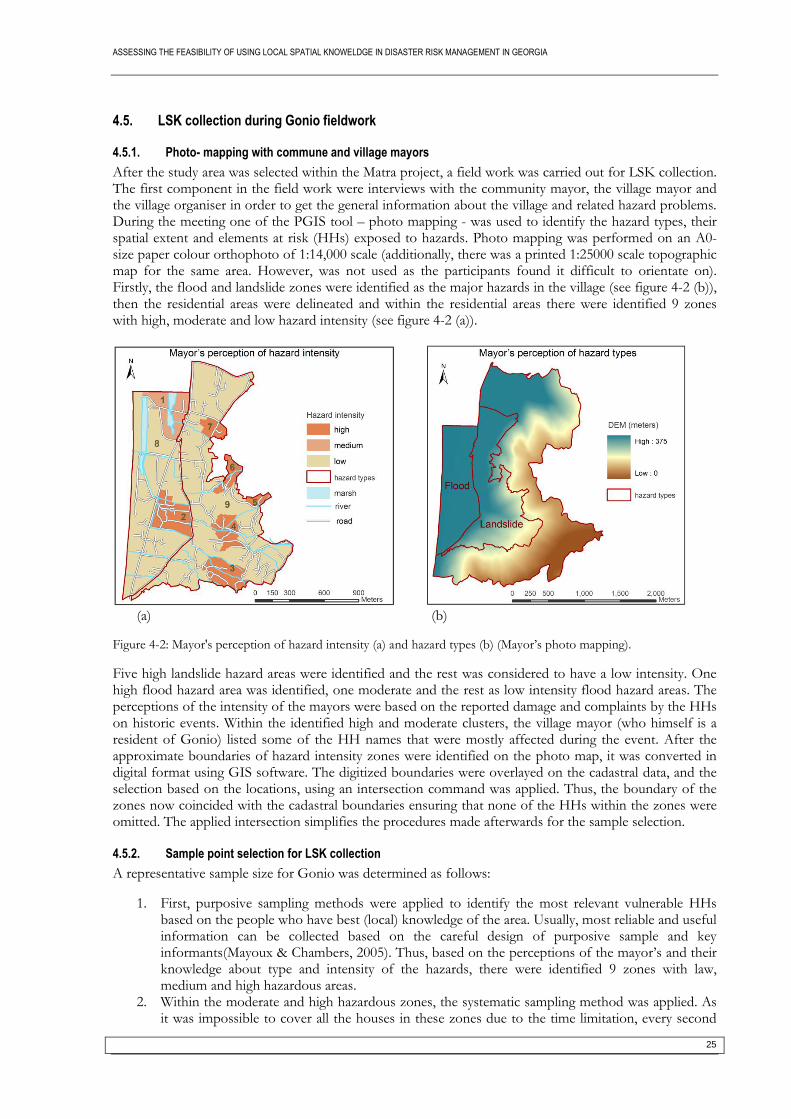
ASSESSING THE FEASIBILITY OF USING LOCAL SPATIAL KNOWELDGE IN DISASTER RISK MANAGEMENT IN GEORGIA
25
4.5. LSK collection during Gonio fieldwork
4.5.1. Photo- mapping with commune and village mayors
After the study area was selected within the Matra project, a field work was carried out for LSK collection. The first component in the field work were interviews with the community mayor, the village mayor and the village organiser in order to get the general information about the village and related hazard problems. During the meeting one of the PGIS tool – photo mapping - was used to identify the hazard types, their spatial extent and elements at risk (HHs) exposed to hazards. Photo mapping was performed on an A0-size paper colour orthophoto of 1:14,000 scale (additionally, there was a printed 1:25000 scale topographic map for the same area. However, was not used as the participants found it difficult to orientate on). Firstly, the flood and landslide zones were identified as the major hazards in the village (see figure 4-2 (b)), then the residential areas were delineated and within the residential areas there were identified 9 zones with high, moderate and low hazard intensity (see figure 4-2 (a)).
(a) (b)
Figure 4-2: Mayor's perception of hazard intensity (a) and hazard types (b) (Mayor’s photo mapping).
Five high landslide hazard areas were identified and the rest was considered to have a low intensity. One high flood hazard area was identified, one moderate and the rest as low intensity flood hazard areas. The perceptions of the intensity of the mayors were based on the reported damage and complaints by the HHs on historic events. Within the identified high and moderate clusters, the village mayor (who himself is a resident of Gonio) listed some of the HH names that were mostly affected during the event. After the approximate boundaries of hazard intensity zones were identified on the photo map, it was converted in digital format using GIS software. The digitized boundaries were overlayed on the cadastral data, and the selection based on the locations, using an intersection command was applied. Thus, the boundary of the zones now coincided with the cadastral boundaries ensuring that none of the HHs within the zones were omitted. The applied intersection simplifies the procedures made afterwards for the sample selection.
4.5.2. Sample point selection for LSK collection
A representative sample size for Gonio was determined as follows:
1. First, purposive sampling methods were applied to identify the most relevant vulnerable HHs based on the people who have best (local) knowledge of the area. Usually, most reliable and useful information can be collected based on the careful design of purposive sample and key informants(Mayoux & Chambers, 2005). Thus, based on the perceptions of the mayor’s and their knowledge about type and intensity of the hazards, there were identified 9 zones with law, medium and high hazardous areas.
2. Within the moderate and high hazardous zones, the systematic sampling method was applied. As it was impossible to cover all the houses in these zones due to the time limitation, every second
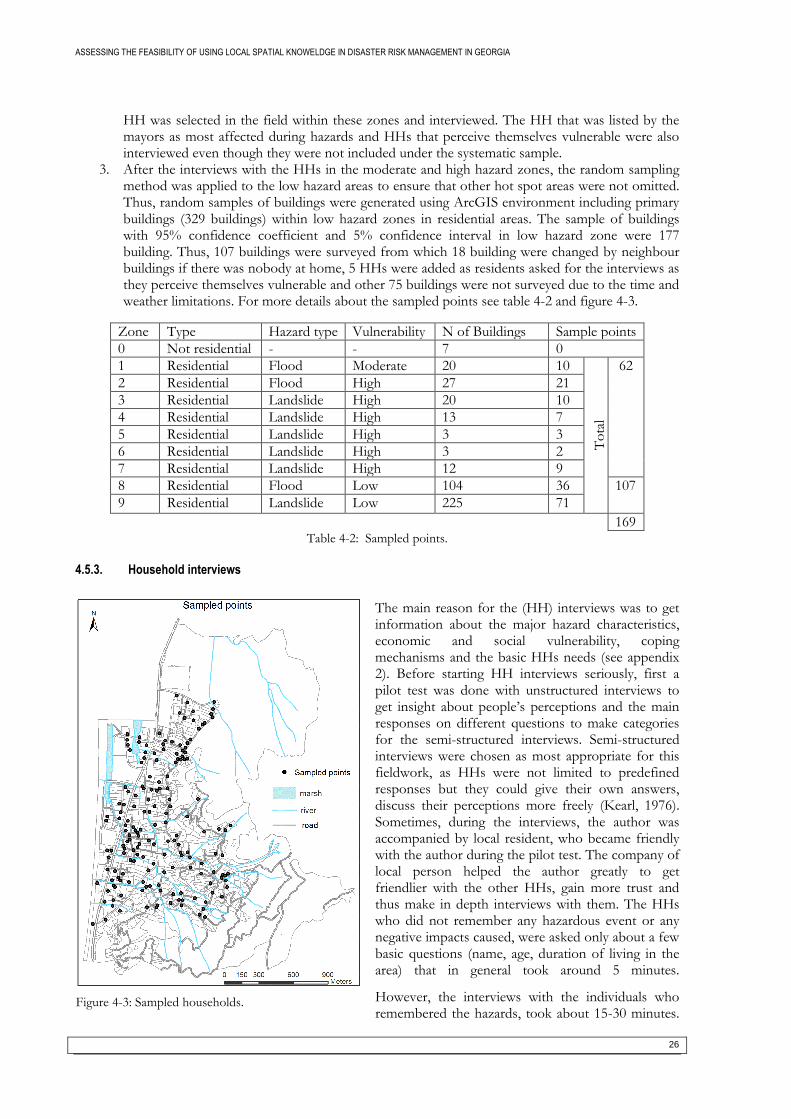
ASSESSING THE FEASIBILITY OF USING LOCAL SPATIAL KNOWELDGE IN DISASTER RISK MANAGEMENT IN GEORGIA
26
HH was selected in the field within these zones and interviewed. The HH that was listed by the mayors as most affected during hazards and HHs that perceive themselves vulnerable were also interviewed even though they were not included under the systematic sample.
3. After the interviews with the HHs in the moderate and high hazard zones, the random sampling method was applied to the low hazard areas to ensure that other hot spot areas were not omitted. Thus, random samples of buildings were generated using ArcGIS environment including primary buildings (329 buildings) within low hazard zones in residential areas. The sample of buildings with 95% confidence coefficient and 5% confidence interval in low hazard zone were 177 building. Thus, 107 buildings were surveyed from which 18 building were changed by neighbour buildings if there was nobody at home, 5 HHs were added as residents asked for the interviews as they perceive themselves vulnerable and other 75 buildings were not surveyed due to the time and weather limitations. For more details about the sampled points see table 4-2 and figure 4-3.
Zone Type Hazard type Vulnerability N of Buildings Sample points
0 Not residential - - 7 0
1 Residential Flood Moderate 20 10
To
tal
62
2 Residential Flood High 27 21
3 Residential Landslide High 20 10
4 Residential Landslide High 13 7
5 Residential Landslide High 3 3
6 Residential Landslide High 3 2
7 Residential Landslide High 12 9
8 Residential Flood Low 104 36 107
9 Residential Landslide Low 225 71
169 Table 4-2: Sampled points.
4.5.3. Household interviews
The main reason for the (HH) interviews was to get information about the major hazard characteristics, economic and social vulnerability, coping mechanisms and the basic HHs needs (see appendix 2). Before starting HH interviews seriously, first a pilot test was done with unstructured interviews to get insight about people’s perceptions and the main responses on different questions to make categories for the semi-structured interviews. Semi-structured interviews were chosen as most appropriate for this fieldwork, as HHs were not limited to predefined responses but they could give their own answers, discuss their perceptions more freely (Kearl, 1976). Sometimes, during the interviews, the author was accompanied by local resident, who became friendly with the author during the pilot test. The company of local person helped the author greatly to get friendlier with the other HHs, gain more trust and thus make in depth interviews with them. The HHs who did not remember any hazardous event or any negative impacts caused, were asked only about a few basic questions (name, age, duration of living in the area) that in general took around 5 minutes.
However, the interviews with the individuals who remembered the hazards, took about 15-30 minutes.
Figure 4-3: Sampled households.
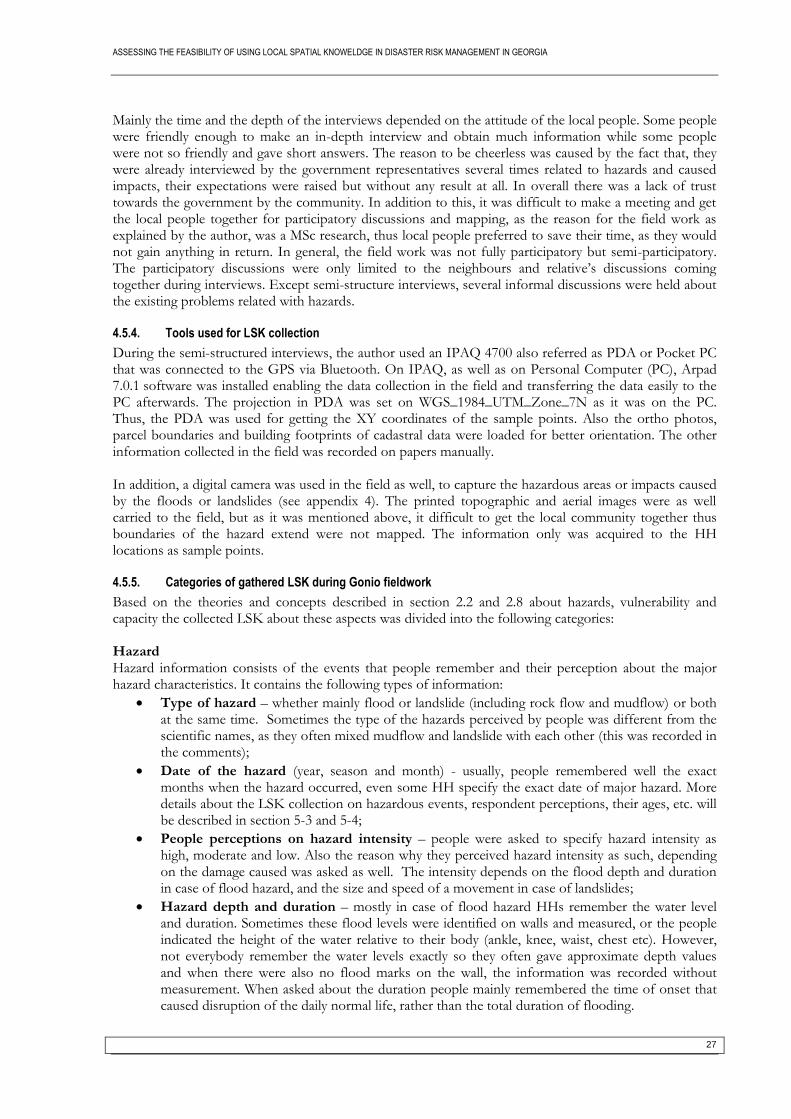
ASSESSING THE FEASIBILITY OF USING LOCAL SPATIAL KNOWELDGE IN DISASTER RISK MANAGEMENT IN GEORGIA
27
Mainly the time and the depth of the interviews depended on the attitude of the local people. Some people were friendly enough to make an in-depth interview and obtain much information while some people were not so friendly and gave short answers. The reason to be cheerless was caused by the fact that, they were already interviewed by the government representatives several times related to hazards and caused impacts, their expectations were raised but without any result at all. In overall there was a lack of trust towards the government by the community. In addition to this, it was difficult to make a meeting and get the local people together for participatory discussions and mapping, as the reason for the field work as explained by the author, was a MSc research, thus local people preferred to save their time, as they would not gain anything in return. In general, the field work was not fully participatory but semi-participatory. The participatory discussions were only limited to the neighbours and relative’s discussions coming together during interviews. Except semi-structure interviews, several informal discussions were held about the existing problems related with hazards.
4.5.4. Tools used for LSK collection
During the semi-structured interviews, the author used an IPAQ 4700 also referred as PDA or Pocket PC that was connected to the GPS via Bluetooth. On IPAQ, as well as on Personal Computer (PC), Arpad 7.0.1 software was installed enabling the data collection in the field and transferring the data easily to the PC afterwards. The projection in PDA was set on WGS_1984_UTM_Zone_7N as it was on the PC. Thus, the PDA was used for getting the XY coordinates of the sample points. Also the ortho photos, parcel boundaries and building footprints of cadastral data were loaded for better orientation. The other information collected in the field was recorded on papers manually. In addition, a digital camera was used in the field as well, to capture the hazardous areas or impacts caused by the floods or landslides (see appendix 4). The printed topographic and aerial images were as well carried to the field, but as it was mentioned above, it difficult to get the local community together thus boundaries of the hazard extend were not mapped. The information only was acquired to the HH locations as sample points.
4.5.5. Categories of gathered LSK during Gonio fieldwork
Based on the theories and concepts described in section 2.2 and 2.8 about hazards, vulnerability and capacity the collected LSK about these aspects was divided into the following categories: Hazard Hazard information consists of the events that people remember and their perception about the major hazard characteristics. It contains the following types of information:
Type of hazard – whether mainly flood or landslide (including rock flow and mudflow) or both at the same time. Sometimes the type of the hazards perceived by people was different from the scientific names, as they often mixed mudflow and landslide with each other (this was recorded in the comments);
Date of the hazard (year, season and month) - usually, people remembered well the exact months when the hazard occurred, even some HH specify the exact date of major hazard. More details about the LSK collection on hazardous events, respondent perceptions, their ages, etc. will be described in section 5-3 and 5-4;
People perceptions on hazard intensity – people were asked to specify hazard intensity as high, moderate and low. Also the reason why they perceived hazard intensity as such, depending on the damage caused was asked as well. The intensity depends on the flood depth and duration in case of flood hazard, and the size and speed of a movement in case of landslides;
Hazard depth and duration – mostly in case of flood hazard HHs remember the water level and duration. Sometimes these flood levels were identified on walls and measured, or the people indicated the height of the water relative to their body (ankle, knee, waist, chest etc). However, not everybody remember the water levels exactly so they often gave approximate depth values and when there were also no flood marks on the wall, the information was recorded without measurement. When asked about the duration people mainly remembered the time of onset that caused disruption of the daily normal life, rather than the total duration of flooding.
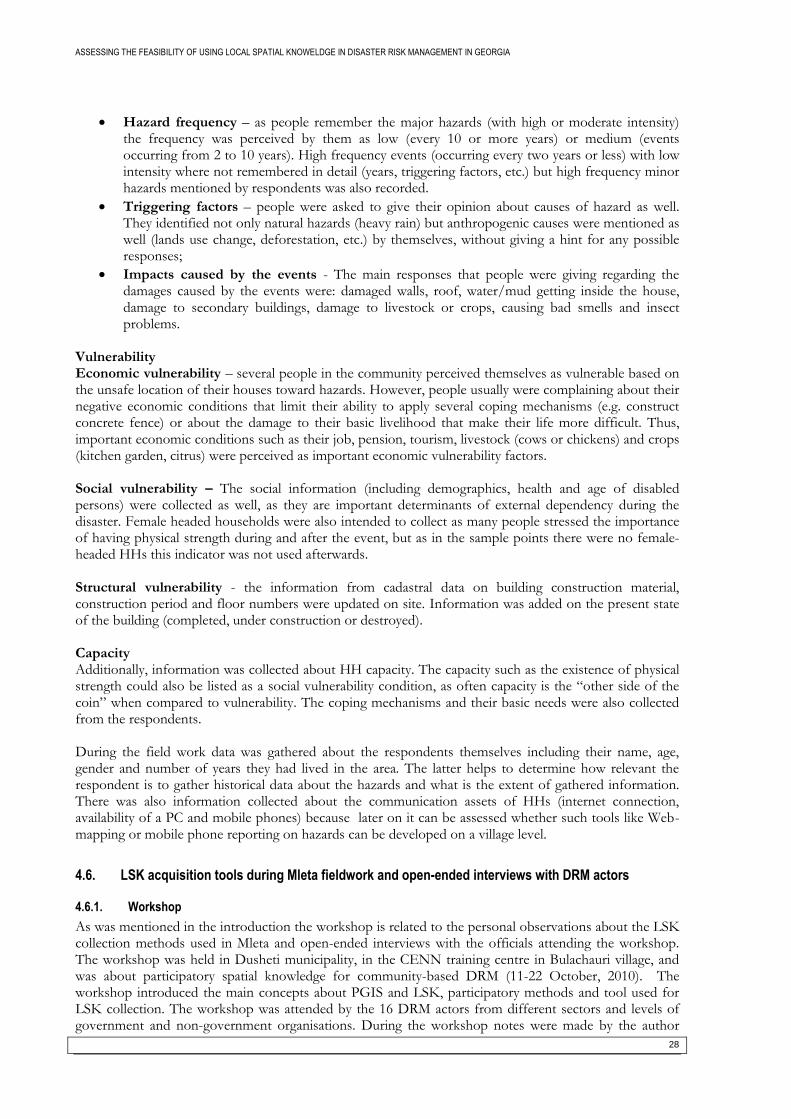
ASSESSING THE FEASIBILITY OF USING LOCAL SPATIAL KNOWELDGE IN DISASTER RISK MANAGEMENT IN GEORGIA
28
Hazard frequency – as people remember the major hazards (with high or moderate intensity) the frequency was perceived by them as low (every 10 or more years) or medium (events occurring from 2 to 10 years). High frequency events (occurring every two years or less) with low intensity where not remembered in detail (years, triggering factors, etc.) but high frequency minor hazards mentioned by respondents was also recorded.
Triggering factors – people were asked to give their opinion about causes of hazard as well. They identified not only natural hazards (heavy rain) but anthropogenic causes were mentioned as well (lands use change, deforestation, etc.) by themselves, without giving a hint for any possible responses;
Impacts caused by the events - The main responses that people were giving regarding the damages caused by the events were: damaged walls, roof, water/mud getting inside the house, damage to secondary buildings, damage to livestock or crops, causing bad smells and insect problems.
Vulnerability Economic vulnerability – several people in the community perceived themselves as vulnerable based on the unsafe location of their houses toward hazards. However, people usually were complaining about their negative economic conditions that limit their ability to apply several coping mechanisms (e.g. construct concrete fence) or about the damage to their basic livelihood that make their life more difficult. Thus, important economic conditions such as their job, pension, tourism, livestock (cows or chickens) and crops (kitchen garden, citrus) were perceived as important economic vulnerability factors. Social vulnerability – The social information (including demographics, health and age of disabled persons) were collected as well, as they are important determinants of external dependency during the disaster. Female headed households were also intended to collect as many people stressed the importance of having physical strength during and after the event, but as in the sample points there were no female-headed HHs this indicator was not used afterwards. Structural vulnerability - the information from cadastral data on building construction material, construction period and floor numbers were updated on site. Information was added on the present state of the building (completed, under construction or destroyed). Capacity Additionally, information was collected about HH capacity. The capacity such as the existence of physical strength could also be listed as a social vulnerability condition, as often capacity is the “other side of the coin” when compared to vulnerability. The coping mechanisms and their basic needs were also collected from the respondents. During the field work data was gathered about the respondents themselves including their name, age, gender and number of years they had lived in the area. The latter helps to determine how relevant the respondent is to gather historical data about the hazards and what is the extent of gathered information. There was also information collected about the communication assets of HHs (internet connection, availability of a PC and mobile phones) because later on it can be assessed whether such tools like Web-mapping or mobile phone reporting on hazards can be developed on a village level.
4.6. LSK acquisition tools during Mleta fieldwork and open-ended interviews with DRM actors
4.6.1. Workshop
As was mentioned in the introduction the workshop is related to the personal observations about the LSK collection methods used in Mleta and open-ended interviews with the officials attending the workshop. The workshop was held in Dusheti municipality, in the CENN training centre in Bulachauri village, and was about participatory spatial knowledge for community-based DRM (11-22 October, 2010). The workshop introduced the main concepts about PGIS and LSK, participatory methods and tool used for LSK collection. The workshop was attended by the 16 DRM actors from different sectors and levels of government and non-government organisations. During the workshop notes were made by the author
ASSESSING THE FEASIBILITY OF USING LOCAL SPATIAL KNOWELDGE IN DISASTER RISK MANAGEMENT IN GEORGIA
29
when participants were discussing among each other several issues related to LSK usage and the attitude toward LSK gathering. Also open-ended interviews with the actors were held on similar issues.
4.6.2. Cybertracker
During the workshop participants were given an introduction to several LSK collection tools using PGIS (using CT programme installed on an IPAQ and connected with GPS). Most time was dedicated to the CT exercises as it is a free programme and is relevant to use in Georgia taking into considerations financial limitations. The main advantages of CT are mentioned in section 2.9. The main disadvantages experienced in the field (Mleta village as study area) and reported by the actors are: Disadvantages
Beside that the CT program is free the IPAQs and Smartphones or GPS devises are not free (but getting cheaper and having potential to be more affordable in future);
Not all the satellite images from Google Earth are of high quality (as it was in Mleta case).
Based on the experiences and observations of the field work CB was not experienced as a user-friendly programme. It needs a lot of effort to design the screens and sequences of questionnaires that take much time of the participants.
Also using IPAQ with CT on the field has a lot of technical deficiencies that took time and needed external support to solve the technical problems. Thus, CT cannot be operated by ordinary people having no experiences of using CT.
And finally suing PDAs does not allow participation of more than 3 people simultaneously, thus LSK collection using strong participatory basis is not optimal using PDAs unless it is combined with other participatory tools and techniques.
Overall, CT was not assumed as relevant LSK collection tool for the existing situation in Georgia, as it requires training, device to install the program etc. Even smartphones are getting cheaper, it’s still not affordable for most of the people, especially in villages. However, the particular tools to be used for LSK collection can vary in different places within the country and needs individual approach.
4.6.3. Interviews with DRM actors
Open ended interviews with DRM actors were performed during the workshop as well outside the workshop. The full list of respondents can be seen in appendix 3. Open ended interviews were used as it was not aimed to get quantitative results from the interviews for statistical testing, but they rather were intended to be used for qualitative descriptions. This method allows respondents to reflect their ideas and give more information about an issue and is not limited in the answers. Nor digital recorder was used for the same reason, to not restrict the respondent for informal and open discussion. During interviews notes were made in the notebook by the author. The general questions asked to the respondents were about:
Describing the main task of the institution in DRM;
Explain if and how the institution uses LSK;
Give an example of LSK;
Tell if the institutions are willing to further acquire and utilise LSK;
And how the respondent foresees the process of LSK usage. Part of the answers by the respondents are summarised and presented in section 3.6, 4.6.3 and part will be presented in the chapter 6. These questions listed above were mainly asked to the government officials, and the actors from non- governmental institutions were asked if they have any experience of LSK gathering especially for the Gonio village.
4.7. Summary
This chapter described the data collection procedure in detail. First, a general overview of the study area was given and the method used during LSK gathering was described. As well there were described collected LSK in detail. The second part of the chapter is describing the general attitude of DRM actors toward CT. It was concluded that CT is not the relevant tools for LSK collection due to its several disadvantages. As well the selection of LSK tool is largely depending on other issues such as: who will collect the LSK, local government officials or NGO’s? And what are their skills, experiences, resources available? The chapter ends with the description of the interviews and the questions asked to DRM actors.
ASSESSING THE FEASIBILITY OF USING LOCAL SPATIAL KNOWELDGE IN DISASTER RISK MANAGEMENT IN GEORGIA
30
The key findings from the fieldwork about the people attitude toward participation are: Getting people involved in participatory meetings in Georgia is not easy. Firstly, they did not trust government (national or local) as several times the expectations were raised without any results, and secondly they are used to be indifferent as past experiences in political situation (Soviet Union), reduces the people willingness to participate in such activities. Additionally, when informally discussing with the community members about web-mobile reporting and volunteerism, they were not willing to collaborate as did not perceived any benefits from it. Volunteerism also was highly stressed during the workshop discussions (Marina Kordzakhia, personal communication), as there was already made an attempt for volunteerism (checking the water level in river bed by community member) and the project failed as there was not incentives for the volunteers. For the community members it will be difficult to collaborate in risk assessment as the benefit from it is difficult to be perceived (risk reduction benefits are avoided disasters). Mostly people are eager to participate in reporting about their coping mechanism and needs for structural measures, as well during the emergency situation for assistance and after the hazardous event for damage reporting. Thus, people willingness for participation needs trust in government as bases and then fulfilled expectations from participatory activities. So, local people should not be used only as information providers but as well as actors that will receive the benefits from it. Furthermore, the local authorities are indifferent in their actives and are not free in making decisions. For example, as was experienced on the fieldwork, the village mayor was not free in providing the general information about communities without asking permission to commune mayor, commune mayor to municipal mayor, etc (past experiences in Soviet Union). The next chapter will present and visualise collected LSK related to hazard, vulnerability and capacity. As well it will present hazard maps created by the experts, mayors and already existing risk maps from government institutions for comparison.

ASSESSING THE FEASIBILITY OF USING LOCAL SPATIAL KNOWELDGE IN DISASTER RISK MANAGEMENT IN GEORGIA
31
5. MAPPING LOCAL SPATIAL KNOWLEDGE IN GONIO
5.1. Introduction
This chapter aims to integrate the LSK gathered from the Gonio fieldwork with scientific information. This overall objective is not reached based on some difficulties that will be presented below in more detail. The chapter starts with presenting the general information about respondents. Later on the results of the flood depth and duration mapping are presented based on the community member’s perception and interpolated using the kriging method. A landslide susceptibility map is made using a statistical method by a Georgian expert. Finally, the social-economic vulnerability and community needs are presented spatially.
5.2. Gonio filed work data structuring
After the field work, the gathered LSK data were entered in excel file. Later the data were coded and stored in previously designed data model in MS Access, for better structuring and manipulating of the data. The data model was designed using a relational data model where objects, their attributes and relationship are defined (Shlaer & Mellor, 1988). The LSK data model can be modified (by adding or removing objects and attributes) based on the convenience of the government officials later. The data model can serve as a basis and can be enhanced afterwards (community priority ranking can be added that was not made by the author in the research) for more reliable results, or linked to cadastral data model for more detailed information. The design of collected LSK data model is presented in appendix 5.
5.3. Respondents general information
In total, 167 respondents were interviewed, from which 88 remembered flood hazards and 81 landslide hazards. From the 167 respondents, it appeared that 22 respondents (5 in flood zone areas and 17 in landslide areas) did not perceive and remember any hazard types (see table 5-1).
Hazard types Interviewed HHs Not perceived hazards
Flood 88 5
Landslide 81 17
Total 169 22
Table 5-1: Number of interviews per hazard type (Based on the fieldwork interviews).
(a) (b)
Figure 5-1: Age (a) and residence (b) distribution of the respondents (fieldwork interviews).
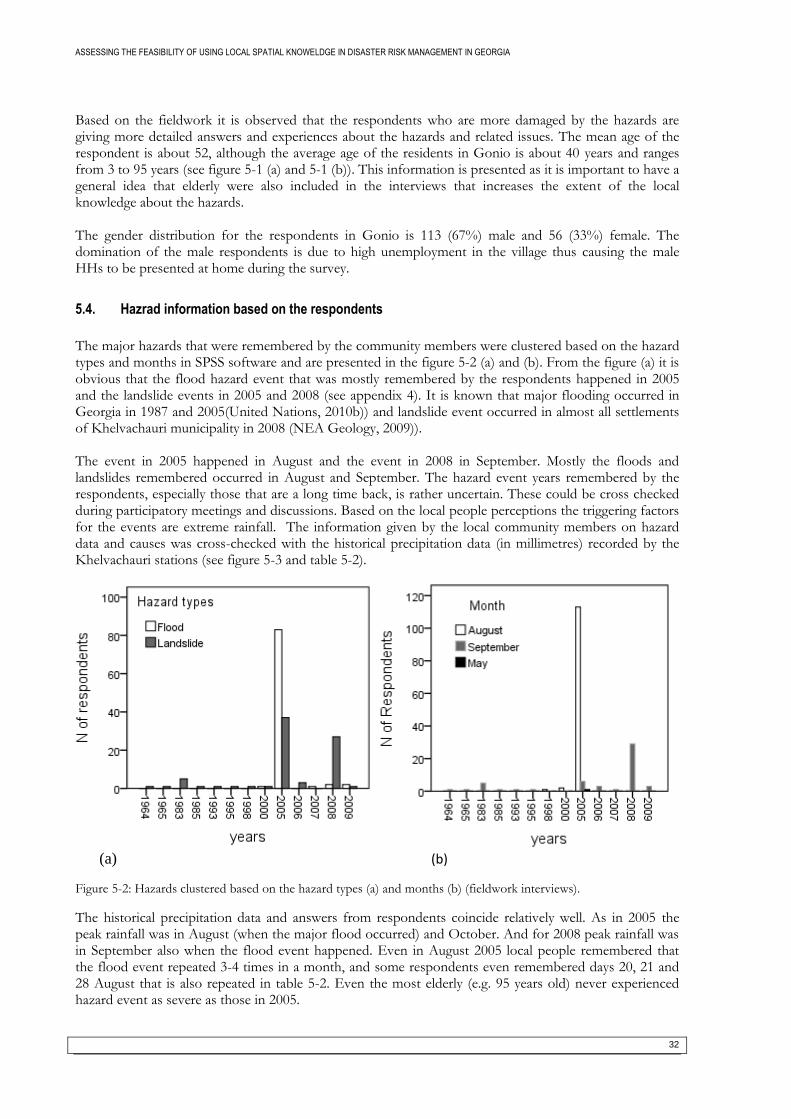
ASSESSING THE FEASIBILITY OF USING LOCAL SPATIAL KNOWELDGE IN DISASTER RISK MANAGEMENT IN GEORGIA
32
Based on the fieldwork it is observed that the respondents who are more damaged by the hazards are giving more detailed answers and experiences about the hazards and related issues. The mean age of the respondent is about 52, although the average age of the residents in Gonio is about 40 years and ranges from 3 to 95 years (see figure 5-1 (a) and 5-1 (b)). This information is presented as it is important to have a general idea that elderly were also included in the interviews that increases the extent of the local knowledge about the hazards. The gender distribution for the respondents in Gonio is 113 (67%) male and 56 (33%) female. The domination of the male respondents is due to high unemployment in the village thus causing the male HHs to be presented at home during the survey.
5.4. Hazrad information based on the respondents
The major hazards that were remembered by the community members were clustered based on the hazard types and months in SPSS software and are presented in the figure 5-2 (a) and (b). From the figure (a) it is obvious that the flood hazard event that was mostly remembered by the respondents happened in 2005 and the landslide events in 2005 and 2008 (see appendix 4). It is known that major flooding occurred in Georgia in 1987 and 2005(United Nations, 2010b)) and landslide event occurred in almost all settlements of Khelvachauri municipality in 2008 (NEA Geology, 2009)). The event in 2005 happened in August and the event in 2008 in September. Mostly the floods and landslides remembered occurred in August and September. The hazard event years remembered by the respondents, especially those that are a long time back, is rather uncertain. These could be cross checked during participatory meetings and discussions. Based on the local people perceptions the triggering factors for the events are extreme rainfall. The information given by the local community members on hazard data and causes was cross-checked with the historical precipitation data (in millimetres) recorded by the Khelvachauri stations (see figure 5-3 and table 5-2).
(a) (b)
Figure 5-2: Hazards clustered based on the hazard types (a) and months (b) (fieldwork interviews).
The historical precipitation data and answers from respondents coincide relatively well. As in 2005 the peak rainfall was in August (when the major flood occurred) and October. And for 2008 peak rainfall was in September also when the flood event happened. Even in August 2005 local people remembered that the flood event repeated 3-4 times in a month, and some respondents even remembered days 20, 21 and 28 August that is also repeated in table 5-2. Even the most elderly (e.g. 95 years old) never experienced hazard event as severe as those in 2005.
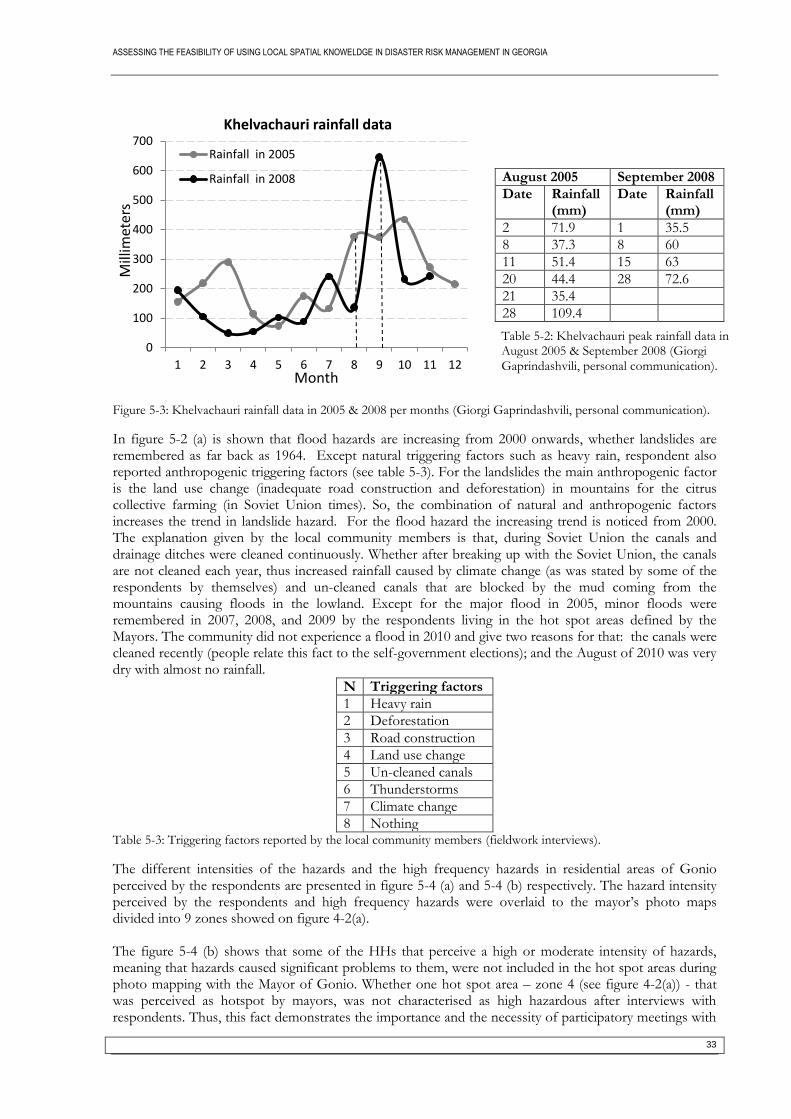
ASSESSING THE FEASIBILITY OF USING LOCAL SPATIAL KNOWELDGE IN DISASTER RISK MANAGEMENT IN GEORGIA
33
Figure 5-3: Khelvachauri rainfall data in 2005 & 2008 per months (Giorgi Gaprindashvili, personal communication).
In figure 5-2 (a) is shown that flood hazards are increasing from 2000 onwards, whether landslides are remembered as far back as 1964. Except natural triggering factors such as heavy rain, respondent also reported anthropogenic triggering factors (see table 5-3). For the landslides the main anthropogenic factor is the land use change (inadequate road construction and deforestation) in mountains for the citrus collective farming (in Soviet Union times). So, the combination of natural and anthropogenic factors increases the trend in landslide hazard. For the flood hazard the increasing trend is noticed from 2000. The explanation given by the local community members is that, during Soviet Union the canals and drainage ditches were cleaned continuously. Whether after breaking up with the Soviet Union, the canals are not cleaned each year, thus increased rainfall caused by climate change (as was stated by some of the respondents by themselves) and un-cleaned canals that are blocked by the mud coming from the mountains causing floods in the lowland. Except for the major flood in 2005, minor floods were remembered in 2007, 2008, and 2009 by the respondents living in the hot spot areas defined by the Mayors. The community did not experience a flood in 2010 and give two reasons for that: the canals were cleaned recently (people relate this fact to the self-government elections); and the August of 2010 was very dry with almost no rainfall.
N Triggering factors
1 Heavy rain
2 Deforestation
3 Road construction
4 Land use change
5 Un-cleaned canals
6 Thunderstorms
7 Climate change
8 Nothing Table 5-3: Triggering factors reported by the local community members (fieldwork interviews).
The different intensities of the hazards and the high frequency hazards in residential areas of Gonio perceived by the respondents are presented in figure 5-4 (a) and 5-4 (b) respectively. The hazard intensity perceived by the respondents and high frequency hazards were overlaid to the mayor’s photo maps divided into 9 zones showed on figure 4-2(a). The figure 5-4 (b) shows that some of the HHs that perceive a high or moderate intensity of hazards, meaning that hazards caused significant problems to them, were not included in the hot spot areas during photo mapping with the Mayor of Gonio. Whether one hot spot area – zone 4 (see figure 4-2(a)) - that was perceived as hotspot by mayors, was not characterised as high hazardous after interviews with respondents. Thus, this fact demonstrates the importance and the necessity of participatory meetings with
0
100
200
300
400
500
600
700
1 2 3 4 5 6 7 8 9 10 11 12
Mill
imet
ers
Month
Khelvachauri rainfall data
Rainfall in 2005
Rainfall in 2008 August 2005 September 2008
Date Rainfall (mm)
Date Rainfall (mm)
2 71.9 1 35.5
8 37.3 8 60
11 51.4 15 63
20 44.4 28 72.6
21 35.4
28 109.4
Table 5-2: Khelvachauri peak rainfall data in August 2005 & September 2008 (Giorgi Gaprindashvili, personal communication).

ASSESSING THE FEASIBILITY OF USING LOCAL SPATIAL KNOWELDGE IN DISASTER RISK MANAGEMENT IN GEORGIA
34
the community, so that all community perceptions and priorities were included. However, the omission of some of the HHs living in hot spot areas can be due to the time restraint that limits the in depth discussions made with the mayors during the photo mapping. Finally, three approximate new hot spot areas can be identified. Area 1 is located in the flood zone and areas 2 and 3 are located in landslide zones. In total 14 HHs are located in the landslide zone with high intensity, 8 HHs have a geological documentation stressing the danger of the house location, one HH (point 4) was offered to go to a shelter in another area by the government as the house was destroyed by a landslide in 2008. However, this area is not highly dangerous anymore as was stated by the neighbour of the destroyed house, based on the geological monitoring.
(a) (b) Figure 5-4: High hazard frequency (a) & intensity (b) perceived by the HH (fieldwork interviews).
Figure 5-4 (a) represents the pattern of high frequency / minor intensity hazards, which mostly coincides with the HHs that are experiencing event with the high intensity as well. Thus, 3 additional approximate areas of high frequency can be identified similar to the previous map.
5.5. Hazard information from government institutions
Based on the secondary data acquisition and interviews with officials it became known that there are no available detailed hazard or risk maps for Gonio Village. The only hazard maps acquired are general zoning maps of the country with information for different hazards. This small scale (1:500,000) maps assign a single category for mudflows and landslide risks to the whole village. On these maps there are 5 categories (very high, high, significant, moderate, low and very low) and the whole Gonio village is considered to have a moderate landslide risk and a low mudflow risk. There are as well a 1:225,000 scale maps of the geological risk zones of the Adjara region that also give only general information about the village. It shows that Gonio is prone only to landslides hazards and not to mudflows or rock falls. For the hydrological hazard (floods), there is only a 1:500,000 scale map of catastrophic flash floods with probability occurrence of 18, 9 and 6 % for the west of Georgia. In this map Gonio is located in the 9 % of occurrence category. The existing information on hazards is very general (See appendix 6). Furthermore, the annual bulletins of the hazardous events from different years that are generated by NEA did not specify any detailed information about hazards and related problems for Gonio village (the bulletin from 2005 when the major event occurred in the village was not found in the NEA office). The
1
2
3
1
2
3
4
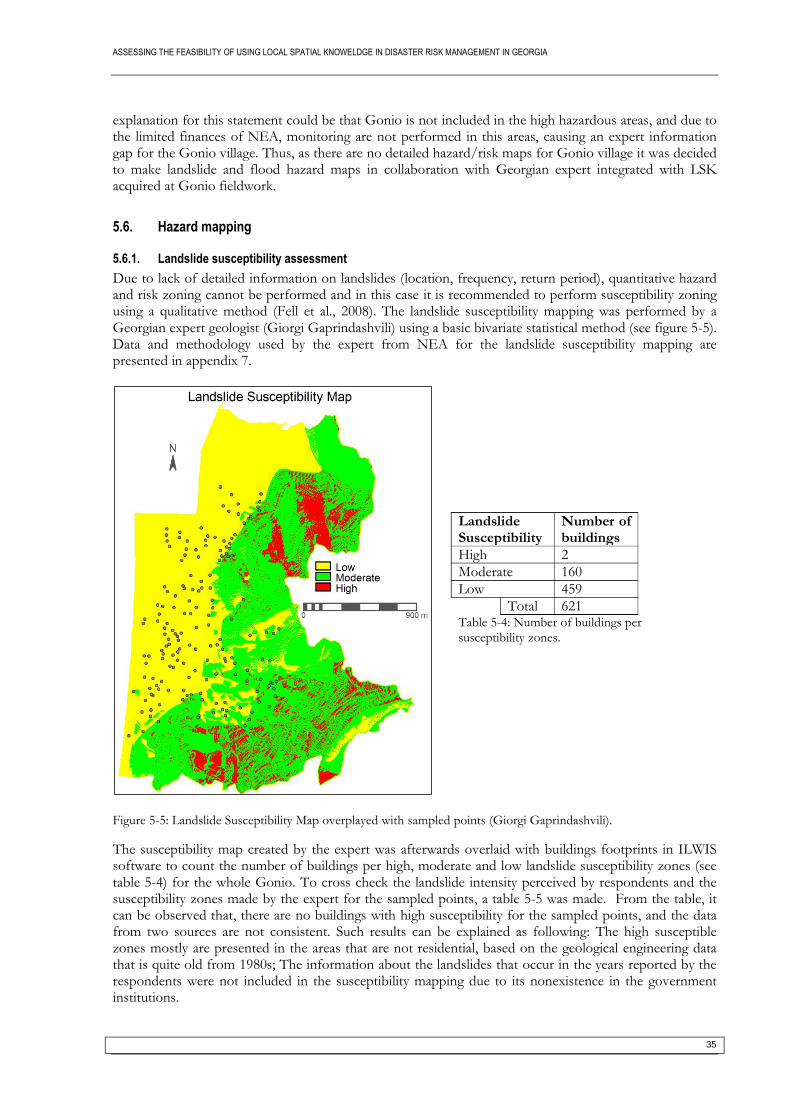
ASSESSING THE FEASIBILITY OF USING LOCAL SPATIAL KNOWELDGE IN DISASTER RISK MANAGEMENT IN GEORGIA
35
explanation for this statement could be that Gonio is not included in the high hazardous areas, and due to the limited finances of NEA, monitoring are not performed in this areas, causing an expert information gap for the Gonio village. Thus, as there are no detailed hazard/risk maps for Gonio village it was decided to make landslide and flood hazard maps in collaboration with Georgian expert integrated with LSK acquired at Gonio fieldwork.
5.6. Hazard mapping
5.6.1. Landslide susceptibility assessment
Due to lack of detailed information on landslides (location, frequency, return period), quantitative hazard and risk zoning cannot be performed and in this case it is recommended to perform susceptibility zoning using a qualitative method (Fell et al., 2008). The landslide susceptibility mapping was performed by a Georgian expert geologist (Giorgi Gaprindashvili) using a basic bivariate statistical method (see figure 5-5). Data and methodology used by the expert from NEA for the landslide susceptibility mapping are presented in appendix 7.
Figure 5-5: Landslide Susceptibility Map overplayed with sampled points (Giorgi Gaprindashvili).
The susceptibility map created by the expert was afterwards overlaid with buildings footprints in ILWIS software to count the number of buildings per high, moderate and low landslide susceptibility zones (see table 5-4) for the whole Gonio. To cross check the landslide intensity perceived by respondents and the susceptibility zones made by the expert for the sampled points, a table 5-5 was made. From the table, it can be observed that, there are no buildings with high susceptibility for the sampled points, and the data from two sources are not consistent. Such results can be explained as following: The high susceptible zones mostly are presented in the areas that are not residential, based on the geological engineering data that is quite old from 1980s; The information about the landslides that occur in the years reported by the respondents were not included in the susceptibility mapping due to its nonexistence in the government institutions.
Landslide Susceptibility
Number of buildings
High 2
Moderate 160
Low 459
Total 621 Table 5-4: Number of buildings per susceptibility zones.

ASSESSING THE FEASIBILITY OF USING LOCAL SPATIAL KNOWELDGE IN DISASTER RISK MANAGEMENT IN GEORGIA
36
Landslide Susceptibility
Values High Moderate Low Sum
Hazard Intensity
High 0 8 6 14
Moderate 0 21 13 34
Low 0 6 10 16
Sum 0 35 29 64 Table 5-5: Landslide intensity perceived by the respondent matched with the landslide susceptibility.
Later on there was an attempt to integrate the LSK on hazard intensity for a more detailed susceptibility mapping with the help of an expert (geologist) from NEA, but it was not possible as the LSK is in the form of point data and there are no exact boundaries of the hazards to be included for hazard mapping. However, even in case of the existence of polygon data (boundaries delaminated by the HHs) is not enough for using these data due to the low credibility, according to the expert geologist. Based on the geologist the information given by the local people (point or polygon) has to be crossed check by the experts on site and then can be incorporated. In general, the hazard LSK gathered in the field seemed relevant for the expert for historical data gathering about hazard occurrence date and its triggering factors. The LSK about damages can be used to cross check the intensity perceived by the people. The updated structural data also was assumed relevant for physical vulnerability calculation. Additionally, the expert suggested to add categories about buildings that can be gathered from the HHs that is the information about house foundation. The gathered LSK on landslide hazard after proper analysis and cross checking will contribute to accumulation of historical data, determining the triggering factors, frequency and return periods, as well it will help to make priorities for monitoring and optimally allocating the human and financial resources for the ones who are highly at risk.
5.6.2. Flood hazard mapping
To make a flood hazard map by experts (as done in case of landslides) was not possible, as the necessary basic input data for flood hazard mapping at village level was not available at NEA. NEA also lacks data and experience in flood modelling. So, an attempt was made to use LSK for flood mapping based on the data gathered on water depth and flood duration. As the major flood event occurs in 2005 it was decided to reconstruct this flood event and use it as a basic flood susceptibility map. For the analysis only the sample points of the flood zone areas were used. Preliminary the flood hazard zones were indicated by the mayors. However, during the field work, flood problems were also detected in some of the landslide hazard zones and the data on depth and duration for these areas were recorded during fieldwork. Thus, the flood zone was expanded, basically all the HHs with an elevation below 5 meter a.s.l were included in the flood zone area, except the ones who live at the edge of the mountains. In overall total 88 HHs survey points on flood depth and the duration were used for reconstruction of the 2005 scenario using a Kriging method (see appendix 8). The 5 HHs from 88 who did not perceived flood hazard (with 0 values) were included for flood mapping as well. The interpolated maps of flood depth and flood duration of the 2005 flood are displayed in figure 5-7 (a) and 5-7 (b). Both figures show more or less the same hot spots especially in polygon 1. As it can be noticed the interpolation in the upper part of the figures (above polygon 3) does not represents the real situation because there were not enough sample points in this areas as it is not a residential area. Based on the observations from the field work the Kriging represent the real situation. The polygon 1 and 2 also coincides with the hot spot areas determined by the mayors except polygon 3. The polygon three also was detected in the figure 5-4 (a) as the moderate hazard intensity area and in figure 5-4 (b) as high frequency area of minor hazards. The produced LSK maps can be used by the local authority for planning purposes as well it can be used for calibration and verification the flood modelling if it will be made by the NEA in future.
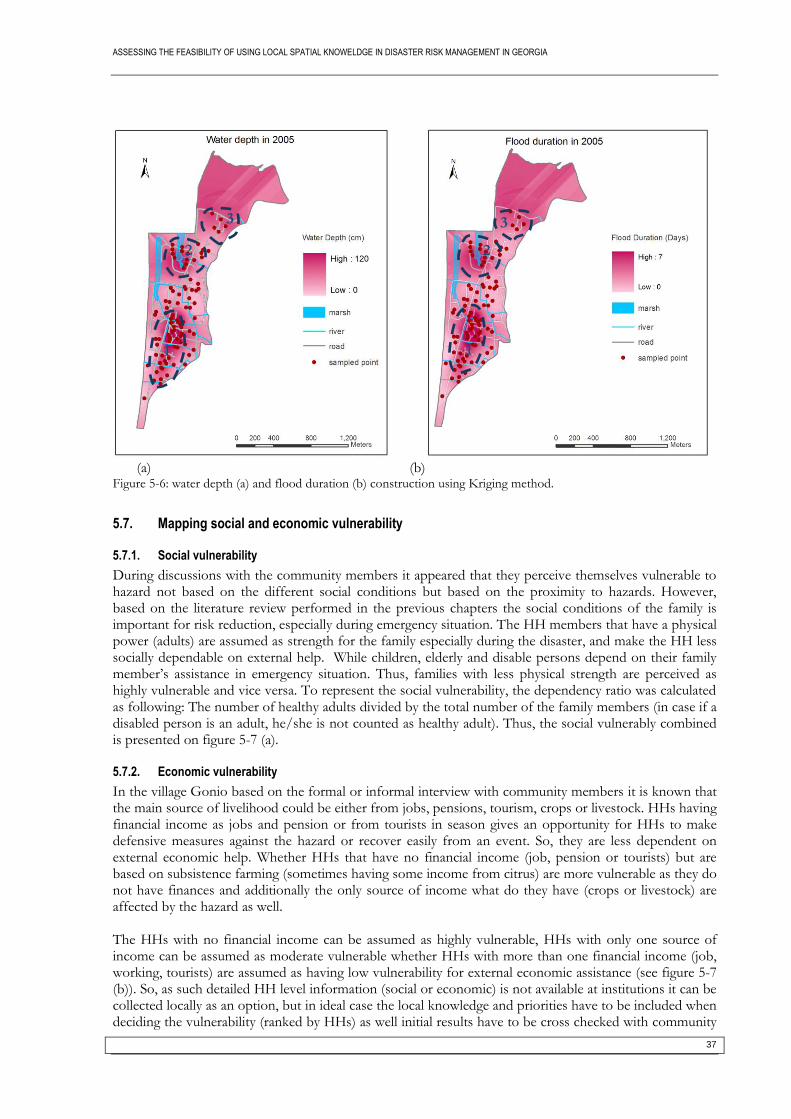
ASSESSING THE FEASIBILITY OF USING LOCAL SPATIAL KNOWELDGE IN DISASTER RISK MANAGEMENT IN GEORGIA
37
(a) (b)
Figure 5-6: water depth (a) and flood duration (b) construction using Kriging method.
5.7. Mapping social and economic vulnerability
5.7.1. Social vulnerability
During discussions with the community members it appeared that they perceive themselves vulnerable to hazard not based on the different social conditions but based on the proximity to hazards. However, based on the literature review performed in the previous chapters the social conditions of the family is important for risk reduction, especially during emergency situation. The HH members that have a physical power (adults) are assumed as strength for the family especially during the disaster, and make the HH less socially dependable on external help. While children, elderly and disable persons depend on their family member’s assistance in emergency situation. Thus, families with less physical strength are perceived as highly vulnerable and vice versa. To represent the social vulnerability, the dependency ratio was calculated as following: The number of healthy adults divided by the total number of the family members (in case if a disabled person is an adult, he/she is not counted as healthy adult). Thus, the social vulnerably combined is presented on figure 5-7 (a).
5.7.2. Economic vulnerability
In the village Gonio based on the formal or informal interview with community members it is known that the main source of livelihood could be either from jobs, pensions, tourism, crops or livestock. HHs having financial income as jobs and pension or from tourists in season gives an opportunity for HHs to make defensive measures against the hazard or recover easily from an event. So, they are less dependent on external economic help. Whether HHs that have no financial income (job, pension or tourists) but are based on subsistence farming (sometimes having some income from citrus) are more vulnerable as they do not have finances and additionally the only source of income what do they have (crops or livestock) are affected by the hazard as well. The HHs with no financial income can be assumed as highly vulnerable, HHs with only one source of income can be assumed as moderate vulnerable whether HHs with more than one financial income (job, working, tourists) are assumed as having low vulnerability for external economic assistance (see figure 5-7 (b)). So, as such detailed HH level information (social or economic) is not available at institutions it can be collected locally as an option, but in ideal case the local knowledge and priorities have to be included when deciding the vulnerability (ranked by HHs) as well initial results have to be cross checked with community
1 1
2
3 3
2
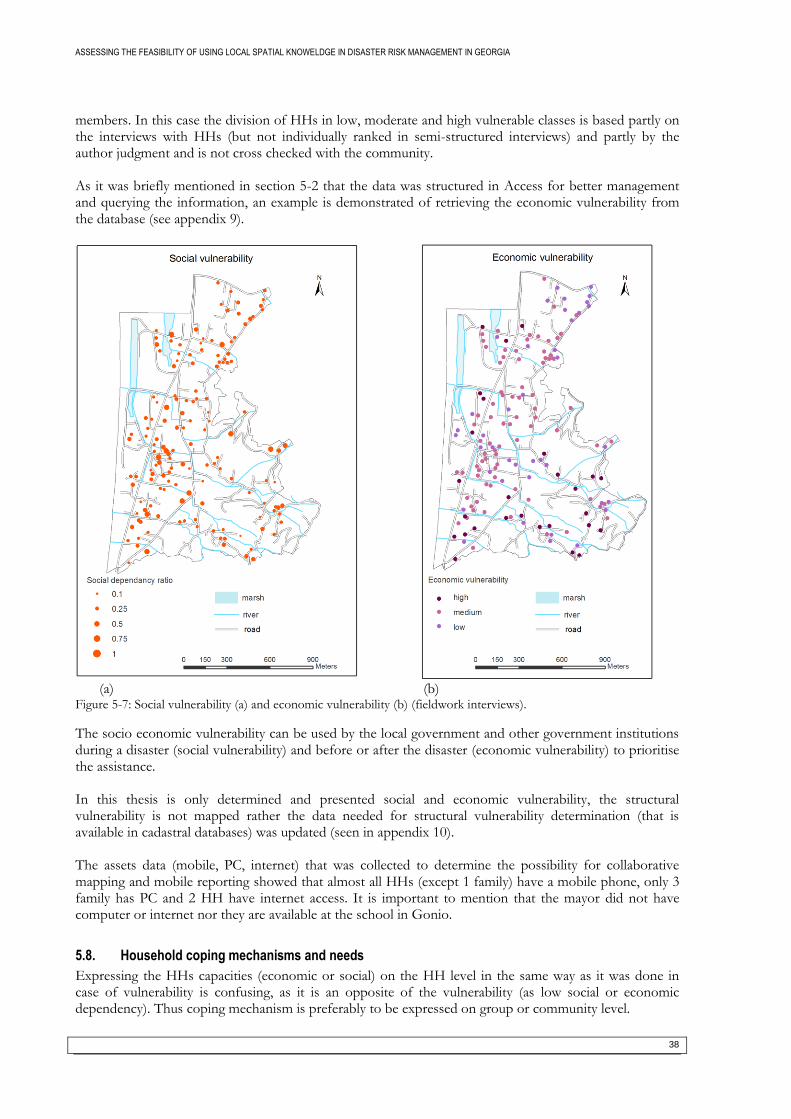
ASSESSING THE FEASIBILITY OF USING LOCAL SPATIAL KNOWELDGE IN DISASTER RISK MANAGEMENT IN GEORGIA
38
members. In this case the division of HHs in low, moderate and high vulnerable classes is based partly on the interviews with HHs (but not individually ranked in semi-structured interviews) and partly by the author judgment and is not cross checked with the community. As it was briefly mentioned in section 5-2 that the data was structured in Access for better management and querying the information, an example is demonstrated of retrieving the economic vulnerability from the database (see appendix 9).
(a) (b)
Figure 5-7: Social vulnerability (a) and economic vulnerability (b) (fieldwork interviews).
The socio economic vulnerability can be used by the local government and other government institutions during a disaster (social vulnerability) and before or after the disaster (economic vulnerability) to prioritise the assistance. In this thesis is only determined and presented social and economic vulnerability, the structural vulnerability is not mapped rather the data needed for structural vulnerability determination (that is available in cadastral databases) was updated (seen in appendix 10). The assets data (mobile, PC, internet) that was collected to determine the possibility for collaborative mapping and mobile reporting showed that almost all HHs (except 1 family) have a mobile phone, only 3 family has PC and 2 HH have internet access. It is important to mention that the mayor did not have computer or internet nor they are available at the school in Gonio.
5.8. Household coping mechanisms and needs
Expressing the HHs capacities (economic or social) on the HH level in the same way as it was done in case of vulnerability is confusing, as it is an opposite of the vulnerability (as low social or economic dependency). Thus coping mechanism is preferably to be expressed on group or community level.
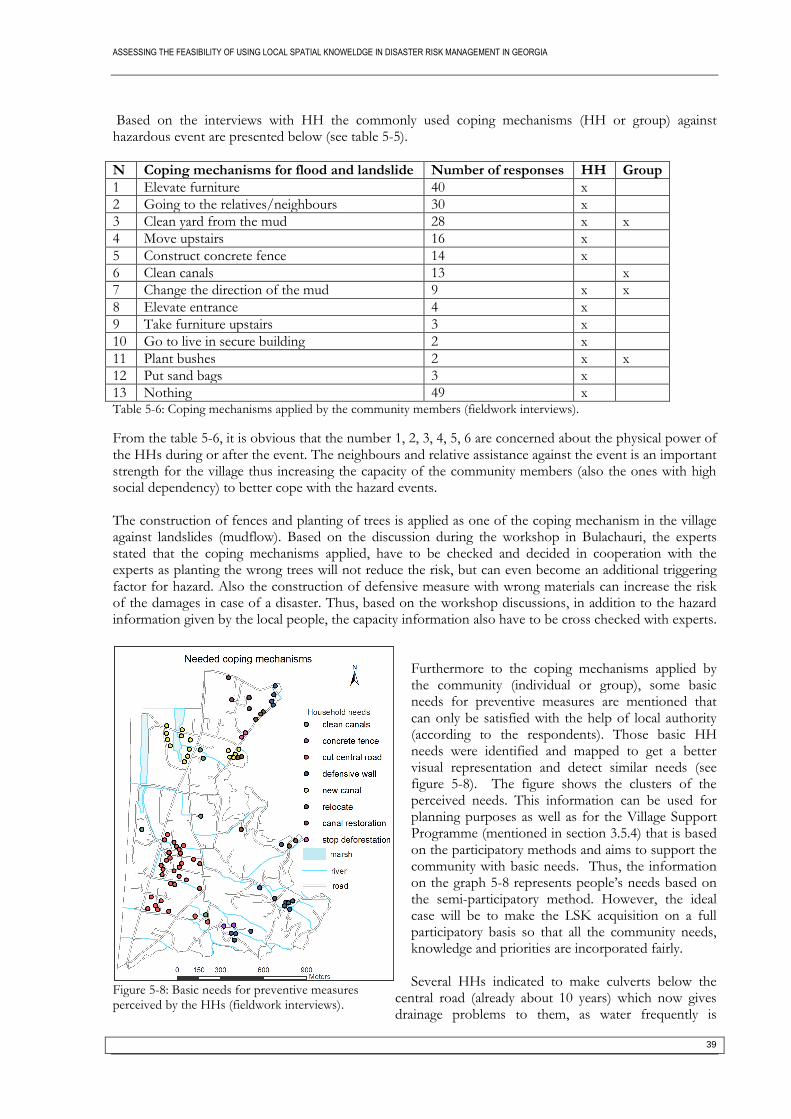
ASSESSING THE FEASIBILITY OF USING LOCAL SPATIAL KNOWELDGE IN DISASTER RISK MANAGEMENT IN GEORGIA
39
Based on the interviews with HH the commonly used coping mechanisms (HH or group) against hazardous event are presented below (see table 5-5).
N Coping mechanisms for flood and landslide Number of responses HH Group
1 Elevate furniture 40 x
2 Going to the relatives/neighbours 30 x
3 Clean yard from the mud 28 x x
4 Move upstairs 16 x
5 Construct concrete fence 14 x
6 Clean canals 13 x
7 Change the direction of the mud 9 x x
8 Elevate entrance 4 x
9 Take furniture upstairs 3 x
10 Go to live in secure building 2 x
11 Plant bushes 2 x x
12 Put sand bags 3 x
13 Nothing 49 x Table 5-6: Coping mechanisms applied by the community members (fieldwork interviews).
From the table 5-6, it is obvious that the number 1, 2, 3, 4, 5, 6 are concerned about the physical power of the HHs during or after the event. The neighbours and relative assistance against the event is an important strength for the village thus increasing the capacity of the community members (also the ones with high social dependency) to better cope with the hazard events. The construction of fences and planting of trees is applied as one of the coping mechanism in the village against landslides (mudflow). Based on the discussion during the workshop in Bulachauri, the experts stated that the coping mechanisms applied, have to be checked and decided in cooperation with the experts as planting the wrong trees will not reduce the risk, but can even become an additional triggering factor for hazard. Also the construction of defensive measure with wrong materials can increase the risk of the damages in case of a disaster. Thus, based on the workshop discussions, in addition to the hazard information given by the local people, the capacity information also have to be cross checked with experts.
Furthermore to the coping mechanisms applied by the community (individual or group), some basic needs for preventive measures are mentioned that can only be satisfied with the help of local authority (according to the respondents). Those basic HH needs were identified and mapped to get a better visual representation and detect similar needs (see figure 5-8). The figure shows the clusters of the perceived needs. This information can be used for planning purposes as well as for the Village Support Programme (mentioned in section 3.5.4) that is based on the participatory methods and aims to support the community with basic needs. Thus, the information on the graph 5-8 represents people’s needs based on the semi-participatory method. However, the ideal case will be to make the LSK acquisition on a full participatory basis so that all the community needs, knowledge and priorities are incorporated fairly. Several HHs indicated to make culverts below the
central road (already about 10 years) which now gives drainage problems to them, as water frequently is
Figure 5-8: Basic needs for preventive measures perceived by the HHs (fieldwork interviews).
ASSESSING THE FEASIBILITY OF USING LOCAL SPATIAL KNOWELDGE IN DISASTER RISK MANAGEMENT IN GEORGIA
40
accumulated in this area. They are asking to make the new canal that after cutting the road can be connected with the central canal in the other side of the road. These HHs are the ones mostly affected by the flood in 2005, as well minor floods affect them every year or even several times per year. Till now they did not receive any external help and without external assistance they are not able to change anything as the road is of international importance. The same drainage problem affects the HHs who is asking for a new canal, and the restoration of the old canal. Mostly, the HHs who are willing to relocate in another place have geological documents stating about the danger of the area and are located in the mountains (in landslide zone sometimes threaten by the rock falls). According to the sketch spatial plan (see appendix 1), in Gonio is planned to made an international highway and other important land used changes, HHs located in dangerous areas are hoping to be compensated to resettle in other area (see apendix1).
5.9. Summary
In this chapter the acquired LSK about hazards, vulnerability and capacity was structured and visualised. The LSK of mayors and community members were compared and it resulted that mostly the information given by the mayors coincides with the community member information but still some of the areas were omitted. Thus, only relying on knowledge of mayors is not enough, other community member contribution are needed too. Next it was tested to incorporate LSK with expert knowledge. However, this could not be implemented as the point LSK data was not assumed as reliable for incorporation in landslide susceptibility mapping by the expert. As well there were not sufficient aerial images to be detected the hazardous areas and cross check the information remotely by the expert. Thus, LSK point data (hazard intensity perceived by the respondents) was visualised and compared with landslide susceptibility maps based on a statistical method. The comparison shows that the maps from different sources did not match. The expert based maps did not represent areas that were perceived by the respondent as hazardous in a same way. The reason is that expert based maps are based on out-dated information. For the flood hazard, as there was no data available at local level for expert based flood zoning, the LSK on flood depth and duration was used to reconstruct the flood hazard from 2005. Finally, the vulnerability and capacity LSK was visualised separately thus demonstrating the contribution of LSK in three different risk factors (as well for preparedness and prevention). The next chapter will be focused on assessing the applicability of using LSK by reviewing the suitable LSK collection tools, relevant institutions for LSK acquisition and utilisation, and discussing the main obstacles and chances for using LSK in DRM in Georgia.
ASSESSING THE FEASIBILITY OF USING LOCAL SPATIAL KNOWELDGE IN DISASTER RISK MANAGEMENT IN GEORGIA
41
6. REVIEWING THE OPPORTUNITIES AND CONSTRAINTS OF USING LSK IN DRM IN GEORGIA
6.1. Introduction
The chapter starts with describing the DRM activities as it is and as it needs to be changed toward pre-disaster related activities, based on the literature study and the international commitment the Hyogo Framework for Action or UN contingency plan strategies in Georgia. The chapter continues with stressing the importance of LSK as an alternative for strengthening the DRM in Georgia. It reviews LSK acquisition tools for choosing the most suitable tool based on the literature review and government official criteria. Then, the general procedure for LSK acquisition and utilisation for different purposes is presented in combination with the relevant institutions, levels and tools. The chapter ends with determining the main constraints and opportunities for LSK in Georgia.
6.2. Shifting focus toward pre disaster activities in Georgia
Chapter two identified the most important phases of the DRM cycle (pre disaster) that significantly contribute to sustainable development. AS well, in section 2.5 was identified LSK about hazards, vulnerability and capacity as the important factor for effective DRM. In Georgia according to the HFA or UN contingency plan the institutions should strengthen their activities in all the DRM phases as well as in pre-disaster phase, such as the risk assessment, preventive measures, and preparedness. The risk identification is very weak nowadays in Georgia. In addition to the limited capacities/resources, the unavailability of the detailed hazard related information limits active DRM. Important (geo) information such as orthophotos or large scale contourlines is owned by the private GIS companies are expensive and not affordable for the government institutions. Much better but not ideal situation is presented in institutions involved with emergency preparedness and response. The information needs for thus activities are limited, available only on commune level and lacks detailed village/HHs data on risks, social or economic vulnerability, which is required to achieve the main strategies for risk reduction. For mitigation and preventive measure such as structural measure in pre and post disaster phase or non-structural measures such as spatial (land use) planning is very weak nowadays in Georgia. The funds on local administration for structural measure are so limited that is only affordable for post disaster reconstruction measures with limited finances.
The key institutions in DRM involved in above mentioned activities are: NEA with minor efforts in pre-disaster (risk assessment); EMD during disaster (emergency response) and MRDI in post-disaster (recovery). However, the activities of NEA are not strong enough due to the fact that nowadays government is more emergency response oriented and the risk assessment or other pre-disaster activities has at low priority. As well low priority is caused by the fact that risk assessment are bases for spatial (land use) plans that tend to restrict and limit economic activities and construction in certain areas, or enable constructions according to the specific rules making this more costly. In a fast evolving capitalistic economy such restrictions are seen as obstacles for government, private sector and civil society, and the short term economic benefits outweigh the long term benefits of risk reduction (Cees van Westen, personal communication). Overall, key institutions involved in DRM should strengthen its activities toward pre-disaster phase. However, in pre disaster activities (as well on other phases of DRM) should not be included only mentioned key institutions but other organisations as well. Good governance in DRM requires that all relevant government ministries at different administrative levels, NGO’s Mass Media and community itself, collaborate and cooperate during different phases and activities of DRM.

ASSESSING THE FEASIBILITY OF USING LOCAL SPATIAL KNOWELDGE IN DISASTER RISK MANAGEMENT IN GEORGIA
42
The main obstacle for the shifting the scope toward more pre-disaster activities are:
Low risk perception by the national government to disaster, thus preferring to focus and devote the resources on post disaster recovery and other issues at stake than DRM that are related to future and uncertainties;
Low capacities (financial, technology, expertise human resource);
Poor institutional and legislative framework regarding DRM;
Data poor environment (that it itself are caused by the above mentioned problems) that makes it more difficult the effective operation of pre-disaster activities.
6.3. LSK for strengthening DRM in Georgia
As it is demonstrated in section 2.8, LSK is often used in data poor environment to strengthen the DRM activities. LSK helps to collect the accumulated knowledge from the local people about the historical hazardous event and it’s characteristic, as well it helps to improve understanding of risk for outsiders. Thus, LSK collection and utilisation about hazard, vulnerability and capacity can strengthen DRM (see in table 6-1) in Georgia as well.
DRM phases LSK on Hazard ,Vulnerability and Capacity contributes to
Risk assessment -hazard assessment -vulnerability assessment
Determine the return period, frequency, calibrate, validate and build more accurate models; Comprehensive risk assessment incorporating vulnerability and capacity
Mitigation/Prevention -Structural -Non-structural
Identify people coping mechanisms and basic needs for informed decisions based on the community needs;
Preparedness/early warning Identify and prioritises the ones most in needs (disabled, poor, elderly)
Respond On time response based on the identified priorities;
Recovery/reconstruction Identify people basic need; Table 6-1: LSK contribution for DRM strengthening.
The experiences of using LSK in Georgia are not country wide, it is usually not well documented and are lost easily (presented in section 3.6) and needs farther elaboration. The fieldwork made in Gonio, in Georgia, for LSK collection about hazard, vulnerability and coping capacity demonstrated that information collected can be structured and visualised in GIS environment and used for strengthening DRM as well as optimal communication tool between local community members, local authorities and higher level institutions.
6.4. LSK acquisition tools
The table 6-2 shows the tools experienced during the fieldwork and some important facts on how participatory was the tool? What were information details acquired by the tool and what is the area coverage of the information given. Below is explained each tool briefly: Semi-structured interviews with households (with GPS) – The advantage of the tool is that it allows to collect detailed historical information on hazard, economic and social vulnerability on households level, it’s easy to used and requires minor experience. The main disadvantages are: it is semi-participatory, includes all the households’ information that can be combined afterwards, but it is not cross checked (giving uncertainty in hazard related information, difficult to prioritise the vulnerabilities or needs) does not gathers people together and the information provided is mostly HH location based. Mobile GIS (CyberTracker): is easy to use when the questions are structured, possible responds are predefined in advance, and are well designed in device. Also the data gathered can be directly transferred in PC and acquired as digital. Main disadvantages are: it is semi-participatory, does not allow participation of more than 3 persons at a time, the information gathered is a location based, as well is not easy to use without trainings.

ASSESSING THE FEASIBILITY OF USING LOCAL SPATIAL KNOWELDGE IN DISASTER RISK MANAGEMENT IN GEORGIA
43
Photomapping – the advantage of photo mapping is the data produced are geo-referenced and can be easily transferred in GIS software; the photo mapping enables to gather many people together, discuss and identify the hazardous areas and vulnerable households; the area coverage of mapping is large. The main disadvantages are: orthopotos are expensive and are not easily obtainable, the identified hazardous zones with mayors in the fieldwork, mostly coincide with reality but some important household were omitted, thus needs to be cross checked or included during the mapping some of the key informant from the village.
Tools Participatory Detail Area covered
Semi-structured
interviews (GPS)
no yes small
CyberTracker no middle small
Photomapping yes middle large Table 6-2: PGIS tools experienced during the fieldwork
The tools used on fieldwork cannot be assumed as optimal tool for the LSK gathering. Usually, usage of tools depends on the purpose of the fieldwork (historical event gathering, local level hazard, vulnerability or hazard assessment).As well, usually is better to combine one or more tools during LSK gathering.
During the workshop and interviews with officials, several ideas were expressed about LSK data gathering and the following issues were stressed when selecting the tool for LSK acquisition: the tools should be cheap, with minor training needs, should be user friendly and easy for further analyses and utilisation (easily geo-referenced, structured). Taking into consideration the section 2.9, the categories given by the officials and personal experiences in the fieldwork, can be roughly identified the most appropriate tool or combination of the tools for LSK gathering. But first have to be separated the purpose of the LSK gathering: hazard reporting or local level hazard, vulnerability assessment. Hazard/Incident reporting-for this purpose the web-mapping and mobile phone reporting are identified as relevant tools. Collaborative web-mapping - is already in process of implementation for NEA and forthcoming for EMD. Based on the workshop the Web-mapping is preferably applied at village level, by the Mayor or other selected persons by the community. As was shown from the field work result, there is not internet access in the village (only 2 persons had internet and 3 persons PC from the sampled HHs) but, the members from government institutions were stressing (on the workshop) that there will be an internet in near future in every village of Georgia according to a Presidential order. As well is not necessary that whole community have an internet access for participatory mapping. Thus, the web-mapping is preferably to be implemented at village level for example in schools (nowadays internet is not available), by the teachers in collaboration with children or other selected key informants. The information mapped will be directly shared to municipal level for data analyses (if relevant human recourse will be available/trained) otherwise can be transferred directly to the central level of the NEA office. The web-mapping for collaborative hazard mapping (as well information reporting and updates on critical objects, transports, risks, etc) is to be developed by the EMD as well. In this case, there can be a duplication of the information, thus the information provision and sharing should be identified in collaborative manner between the institutions interested in the hazard information. Mobile phones - can be used as wel,l in addition to the web-mapping for hazard event/incident reporting. As all the HHs in the village that was sampled (except 1 HH) have mobile phones, it seems most easy and cheap to set-up a simple reporting system with a central telephone number in NEA which is continuously manned and where incoming calls are directly converted into hazard locations with spatial reference, date and damage. A good risk communication campaign would be needed to explain the procedure and make people aware of the telephone number. As well by mobile phone, pictures can be taken of hazard impacted areas or houses and send to experts that will facilitate cross checking processes. EMD is planning to introduce SOS system of emergency call based on European standards 112 (in US 911) that will incorporate rescuers, police or emergency call together. Thus, same confusions can be
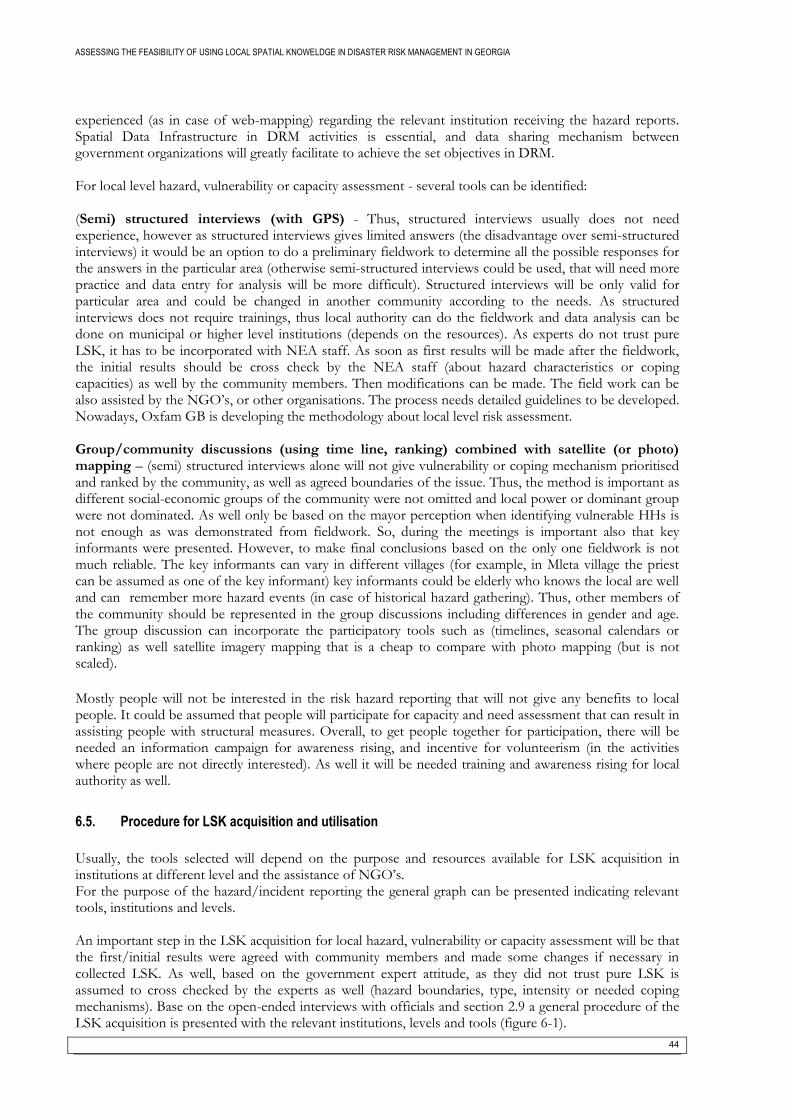
ASSESSING THE FEASIBILITY OF USING LOCAL SPATIAL KNOWELDGE IN DISASTER RISK MANAGEMENT IN GEORGIA
44
experienced (as in case of web-mapping) regarding the relevant institution receiving the hazard reports. Spatial Data Infrastructure in DRM activities is essential, and data sharing mechanism between government organizations will greatly facilitate to achieve the set objectives in DRM. For local level hazard, vulnerability or capacity assessment - several tools can be identified: (Semi) structured interviews (with GPS) - Thus, structured interviews usually does not need experience, however as structured interviews gives limited answers (the disadvantage over semi-structured interviews) it would be an option to do a preliminary fieldwork to determine all the possible responses for the answers in the particular area (otherwise semi-structured interviews could be used, that will need more practice and data entry for analysis will be more difficult). Structured interviews will be only valid for particular area and could be changed in another community according to the needs. As structured interviews does not require trainings, thus local authority can do the fieldwork and data analysis can be done on municipal or higher level institutions (depends on the resources). As experts do not trust pure LSK, it has to be incorporated with NEA staff. As soon as first results will be made after the fieldwork, the initial results should be cross check by the NEA staff (about hazard characteristics or coping capacities) as well by the community members. Then modifications can be made. The field work can be also assisted by the NGO’s, or other organisations. The process needs detailed guidelines to be developed. Nowadays, Oxfam GB is developing the methodology about local level risk assessment. Group/community discussions (using time line, ranking) combined with satellite (or photo) mapping – (semi) structured interviews alone will not give vulnerability or coping mechanism prioritised and ranked by the community, as well as agreed boundaries of the issue. Thus, the method is important as different social-economic groups of the community were not omitted and local power or dominant group were not dominated. As well only be based on the mayor perception when identifying vulnerable HHs is not enough as was demonstrated from fieldwork. So, during the meetings is important also that key informants were presented. However, to make final conclusions based on the only one fieldwork is not much reliable. The key informants can vary in different villages (for example, in Mleta village the priest can be assumed as one of the key informant) key informants could be elderly who knows the local are well and can remember more hazard events (in case of historical hazard gathering). Thus, other members of the community should be represented in the group discussions including differences in gender and age. The group discussion can incorporate the participatory tools such as (timelines, seasonal calendars or ranking) as well satellite imagery mapping that is a cheap to compare with photo mapping (but is not scaled).
Mostly people will not be interested in the risk hazard reporting that will not give any benefits to local people. It could be assumed that people will participate for capacity and need assessment that can result in assisting people with structural measures. Overall, to get people together for participation, there will be needed an information campaign for awareness rising, and incentive for volunteerism (in the activities where people are not directly interested). As well it will be needed training and awareness rising for local authority as well.
6.5. Procedure for LSK acquisition and utilisation
Usually, the tools selected will depend on the purpose and resources available for LSK acquisition in institutions at different level and the assistance of NGO’s. For the purpose of the hazard/incident reporting the general graph can be presented indicating relevant tools, institutions and levels. An important step in the LSK acquisition for local hazard, vulnerability or capacity assessment will be that the first/initial results were agreed with community members and made some changes if necessary in collected LSK. As well, based on the government expert attitude, as they did not trust pure LSK is assumed to cross checked by the experts as well (hazard boundaries, type, intensity or needed coping mechanisms). Base on the open-ended interviews with officials and section 2.9 a general procedure of the LSK acquisition is presented with the relevant institutions, levels and tools (figure 6-1).
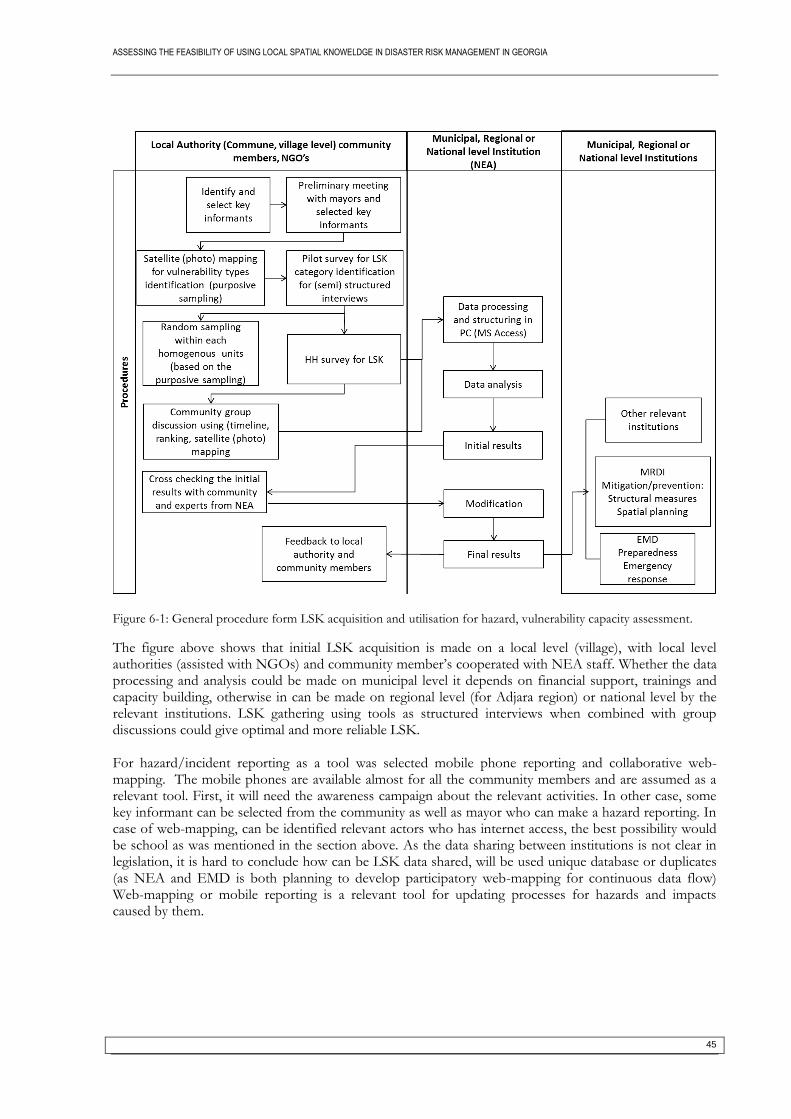
ASSESSING THE FEASIBILITY OF USING LOCAL SPATIAL KNOWELDGE IN DISASTER RISK MANAGEMENT IN GEORGIA
45
Figure 6-1: General procedure form LSK acquisition and utilisation for hazard, vulnerability capacity assessment.
The figure above shows that initial LSK acquisition is made on a local level (village), with local level authorities (assisted with NGOs) and community member’s cooperated with NEA staff. Whether the data processing and analysis could be made on municipal level it depends on financial support, trainings and capacity building, otherwise in can be made on regional level (for Adjara region) or national level by the relevant institutions. LSK gathering using tools as structured interviews when combined with group discussions could give optimal and more reliable LSK. For hazard/incident reporting as a tool was selected mobile phone reporting and collaborative web- mapping. The mobile phones are available almost for all the community members and are assumed as a relevant tool. First, it will need the awareness campaign about the relevant activities. In other case, some key informant can be selected from the community as well as mayor who can make a hazard reporting. In case of web-mapping, can be identified relevant actors who has internet access, the best possibility would be school as was mentioned in the section above. As the data sharing between institutions is not clear in legislation, it is hard to conclude how can be LSK data shared, will be used unique database or duplicates (as NEA and EMD is both planning to develop participatory web-mapping for continuous data flow) Web-mapping or mobile reporting is a relevant tool for updating processes for hazards and impacts caused by them.
ASSESSING THE FEASIBILITY OF USING LOCAL SPATIAL KNOWELDGE IN DISASTER RISK MANAGEMENT IN GEORGIA
46
Figure 6-2: General procedure form LSK acquisition and utilisation for hazard/Incident reporting
6.6. Constraints and opprtunities for LSK acquisition and utilisation in institutions in Georgia
The acquisition and utilisation of LSK will require institutional changes in Georgia (Legislation, rules, policies), for example development of new gridlines on LSK collection, participation processes, LSK information confidentiality (if necessary), etc.) . To change existing attitudes and beliefs in the mind of local people and in policies of the government in a post-Soviet country is difficult and time consuming. The information that can influence policy beliefs is further challenged by the fact that information is based on local knowledge and there is a general perception among government official that these lack credibility as was already discussed in section 2.8, and was also observed from the workshop and interviews with government officials in DRM. Accordingly the main constraints for using LSK are:
The poor resources available in government system;
No legal framework (procedures, guidelines) exists for LSK acquisition;
The DRM is not a priority in government agenda;
There is not much (however an increasing trend is noticed worldwide) scientific papers regarding LSK utilisation;
Existing international project are a short term projects and usually tend to stop without follow-up (however if the tool would be well designed from the beginning, it will have a potential to be used continually by the institutions);
The local communities in Georgia tend to be indifferent (past experiences from Soviet Union time) in participatory approaches and it will not be easy to collect the LSK based on the community participation (community meetings discussions, collaborative mapping or mobile reporting) especially when communities will not expect direct benefits, such as hazard data reporting that assumes to strengthen risk assessment that itself reduces the disaster risk. For long term risk reduction it is thus difficult to perceive the benefits by the civil society and for government as well.
As well can be identified some improvement and benefits that can facilitate the LSK utilisation:
There is a pressure from outside (international organisations) as well practices in other countries proven the usefulness of LSK usage. There are several international on-going projects that try to strengthen the DRM in Georgia, as well to introduce the tools for LSK collecting using PRA tools (Oxfam GB) or collaborative web-mapping (Matra project). Thus, this is an important base for farther implementation of the LSK collection;
ICT development and occurrence of different tools makes it easier to acquire structure, manage, analyse and share the LSK;
In this stage government officials are willing to accept the LSK (as well cross check) for strengthening the DRM in Georgia.

ASSESSING THE FEASIBILITY OF USING LOCAL SPATIAL KNOWELDGE IN DISASTER RISK MANAGEMENT IN GEORGIA
47
Thus, there are both opportunities and constraints to use LSK by government organizations. Especially, acquiring the LSK has more possibilities to be implemented as due to international projects. However, even if LSK will be acquired (due to ICT development) it did not guaranty that information will be utilised by the decision-makers.


ASSESSING THE FEASIBILITY OF USING LOCAL SPATIAL KNOWELDGE IN DISASTER RISK MANAGEMENT IN GEORGIA
49
7. CONCLUSIONS AND RECOMMENDATIONS
7.1. Conclusions
Based on the country analysis can be concluded that the DRM is not currently much in evidence in Georgia, because existing DRM is very weak nowadays. Although the legislative framework is not well defined and is vague in defining the responsibilities of institutions related to DRM. The actors of DRM are scattered across different sectors and levels of the government. In addition, public participation and information provision among institutions is unclear. Until now, the DRM in Georgia is more emergency response oriented than on risk prevention and mitigation. As well there is planed the restructuring of MoE, thus NEA as well will be affected by the changes that might weaken the risk assessment. The existing (geo) information within sectors that is needed for effective DRM is limited, out-dated and at a very small scale. However, based on the HFA 2005-2015 or UN contingency plan for Georgia there should be plan to acquire more detailed information on village and HH level about hazard, vulnerability (social-economic) and capacity/coping mechanism. The mentioned information has to be gathered, analysed, managed, shared updated and used constantly. Consequently, LSK is emerging as an optimal way to complement this information that will be used by the different institutions of DRM at different levels of government (EMD, NEA MRDI, etc) and will contribute to better DRM. Moreover, there are on-going international projects assisting NEA or MED for LSK acquiring based on the participatory methods (e.g. collaborative web mapping). This fact makes the attitude of the DRM actors toward LSK acquisition quite positive. The DRM actors are willing to search for ways of acquiring and utilising LSK in an optimal way. These projects still remaining an international initiative but it gives a motivation for the government institutions to make a first steps. In case of good design (methods, tool, data structure, etc.) of the procedure of LSK gathering it will give a potential methodology for acquiring and then utilising the LSK continually by the government. The procedure of LSK acquisition based on participatory methods could be formulated from the beginning in a legislative and institutional framework. The current DRM framework has various gaps and is prone to changes anyway. Partly based on the defined LSK requirements on hazard, vulnerability and capacity, the fieldwork for LSK gathering in Gonio was performed to test the methods of LSK collection using Mobile GIS, photo mapping with mayors and semi – structured interviews with local community members using participatory method. A comprehensive fully participatory method including meetings, discussions and community mapping were not attempted due to the time limitations and research reasons (no hope for near-future benefits by local people made them not very motivated to participate). Data gathering Mobile GIS (CyberTracker) was tested and it can be concluded that CT has some advantages (programme is free, operates with free Google Images and with free GIS software), however it is not the best option within PGIS tools. The methods used in Gonio fieldworks for LSK acquisition cannot be assumed as a best method and need further elaboration. It is important that an initial result from the fieldwork was shared with local people, which could make some changes if necessary (though that was not done in this research). After acquiring the LSK in Gonio, it was intended to cross check the existing information of hazards against local perceptions on hazard, however due to lack of detailed information on hazards in Gonio (only small scale hazard maps were available with one homogenous value for the whole village). The hazard maps needed to be made by an expert from NEA to cross check (in the end they did not match with LSK as input data were out-dated), and as well try to incorporate expert and local knowledge. Thus, an attempt was made to combine scientific information with LSK about hazards, using a particular method (landslide susceptibility mapping using statistical method). The attempt was not finally achieved because: firstly the LSK data were in a point format (not polygons) and even if the data were obtained as clear boundaries by participatory mapping, they still would not be considered as valid by the expert for

ASSESSING THE FEASIBILITY OF USING LOCAL SPATIAL KNOWELDGE IN DISASTER RISK MANAGEMENT IN GEORGIA
50
integration. Thus, pure locally based knowledge is considered as unreliable by experts and needs cross checking. However, the gathered hazard data is useful for information accumulation about hazard history that could contribute to determine the hazard (flood or landslide) frequency and return period that is missing nowadays in Georgia, or map flood hazard extent, based on the community members’ perception on water depth and duration, that can be used by the experts for flood modelling calibration in the future. In general, it was not possible to integrate the LSK and expert knowledge about hazards at this stage. However, based on the requirements of the institutions and as well on the interviews with the experts, the gathered data are assumed as relevant for better DRM. As well as LSK on hazards, the data about vulnerability and capacity were tested to be mapped separately. The information is assumed very useful for preparedness and timely emergency response to be used by the EMD (and local authority). The data can be used by NEA for comprehensive risk assessment (Risk=hazard*vulnerability/capacity). Coping capacity was not mapped at HH level because it is already incorporated in the mapped vulnerability as an inverse value. Moreover, capacity/coping mechanisms are better represented at group or community level via qualitative descriptions. However, the needs perceived by the local people for disaster preventive measures were demonstrated at HH level, and clusters were detected that are assumed to be used by the MRDI (and local authority) for better informed decisions incorporating local people’s needs. The thesis is finalised by assessing the feasibility of using LSK in DRM (pre-disaster phase) by the relevant key institutions. Thus, the key institutions in Georgia with the potential to strengthen their tasks and activities more to risk assessment, preparedness and prevention are identified. The methods and tools relevant in Georgia for LSK acquisition are chosen to strengthen the existing state of DRM in Georgia. Then, the general LSK acquisition and utilisation procedures are presented, including relevant key institutions, levels and tools for different purposes (hazard/incident mapping or hazard, vulnerability and capacity assessment). Finally, it can be concluded that due to international on-going programs in cooperation with NGO’s and ICT developments regarding LSK collection, there is an opportunity in Georgia for LSK data acquisition to be developed. Continuation of LSK acquisition partly depends on how well the data acquisition will be designed from the beginning. However, the utilisation of the LSK is not guaranteed, even if the data will be acquired and are related to decision makers’ perceptions and beliefs in institutions as well as civil society perceptions and attitude outside the government institutions.
7.2. Recommendations for future research
It is recommended to first make in-depth interviews with government institutions about the exact information needs for better DRM, so as to identify categories and types of data possessed by institutions and design the information model for data needs together with officials from institutions. Data collection only on single HH base cannot represent all the community knowledge. Thus it is better to organise community discussions that gives a better chance to make clear boundaries of hazards extents, and remembering of the events together, thus reducing the mistakes, and to make community priorities and ranking regarding vulnerability, capacity and needs for risk reduction. In this way the data will be more reliable and credible for further utilisation. Including priorities from households is a sensitive issue, because it includes people’s perceptions and value judgments and can be acquired only from the people to whom the particular issue is a concern to. If the data collected are based on participatory methods shared and accepted by the community, it is feasible to overlay the hazard, social vulnerability, economic vulnerability or structural vulnerability information (and capacity if available at HH level) to set up an overall risk assessment of the village. Later on the data can be aggregated and scaled up and used for higher level authorities for different purposes (planning, redevelopment, etc.) especially when the LSK data model is designed properly, for example, the LSK can be designed in such a way to fit well with cadastral data, that would be useful from spatial (land use) planning. During land use planning would be necessary to know the hazardous areas, as well the residents who have to be affected by the planning processes (what are their property right, land area or land value) thus, well designed data model for LSK gathering integrated with cadastral data can enable to easily retrieve necessary detailed information.
51
LIST OF REFERENCES
Aarhus Centre Georgia. (2011). Appeal of the Aarhus Centre Georgia to the Government of Georgia on Restructuring the Ministry of Environment Protection and Natural Resources Retrieved 18.02, 2011, from http://aarhus.ge/?page=1&lang=eng&content=565
Abarquez, I., & Murshed, Z. (2004). Field Practitioners’ Handbook. Agrawal, A. (1995). Dismantling the Divide between Indigenous and Scientific Knowledge. Development and
Change, 26(3), 413-439. Alkema, D., Damen, M., Kerle, N., Lubszynska, M., Kingma, N., Parodi, G., . . . Woldai, T. (2009).
Hazard assessment. In C. van Westen (Ed.), Multi-hazard risk assessment: Distance education course/Guide book: United Nations University – ITC School on Disaster Geoinformation Management.
Babylon's Online Dictionary. (2011). Definition of Local knowledge Retrieved 04.01, 2011, from http://dictionary.babylon.com/local_knowledge/
Bankoff, G. (2004). The Historical Geography of Disaster: 'Vulnerability' and 'Local Knowledge' in Western Discourse. In G. Bankoff, G. Frerks & D. Hilhorst (Eds.), Mapping vulnerability: disasters, development, and people: Earthscan Publications Ltd.
Beyers, R. (2004). Cybertracker versus ArcPad: a technical review comparing both systems (in the context of MIKE forest elephant population surveys) Retrieved 01.28, 2011, from http://www.cybertracker.org/Cybertracker%20vs%20ArcPad.pdf
Birkmann, J. r. (2006). Measuring vulnerability to promote disaster-resilient societies: Conceptual frameworks and definitions. In J. r. Birkmann (Ed.), Measuring Vulnerability To Natural Hazards : Towards Disaster Resilient Societies. New York: United Nations University Press.
Blaikie, P., Cannon, T., Davis, I., & Wisner, B. (1994). At Risk: Natural Hazards, People's Vulnerability and Disasters. London: Routledge.
Bressers, H. (2007). Contextual Interaction Theory and the issue of boundary definition: Governance and the motivation, cognitions and resources of actors ISBP EU-project: Institute for Governance Studies University of Twente The Netherlands
Bressers, H., & Rosenbaum, W. (2003). Social scales, Sustainability and Governance: An Introduction. In H. Bressers & W. Rosenbaum (Eds.), Achieving sustainable development, The challenge of governance across social scales (pp. 3-24). Westport, Connecticut, London:Praeger.
Burby, J. R. (1998). Natural Hazards and Land Use: An Introduction Cooperating with nature: confronting natural hazards with land use planning for sustainable communities. Washington.
Cannon, T., Twigg, J., & Rowell, J. (2003). Social Vulnerability, Sustainable Livelihoods and Disasters (pp. 63): Department for International Development (DFID), Conflict and Humanitarian Assistance Department
Cardona, D. O. (2004). The Need for Rethinking the Concepts of Vulnerability and Risk from a Holistic Perspective: A Necessary Review and Criticism for Effective Risk Management. In G. Bankoff, G. Frerks & D. Hilhorst (Eds.), Mapping vulnerability: disasters, development, and people: Earthscan Publications Ltd.
Caritas Czech Republic. (2009). Making Community Managed Disaster Risk Reduction Operational at Community Level: A Guide. In R. Biñas (Ed.).
Dekens, J. (2007). Local Knowledge for Disaster Preparedness: A Literature Review. Kathmandu, Nepal: International Centre for Integrated Mountain Development (ICIMOD).
DHA. (1992). Internationally agreed glossary of basic terms related to Disaster Management. Geneva. Duerden, F., & Kuhn, R. G. (1996). The Application of Geographic Information Systems by First Nations
and Government in Northern Canada. Cartographica: The International Journal for Geographic Information and Geovisualization, 33(2), 49-62.
EMD MIA. (2011). Emergency Management Department of the Ministry of Internal Affairs of Georgia Retrieved 11.01, 2011, from http://www.police.ge/index.php?m=273
Encyclopedia of Sustainable Development. (2001). Brundtland Report Retrieved 10.08, 2010, from http://www.ace.mmu.ac.uk/esd/menu.html
ESRI. (2007). Using kriging Retrieved 25.01, 2011, from http://webhelp.esri.com/arcgisdesktop/9.2/index.cfm?TopicName=Using_kriging
Failing, L., Gregory, R., & Harstone, M. (2007). Integrating science and local knowledge in environmental decisions: a decision-focused approach. Ecological Economics, 47-60.
52
Federal Emergency Management Agency. (1997). Multy Hazard Identification and Risk assessment. A Cornerstone of the National Mitigation Strategy. Prepared in support of the International Decade for Natural Disaster Reduction. Washington, DC: FEMA.
Fell, R., Corominas, J., Bonnard, C., Cascini, L., Leroi, E., & Savage, Z. W. (2008). Guidelines for landslide susceptability, hazard and risk zoning for land used planing. Engeneering Geology, 102, 85-98.
Fernandez-Gimenez, M. E., Huntington, H. P., & Frost, K. J. (2006). Integration or co-optation? Traditional knowledge and science in the Alaska Beluga Whale Committee. Environmental Conservation 33(4), 306-315.
Frantzeskaki, N., van Daalen, E., Slinger, H. J., & Thissen, W. (2009). Policy implications for societal transitions – Lessons from exploring socio-ecological, institutional and socio-technological transitions. ESEE.
Freifeld, C. C., Chunara, R., Mekaru, R. S., Chan, H. E., Kass-hout, T., Lacucci, A. A., & Brownstein, S. J. (2010). Participatory Epidemiology: Use of Mobile Phones for Community-Based Health Reporting. PloS Med, 7(12).
Gaprindashvili, G., Guo, J., & Daorueang, P. (2010). Landslide hazard assessment in the Khelvachauri area, Georgia.
Glade, T. (2003). Vulnerability assessment in landslide risk analysis. Die Erde, 134, 121-138. GNCDRR, UNDP, & SDC. (2010). Who does what where in Disaster Risk Reduction in Georgia -
Second edition. Gogitidze, N., Ivanishvili, M., & Simonishvili, M. (2008). Natural Disaster Risk Management and Disaster
Induced Migration in Georgia. In G. Alternative (Ed.): OSCE. Hilborst, D., & Bankoff, G. (2004). Introduction: Mapping Vulnerability. In G. Bankoff, G. Frerks & D.
Hilhorst (Eds.), Mapping vulnerability: disasters, development, and people: Earthscan Publications Ltd. Honore, T. (1995). About law: an introduction. United states, New York: Oxford Univeristy Press. iapad. (2004). Participatory mapping Toolbox Retrieved 29.01, 2010, from
http://www.iapad.org/toolbox.htm Ifatimehin, O. O. (2009). Using indigenous knowledge in land use planning and management: A
Participatory GIS approach. Kearl, B. E. (1976). Field data collection in the social sciences : experiences in Africa and the Middle East. New York:
Agricultural Development Council. Kienberger, S., & Steinbruch, F. (2005). P-GIS and disaster risk management: Assessing vulnerability with P-GIS
methods – Experiences from Búzi, Mozambique. Paper presented at the International Conference on Participatory Spatial Information Management and Communication, Nairobi,Kenya.
Lagmay, M. A. (2009). Citizen-based interactive flood map Retrieved 10.01, 2011, from http://opinion.inquirer.net/inquireropinion/talkofthetown/view/20091010-229407/Citizen-based-interactive-flood-map
Mayoux, L., & Chambers, R. (2005). Policy arena - Reversing the paradigm: Quantification, participatory methods and pro-poor impact assessment. International Development, 17, 271-298.
McCall, K. M. (2003). Seeking good governance in participatory-GIS: a review of processes and governance dimensions in applying GIS to participatory spatial planning. [doi: DOI: 10.1016/S0197-3975(03)00005-5]. Habitat International, 27(4), 549-573.
McCall, K. M. (2008). Participatory Mapping and Participatory GIS (PGIS) for DRR, Community Risk and Hazard Assessment.
McCall, K. M. (2010). Local Participation in Mapping, Measuring and Monitoring for Community Carbon Forestry. In M. Skutsch (Ed.), Community Forest Monitoring for the Carbon Market: Opportunities Under REDD.
Mechler, R. (2004). Natural disaster risk management and financing disaster losses in developing Countries: Verlag Versicherungswirtschaft (VVW Karlsruhe).
Mercer, J., Kelman, I., Taranis, L., & Suchet-Pearson, S. (2010). Framework for integrating indigenous and scientific knowledge for disaster risk reduction. Disasters, 34(GEOBASE), 214-239.
MES. (2010). Imitated Lesson in Emergency Retrieved 10.01, 2011, from http://www.mes.gov.ge/content.php?id=1132&lang=eng
MIA. (2011). Functions of Department Subsections Retrieved 10.01, 2011, from http://www.police.ge/index.php?m=282
Molenaar, M. (2006). Good Governance Requires Good Geoinformation: Geo-Information and Earth Observation in a Globalizing World. Enschede, The Netherlands: International Institute for Geo-Information Science and earth Observation, ITC.
53
MRDI. (2009). Regional Projects: Village Support Program Retrieved 05.01, 2011, from http://www.mrdi.gov.ge/?page=rightgvv&id=5&lang=2
NEA Geology. (2009). Bulletin of The Results Geo- Hazardous Events for 2008 and their Forecast for 2009 Year: Georgia Tbilisi: MoE.
Peters, G. G., McCall, M. K., & van Westen, C. J. (2009). Coping strategies and manageability : how participatory geographical information systems can transform local knowledge into better policies for disaster risk management Disaster Studies Working paper;22 (pp. 39). Benfield: UCL Hazard Research Centre.
Peters, G. G., van Westen, C. J., & Montoya, A. L. (2005). Community - based flood risk assessment using GIS for the town of San Sebastian, Guatemala. In: Journal of human security and development, 1(2005)1, pp. 29-49.
Peters G.G., & McCall, M. K. (2010). Participatory Mapping and Monitoring of Forest Carbon Services Using Freeware: Cybertracker and Google Earth In M. Skutsch (Ed.), Community Forest Monitoring for the Carbon Market: Opportunities Under REDD.
Provention. (2011). Working in partnership to build safer communities and reduse disaster risk Retrieved 09.01, 2011, from http://www.proventionconsortium.org/
Rambaldi, G. (2010). Participatory Three-dimentional Modelling: Guiding Principles and Applications: ACP-EU Technical Centre for Agricultural and Rural Cooperation (CTA).
Rambaldi, G., Kwaku Kyem, A. P., McCall, M., & Weiner, D. (2006). Participatory Spatial Information Management and Communication in Developing Countries. The Electronic Journal of Information Systems in Developing Countries, 25(1), 1-9.
Raymond, C. M., Fazey, I., Reed, M. S., Stringer, L. C., Robinson, G. M., & Evely, A. C. (2010). Integrating local and scientific knowledge for environmental management. Journal of Environmental Management, 91(8), 1766-1777. doi: DOI: 10.1016/j.jenvman.2010.03.023
Reed, M. S., Dougill, A. J., & Taylor, M. J. (2007). Integrating local and scientific knowledge for adaptation to land degradation: Kalahari rangeland management options. Land Degradation & Development, 18(3), 249-268.
Sabatier, A. P. (1978). The Acquisition and Utilization of Technical Information by Administrative Agencies. Administrative Science Quarterly, 23(3), 396-417.
Sabatier, A. P., & Wieble, C. (2007). The Advocacy Coalition Framework: Innovation and Clarification. In A. P. Sabatier (Ed.), Theories of the Policy Process, Second Edition.
Salter, J. (1998). Management in the Emergency Management Context. In J. Smith (Ed.), Risk Management for Safer Communities. Melbourne.
Salukvadze, J. (2006). Geoinformation Technologies in Land Management and Beyond: Case of Georgia. Paper presented at the XXIII FIG Congress, Munich, Germany.
Schneiderbauer, S., & Ehrlich, D. (2006). Social levels and hazard (in) dependence in determining vulnerability. In J. r. Birkmann (Ed.), Measuring Vulnerability to Hazards to Natural Hazrads :Towards Disaster Resilient Societies.
Shlaer, S., & Mellor, J. S. (1988). Object-Oriented Systems Analysis: Modeling the World in Data. New Jersey: Yourdon Press.
STUDIO RE. (2010). TV show: Debates on Village Support Program Retrieved 03.01, 2011, from http://www.studiore.org/?menu=3&art=128&lang=eng
Subedi, J. (2010). Disaster Informatics: Information Management as a Tool for Effective Disaster Risk Reduction. In E. Asimakopoulou & N. Bessis (Eds.), Advanced ICTs for Disaster Management and Threat Detection: Collaborative and Distributed Frameworks (pp. 415): IGI Global.
Sutanta, H., Rajabifard, A., & Bishop, I. (2009). An integrated approach for disaster risk Reduction using spatial planning and SDI Platform. Paper presented at the Spatial Sciences Institute Biennial International Conference, Adelaide, South Australia.
Thywissen, K. (2010, 15.07.10). Core Terminology of Disaster Reduction Retrieved 27.12, 2010, from http://www.ehs.unu.edu/moodle/mod/glossary/view.php?id=1&mode=letter&hook=V&sortkey=&sortorder=&fullsearch=0&page=-1
Tran, P., Shaw, R., Chantry, G., & Norton, J. (2009). GIS and local knowledge in disaster management: a case study of flood risk mapping in Viet Nam. Disasters, 33(1), 152-169. doi: 10.1111/j.1467-7717.2008.01067.x
Tripathi, N., & Bhattarya, S. (2004). Integrating Indigenous knowledge and GIS for Participatory Natural Resource Managment: State-of-the-Practice. EJISDC, 17(3), 1-13.

54
Tsereteli, E., & Gafrindashvili, M. (2010). Natural Disasters. In MoE (Ed.), National Report on the State of the Environment of Georgia. 2007-2009. Tbilisi.
UN/ISDR. (2004a). Living with Risk: A global review of disaster reduction initiatives. UN/ISDR. (2004b, 31.03.04). Terminology: Basic terms of disaster risk reduction Retrieved 27.12, 2010,
from http://www.unisdr.org/eng/library/lib-terminology-eng%20home.htm UN/ISDR. (2005). Hyogo Framework for 2005-2015: Building the Resilience of Nations and Communities to
Disasters. Paper presented at the World Conference on Disaster Reduction, Kobe, Hyogo, Japan. United Nations. (2010a). Environmental Performance Reviews : Georgia - Second Review. New York and
Geneva. United Nations. (2010b). United Nations Country Team Contingency Plan Georgia UN Contingency
Planning Focal Points Group. Third draft. UNU-EHS. (2010). Measuring Vulnerability to Hazards of Natural Origin” - UNU-EHS Expert Working
Group Retrieved 28.12, 2010, from http://www.ehs.unu.edu/article/read/measuring-vulnerability
van Westen, C. (2009 ). Risk Analysis. In C. van Westen (Ed.), Multi-hazard risk assessment: Distance education course/Guide book: United Nations University – ITC School on Disaster Geoinformation Management.
van Westen, C., & Kingma, N. (2009a). Vulnerability assessment. In C. van Westen (Ed.), Multi-hazard risk assessment: Distance education course/Guide book: United Nations University – ITC School on Disaster Geoinformation Management.
van Westen, C., & Kingma, N. (2009b). Disaster Risk Management. In C. van Westen (Ed.), Multi-hazard risk assessment: Distance education course/Guide book: United Nations University – ITC School on Disaster Geoinformation Management.
Venton, P., & Hansford, B. (2006). Reducing Risk of Disaster in Our Communities. England: Tearfund. White, I., Kingston, R., & Barker, A. (2010). Participatory geographic information systems and public
engagement within food risk management. Flood Risk Management, 3, 337–346. Yanow, D. (2003). Accessing local knowledge. In A. M. Haje & H. Wagenaar (Eds.), Deliberative Policy
Analysis: Understanding Governance in the Network Society (pp. 228-246). Cambridge: Cambridge University Press.
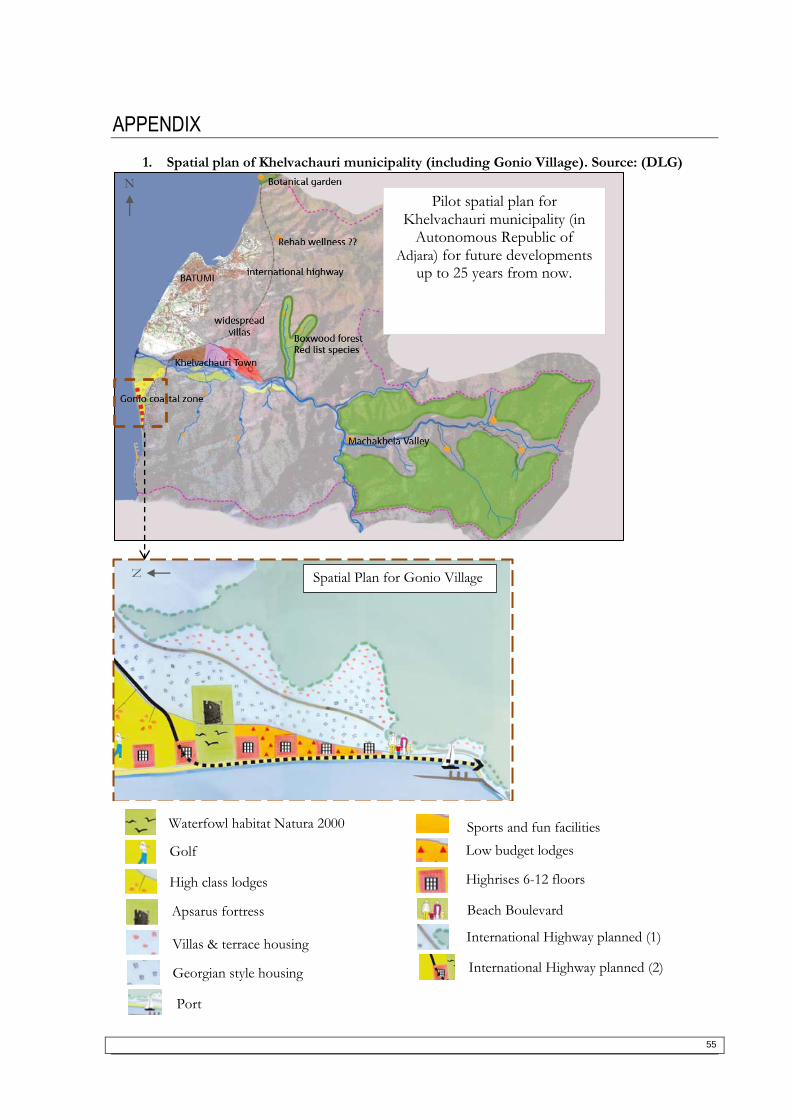
55
APPENDIX
1. Spatial plan of Khelvachauri municipality (including Gonio Village). Source: (DLG)
Waterfowl habitat Natura 2000
Georgian style housing
High class lodges
Golf
Apsarus fortress
Villas & terrace housing
Sports and fun facilities
Low budget lodges
Highrises 6-12 floors
Beach Boulevard
International Highway planned (1)
Port
International Highway planned (2)
Spatial Plan for Gonio Village
Pilot spatial plan for Khelvachauri municipality (in
Autonomous Republic of Adjara) for future developments
up to 25 years from now.
N
N

56
2. Semi-structured interviews
Respondents N Date:
Location X: Y:
Respondent’s information
Name Gender Age Residence Comments
M/F
Household demographic information
N of persons > 6 6-16 17-63 63> Comments
Household social and economic information
Health
(dependency)
Age of
dependent
Source of livelihood N of
jobs
Female
headed HH
Comments
1.
2.
3.
4.
5.
Building information
Construction period Construction material N of floors State
1.Before 1950
2. 1950-1980
3. After 1980
1.Wood
2. Brick
3. Stone
4. Betone
5.Other
0
1
2
3
More than 3
1. Finished
2. Under construction
3. Destroyed
Remembering major hazards
N Type Year
Month
Date Intensity Frequency
Depth Dura
tion
Triggerin
g factors
High
frequency
1
H M L H M L 1.
2.
3.
4.
Yes No
2
H M L H M L 1.
2.
3.
4.
Yes No
Hazard Intensity perceived by the people: High (H), Moderate (M), and Low (L). Frequency of hazard event: Hazards occurring every 10 or more years are perceived as high frequency (H) Hazards occurring from 2 to 10 years are perceived as moderate frequency (M) Hazards occurring every two years or less are perceived as high frequency (L)
57
Available Assets of HHs
Internet
PC
Mobile phone What are the damages caused by the hazard event? 1. 2. What are the coping mechanisms applied against hazard? What are the basic needs to cope with risk reduction?

58
3. List of the respondents for open ended interviews
N Respondents Name Institution Name
1 Besik Sanaia MIA Emergency Management Department
2 Jemal Kolashvili MIA Emergency Management Department
3 Alexsandr Movsesian MRDI
4 Giorgi Dididze MRDI
5 Emil Cereteli NEA (Ggeology)
6 Natia Chomakhidze NEA (Ggeology)
7 Giorgi Gaprindashvili NEA (Ggeology)
8 Marina Kordzakhia NEA (Hydrometeorology)
9 Irakli Megrelidze NEA (Hydrometeorology)
10 David Giorgidze NEA (Coast Protection Department)
11 Tariel Tuskia Branch of NEA (Ggeology) on regional level
12 Irakli Kobulia CENN
13 Irakli Chachia CENN
14 George Datusani Oxfam GB
15 Davit Vezdeni Care Georgia
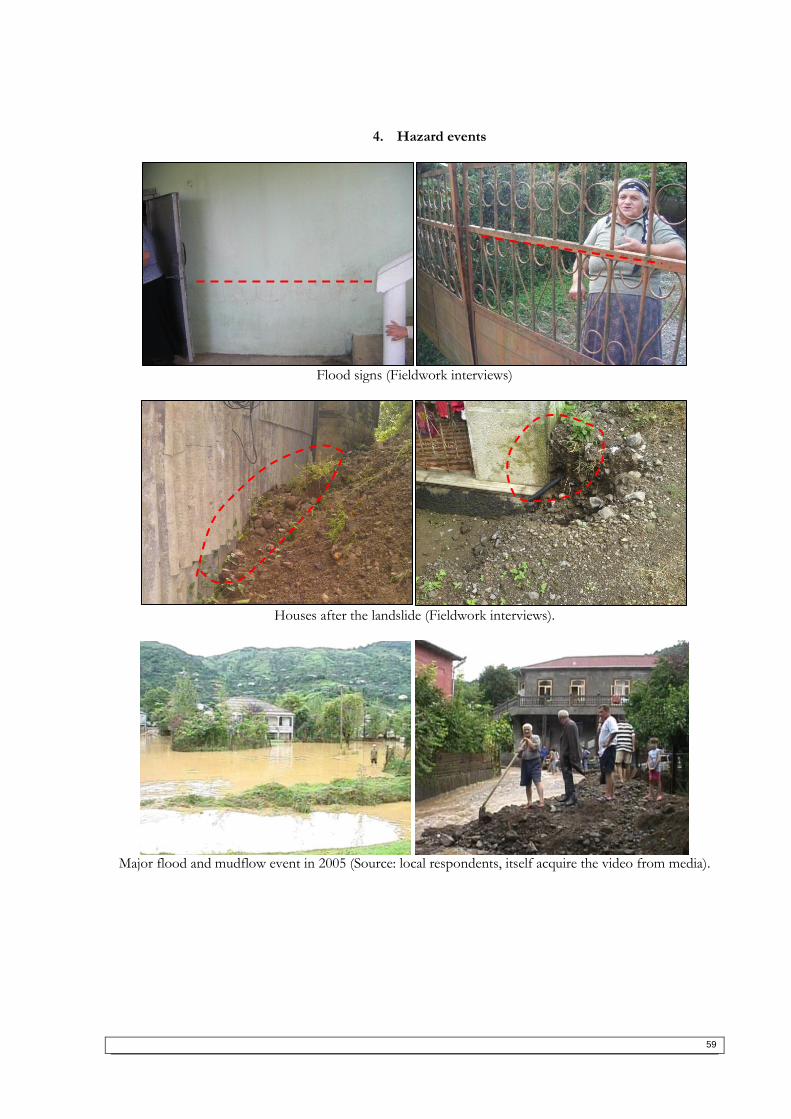
59
4. Hazard events
Flood signs (Fieldwork interviews)
Houses after the landslide (Fieldwork interviews).
Major flood and mudflow event in 2005 (Source: local respondents, itself acquire the video from media).

60
5. Data base model of gathered LSK
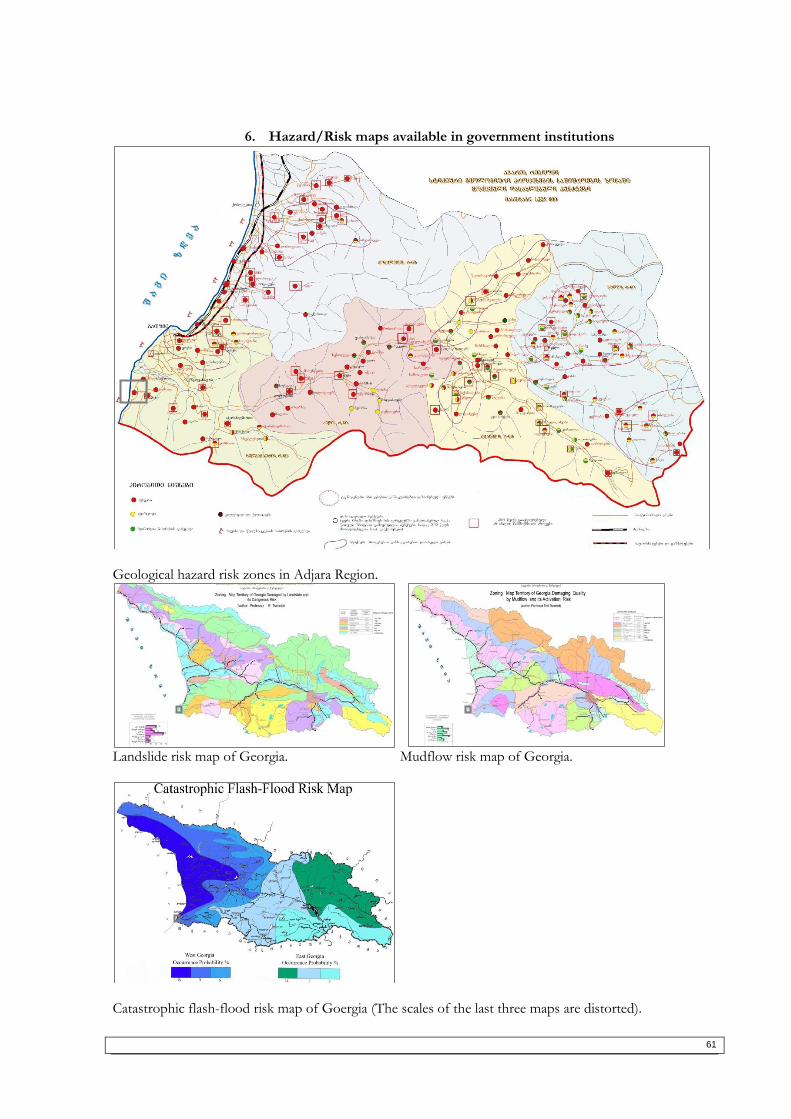
61
6. Hazard/Risk maps available in government institutions
Geological hazard risk zones in Adjara Region.
Landslide risk map of Georgia. Mudflow risk map of Georgia.
Catastrophic flash-flood risk map of Goergia (The scales of the last three maps are distorted).

62
7. Data and methodology for Landslide Susceptibility Mapping
Engineering geological map
from 80th
Landslide inventory from Google Earth
image
Topographic map of 25:000
scaleCadaster 2006
Active landslide Land use
Pro
du
ced
dat
a
Slope
LithologyContour lines
(digitized in ArcGIS)
Lithology weight Aspect weights Land use weight
Lan
dsl
ide
as
sess
me
nt
Exis
tin
g d
ata
Slope weights
Building
Aspect
Lan
dsl
ide
Su
sce
pti
bili
ty m
ap
Landslide Susceptibility map
Ph
ysic
al
vuln
era
bili
ty
asse
ssm
en
t
Building vulnerability
Data and methodology used for Landslide Susceptibility Mapping using Statistical Method. Adapted from
(Gaprindashvili et al., 2010).

63
8. 2005 flood scenario reconstruction using Kriging method. The distribution of 88 sample points for flood zone was calculated in SPSS software using one sample Kolmogorov_Smirnov test that would give a hint for relevant Kriging method selection. The result of the test showed that water depth (cm) and duration (days) data are normally distributed (see figure (a) and (b)).
(a) (b)
One-Sample Kolmogorov_Smirnov test for water depth (a) and water duration (b).
Kriging is an interpolation technique that weights surrounding sample values to predict unmeasured locations, but kriging incorporates as well overall spatial arrangements of the sample points. Ordinary kriging is the most widely used and it assumes that sample data are normally distributed. Thus, as the sample points on water depth and duration appeared to be a normally distributed, ordinary kriging were selected as most appropriate method. Weighted factor in ordinary kriging is determined by the semivariogram. Semivariogram estimate a spatial autocorrelation of sample points that itself depends on the model of autocorrelation. Range, sill and nugget are usually used as parameters to fit the model (ESRI, 2007). The semvariogram was build using the spherical model that is the most commonly used model and as well the model was best fitted (after several times manipulate with parameters) to the both sample points. The figure (c) and figure (d) represents semivariograms of water depth and duration sample points representing relationship between distance and semi variance (squared differences of pairs of sample point vales).
(c) (d)
Spherical semivariogram model for water depth (c) and water duration (d)
Distance, h 10-2
g 10
0 0.45 0.9 1.35 1.8 2.25 2.7 3.15 3.6
11.92
23.84
35.76
47.68
59.6
Distance, h 10-1
g 10-2
0 5 10 15 20 25 30 35 40
4.59
9.18
13.77
18.36
22.95
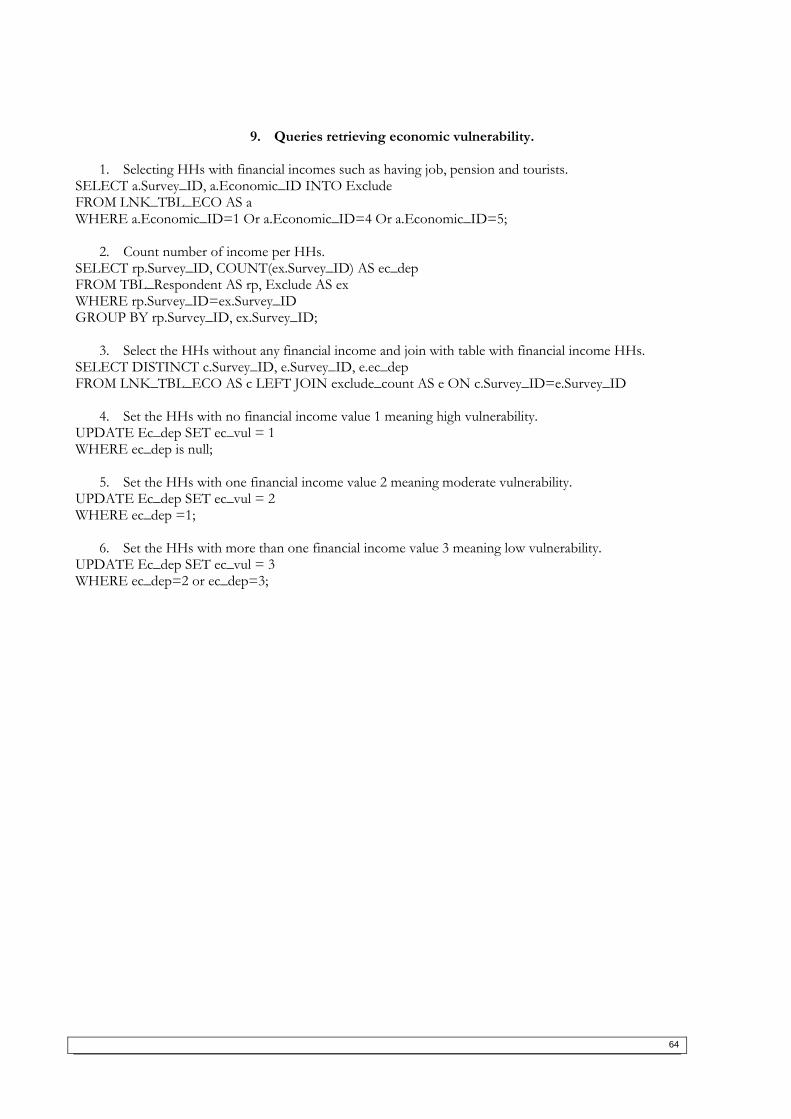
64
9. Queries retrieving economic vulnerability.
1. Selecting HHs with financial incomes such as having job, pension and tourists.
SELECT a.Survey_ID, a.Economic_ID INTO Exclude FROM LNK_TBL_ECO AS a WHERE a.Economic_ID=1 Or a.Economic_ID=4 Or a.Economic_ID=5;
2. Count number of income per HHs. SELECT rp.Survey_ID, COUNT(ex.Survey_ID) AS ec_dep FROM TBL_Respondent AS rp, Exclude AS ex WHERE rp.Survey_ID=ex.Survey_ID GROUP BY rp.Survey_ID, ex.Survey_ID;
3. Select the HHs without any financial income and join with table with financial income HHs. SELECT DISTINCT c.Survey_ID, e.Survey_ID, e.ec_dep FROM LNK_TBL_ECO AS c LEFT JOIN exclude_count AS e ON c.Survey_ID=e.Survey_ID
4. Set the HHs with no financial income value 1 meaning high vulnerability. UPDATE Ec_dep SET ec_vul = 1 WHERE ec_dep is null;
5. Set the HHs with one financial income value 2 meaning moderate vulnerability. UPDATE Ec_dep SET ec_vul = 2 WHERE ec_dep =1;
6. Set the HHs with more than one financial income value 3 meaning low vulnerability. UPDATE Ec_dep SET ec_vul = 3 WHERE ec_dep=2 or ec_dep=3;
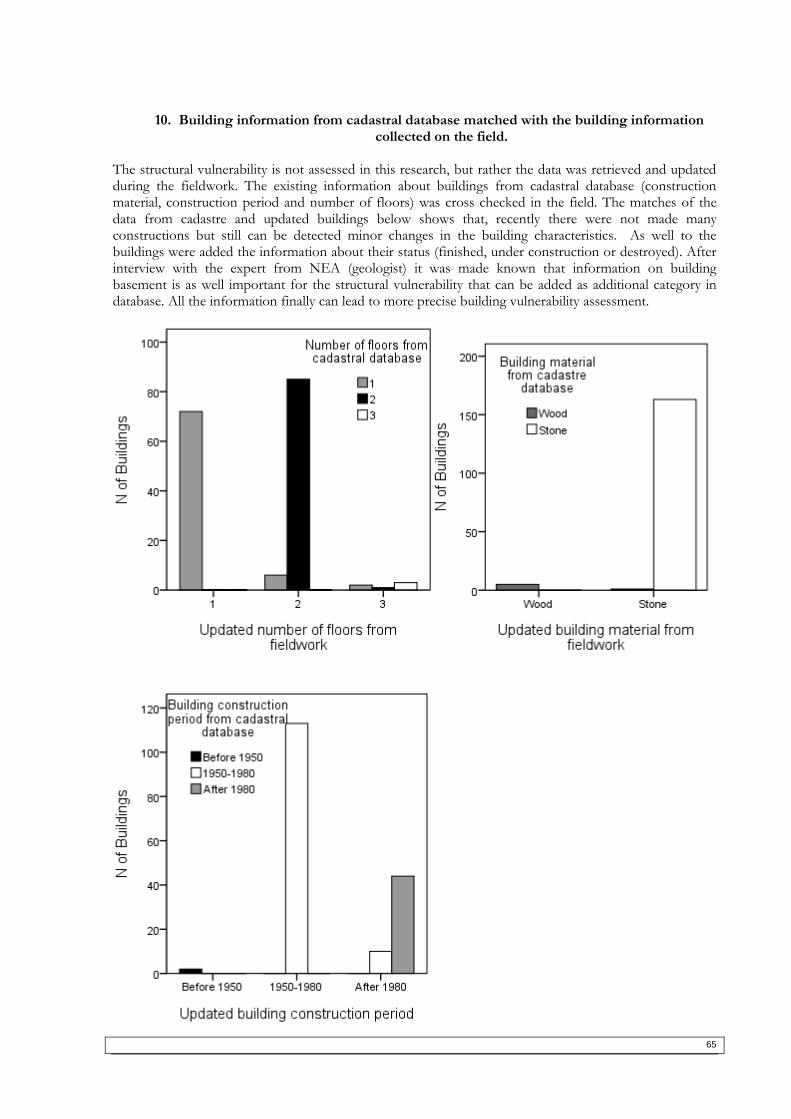
65
10. Building information from cadastral database matched with the building information collected on the field.
The structural vulnerability is not assessed in this research, but rather the data was retrieved and updated during the fieldwork. The existing information about buildings from cadastral database (construction material, construction period and number of floors) was cross checked in the field. The matches of the data from cadastre and updated buildings below shows that, recently there were not made many constructions but still can be detected minor changes in the building characteristics. As well to the buildings were added the information about their status (finished, under construction or destroyed). After interview with the expert from NEA (geologist) it was made known that information on building basement is as well important for the structural vulnerability that can be added as additional category in database. All the information finally can lead to more precise building vulnerability assessment.