Assessing the Factors Affecting Cesarean Section Selection ...
9
Iran J Public Health, Vol. 50, No.4, Apr 2021, pp.816-824 Original Article Copyright © 2021 Zandkarimi et al. Published by Tehran University of Medical Sciences. This work is licensed under a Creative Commons Attribution-NonCommercial 4.0 International license (https://creativecommons.org/licenses/by-nc/4.0/). Non-commercial uses of the work are permitted, provided the original work is properly cited. 816 Available at: http://ijph.tums.ac.ir Assessing the Factors Affecting Cesarean Section Selection in Ira- nian Women Using Multilevel Count Models with Excess Zeros Eghbal Zandkarimi 1 , *Abbas Moghimbeigi 2 , Hossein Mahjub 3 1. Departement of Biostatistics, School of Public Health, Hamadan University of Medical Sciences, Hamadan, Iran 2. Department of Biostatistics and Epidemiology, School of Health & Research Center for Health, Safety and Environment, Alborz University of Medical Sciences, Karaj, Iran 3. Research Center for Health Sciences, Department of Biostatistics, School of Public Health, Hamadan University of Medical Scienc- es, Hamadan, Iran *Corresponding Author: Email: [email protected] (Received 05 Feb 2020; accepted 24 Apr 2020) Introduction The WHO has recommended the optimal rate for CD to be between 10-15% (1).The usages of CD has increased in worldwide various countries (2-5). According to the WHO, an average of 25.7% of births in the world between 2004 and 2008 was performed by CD, that the lowest rate Abstract Background: Iran has ranked second in the frequency of cesarean delivery (CD) and this rate in 2014 has in- creased by 56 percent. The CD has multiple complications for the woman and newborn, and due to the wom- en's readmission after surgery impose additional costs to the countries. Although CD has many complications and is not recommended by obstetrician and midwives; some factors affect the choice of this method of deliv- ery. Methods: We used data from the Iranian Institute for Health Sciences Research (IIHSR) in 2015. We studied the effects of factors such as socioeconomic and demographic factors and supplemental insurance status in the choice of CD. We used multilevel Zero-Inflated models for the modeling of data. Results: The employed women resident in urban areas with the high-income and age greater than 34-yr old and supplemental insurance more likely chose CD. On the other hand, women with high education level, women who use at least one media (e.g. Radio, television, etc.) and women that use contraceptive methods have chosen the less CD. Conclusion: Our findings highlighted the importance of supplemental insurance and socio-economic status in choosing a CD by women. However, in some cases especially in the rich class of society, the high cost of this type of delivery does not affect the choice decrease of it, and governments should adopt rigorous policies in using this method. Keywords: Cesarean delivery; Vaginal delivery; Multilevel models; Zero-inflated
Transcript of Assessing the Factors Affecting Cesarean Section Selection ...
Iran J Public Health, Vol. 50, No.4, Apr 2021, pp.816-824 Original Article
Copyright © 2021 Zandkarimi et al. Published by Tehran University of Medical Sciences.
This work is licensed under a Creative Commons Attribution-NonCommercial 4.0 International license (https://creativecommons.org/licenses/by-nc/4.0/). Non-commercial uses of the work are permitted, provided the original work is properly cited.
816 Available at: http://ijph.tums.ac.ir
Assessing the Factors Affecting Cesarean Section Selection in Ira-nian Women Using Multilevel Count Models with Excess Zeros
Eghbal Zandkarimi 1, *Abbas Moghimbeigi 2, Hossein Mahjub 3
1. Departement of Biostatistics, School of Public Health, Hamadan University of Medical Sciences, Hamadan, Iran 2. Department of Biostatistics and Epidemiology, School of Health & Research Center for Health, Safety and Environment, Alborz
University of Medical Sciences, Karaj, Iran 3. Research Center for Health Sciences, Department of Biostatistics, School of Public Health, Hamadan University of Medical Scienc-
es, Hamadan, Iran
*Corresponding Author: Email: [email protected]
(Received 05 Feb 2020; accepted 24 Apr 2020)
Introduction The WHO has recommended the optimal rate for CD to be between 10-15% (1).The usages of CD has increased in worldwide various countries
(2-5). According to the WHO, an average of 25.7% of births in the world between 2004 and 2008 was performed by CD, that the lowest rate
Abstract Background: Iran has ranked second in the frequency of cesarean delivery (CD) and this rate in 2014 has in-creased by 56 percent. The CD has multiple complications for the woman and newborn, and due to the wom-en's readmission after surgery impose additional costs to the countries. Although CD has many complications and is not recommended by obstetrician and midwives; some factors affect the choice of this method of deliv-ery. Methods: We used data from the Iranian Institute for Health Sciences Research (IIHSR) in 2015. We studied the effects of factors such as socioeconomic and demographic factors and supplemental insurance status in the choice of CD. We used multilevel Zero-Inflated models for the modeling of data. Results: The employed women resident in urban areas with the high-income and age greater than 34-yr old and supplemental insurance more likely chose CD. On the other hand, women with high education level, women who use at least one media (e.g. Radio, television, etc.) and women that use contraceptive methods have chosen the less CD. Conclusion: Our findings highlighted the importance of supplemental insurance and socio-economic status in choosing a CD by women. However, in some cases especially in the rich class of society, the high cost of this type of delivery does not affect the choice decrease of it, and governments should adopt rigorous policies in using this method. Keywords: Cesarean delivery; Vaginal delivery; Multilevel models; Zero-inflated
Zandkarimi et al.: Assessing the Factors Affecting Cesarean Section Selection in …
Available at: http://ijph.tums.ac.ir 817
(19%) of use of CD in European countries and the highest rates (29.2%) of use in Latin Ameri-can countries (2, 3). In 2000, the rate of CD in Iran had been 35 percent that this rate in 2014 has increased 56 percent and according to the WHO, Iran has ranked second in the frequency of CD(6).According to official statistics, 40% of cesareans in Iran were unnecessary and selective (7). Several studies have been performed to assess the complications of delivery cesarean. Complica-tions including post-cesarean wound infection, pelvic and uterine infections, Urinary Tract Infec-tion (UTI), Pulmonary Embolism (PE), venous thrombosis, complications of anesthesia, and Bleeding after a C-Section of CD have been re-ported more than vaginal delivery (VD)that, these complications are lead to increased mortality and morbidity of maternal and reduced fertility rates (1, 7-13). CD for infants also has complications such as respiratory problems, including Transient Tachypnea of the Newborn (TTN), child mor-bidity, neonatal respiratory distress syndrome (NRDS), the need for admission to the Neonatal Intensive Care Unit (NICU), premature baby's weight loss, and early neonatal injury and delay in breastfeeding of CD have been reported more than VD (14-17). On the other hand, the CD lead to re-admission of women and impose addi-tional costs on the health system of the country and cause mental harm to the woman and it af-fects effective Breastfeeding to the infant (17). The CD also affects the outcomes of the next pregnancy, so that in the women with a history of CD, events like placenta accreta, placenta previa, placental abruption, and uterine rupture have been reported (18, 19). Therefore, according to the above-mentioned studies, although CD has many complications and is not recommended by obstetrician and midwives except in certain cases, but factors such as fear of VD pain (20-23), lack of awareness the harmful consequences of this type of delivery (7), the socioeconomic status (24, 25) and cultural factors in some countries (26, 27) affect the choice of this method of delivery.
Considering that in Iran, one of the goals of the health promotion plan in midwifery is reducing the number of CD, and in order to achieve this, it is necessary to study the statistical societies in the country and determine the factors affecting the choice of CD in women. Therefore, our aim was to determine the factors affecting the choice of CD among Iranian women using the data of the Iranian Institute for Health Sciences Research (IIHSR).
Materials & Methods We used data from National Institute for Health Research (NIH) in 2015. This study is a national survey and according to the regula-tions, it has an ethical code and the information collected is with the consent of the participants and the information will remain confidential. Households in all Iran cities were randomly en-rolled and then the health status of the residents has been investigated. From these households, questions asked in a variety of areas including social and economic characteristics of the house-hold, mortality, fertility, coverage of children and women's health services, and people's knowledge of important diseases. In this study, the variables of woman's age (<20(reference category); 21-24; 25-29; 30-34 ;> 34), use of contraceptive meth-ods (the pill, IUD etc.) (No 0; Yes 1), use of me-dia (least one media such as newspapers, TV, In-ternet, etc. 1; No 0), monthly household income (Low (Less than 5 million Rials); Medium (Be-tween 5 million Rials to 10 million Rials); High (More than 10 million Rials)), woman's occupa-tion status (Housewife 0; Employee 1), father's occupation status (Unemployed 0; Employee 1), parent's education level (under the high school(reference category); high school; academic level), living area (Rural 0; Urban 1), insurance status (No 0; Yes 1), supplemental insurance sta-tus (No 0; Yes 1) are used as predictor variables. The outcome variable used for this study was the number of women cesarean deliveries. Consider-ing that a high percentage of observations are zero (67% had VD), therefore we used zero-
Iran J Public Health, Vol. 50, No.4, Apr 2021, pp.816-824
818 Available at: http://ijph.tums.ac.ir
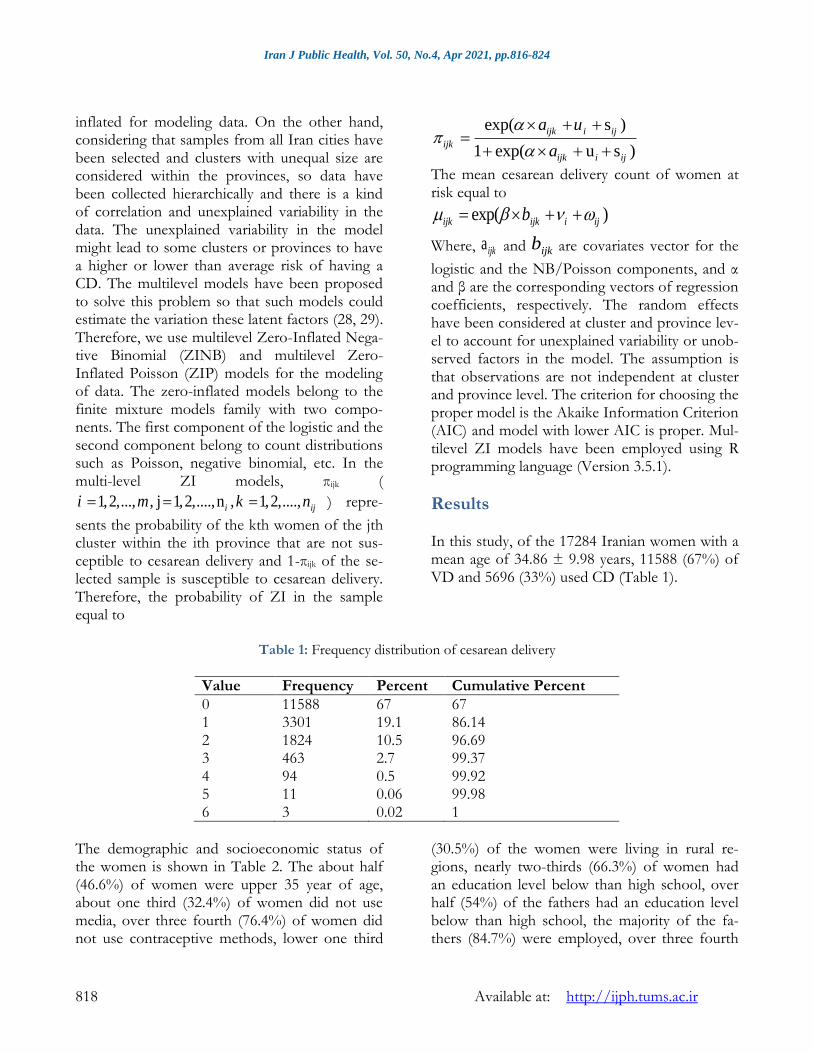
inflated for modeling data. On the other hand, considering that samples from all Iran cities have been selected and clusters with unequal size are considered within the provinces, so data have been collected hierarchically and there is a kind of correlation and unexplained variability in the data. The unexplained variability in the model might lead to some clusters or provinces to have a higher or lower than average risk of having a CD. The multilevel models have been proposed to solve this problem so that such models could estimate the variation these latent factors (28, 29). Therefore, we use multilevel Zero-Inflated Nega-tive Binomial (ZINB) and multilevel Zero-Inflated Poisson (ZIP) models for the modeling of data. The zero-inflated models belong to the finite mixture models family with two compo-nents. The first component of the logistic and the second component belong to count distributions such as Poisson, negative binomial, etc. In the multi-level ZI models, πijk (
1,2,..., , j 1,2,....,n , 1,2,....,i iji m k n ) repre-
sents the probability of the kth women of the jth cluster within the ith province that are not sus-ceptible to cesarean delivery and 1-πijk of the se-lected sample is susceptible to cesarean delivery. Therefore, the probability of ZI in the sample equal to
exp( s )
1 exp( u s )
ijk i ij
ijk
ijk i ij
a u
a
The mean cesarean delivery count of women at risk equal to
exp( )ijk ijk i ijb
Where, aijk and ijkb are covariates vector for the
logistic and the NB/Poisson components, and α and β are the corresponding vectors of regression coefficients, respectively. The random effects have been considered at cluster and province lev-el to account for unexplained variability or unob-served factors in the model. The assumption is that observations are not independent at cluster and province level. The criterion for choosing the proper model is the Akaike Information Criterion (AIC) and model with lower AIC is proper. Mul-tilevel ZI models have been employed using R programming language (Version 3.5.1).
Results In this study, of the 17284 Iranian women with a mean age of 34.86 ± 9.98 years, 11588 (67%) of VD and 5696 (33%) used CD (Table 1).
Table 1: Frequency distribution of cesarean delivery
Value Frequency Percent Cumulative Percent
0 11588 67 67
1 3301 19.1 86.14
2 1824 10.5 96.69
3 463 2.7 99.37
4 94 0.5 99.92
5 11 0.06 99.98
6 3 0.02 1
The demographic and socioeconomic status of the women is shown in Table 2. The about half (46.6%) of women were upper 35 year of age, about one third (32.4%) of women did not use media, over three fourth (76.4%) of women did not use contraceptive methods, lower one third
(30.5%) of the women were living in rural re-gions, nearly two-thirds (66.3%) of women had an education level below than high school, over half (54%) of the fathers had an education level below than high school, the majority of the fa-thers (84.7%) were employed, over three fourth
Zandkarimi et al.: Assessing the Factors Affecting Cesarean Section Selection in …
Available at: http://ijph.tums.ac.ir 819
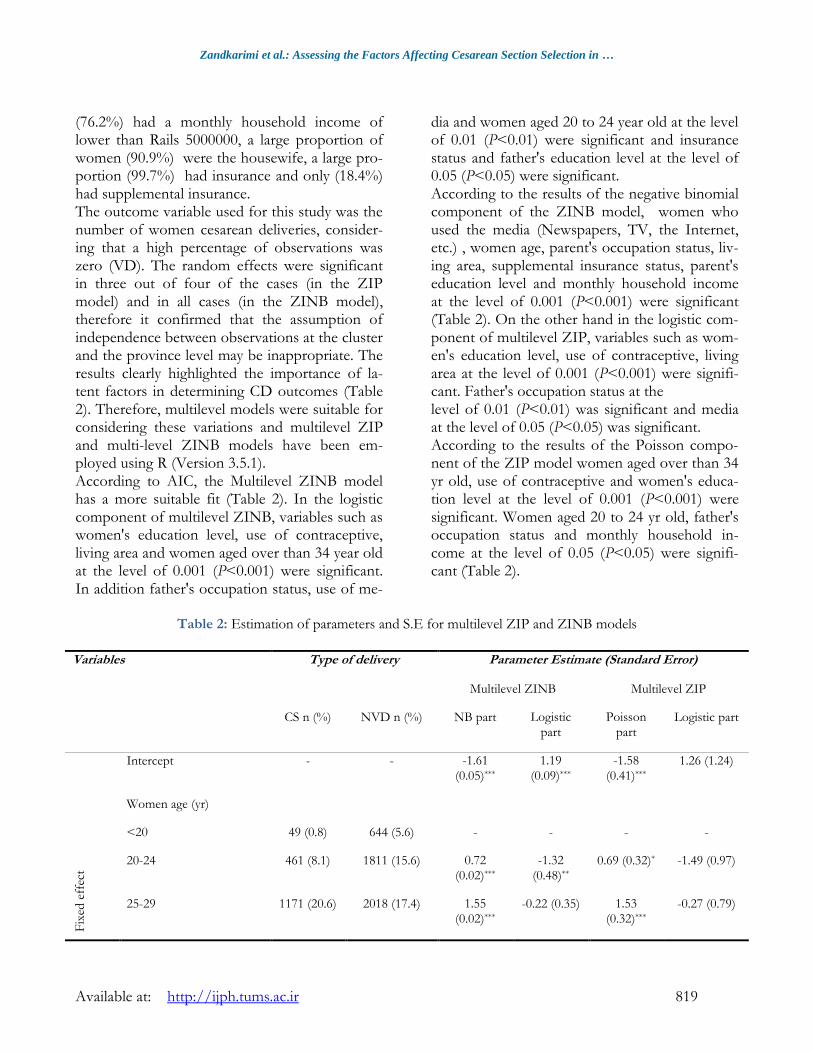
(76.2%) had a monthly household income of lower than Rails 5000000, a large proportion of women (90.9%) were the housewife, a large pro-portion (99.7%) had insurance and only (18.4%) had supplemental insurance. The outcome variable used for this study was the number of women cesarean deliveries, consider-ing that a high percentage of observations was zero (VD). The random effects were significant in three out of four of the cases (in the ZIP model) and in all cases (in the ZINB model), therefore it confirmed that the assumption of independence between observations at the cluster and the province level may be inappropriate. The results clearly highlighted the importance of la-tent factors in determining CD outcomes (Table 2). Therefore, multilevel models were suitable for considering these variations and multilevel ZIP and multi-level ZINB models have been em-ployed using R (Version 3.5.1). According to AIC, the Multilevel ZINB model has a more suitable fit (Table 2). In the logistic component of multilevel ZINB, variables such as women's education level, use of contraceptive, living area and women aged over than 34 year old at the level of 0.001 (P<0.001) were significant. In addition father's occupation status, use of me-
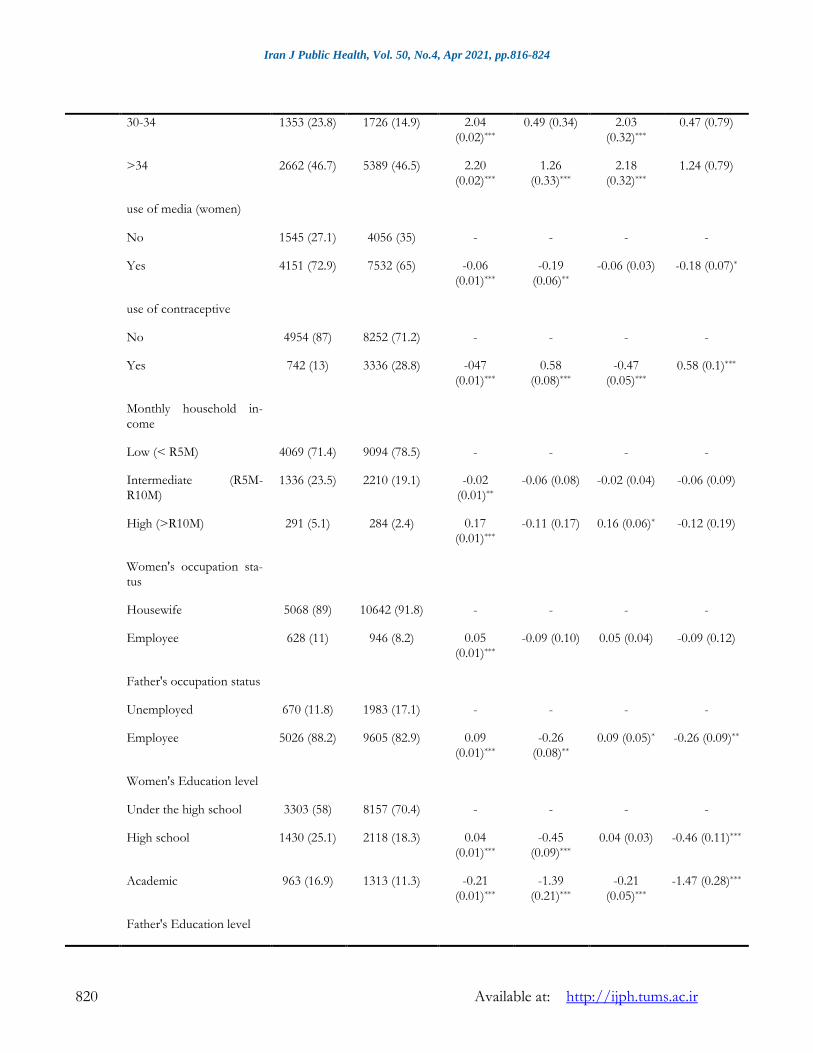
dia and women aged 20 to 24 year old at the level of 0.01 (P<0.01) were significant and insurance status and father's education level at the level of 0.05 (P<0.05) were significant. According to the results of the negative binomial component of the ZINB model, women who used the media (Newspapers, TV, the Internet, etc.) , women age, parent's occupation status, liv-ing area, supplemental insurance status, parent's education level and monthly household income at the level of 0.001 (P<0.001) were significant (Table 2). On the other hand in the logistic com-ponent of multilevel ZIP, variables such as wom-en's education level, use of contraceptive, living area at the level of 0.001 (P<0.001) were signifi-cant. Father's occupation status at the level of 0.01 (P<0.01) was significant and media at the level of 0.05 (P<0.05) was significant. According to the results of the Poisson compo-nent of the ZIP model women aged over than 34 yr old, use of contraceptive and women's educa-tion level at the level of 0.001 (P<0.001) were significant. Women aged 20 to 24 yr old, father's occupation status and monthly household in-come at the level of 0.05 (P<0.05) were signifi-cant (Table 2).
Table 2: Estimation of parameters and S.E for multilevel ZIP and ZINB models
Variables
Type of delivery Parameter Estimate (Standard Error)
CS n (%)
NVD n (%)
Multilevel ZINB Multilevel ZIP
NB part Logistic part
Poisson part
Logistic part
Fix
ed e
ffec
t
Intercept - - -1.61
(0.05)***
1.19
(0.09)***
-1.58
(0.41)***
1.26 (1.24)
Women age (yr)
<20 49 (0.8) 644 (5.6) - - - -
20-24 461 (8.1) 1811 (15.6) 0.72 (0.02)***
-1.32 (0.48)**
0.69 (0.32)* -1.49 (0.97)
25-29 1171 (20.6) 2018 (17.4) 1.55 (0.02)***
-0.22 (0.35) 1.53 (0.32)***
-0.27 (0.79)
Iran J Public Health, Vol. 50, No.4, Apr 2021, pp.816-824
820 Available at: http://ijph.tums.ac.ir
30-34 1353 (23.8) 1726 (14.9) 2.04 (0.02)***
0.49 (0.34) 2.03 (0.32)***
0.47 (0.79)
>34 2662 (46.7) 5389 (46.5) 2.20 (0.02)***
1.26 (0.33)***
2.18 (0.32)***
1.24 (0.79)
use of media (women)
No 1545 (27.1) 4056 (35) - - - -
Yes 4151 (72.9) 7532 (65) -0.06 (0.01)***
-0.19 (0.06)**
-0.06 (0.03) -0.18 (0.07)*
use of contraceptive
No 4954 (87) 8252 (71.2) - - - -
Yes 742 (13) 3336 (28.8) -047 (0.01)***
0.58 (0.08)***
-0.47 (0.05)***
0.58 (0.1)***
Monthly household in-come
Low (< R5M) 4069 (71.4) 9094 (78.5) - - - -
Intermediate (R5M-R10M)
1336 (23.5) 2210 (19.1) -0.02 (0.01)**
-0.06 (0.08) -0.02 (0.04) -0.06 (0.09)
High (>R10M) 291 (5.1) 284 (2.4) 0.17 (0.01)***
-0.11 (0.17) 0.16 (0.06)* -0.12 (0.19)
Women's occupation sta-tus
Housewife 5068 (89) 10642 (91.8) - - - -
Employee 628 (11) 946 (8.2) 0.05 (0.01)***
-0.09 (0.10) 0.05 (0.04) -0.09 (0.12)
Father's occupation status
Unemployed 670 (11.8) 1983 (17.1) - - - -
Employee 5026 (88.2) 9605 (82.9) 0.09 (0.01)***
-0.26 (0.08)**
0.09 (0.05)* -0.26 (0.09)**
Women's Education level
Under the high school 3303 (58) 8157 (70.4) - - - -
High school 1430 (25.1) 2118 (18.3) 0.04 (0.01)***
-0.45 (0.09)***
0.04 (0.03) -0.46 (0.11)***
Academic 963 (16.9) 1313 (11.3) -0.21 (0.01)***
-1.39 (0.21)***
-0.21 (0.05)***
-1.47 (0.28)***
Father's Education level
Zandkarimi et al.: Assessing the Factors Affecting Cesarean Section Selection in …
Available at: http://ijph.tums.ac.ir 821
Under the high school 2564 (45) 6768 (58.4) - - - -
High school 1793 (31.5) 3147 (27.2) 0.06 (0.01)***
-0.16 (0.07)*
0.06 (0.04) -0.17 (0.09)
Academic 1339 (23.5) 1673 (14.4) 0.08 (0.01)***
-0.22 (0.10)*
0.09 (0.05) -0.21 (0.12)
Residential area
Rural 1335 (23.4) 3929 (33.9) - - - -
Urban 4361 (76.6) 7659 (66.1) 0.02 (0.01)***
-0.47 (0.07)***
0.02 (0.04) -0.47 (0.08)***
Insurance status
No 19 (0.3) 25 (0.2) - - - -
Yes 5677 (99.7) 11563 (99.8) 0.05 (0.04) 0.78 (0.3)* 0.04 (0.25) 0.77 (0.95)
Supplemental Insurance status
No 4395 (77.2) 9710 (83.8) - - - -
Yes 1301 (22.8) 1878 (16.2) 0.07 (0.01)***
0.08 (0.08) 0.07 (0.04) 0.08 (0.09)
1/r 0.01
(0.00)***
Ran-dom effect
σ 2 (Province) 0 (0.00)* 0.10 (0.04)*
0.001 (0.002) 0.09 (0.03)**
σ 2 (Cluster) 0 (0.00)* 0.18 (0.06)**
0.03 (0.01)** 0.27 (0.07)***
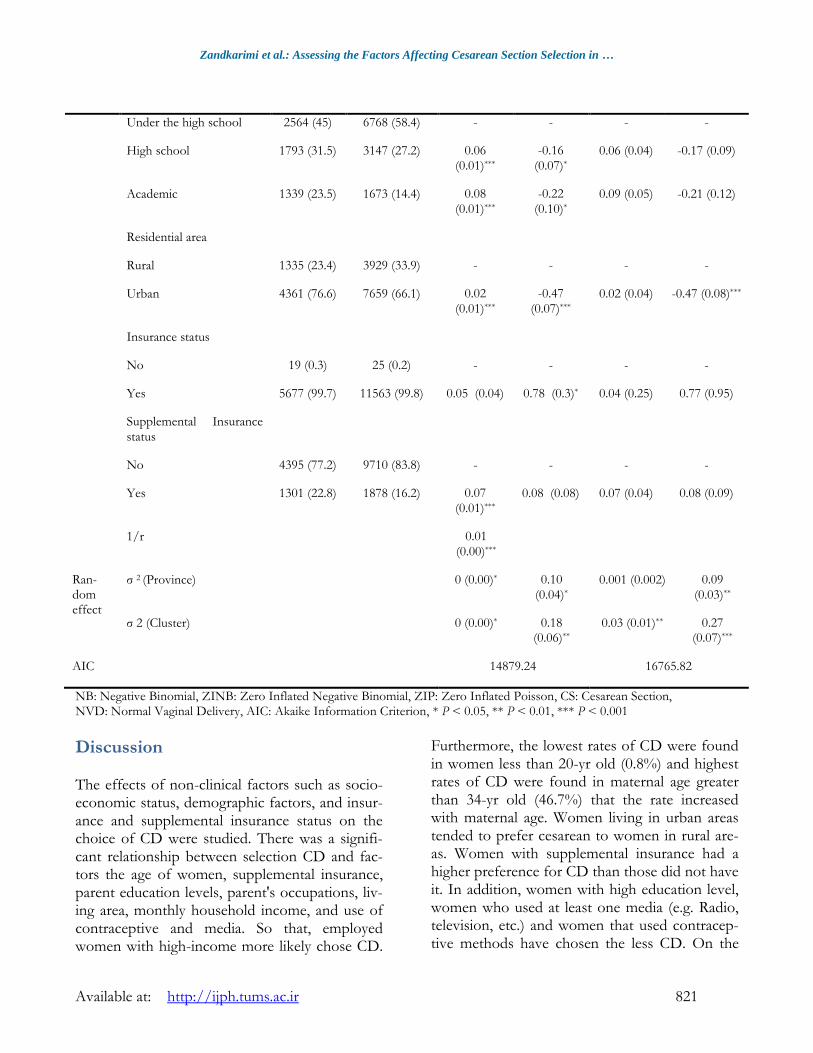
AIC 14879.24 16765.82
NB: Negative Binomial, ZINB: Zero Inflated Negative Binomial, ZIP: Zero Inflated Poisson, CS: Cesarean Section, NVD: Normal Vaginal Delivery, AIC: Akaike Information Criterion, * P < 0.05, ** P < 0.01, *** P < 0.001
Discussion The effects of non-clinical factors such as socio-economic status, demographic factors, and insur-ance and supplemental insurance status on the choice of CD were studied. There was a signifi-cant relationship between selection CD and fac-tors the age of women, supplemental insurance, parent education levels, parent's occupations, liv-ing area, monthly household income, and use of contraceptive and media. So that, employed women with high-income more likely chose CD.
Furthermore, the lowest rates of CD were found in women less than 20-yr old (0.8%) and highest rates of CD were found in maternal age greater than 34-yr old (46.7%) that the rate increased with maternal age. Women living in urban areas tended to prefer cesarean to women in rural are-as. Women with supplemental insurance had a higher preference for CD than those did not have it. In addition, women with high education level, women who used at least one media (e.g. Radio, television, etc.) and women that used contracep-tive methods have chosen the less CD. On the
Iran J Public Health, Vol. 50, No.4, Apr 2021, pp.816-824
822 Available at: http://ijph.tums.ac.ir
other hand, women with employed spouses were more likely to choose CD. These results clearly highlighted the importance of demographic and socioeconomic factors in choosing the type of delivery (Table 2). Some of our findings were consistent with previ-ous studies in Iran and other countries. The asso-ciation between socioeconomic level and CD se-lection has been observed by many authors. Stud-ies conducted out by Cai (32) and Lamaz (33) showed that CD was associated with income lev-el. In a study carried out by Elizabeth (4) demon-strated that there was a relationship between so-cioeconomic status and CD. In addition, there was the association between CD and woman job (9). There was a relationship between social class and CD (7). Our study showed that husband ed-ucation level presented an associated with choos-ing a cesarean. The prevalence rate of the CD had associated with the father's education level (34). Women resident in urban areas was more likely to choose a CD. There was a relationship between living region and CD selection so that, women resident in the urban areas more likely selected CD (35). Our study shows that older women were more likely to choose a CD. There was a relationship between age at least 35 yr and the choice of CD so that women with of at least 35 yr chosen CD (36). In addition, Ecker (37) demonstrated that the rate of CD increased with advanced age and older women were more likely to have the CD. Women over 34 yr old had more request CD than women from 25 to 34 yr of age (reference group) (38). A number of fac-tors affecting the increase in request for delivery by CD in this group of women, including at risk of this group of women for delivery in a natural way (39), physiological factors include the re-duced uterine function and pelvic compliance among older women (40). Our study showed that supplemental insurance has a significant effect on the increase in the rate of CD selection. There was a strong association between CD and insur-ance status, so that Medicaid recipients' women or self-paying had the lowest rates of CD and women with privately insured had the highest rate (41). Perhaps the reason for the requested
increase for CD among this group of women is due to the insurance mistake policies. Some studies do not confirm our results, for ex-ample, Alimohammadian et al. (42) showed that with the increasing education level, more women prefer CD, but, in this study, women with higher education had a less CD.
Conclusion Our findings highlighted the importance of sup-plemental insurance and socioeconomic status in choosing a CD by women. Therefore, in some cases, the high cost of this type of delivery does not affect the choice decrease of it. Decision makers should adopt a strategy to reduce unnec-essary CD. Of course, it should be noted that CD should be used in situations where woman and infant's life is at risk.
Ethical considerations Ethical issues (Including plagiarism, informed consent, misconduct, data fabrication and/or fal-sification, double publication and/or submission, redundancy, etc.) have been completely observed by the authors.
Acknowledgements This study has been adapted from a Ph.D. thesis at Hamadan University of Medical Sciences. The study was funded by Vice-chancellor for Re-search and Technology, Hamadan University of Medical Sciences (No. 970204575).
Conflict of interest The authors declare that there is no conflict of interest.
References
1. Ye J, Zhang J, Mikolajczyk R, Torloni M, et al (2016). Association between rates of caesarean section and maternal and neonatal
Zandkarimi et al.: Assessing the Factors Affecting Cesarean Section Selection in …
Available at: http://ijph.tums.ac.ir 823
mortality in the 21st century: a worldwide
population‐based ecological study with longitudinal data. BJOG, 123(5): 745-53.
2. Lumbiganon P, Laopaiboon M, Gülmezoglu AM , et al (2010). Method of delivery and pregnancy outcomes in Asia: the WHO global survey on maternal and perinatal health 2007-08. Lancet, 375(9713): 490-9.
3. Villar J, Valladares E, Wojdyla D, et al (2006). Caesarean delivery rates and pregnancy outcomes: the 2005 WHO global survey on maternal and perinatal health in Latin America. Lancet, 367(9525): 1819-29.
4. Laws PJ, Sullivan DE, Grayson N (2004). Australia's mothers and babies 2007: AIHW National Perinatal Statistics Unit Sydney, NSW, Australia.
5. Tranquilli AL, Giannubilo SR (2004). Cesarean delivery on maternal request in Italy. Int J Gynaecol Obstet, 84(2): 169-70.
6. Gibbons L, Belizán JM, Lauer JA, et al (2010). The global numbers and costs of additionally needed and unnecessary caesarean sections performed per year: overuse as a barrier to universal coverage. Bull World Health Organ, 30:1-31.
7. Rafati F, Rafati S, Madani A, et al (2014). Related factors to choose cesarean section among Jiroft pregnant women. Journal of Prrventive Medicine 1(1): 23-30.
8. Amu O, Rajendran S, Bolaji II (1998). Maternal choice alone should not determine method of delivery. BMJ, 463-465.
9. Alimohamadian M, Shariat M, Mahmoudi M, Ramazanzadeh F (2003). The influence of maternal request on the elective cesarean section rate in maternity hospitals in Tehran, Iran. Payesh, 2(2): 137-142.
10. Ecker JL (2004). Once a pregnancy, always a cesarean? Rationale and feasibility of a randomized controlled trial. Am J Obstet Gynecol, 190(2):314-8.
11. Mylonas I, Friese K (2015). Indications for and risks of elective cesarean section. Dtsch Arztebl Int, 112(29-30):489-495.
12. Villar J, Carroli G, Zavaleta N, et al (2007). Maternal and neonatal individual risks and benefits associated with caesarean delivery: multicentre prospective study. BMJ, 335(7628):1025.
13. Al‐Kadri H, Sabr Y, Al‐Saif S, et al (2003). Failed individual and sequential instrumental vaginal delivery: contributing risk factors and maternal–neonatal complications. Acta Obstet Gynecol Scand, 82(7):642-8.
14. Khooshideh M, Mirzarahimi T (2017). The Comparison of Maternal and Neonatal Out-comes of Normal Vaginal Delivery versus Unplanned Cesarean Section Delivery. J Ar-dabil Univ Med Sci,17(1): 122-132.
15. Bodner K, Wierrani F, Grünbrger W, Bodner-Adler B (2011). Influence of the mode of delivery on maternal and neonatal outcomes: a comparison between elective cesarean section and planned vaginal delivery in a low-risk obstetric population. Arch Gynecol Obstet, 283(6): 1193-8.
16. O’Neill SM, Kearney PM, Kenny LC, et al (2013). Caesarean delivery and subsequent pregnancy interval: a systematic review and meta-analysis. BMC Pregnancy Childbirth, 13: 165.
17. Declercq E, Barger M, Cabral HJ, et al (2007). Maternal outcomes associated with planned primary cesarean births compared with planned vaginal births. Obstet Gynecol, 109(3): 669-77.
18. Smith GC, Pell JP, Bobbie R (2003). Caesarean section and risk of unexplained stillbirth in subsequent pregnancy. Lancet, 362(9398): 1779-84.
19. Lydon-Rochelle M, Holt VL, Easterling TR, Martin DP (2001). First-birth cesarean and placental abruption or previa at second birth(1). Obstet Gynecol, 97: 765-9.
20. Azami-Aghdash S, Ghojazadeh M, Dehdilani N, Mohammadi M (2014). Prevalence and causes of cesarean section in Iran: systematic review and meta-analysis. Iran J Public Health, 43(5) :545-555.
21. Pang SM, Leung DT, Leung T, et al (2007). Determinants of preference for elective caesarean section in Hong Kong Chinese pregnant women. Hong Kong Med J, 13(2): 100-5.
22. Fenwick J, Staff L, Gamble J, et al (2010). Why do women request caesarean section in a normal, healthy first pregnancy? Midwifery, 26(4): 394-400.
23. Fuglenes D, Aas E, Botten G, Øian P, Kristiansen IS (2011). Why do some pregnant
Iran J Public Health, Vol. 50, No.4, Apr 2021, pp.816-824
824 Available at: http://ijph.tums.ac.ir
women prefer cesarean? The influence of parity, delivery experiences, and fear. Am J Obstet Gynecol, 205(1):45.e1-9.
24. Schneider F, Winn H (2000). Cesarean section and vaginal birth after cesarean section. In: Clinical maternal. New York, Parthenon Press, 15-18.
25. Ronsmans C, Holtz S, Stanton C (2006). Socioeconomic differentials in caesarean rates in developing countries: a retrospective analysis. Lancet, 368(9546): 1516-23.
26. Mi J, Liu F (2014). Rate of caesarean section is alarming in China. Lancet, 383(9927): 1463-1464.
27. Hsu K-H, Liao P-J, Hwang C-J (2008). Factors affecting Taiwanese women's choice of cesarean section. Soc Sci Med, 66(1): 201-9.
28. Leone T, Padmadas SS, Matthews Z (2008). Community factors affecting rising caesarean section rates in developing countries: an analysis of six countries. Soc Sci Med, 67(8): 1236-46.
29. Steele F, Diamond I, Wang D (1996). The determinants of the duration of contraceptive use in China: A multilevel multinomial discrete-hazards mdeling approach. Demography, 33(1): 12-23.
30. Moghimbeigi A (2011). A score test for extra zeros in negative binomial mixed models. Journal of Statistical Computation and Simulation, 81(5): 635-44.
31. Moghimbeigi A, Eshraghian MR, Mohammad K, McArdle B (2009). A score test for zero-inflation in multilevel count data. Computation-al Statistics & Data Analysis, 53(4): 1239-1248.
32. Cai W-W, Marks JS, Chen C, et al (1998). Increased cesarean section rates and emerging patterns of health insurance in Shanghai, China. Am J Public Health, 88(5): 777-80.
33. Lamaz B (1998). Socioeconomic status and women's Experiences with Childbirth preparation. J Gend Cult Health, 160-7.
34. Veghari G, Rahamti R, Ebadpour M, et al (2016). Cesarean section and some socio-demographics related factors in the north of Iran: an epidemiologic study. Int J Adv Biotechnol Res, 7:229-34.
35. Rahman MM, Haider MR, Moinuddin M, et al (2018). Determinants of caesarean section in Bangladesh: Cross-sectional analysis of Bangladesh Demographic and Health Survey 2014 Data. PloS One, 13(9):e0202879.
36. Heffner LJ, Elkin E, Fretts RC (2003). Impact of labor induction, gestational age, and maternal age on cesarean delivery rates. Obstet Gynecol,102(2): 287-93.
37. Ecker JL, Chen KT, Cohen AP, et al (2001). Increased risk of cesarean delivery with advancing maternal age: indications and associated factors in nulliparous women. Am J Obstet Gynecol, 185(4): 883-7.
38. Lin H-C, Xirasagar S (2005). Maternal age and the likelihood of a maternal request for cesarean delivery: a 5-year population-based study. Am J Obstet Gynecol, 192(3): 848-55.
39. Martel M, Wacholder S, Lippman A, et al (1987). Maternal age and primary cesarean section rates: a multivariate analysis. Am J Obstet Gynecol, 156(2): 305-8.
40. Rosenthal AN, Paterson-Brown S (1999). Is There an Incremental Rise in the Risk of Obstetric Intervention With Increasing Maternal Age? BJOG: An International Journal of Obstetrics & Gynaecology, 105(10): 1064-1069.
41. Huesch MD (2011). Association between type of health insurance and elective cesarean deliveries: New Jersey, 2004–2007. Am J Public Health, 101(11):e1-7.
42. Alimohammadian M, Shariat M, Mahmoodi M, Ramezanzadeh F (2007). Choice of delivery in Tehran and some related factors. Journal of Family and Reproductive Health. 1(2): 79-84.