Assessing the Costs and Benefits of Brokers in the Mutual...
36
Assessing the Costs and Benefits of Brokers in the Mutual Fund Industry * by Daniel Bergstresser 1 , John Chalmers 2 , and Peter Tufano 3 Draft: September 26, 2007 Copyright ©2007 Daniel Bergstresser, John Chalmers and Peter Tufano * We have received very valuable guidance and comments from Sean Collins, Henrik Cronqvist, Ro Gutierrez, Charles Hadlock, Sarah Holden, Chris James, Woodrow Johnson, Wayne Mikkelson, Avi Nachmany, Kasturi Rangan, Brian Reid, Jon Reuter, Nancy Rose, seminar participants at the University of Arizona, Arizona State University, UC Berkeley, University of Cologne, Michigan State, Stanford, the University of Oregon / Journal of Financial Economics Conference on Delegated Portfolio Management, the ICI Academic/Practitioner Conference, the 2006 American Finance Association Meetings, and from staff members of the Investment Company Institute and National Quality Review, along with representatives of various fund companies. We thank Financial Research Corporation, Morningstar, and Strategic Insight for sharing data with us. The comments in this paper do not reflect the views of any of these organizations. We thank the Harvard Business School Division of Research, MIT and the University of Oregon for providing funding for this project. Prior versions of this paper were entitled “The Benefits of Brokers: A Preliminary Analysis of the Mutual Fund Industry.” Changes in the results in this 2007 version of the paper primarily reflect the extension of the data set from 2002 to 2004. 1 Corresponding author. Harvard Business School, Boston, MA, 02163, phone: 617-495-6169, fax: 617-495-6198, email: [email protected] . 2 Charles H. Lundquist College of Business, University of Oregon, OR, 97403, phone: 541-346-3337, email: [email protected] . 3 Harvard Business School, Boston, MA 02163, phone: 617-495-6855, fax: 617-495-6198, email: [email protected] .
Transcript of Assessing the Costs and Benefits of Brokers in the Mutual...

Assessing the Costs and Benefits of Brokers in the Mutual Fund Industry*
by
Daniel Bergstresser1, John Chalmers2, and Peter Tufano3 Draft: September 26, 2007 Copyright ©2007 Daniel Bergstresser, John Chalmers and Peter Tufano
* We have received very valuable guidance and comments from Sean Collins, Henrik Cronqvist, Ro Gutierrez, Charles Hadlock, Sarah Holden, Chris James, Woodrow Johnson, Wayne Mikkelson, Avi Nachmany, Kasturi Rangan, Brian Reid, Jon Reuter, Nancy Rose, seminar participants at the University of Arizona, Arizona State University, UC Berkeley, University of Cologne, Michigan State, Stanford, the University of Oregon / Journal of Financial Economics Conference on Delegated Portfolio Management, the ICI Academic/Practitioner Conference, the 2006 American Finance Association Meetings, and from staff members of the Investment Company Institute and National Quality Review, along with representatives of various fund companies. We thank Financial Research Corporation, Morningstar, and Strategic Insight for sharing data with us. The comments in this paper do not reflect the views of any of these organizations. We thank the Harvard Business School Division of Research, MIT and the University of Oregon for providing funding for this project. Prior versions of this paper were entitled “The Benefits of Brokers: A Preliminary Analysis of the Mutual Fund Industry.” Changes in the results in this 2007 version of the paper primarily reflect the extension of the data set from 2002 to 2004. 1 Corresponding author. Harvard Business School, Boston, MA, 02163, phone: 617-495-6169, fax: 617-495-6198, email: [email protected]. 2 Charles H. Lundquist College of Business, University of Oregon, OR, 97403, phone: 541-346-3337, email: [email protected]. 3 Harvard Business School, Boston, MA 02163, phone: 617-495-6855, fax: 617-495-6198, email: [email protected].

1
Assessing the Costs and Benefits of Brokers in the Mutual Fund Industry
Abstract
Many investors purchase mutual funds through intermediated channels, paying brokers or financial advisors for fund selection and advice. This paper attempts to quantify the benefits that investors enjoy in exchange for the costs of these services. We study broker-sold and direct-sold funds from 1996 to 2004, and fail to find that brokers deliver substantial tangible benefits. Relative to direct-sold funds, broker-sold funds deliver lower risk-adjusted returns, even before subtracting distribution costs. These results hold across fund objectives, with the exception of foreign equity funds. Further, broker-sold funds exhibit no more skill at aggregate-level asset allocation than do funds sold through the direct channel. Our results are consistent either with substantial non-tangible benefits delivered by the broker-distributed sector or with conflicts of interest between brokers and their clients.

2
1. Introduction
All mutual fund investors hire professional investment managers to select securities. Many of these
fund investors also hire brokers or advisors to help them select funds. Fund distribution is a big business.
For example, in 2002, we estimate that mutual fund investors paid as much as $15.2 billion in distribution
channel fees: $3.6 billion in front-end loads, $2.8 billion in back-end loads, and annual distribution fees,
referred to as 12b-1 fees, amounting to $8.8 billion. Relative to the $23.8 billion spent on investment
management fees and all other operational expenses, these distribution fees are large.1 For example, the
annual expenditures on 12b-1 fees from 1996 through 2004 are depicted in Figure 1, which shows that
these charges range between $5 and $10 billion per year among funds sold through the broker channel.
We pose a simple question in this paper: What benefits do broker-channel mutual fund consumers enjoy
in exchange for these substantial distribution channel fees?
While research has sought to measure the net benefits of professional investment management, there
is limited evidence on the net benefits of professional brokerage services provided to fund investors. We
attempt to identify these benefits, but find few measurable advantages. On a risk-adjusted basis, funds
sold by brokers underperform funds sold through direct channel—even before subtracting any distribution
charges. This result is not driven by the mix of active and passive index funds, and is robust to the
expansion of our sample period to include data for 2003 and 2004. Furthermore, the aggregate pattern of
investment in broker-sold funds does not demonstrate superior market timing advice by brokers. In
addition, fund flows in the broker sold segment do not show any less return chasing than those in the
direct-sold segment. Finally, broker-sold funds do not demonstrate substantially lower non-distribution
expenses to offset their higher distribution costs.
The extra distribution fees and the drag of inferior performance, even prior to imposition of those
fees, are clear costs borne by investors in broker-sold funds. This leads us to conclude that any
incremental benefits brokers provide must fall along dimensions that are less tangible. While our data
cannot address these unobserved benefits, we acknowledge several potential benefits. Brokers may help

3
their clients save more than they would otherwise save, they may help clients more efficiently use their
scarce time, they may help customize portfolios to investors’ risk tolerances, and they may increase
overall investor comfort with their investment decisions. Future research using individual account-level
data, field experiments, or intensive survey work may have more success identifying these less easily
measured benefits of brokers.
An alternative hypothesis for our results may reflect brokers acting out of self interest, rather than on
behalf of their customers. Brokers and financial advisors have specific responsibilities to their clients.
At a minimum, brokers are subject to NASD rules, which require that brokers recommend suitable
investments for their clients. Financial advisors and mutual funds’ investment managers, as fiduciaries,
owe an even higher standard of care, and must put their clients’ interest ahead of their own. The extent to
which investment professionals can be held to these higher fiduciary standards presents complex legal
issues.2 Recent scandals in the fund industry have focused on distribution practices alleged to harm
consumers. Our evidence that flows are sensitive to the size of distribution charges in the broker sector
is consistent with a less benign interpretation of our failure to measure tangible benefits in the broker
channel.
Our paper is part of a small literature on the role of distribution channels and marketing in the
investment management industry. Christoffersen, Evans and Musto (2005) explore differences among
funds sold by captive and non-captive brokers. Nanda, Wang and Zheng (2004) explore the relationship
between fund load structures and the flow performance relation.3 Chen, Yao and Yu (2007) study mutual
funds that are offered by insurance companies. Our research also complements recent analyses of the
relationship between mutual fund advertising and investor behavior.4
The remainder of the paper is organized as follows. Section 2 describes fund distribution channels.
Section 3 describes our data sources and provides summary statistics. Section 4 analyzes the risk-
adjusted pre-distribution fee returns of broker-sold and direct-sold funds. Section 5 examines aggregate
asset allocation decisions in the broker and direct channels for evidence of market timing ability. Section
6 provides evidence on other potential tangible benefits of the broker channel. Section 7 concludes the

4
paper, explores the alternative hypothesis that brokers disproportionately sell funds that fund companies
reward them most for selling, and suggests directions for future research.
2. Mutual Fund Distribution Channels
This section describes the mutual fund business and mutual fund distribution channels. Marketing
analysis often includes a “channel map” which, applied to the mutual fund industry, traces out the various
sales channels that bring mutual funds and consumers together. In mapping out fund distribution
channels, we draw liberally from our discussions with mutual fund practitioners, as well as from
Gremillion (2001), Pozen (2000) and Reid and Rea (2003).
One of a fund’s key business decisions is how it will be distributed or sold to consumers.
Distribution strategies directly and indirectly affect the investment manager’s revenues, costs and returns.
Because U.S. investment management contracts typically pay managers fees proportional to assets under
management, distribution strategies that increase investor inflows and retain existing assets produce
higher revenues for fund sponsors. Because many costs of investment management are virtually fixed,
sponsors may enjoy increasing profitability as assets grow. Some distribution fee structures, such as 12b-
1 fees5, directly affect reported returns as normally calculated, while other fees, such as loads, are not
reflected in reported returns. In addition, distribution strategies that provide stable investor bases lead to
less frequent investor transactions, leading to lower trading or transfer agency costs, thus boosting returns.
Fund distribution strategies vary significantly, and categorizing fund distribution channels is
complicated. Figure 2 shows the distribution categories used by three fund industry consultants (Lipper,
Financial Research Corporation, Strategic Insight) and the industry trade association, the Investment
Company Institute. For this paper, we employ a high-level categorization of distribution methods, based
on the FRC and Lipper definitions. In our taxonomy, funds are broker-sold or direct-sold. In the
simplest form, direct-sold funds are marketed by the fund directly to the consumer, while broker-sold
funds are sold by an intermediary. Within this broker channel, a fund may be sold by a bank, sold
5
through a captive channel (such as a wirehouse or brokerage firm that sells its own funds) or sold through
a non-captive third-party broker.
Funds sold through the direct channel have relatively straightforward financial arrangements with
their investors. Direct-channel investors generally do not pay front-end loads or back-end loads.
However, direct-sold funds may levy 12b-1 fees to pay for marketing and distribution; funds with 12b-1
fees under 25 bp may market themselves as “no-load” funds.6 Traditionally, Vanguard, which obtains
new customers through advertising and word of mouth, was a well-known example of a fund sold through
the direct channel. However, the direct channel is an increasingly complex system. Funds that are
directly distributed are sometimes used by fee-based financial advisors who assist clients. These funds
are also often made available through fund supermarkets like Schwab OneSource, or available for
purchase as part of defined contribution retirement plans.7 This service is typically paid for with an
advisory fee that is outside of the fund expenses or distribution costs. As a practical matter, the “direct”
channel may not be as direct as one might imagine. To the extent that we misclassify some brokered
funds as “direct” we will underestimate differences between channels.
The broker channel involves more complex financial arrangements with both the mutual fund
investor and the mutual fund’s management company. The broker provides financial advisory services
and can be paid in a number of ways. Explicit distribution fees include front-end loads, back-end loads,
and annual 12b-1fees collected directly from the investor’s mutual fund investments. Brokers may also
be compensated with indirect distribution fees. For instance, arrangements where management
companies pay part of their management fee to brokers in the form of revenue sharing agreements
received public attention in 2004,8 and since, these arrangements are much more likely to be disclosed.
These issues illustrate the complex and sometimes poorly disclosed payments and incentives in mutual
fund distribution.
In this paper, we distinguish between distribution and non-distribution expenses. We construct non-
distribution expenses by subtracting from funds’ annual expenses their reported 12b-1 fees. Any
undisclosed revenue sharing may cause us to understate actual distribution charges.
6
Our unit of observation is the fund-class. Funds are often offered in different classes which vary by
distribution fee structure. The same fund might be offered to direct investors with one distribution fee
structure, to brokerage clients with a different distribution fee structure, and to institutional clients with
yet another distribution fee structure. We exclude from our analysis funds sold through the institutional
channels, sales of which may be driven by a set of dynamics different from the retail fund market. These
institutional funds account for about one-third of fund assets. We also exclude closed-end funds and
exchange-traded funds.
3. Data Sources and Descriptive Statistics
Our distribution channel indicator comes from Financial Research Corporation (FRC) which
specializes in providing mutual fund distribution data. FRC provided us with industry snapshots from
1998, 2000, 2002, and 2004.9 Each snapshot includes historical data, so we can analyze data from 1996
through 2004. FRC reports a distribution code for each fund share class, characterizing the primary
distribution channel in which the share class is sold. FRC also reports the distribution code assigned by
Lipper, another major fund data provider. We compare the FRC codes to Lipper distribution channel
codes, and we exclude from our analysis fund share classes where the two sources differ. This occurs for
5.9% of the fund classes representing 3.2% of the assets in our sample. For individual fund share classes,
these codes rarely change over our sample period.
Table 1 reports the top 25 largest fund share classes for the direct and broker channels at the end of
the year in 2004. While most mutual fund research focuses primarily on equity funds, money market
funds account for five of the top 25 in the brokered channel versus four in the direct channel, while bond
funds account for one of the top 25 among each channel.
We use data from CRSP to measure monthly mutual fund returns and to corroborate fund descriptive
information from FRC. In some tests, we use factor loadings from the CRSP database, which require a 3-
year fund return history.10 This may induce some survivorship biases in our sample. We also collected
additional fund data from Morningstar, including Morningstar ratings and manager tenure.

7
Table 2 reports the aggregate size of our sample of direct and broker sold fund share classes, as well
as the average size of the funds in the sample and the share of funds that are small, which we define as
having assets under management of less than $100 million. In each panel, we report the total in our
sample, the division by broker and direct distribution, and the division by broker and direct after
removing all index funds from the sample for 1996, 1998, 2000, 2002, and 2004.
From table 2, in 2004 our sample covers 9,197 share classes in 4,253 funds representing assets of
$5.1 trillion.11 In the time period we study, brokered distribution is an important form of distribution,
representing 79% (7273/9197) of all share classes, 64% (2712/4253) of all funds and 51% 2.57/5.08) of
all assets in 2004. Direct distribution accounts for the remainder of the funds in our sample. Funds sold
through the broker channel account for a larger fraction of share classes than direct funds because
brokered funds are more likely to have multiple share classes, differing in the structure of their fees.12
The brokered channel has been losing share overall to the direct channel in assets, with its assets under
management dropping from 59% in 1996 to 51% in 2004. Panel C allows us to compare the total assets
with and without index funds. In 2002, index funds account for approximately $185 B (~10%) of assets
in the direct channel and $13B (<1%) in the broker channel, while in 2004 the corresponding totals are
$331 B (~13%) in the direct channel and $17 B(<1%) in the broker channel.
4. Do Brokers Offer and Sell Higher Performing Funds?
A 2004 ICI survey of investors found that investors in broker and direct channels focus on
performance. In particular, 88% of broker channel customers and 82% of the direct channel clients
identify “professional money management” as a “very or somewhat important reason for owning mutual
funds.” We can surmise from this survey evidence that investors in the broker channel are at least as
concerned about fund performance as are direct channel investors. In this section we analyze the
performance of broker-sold and direct-sold funds.
Table 3 presents annual fund performance data by distribution channel for equity funds in panel A,
foreign equity funds in panel B, bond funds in panel C, and money market funds in panel D. In each

8
panel, asset-weighted and equal-weighted results are presented; with and without index funds included in
the sample. For all panels the unit of observation is the fund share class.13 Data providers report mutual
fund returns net of the expenses charged by the fund, but before the deduction of front-end or back-end
loads. As a starting point, we measure returns before the deduction of these distribution charges by
adding-back 12b-1 fees to the return measures we analyze. We refer to the sum of returns plus 12b-1 fees
as “pre-distribution-fee” returns. We report pre-distribution-fee returns by channel, first on an unadjusted
basis, then on a benchmark-adjusted basis, and also using several standard risk-adjusted measures of
alpha. In order to estimate our alpha measures, we require the CRSP factor loading data to estimate
betas over the prior three years. As a result, we impose a survival requirement on the data in using
the alphas. For this reason, we report the raw and adjusted returns for all funds with available return data.
The result is that our alpha measures cover a slightly different sample of funds than the non-alpha return
measures.14 Cross-sectional average return measures are calculated on equal-weighted and value-weighted
bases using asset values as of the beginning of the return period for the value-weighted measure.
For the broad sample of domestic equity funds in Table 3 panel A, the performance results are quite
striking. Funds sold by brokers underperform those sold through the direct channel, even though
calculated on a pre-distribution-fee basis. This is true for all equal-weighted portfolios, regardless of
whether we look at raw returns, benchmark adjusted returns, or any of the various measures of risk-
adjusted returns. Turning to asset-weighted returns, this result holds in all specifications except for raw
returns.15 The result is not due to the inclusion of index funds; indeed when removing all index funds
from the two channels, the brokered channel reports inferior pre-distribution-fee performance compared
to the direct channel in all specifications.
The magnitude of this underperformance varies depending on the method used to risk adjust the
returns and depending on whether returns are calculated on an equal or asset-weighted basis. Across
these different specifications, underperformance varies from 23 bp to 255 bp. We think of equally-
weighted analysis as reflecting the menu of products offered; asset-weighted results highlight the products

9
that investors actually hold. The higher performance of the direct-sold funds, relative to the broker-sold
funds, is generally more pronounced when analyzing equally-weighted returns than when analyzing asset-
weighted returns.
Panel B reports the results for foreign equity funds. The results in this sample of funds differ from
the results from the sample of domestic equity funds. On a pre-distribution-fee, asset-weighted basis,
funds sold by the broker channel outperform those in the direct channel by between 135 and 341 basis
points. In a potentially puzzling contrast, the equally-weighted results show that the direct-sold funds
outperform the broker-sold funds. This outperformance is largely attributable to a small number of very
large international funds sold through one broker-channel fund family.
Panel C presents performance results for bond fund share classes. There is no evidence to suggest
that broker-sold funds outperform direct-sold funds in this asset class. In equal-weighted data, the pre-
distribution-fee results are either indistinguishable between the two sectors, or in some specifications the
direct channel delivers higher returns. In asset-weighted specifications, directly placed funds consistently
deliver substantially higher benchmark or risk-adjusted returns, higher by 34 to 90 basis points. As with
the equity funds, the exclusion of index funds from the sample of bond funds does not change the asset-
weighted results.
Panel D of Table 3 presents the performance of money market funds. Money market funds also do
not demonstrate a consistent pattern of broker channel underperformance. On a raw return basis, broker
sold funds tend to outperform directly distributed money market funds by 32 to 34 basis points. Once one
does any benchmark or risk adjusting, these results either become statistically insignificant or change sign
and become significant, with direct sold funds providing higher performance.
Collectively the results in Table 3 suggest that domestic equity and bond funds sold by brokers have
delivered inferior performance compared with funds sold in the direct channel. The contrary results in the
foreign equity funds are attributable to one fund complex. Using the estimates from the most complete
factor pricing models and summing up across broad equity, bond, and foreign equity investment
categories leads us to estimate the annual underperformance of the broker-sold funds at $4.6 billion

10
dollars in 2004.16 This underperformance is before the payment of $9.8 billion in 12b-1 fees paid in
200417 and the payment of other distribution fees such as loads.
5. Do Brokers Provide Better Asset Allocation and Timing Abilities?
The previous section provided an analysis of the investment returns within asset classes for broker-
sold versus direct-sold mutual funds. This section turns to an asset allocation analysis, assessing whether
brokers, in aggregate, channel money toward asset classes in a way that reflects an ability to time
movements in broad market performance. While intermediated channels might offer lower performing
portfolio of funds, they might offset this in whole or part by their market-timing recommendations,
shifting between stocks, bonds and cash in advance of market moves. In order to abstract away from fund
picking expertise of brokers, we take the broker channel aggregate asset allocation weights and apply
those weights to index returns. We compare the cumulative value of $1 invested on December 31, 1980
using annually rebalanced asset allocations in the broker and direct channels at the beginning of each
year.
We calculate returns based upon four main asset classes (Domestic Equity, Domestic Bond,
Municipal Bond and Money Market), which account for the bulk of assets in both channels. We rescale
the aggregate portfolio weights under the assumption that these four asset classes represent the entire
investment universe for these funds. We calculate these results using data through 2002 because we are
concerned that later periods have less reliable data on money market funds.
Figure 3 provides graphs of the asset allocations in the two sectors. Bond and money market funds
consistently make up a higher share of assets in broker-sold funds than in direct-sold funds. While some
have suggested that the brokers encourage investors to take more risks than they might otherwise on their
own, this evidence suggests that the broker channel asset allocations tend to be less risk taking than the
direct channel asset allocations. Their tendency to hold more funds in money market and bond funds is
apparently not offset by lower bank holdings.18

11
In Figure 4 we provide the cumulative value of $1 invested using annually rebalanced asset
allocation weights taken from the aggregate mix in both channels. The indexes for the equity, bond, muni
bond, and money market returns are respectively the value-weighted CRSP index returns for the NYSE,
ASE and NASDAQ stocks, the Lehman Aggregate Domestic Bond index, the Lehman Aggregate
Municipal Bond index, and the returns to the 30-day Treasury bill.
Figure 4 suggests that direct channel asset allocations produced more cumulative wealth over this 22
year period of time, but it is important to adjust these figures for risk. The broker channel delivered lower
returns because these investors held lower-risk and lower-return securities. This is consistent with the ICI
(2004) survey results, which found that clients of the broker channel are slightly more risk averse. When
asked what level of risk they were willing to take on with their mutual fund investments, 39% of direct
channel customers (vs. 34% of brokered channels) were willing to take on “substantial” or “above
average” risk for commensurate returns.
To calculate risk-adjusted portfolio returns, we calculate the Sharpe Ratio of the two portfolios, as
reported immediately below.
Including Money Market Assets Broker Channel Direct ChannelMean Excess Return (beyond T-bill) per Month 0.19% 0.25%Standard Deviation of Monthly Excess Returns 1.84% 2.46%Sharpe Ratio 0.1020 0.1021
While the direct channel had higher mean excess returns (relative to the risk free return on Treasury bills),
it had substantially higher standard deviations of returns. The two channels produce virtually identical
Sharpe Ratios, but it is important to remember that this analysis abstracts from fund picking ability by
calculating returns using aggregate portfolio weights from the different channels, but by using identical
index returns for each asset class to calculate the return. When applied to actual channel returns, the
brokered channel would show a distinct disadvantage, since broker-sold funds underperform direct-sold
funds on a pre-distribution-fee basis (and even more so once distribution fees have been subtracted.)
Large cash balances held in broker-channel funds may reflect transactions purposes rather than
active long-term portfolio choice decisions. If so, it may be useful to evaluate the two model investment

12
portfolios excluding the cash component. Reweighting the two portfolios excluding money market assets
(but still applying weights to identical index returns), we find that the Sharpe ratio for the two channels
are nearly identical, if anything with the direct channel producing a marginally higher risk-adjusted
return, as shown here:
Excluding Money Market Assets Broker Channel Direct ChannelMean Excess Return (beyond T-bill) per Month 0.32% 0.39%Standard Deviation of Monthly Excess Returns 2.91% 3.47%Sharpe Ratio 0.1106 0.1120
These analyses of Sharpe ratios provide no evidence that brokers, in aggregate, display superior asset
allocation. We conduct a more formal test using Merton and Hendriksson’s (1981) non-parametric test of
market timing ability. Using the Merton-Hendriksson approach, and examining direct channel and broker
channel changes to bond and equity allocations, we cannot reject the hypothesis that brokers have no
forecasting power, either absolutely or relative to the direct channel. For example, over the period from
1981 to 2002, there are six years in which the broker channel, in aggregate, increased its asset allocation
to bonds (relative to equities). In two of the years, subsequent to the asset allocation change, bonds
outperformed equities. Not surprisingly, the Merton-Hendriksson non-parametric statistic cannot reject
the null that these two correct asset allocation moves happened by chance. Analyzing the broker channel
asset allocation changes relative to direct channel asset allocation changes leads to the same conclusion.
We find no evidence that, in aggregate, brokers provide superior asset allocation advice that helps
their investors time the market. While we can not observe the asset allocation skills of individual brokers
nor the degree to which brokers fashion customized portfolios for their clients, the aggregate asset
allocations show no advantages among the broker-sold funds.
6. What Else Could It Be?
Clients of brokers, on average, purchase worse performing funds (on a pre-distribution-fee basis),
pay substantial distribution charges, and the broker channel seems to enjoy no obvious market timing

13
ability. Yet the broker sector is large and vibrant. What other benefits might brokered clients receive?
This section discusses other possible benefits, before discussing one possible interpretation of our results.
Unique products? Our benchmark and risk-adjusted returns compare funds with comparable
characteristics from the perspective of standard financial economics, which is to say risk exposures and
factor loadings. However, perhaps brokers specialize in unique products, especially ones that individual
investors would have difficulty in evaluating on their own. In Table 4 we report on the characteristics of
equity products sold by the two channels. In brief, we do find some evidence that broker-sold funds may
be harder to find or to analyze by investors, in that broker-sold funds are:
• More likely to be younger than 3 years old (Table 4, panel B)
• Managed by managers with shorter tenures (Table 4, panel C)
• Not covered by Morningstar (Table 4, panel D)
• Smaller funds (Table 2, panel D)
• Actively managed funds (Table 2, panel C)
Some of these characterizations are not robust to asset versus equal-weighted results. However, they
broadly are consistent with two interpretations. Put in the most positive terms, brokers help investors buy
products that would be hard for the investor to find or evaluate without the broker’s help. Put in less
positive terms, brokers recommend products for which a client can less easily compare performance and
evaluate broker quality. Recent theoretical papers by Gabaix and Laibson (2006) and Carlin (2006) show
that confused clients may be profitable ones from the perspective of financial service providers.
Better deals? While distribution fees for brokers are considerably higher than for funds sold in
the direct channel, in theory lower non-distribution charges in the brokered channel could offset the
higher distribution charges. Unfortunately, there is no substantial evidence to this effect. We have
already reported that the returns after non-distribution charges (our “pre-distribution-fee returns”) are
lower in the brokered channel. In Table 5, we more narrowly analyze the level of non-distribution
charges and annual expenses (ignoring loads). Annual non-distribution expenses for broker-sold exceed

14
those of direct sold funds in all categories except foreign equity funds, suggesting that customers of
brokers do not enjoy significantly lower non-distribution fees.19
Different customers? Perhaps customers of brokers are different and have different
needs than do customers of directly sold mutual funds. To explore this hypothesis, we turn to the
ICI survey of mutual fund investors. As reported earlier in the paper, the ICI survey results
suggest broad similarities in the demographic characteristics of broker-channel and direct-
channel mutual fund investors.20 Focusing on demographic characteristics, the customers who
purchase broker-sold funds are slightly less wealthy (with a median income of $93,800 vs.
$101,300), have lower median financial assets ($363,700 vs. $447,900), and are slightly less
well-educated (57% vs. 65% have a four year college degree or more). Clients of brokers might
have slightly different needs or abilities; Campbell (2006) finds that people with lower
education and lower income make what some might judge to be suboptimal financial decisions.
By any standard, however, fund investors in both channels are disproportionately drawn from
upper ranks of national wealth, income, and educational attainment.
With respect to attitudes, investors who purchase funds through brokers appear to be a bit more risk
averse, with only 34% (vs. 39%) reporting that they are willing to take on substantial or above average
risk for commensurate gain. This characteristic may explain some of the differences we observe in this
paper, such as the higher holdings of bonds or cash in the brokered sector.
The investing goals and aspirations of the two groups seem quite similar. Roughly equal fractions of
customers of broker-sold (93%) and direct-sold fund funds (95%) say that the levels of fees and expenses
are very or somewhat important reasons for owning mutual funds. In spite of this, the clients of broker-
sold funds choose to pay considerably more. Ninety-four percent of both clients of sales force and direct
channels note that “the availability of a range of mutual fund choices” is an “important or very important
reason for owning mutual funds.” Both groups profess to have long-term investing horizons.

15
The customers of the two channels may be more dissimilar along important other dimensions,
such as their prior experience or confidence in making investment decisions, the amount of time (or
shadow price of time) they are able to devote to investment decision making, etc. While these differences
in the predisposition to hire help might justify why some investors willingly pay distribution fees for
services, it is more problematic to explain how these traits lead investors to continue to accept poorer pre-
distribution-fee investment performance. Furthermore, the ICI data reveal that consumers often use
multiple distribution channels, making differences even less substantial. It would be interesting to know
if clients of both channels acted differently than clients of one or the other channel.
Putting a brake on behavioral biases? There is a large and growing literature exploring the
impact of behavioral biases on investors’ portfolio behavior.21 In many cases, these behavioral biases are
thought to lead to suboptimal behavior. Accordingly, a broker who is able to attenuate these biases would
provide a valuable service to individual investors. We have already reported that broker sold funds are
more likely to invest in foreign funds, suggesting that the broker channel may somehow combat the well-
known home-bias effect, where investors over-invest in local securities.
Another behavioral bias is the tendency to chase past returns, measured by the flows into and out of
mutual funds as a function of prior fund performance. Differences in performance-flow sensitivity, if
any, cannot easily be attributable to differences in the attitudes of customers of the two channels. The ICI
(2004) survey shows that clients of both channels say they ignore short-run returns: 82% of Broker vs.
83% of Direct customers agreed with the statement: “I am not concerned about short-term fluctuations in
my mutual fund investments.” Similarly, only 4% of Broker customers vs. 5% of Direct customers report
that they consider a time frame of less than one year in considering the investment risks of equity or bond
funds. This similarity in self-perception implies that any differences in sensitivity to performance are not
the result of self-conscious differences in client attitudes, but may reflect advice they receive.
We calculate the performance-sensitivity of investment flows in each channel. In sum, our
investigation reveals modest differences between the two channels in performance sensitivity. Consistent
with earlier research that aggregated direct-sold and broker-sold mutual funds, we find that in each

16
channel inflows appear strongly correlated with lagged performance.22 Table 6 details the results of this
multivariate analysis of the performance flow relationship by channel. Columns (1) and (2) present the
baseline specification (estimated separately for broker-sold and direct-sold funds), with fund share-class-
level inflows regressed on raw performance and other fund characteristics. Columns (3) and (4) use a
measure of returns net of the average returns of funds in the same investment category, with investment
categories calculated very broadly (i.e., domestic equity, foreign equity, and so on). Columns (5) and (6)
use more narrow specifications of investment categories to calculate the category-average returns.
Each specification includes the return measure, and also includes an interaction term between the
return and a dummy equal to one when the return measure exceeds zero. Thus, the linear relationship
between performance and inflows below this kink-point is just the coefficient on returns, while the
relationship between performance and inflows above the kink is the sum of the two coefficients. The
specification includes both contemporaneous returns and returns lagged one period. A general description
of the performance-inflow sensitivities is that flows in both channels are sensitive to past performance
and if anything broker funds are more likely to be sensitive to superior past performance.
The baseline specification with raw returns suggests that a 10 percentage-point increase in
performance among direct-channel funds is associated with a 8.53% (9.63% above the kink-point)
increase in inflows in the current year, and a 6.43% (7.96% above the kink-point) increase in inflows in
the next year. The results in this specification for the broker sample suggest a slightly higher sensitivity
of inflows to performance: 9.42% (10.66% above the kink) in the current year, and 9.07% (16.22% above
the kink) in the next year. This apparent extra sensitivity of inflows to performance in the broker sample,
however, is itself highly sensitive to the treatment of outlier observations of fund performance.
Both channels display return chasing behaviors. While in theory, brokers could reduce the
behavioral bias to chase returns, we find no consistent evidence in practice that return chasing is
substantially weaker among broker-sold funds. Rather, our results are consistent with O’Neal (2004),
who finds that funds that charge loads have incrementally steeper slopes between performance and flows.
O’Neal differentiates between purchases and redemptions, and finds that load fund investors (which

17
roughly correspond to our brokered channel) are more performance-sensitive in redeeming poorly
performing funds, inducing a higher sensitivity of net inflows to performance.23
7. An Alternative Hypothesis: Do Brokers Merely Sell What They Are Paid To Sell?
Relative to the direct channel, brokers’ clients select asset allocations that perform no better, and
invest in funds that perform worse even before any distribution fees are considered. For these non-
benefits, they pay front-end loads that are as much as 417 basis points higher and annual distribution
charges that are up to 40 basis points larger.24 While they pay more—and get lower returns, according to
the ICI surveys, clients of brokers and direct purchasers are similar both in demographics and in attitudes.
How can these facts be reconciled?
An optimistic interpretation would be that brokers are indeed acting in their clients’ interests, but, as
researchers, we have simply not been able to measure the many substantial intangible benefits that
brokered clients receive. With appropriate data, this hypothesis is testable. In particular, psychological
studies of different types of clients may be able to determine their demands for various intangible
services, such as financial advice. Conjoint analyses may determine how investors make tradeoffs
between returns, time spent on investment decision making, and enhanced confidence in decision making.
A less charitable interpretation of our results is that financial intermediaries may not always act in
their clients’ interest, but rather put clients’ interests behind their own interests and the interests of the
fund companies that pay them. Consumers may fail to react, consistent with the evidence that consumers
sometimes make suboptimal decisions, especially about complex financial matters, e.g., see Campbell
(2006). The notion that brokers may not be acting in their clients’ interests, but that clients may fail to
react, is also potentially testable with the right data. Clinical work could analyze changes in clients’
portfolios around exogenous shocks to broker incentives.
We can learn about this latter interpretation by studying the coefficients on the control variables in
Table 6. Across all specifications, the coefficients on both 12b-1 fees and front-end loads are positively
related to subsequent inflows in the broker channel. The more money there is to pay for sales efforts

18
(except deferred loads), the greater the flows to these funds. These results suggest that sales effort,
measured by compensation to brokers through front loads and 12b-1 fees, is positively associated with
reported net inflows at the fund share-class level.25 In contrast, the non-distribution portion of the annual
expense ratios is negatively associated with inflows in both channels, although the results are not
statistically significant among the direct-sold funds. Furthermore, expense ratios have less of a negative
effect on flows for broker-sold funds than direct-sold funds. These results are consistent with the old
notion that funds are sold, not bought—and compensating a sales force with a higher piece-rate scale may
induce additional sales.
Other evidence supports a link between selling effort and distribution fees. Using data from Table 5
we tabulated the ratios of equally weighted to asset-weighted expenses and loads. This ratio represents
the relation between the funds that are offered to those which are actually held by consumers. A ratio of
asset-weighted to equal-weighted fees less than one could reflect economies of scale or consumer
preferences for lower cost funds. In general, these ratios are consistently below one. However, we find a
dramatic exception for front-end loads, where the ratio of asset-weighted to equal-weighted front-end
loads is 1.76 for equities and 1.47 for bond funds. 26 This suggests that brokerage clients buy (or hold)
funds with higher loads, or alternatively, brokers sell clients those products with higher loads, than the
average brokered fund.
In summary, we find a reasonably clear pattern of results. We find that the brokered channel sells
funds with inferior pre-distribution-fee returns. The channel does not show any evidence of superior
aggregate market timing ability, and shows the same return-chasing behavior as observed among direct-
channel funds. Finally, more sales are directed to funds whose distribution fees are richer. This work
leaves us with the puzzle of why investors continue to purchase funds that appear to be no better at
substantially higher costs. The answer could be that we, as researchers, failed to measure important
intangible benefits, or that consumers of brokers fail to consider the costs and benefits of this relationship.

19
References Allen, Franklin, 2001, “Do financial institutions matter?” Journal of Finance, 56, 1165-1175. Barber, Brad M., Terrence Odean and Lu Zheng, 2003, “Out of Sight, Out of Mind: The effects
of Expenses on Mutual Fund Flows”, working paper UC Davis. Barberis, Nicholas and Richard Thaler, 2003, “A survey of behavioral finance”, in Handbook of
Economics of Finance, ed. G. Constantinides, M. Harris and R. Stulz. Elsevier Science. 1052-1121.
Berger, Allen N, J. David Cummins, and Mary A Weiss, 1997, “The coexistence of multiple
distribution systems for financial services: The case of property-liability insurance”, Journal of Business, 70, 515-546.
Berk, Jonathan and Richard Green, 2004, “Mutual fund flows and performance in rational
markets”, Journal of Political Economy, 112, 1269-1295. Brown, Keith C., W.V. Harlow, and Laura T. Starks, 1996, “Of tournaments and temptations: An
analysis of managerial incentives in the mutual fund industry”, Journal of Finance, 51, 85-110.
Campbell, John, 2006, “Household finance,” Journal of Finance, 61, 1553-1604. Carhart, Mark, 1997, “On persistence in mutual fund performance,” Journal of Finance, 52, 57-
82. Carlin, Bruce, 2006, “Strategic price complexity in retail financial markets,” working paper,
Duke University. Chalmers, John MR, Roger Edelen, Gregory Kadlec, 2001, “Fund returns and trading expenses:
Evidence on the value of active fund management”, working paper. Chen, Xuanjuan, Tong Yao, and Tong Yu, 2007. Prudent man or agency problem? On the
performance of insurance mutual funds. Journal of Financial Intermediation, 16, 175-203. Chevalier, Judith and Glenn Ellison, 1997, “Risk taking by mutual funds as a response to
incentives”, Journal of Political Economy, 105, 1167-1200 Christoffersen, Susan, Richard Evans, and David Musto, 2005. “The economics of mutual-fund
brokerage: Evidence from the cross section of investment channels”, working paper. Cleveland, W.S. 1979. "Robust locally weighted regression and smoothing scatterplots," Journal
of the American Statistical Association, 74, 829-836
20
Cronqvist, Henrik, 2005, “Advertising and portfolio choice”, working paper, Ohio State University.
Elton, Edwin J., Martin J. Gruber, Christopher Blake, 1996, “Survivorship bias and mutual fund
performance”, Review of Financial Studies, 9, 1097-1120. Elton, Edwin J., Martin J. Gruber and Jeffrey Busse, 2004, “Are investors rational? Choices
among index funds", Journal of Finance, 59, 261-288, 2004. French, Kenneth, data http://mba.tuck.dartmouth.edu/pages/faculty/ken.french/data_library.html Gabaix, Xavier and David Laibson, 2006, “Shrouded attributes, consumer myopia, and
information suppression in competitive markets” Quarterly Journal of Economics, 121, 505-540.
Gallaher, Steven, Ron Kaniel, and Laura Starks, 2004, “Madison avenue meets wall street:
Mutual fund families, competition, and advertising,” working paper, University of Texas. Garcia, Diego, and Joel M. Vanden, 2003, “Information acquisition and mutual funds”, working
paper, Tuck School of Business. Gil-Bazo, Javier and Pablo Verdu, 2004, “When cheaper is better: Fee determination in the
market for equity mutual funds,” Journal of Economic Behavior and Organization, forthcoming.
Gremillion, Lee, 2001, A Purely American Invention, The U.S. Open-End Mutual Fund Industry,
The National Investment Company Service Association. Gruber, Martin J., 1996, “Another puzzle: The growth in actively managed mutual funds”,
Journal of Finance, 51, 783-810. Hortacsu, Ali and Chad Syverson, 2004, “Product differentiation, search costs, and competition
in the mutual fund industry: a case study of the S&P 500 Index Funds,” Quarterly Journal of Economics, 119, 403-456.
Investment Company Institute, 2004, Profile of Mutual Fund Shareholders, Investment Company
Institute Research Series, Fall 2004. Jain, Prem and Joanna Shuang Wu, 2000, “Truth in mutual fund advertising: Evidence on future
performance and fund flows,” Journal of Finance, 55, 937-958. Jensen, Michael C., 1968, “The performance of mutual funds in the period 1945-1964,” Journal
of Finance, 23, 389-416. Kim, Won-Joong, David Meyers, and Clifford W. Smith, Jr. 1996, “On the choice of insurance
distribution systems,” Journal of Risk and Insurance, 63, 207-227.
21
Malkiel, Burton G., 1995, “Returns from investing in equity mutual funds 1971 to 1991,”
Journal of Finance, 50, 549-572. Merton, Robert C., and R. D. Henriksson, “On market timing and investment performance part
II: Statistical procedures for evaluating forecasting skills,” Journal of Business, 54, 513-533.
Moulton, Brent R., 1990. “An illustration of a pitfall in estimating the effects of aggregate
variables in micro units,” Review of Economics and Statistics, 72, 334-338. Nanda, Vikram, Z. Jay Wang and Lu Zheng, 2003, “The ABCs of mutual funds: A natural
experiment on fund flows and performance,” working paper, University of Michigan. O’Neal, Edward S., 1999, “Mutual fund share classes and broker incentives,” Financial Analysts
Journal, Sep-Oct. O’Neal, Edward, 2004, “Purchase and redemption patterns of US Equity mutual funds”,
Financial Management, Spring 2004, 63-90. Pozen, Robert C., 2000, The Mutual Fund Business, Cambridge: MIT Press. Reid, Brian K. and John D. Rea, 2003, “Mutual fund distribution channels and distribution costs,
Investment Company Institute Perspective”, 9, 3. Reuter, Jonathan and Eric Zitzewitz, 2006, “Do ads influence editors? Advertising and bias in
the financial media,” Quarterly Journal of Economics, 121, 197-227. Shleifer, Andrei and Sendhil Mullainathan, 2005, “Persuasion in finance,” working paper,
Harvard University. Sirri, Erik and Peter Tufano, 1998, “Costly search and mutual fund flows”, Journal of Finance,
53, 1589-1622. Wermers, Russ, 2000, "Mutual fund performance: An empirical decomposition into stock-
picking talent, style, transaction costs, and expenses," Journal of Finance, 55, 1655-1695. Venti, Steven and David Wise, 2004, “Choice, chance, and wealth dispersion at retirement,” in
Issues in Aging in the United States and Japan, Chicago: University of Chicago Press. Zhao, Xinge, 2003, “The role of brokers and financial advisors behind investments into load
funds”, working paper, College of William and Mary. Zheng, Lu, 1999, “Is money smart? – A study of mutual fund investors’ fund selection ability,”
Journal of Finance, June

22
1 The figures we used to estimate aggregate front-end and back-end loads are based on data from three sources.
Aggregate 2002 sales and redemptions come from April 2003 Investment Company Institute publication, ‘Trends in
mutual fund investing’; average maximum front and back loads for individual fund share classes come from the
FRC database that is the base of the empirical analysis in this paper; and average assessed loads as a share of
maximum come from the February 2004 ICI publication “The cost of buying and owning mutual funds.”
2 The legal distinction between brokers and advisors is important, although there is some evidence that this
distinction is sometimes not understood by individual investors. Registered financial advisors are regulated under
the Investment Advisors Act of 1940, and brokers are regulated under the 1934 Exchange Act. See K. Pender,
“Brokers versus advisors” San Francisco Chronicle, 9/21/2004 for a recent layperson’s discussion of the evolving
issues. http://sfgate.com/cgi-bin/article.cgi?file=/chronicle/archive/2004/09/21/BUGI18S4DJ1.DTL
3 Berger, Cummins and Weiss (1997) and Kim, Mayers and Smith (1996) explore the coexistence of multiple
distribution channels in insurance markets. Because they compare independent insurance agents to insurance agents
that exclusively sell the insurance products of one firm, their work is somewhat closer in spirit to Christoffersen,
Evans and Musto.
4 See Jain and Wu (2000), Cronqvist (2005), Gallaher, Kaniel and Starks (2004), Mullainathan and Shleifer (2005),
and Reuter and Zitzewitz (2006).
5 12b-1 fees are named for SEC rule 12b-1 of the 1940 Investment Company Act. This rule allows mutual funds to
charge annual fees out of assets in order pay for marketing and distribution expenses.
6 This has led some funds without 12b-1 fees to market themselves as ‘pure’ no-load funds.
7 We attempt to exclude funds sold into defined contribution plans by excluding from our study share classes that are
identified as being made available to these plans.
8 For example, see Johannes, Laura and John Hechinger, “Conflicting Interests, Why a Brokerage Giant Pushes
Some Mediocre Mutual Funds,” The Wall Street Journal, January 9, 2004, A1.
9 Prior versions of this paper used data through 2002. As a result, most of the quantitative results in this version have
changed however few of the inferences have changed. The 2004 data concerning money market funds appears
incomplete relative to the 2002 data. So for money market funds we use data through 2002.
10 Factor loadings for newly introduced share classes of funds, in situations where the fund has other share classes
with longer track records, are assumed to match the factor loadings of the older share classes of the same fund.

23
11 These numbers exclude institutional funds and those for which the method of distribution is ambiguous. The data
restriction imposed in later tests where we require factor loadings causes us to lose approximately 35% of all funds
but only about 13% of assets.
12 See Nanda, Wang, and Zheng (2003) for a study of the impact that the explosion of share classes has had on the
relation between loads and flows.
13 To check if multiple share classes have an impact on our equally weighted return results, we examine only the
first share class for each fund and find that the equal weighted return results are qualitatively identical.
14 Results, available upon request, show that if we restrict our sample to include only the unadjusted fund returns and
benchmark-adjusted returns for those funds for which alpha measures are available, our inferences are largely
unaffected. However, p-values for asset-weighted broad equity returns (with and without index funds) rise beyond
conventional levels of significance.
15 Raw returns, when averaged over the entire sample period, are influenced by co-variation between year-to-year
changes in the number of funds and year-to-year changes in average returns. Benchmark-adjusted and risk-adjusted
returns, which subtract out year-to-year variation in average returns, are less sensitive to the influence of the
changing number of funds over time.
16 Calculated using assets in 2004 as follows: $2.6 trillion in broker-sold mutual fund assets, with 77 basis point
underperformance in domestic equity funds (42.6% of broker-sold assets), 90 basis point underperformance in bond
funds (12% of broker-sold assets), 183 basis point outperformance in foreign equity funds (14% of broker-sold
assets).
17 The 12b-1 fee estimate is from figure 1.
18 The ICI (2004) reports that users of directly-placed and brokered funds are equally likely to have assets invested
in bank or thrift deposits, although the study does not report the level of transaction deposits held in these accounts.
However, customers of brokers have only 50% of their household financial assets with funds (vs. 55% for clients of
direct-sold funds), which suggest that their non-fund transaction accounts may be even higher than for customers of
direct-sold funds.
19 This conclusion is true after controlling for a host of variable in a multivariate setting too.
20 For convenience, we refer to these channels using our terminology (broker and direct) rather than ICI’s
definitions of a sales force channel, which includes full service brokers, independent financial planners, bank or

24
savings institution representatives, insurance agents and accountants, and the direct market channel which includes
fund companies and discount brokers. See ICI (2004), page 11.
21 See Barberis and Thaler (2003) for a recent summary of this literature.
22 See Sirri and Tufano (1998), Brown, Harlow and Starks (1996) or Chevalier and Ellison (1997) for earlier studies
of this phenomenon.
23 In prior versions of this paper we studied the reaction speed of fund flows to changes in performance, a measure
that we referred to as ‘fund flow velocity’. In an earlier draft of this paper we reported that broker-channel funds
have much higher ‘velocity’ of inflows following periods of high performance. Subsequent analysis suggests that
results were driven by two direct channel fund families that are marketed to rapid traders. Funds sold through these
two families have a very large and negative relationship between short-term performance and inflows. Excluding
these two fund families the difference between broker and direct channel funds in the ‘reaction time’ of inflows to
performance is economically insignificant. This analysis has been dropped from the paper.
24 44 basis points larger among domestic equity funds, 44 basis points larger among bond funds, 38 basis points
larger among foreign equity funds, and 7 basis points larger among money market funds.
25 These results are generally consistent with the results in Barber, Odean and Zheng (2003) (BOZ) and Zhao
(2003). The BOZ paper finds that investors are more sensitive to loads than to annual fees and that 12b-1 fees
increase flows. However, the BOZ paper also finds that flows are reduced by higher load fees in their sample. Zhao
finds that higher loads and 12b-1 fees both are associated with higher flows.
26 Nanda, Wang and Zheng’s results suggest that within the broker channel lower cost classes have more volatile
flow.
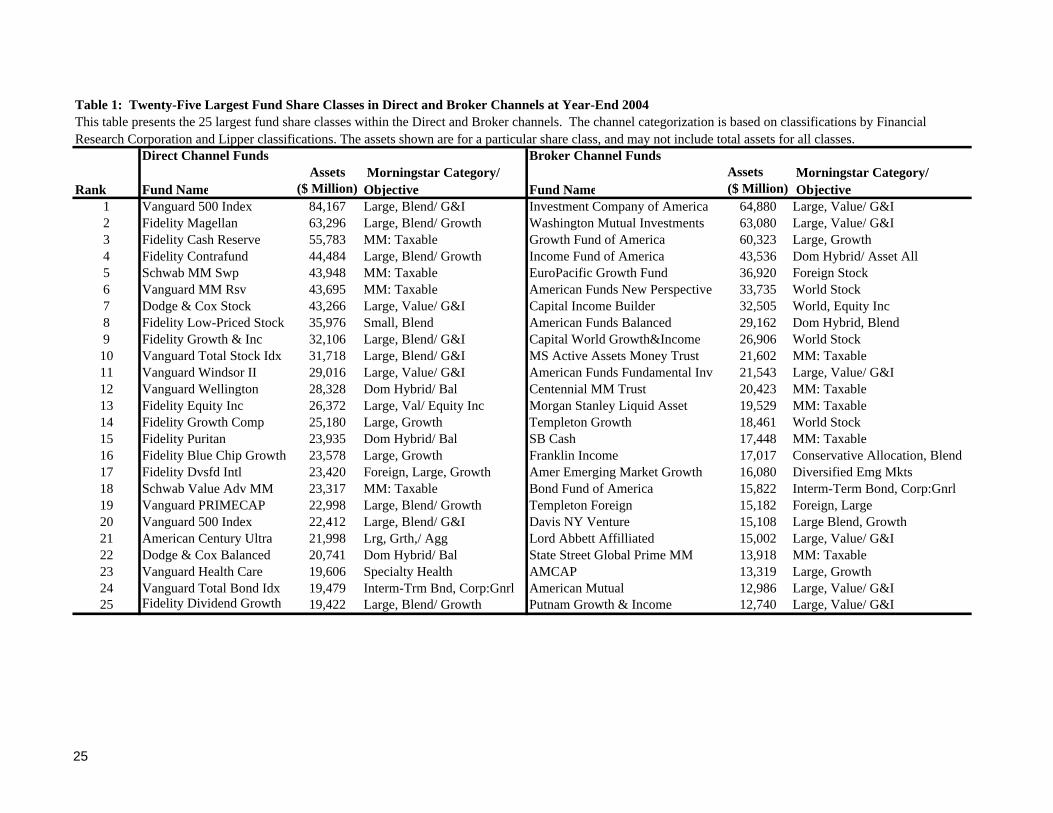
Table 1: Twenty-Five Largest Fund Share Classes in Direct and Broker Channels at Year-End 2004
Assets Assets($ Million) ($ Million)
1 Vanguard 500 Index 84,167 Large, Blend/ G&I Investment Company of America 64,8802 Fidelity Magellan 63,296 Large, Blend/ Growth Washington Mutual Investments 63,0803 Fidelity Cash Reserve 55,783 MM: Taxable Growth Fund of America 60,3234 Fidelity Contrafund 44,484 Large, Blend/ Growth Income Fund of America 43,5365 Schwab MM Swp 43,948 MM: Taxable EuroPacific Growth Fund 36,9206 Vanguard MM Rsv 43,695 MM: Taxable American Funds New Perspective 33,7357 Dodge & Cox Stock 43,266 Large, Value/ G&I Capital Income Builder 32,5058 Fidelity Low-Priced Stock 35,976 Small, Blend American Funds Balanced 29,1629 Fidelity Growth & Inc 32,106 Large, Blend/ G&I Capital World Growth&Income 26,90610 Vanguard Total Stock Idx 31,718 Large, Blend/ G&I MS Active Assets Money Trust 21,60211 Vanguard Windsor II 29,016 Large, Value/ G&I American Funds Fundamental Inv 21,54312 Vanguard Wellington 28,328 Dom Hybrid/ Bal Centennial MM Trust 20,42313 Fidelity Equity Inc 26,372 Large, Val/ Equity Inc Morgan Stanley Liquid Asset 19,52914 Fidelity Growth Comp 25,180 Large, Growth Templeton Growth 18,46115 Fidelity Puritan 23,935 Dom Hybrid/ Bal SB Cash 17,44816 Fidelity Blue Chip Growth 23,578 Large, Growth Franklin Income 17,01717 Fidelity Dvsfd Intl 23,420 Foreign, Large, Growth Amer Emerging Market Growth 16,08018 Schwab Value Adv MM 23,317 MM: Taxable Bond Fund of America 15,82219 Vanguard PRIMECAP 22,998 Large, Blend/ Growth Templeton Foreign 15,18220 Vanguard 500 Index 22,412 Large, Blend/ G&I Davis NY Venture 15,10821 American Century Ultra 21,998 Lrg, Grth,/ Agg Lord Abbett Affilliated 15,00222 Dodge & Cox Balanced 20,741 Dom Hybrid/ Bal State Street Global Prime MM 13,91823 Vanguard Health Care 19,606 Specialty Health AMCAP 13,31924 Vanguard Total Bond Idx 19,479 Interm-Trm Bnd, Corp:Gnrl American Mutual 12,98625 Fidelity Dividend Growth 19,422 Large, Blend/ Growth Putnam Growth & Income 12,740 Large, Value/ G&I
This table presents the 25 largest fund share classes within the Direct and Broker channels. The channel categorization is based on classifications by Financial Research Corporation and Lipper classifications. The assets shown are for a particular share class, and may not include total assets for all classes.
Large, Value/ G&IMM: TaxableLarge, GrowthLarge, Value/ G&I
Diversified Emg MktsInterm-Term Bond, Corp:GnrlForeign, LargeLarge Blend, Growth
MM: TaxableWorld StockMM: TaxableConservative Allocation, Blend
World StockMM: TaxableLarge, Value/ G&IMM: Taxable
Foreign StockWorld StockWorld, Equity IncDom Hybrid, Blend
Large, Value/ G&ILarge, Value/ G&ILarge, GrowthDom Hybrid/ Asset All
Direct Channel Funds Broker Channel Funds
Rank Fund Name Morningstar Category/ Objective Fund Name
Morningstar Category/Objective
25

Broker Test Broker Test(B) B=D (B) B=D
Panel A: Number of F1996 2,625 2,6061998 2,966 2,9332000 3,005 2,9592002 3,002 2,9332004 2,712 2,647
1996 4,155 4,1321998 5,358 5,3162000 6,044 5,9722002 6,804 6,6912004 7,273 7,145
1996 1,471,508 1,467,9411998 2,177,190 2,165,4242000 2,465,407 2,448,2212002 1,908,308 1,895,2712004 2,567,918 2,550,373
1996 632 [0.00] 634 [0.00]1998 860 [0.00] 863 [0.00]2000 962 [0.00] 968 [0.00]2002 870 [0.00] 883 [0.00]2004 1,105 [0.00] 1,120 [0.00]
1996 0.38 [0.28] 0.38 [0.36]1998 0.34 [0.37] 0.34 [0.35]2000 0.35 [0.66] 0.35 [0.88]2002 0.35 [0.12] 0.34 [0.08]2004 0.27 [0.05] 0.27 [0.01]
Panel C: Assets ($ Millions)
Panel D: Average Assets Per Fund (at fund-level) ($ Millions)
1,4591,5981,924
1,018,8271,611,9852,013,7531,741,749
1,3761,372
Table 2: Number of Funds and Fund Asset Value by Distribution Channel Classification, 1996-2004:For the direct and broker channels this table reports the number of funds, the number of share classes, assets under management, average fund size, and the proportion of funds with assets under management less than $100 million. We report these data at two-year intervals. Our sample does not include (a) institutional funds, and (b) funds in which the FRC and Lipper channel classifications disagree or are both missing. As more fully described in figure 1, we classify a fund share class as “Direct” if both Lipper and FRC classify that fund as being sold primarily through the Direct channel. We classify a fund share class as belonging to the “Broker” channel if the FRC classification of the share class is “Captive Broker” and the Lipper classification is one of “Broker-Dealer”, “Captive”, or “Wirehouse.”
Including Index Funds Excluding Index FundsYear
1,2271,049
1,541
1,0981,324
Panel B: Number of Share Classes
2,507,144
9541,2881,5181,3191,683
0.360.35
Panel E: Share of Funds with Assets Less Than $100 Million
0.340.370.30 0.30
0.370.350.360.36
1,5341,2451,4121,212
932
2,175,8081,556,5691,809,7311,463,268
964,442
1,7961,4741,3881,2691,064
1,4551,2871,313
1,0831,277
Direct(D)
Direct(D)
26
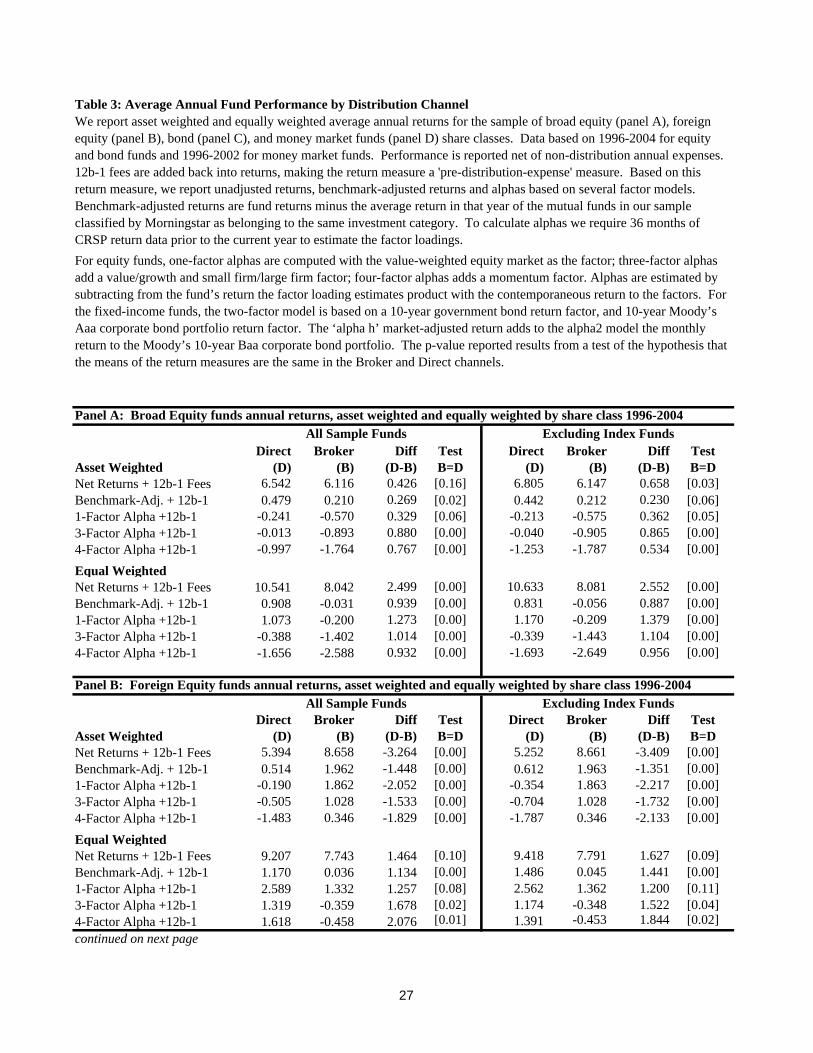
Table 3: Average Annual Fund Performance by Distribution Channel
Panel A: Broad Equity funds annual returns, asset weighted and equally weighted by share class 1996-2004
Broker Diff Test Direct Broker Diff TestAsset Weighted (B) (D-B) B=D (D) (B) (D-B) B=DNet Returns + 12b-1 Fees 6.116 0.426 [0.16] 6.147 0.658 [0.03]Benchmark-Adj. + 12b-1 0.210 0.269 [0.02] 0.212 0.230 [0.06]1-Factor Alpha +12b-1 -0.570 0.329 [0.06] -0.575 0.362 [0.05]3-Factor Alpha +12b-1 -0.893 0.880 [0.00] -0.905 0.865 [0.00]4-Factor Alpha +12b-1 -1.764 0.767 [0.00] -1.787 0.534 [0.00]
Equal WeightedNet Returns + 12b-1 Fees 8.042 2.499 [0.00] 8.081 2.552 [0.00]Benchmark-Adj. + 12b-1 -0.031 0.939 [0.00] -0.056 0.887 [0.00]1-Factor Alpha +12b-1 -0.200 1.273 [0.00] -0.209 1.379 [0.00]3-Factor Alpha +12b-1 -1.402 1.014 [0.00] -1.443 1.104 [0.00]4-Factor Alpha +12b-1 -2.588 0.932 [0.00] -2.649 0.956 [0.00]
Panel B: Foreign Equity funds annual returns, asset weighted and equally weighted by share class 1996-2004
Direct Broker Diff Test Direct Broker Diff TestAsset Weighted (D) (B) (D-B) B=D (D) (B) (D-B) B=DNet Returns + 12b-1 Fees 8.658 -3.264 [0.00] 8.661 -3.409 [0.00]Benchmark-Adj. + 12b-1 1.962 -1.448 [0.00] 1.963 -1.351 [0.00]1-Factor Alpha +12b-1 1.862 -2.052 [0.00] 1.863 -2.217 [0.00]3-Factor Alpha +12b-1 1.028 -1.533 [0.00] 1.028 -1.732 [0.00]4-Factor Alpha +12b-1 0.346 -1.829 [0.00] 0.346 -2.133 [0.00]
Equal WeightedNet Returns + 12b-1 Fees 7.743 1.464 [0.10] 7.791 1.627 [0.09]Benchmark-Adj. + 12b-1 0.036 1.134 [0.00] 0.045 1.441 [0.00]1-Factor Alpha +12b-1 1.332 1.257 [0.08] 1.362 1.200 [0.11]3-Factor Alpha +12b-1 -0.359 1.678 [0.02] -0.348 1.522 [0.04]4-Factor Alpha +12b-1 -0.458 2.076 [0.01] -0.453 1.844 [0.02]continued on next page
0.514 0.612
1.170 1.486
1.1741.391
-0.704-1.787
9.418
2.562
-0.339-1.693
5.252
-0.354
6.8050.442
-0.213-0.040-1.253
10.6330.8311.170
2.5891.3191.618
0.9081.073
-0.388-1.656
-0.241-0.013-0.997
10.541
Direct(D)
6.5420.479
All Sample Funds Excluding Index Funds
5.394
-0.190-0.505-1.483
9.207
We report asset weighted and equally weighted average annual returns for the sample of broad equity (panel A), foreign equity (panel B), bond (panel C), and money market funds (panel D) share classes. Data based on 1996-2004 for equity and bond funds and 1996-2002 for money market funds. Performance is reported net of non-distribution annual expenses. 12b-1 fees are added back into returns, making the return measure a 'pre-distribution-expense' measure. Based on this return measure, we report unadjusted returns, benchmark-adjusted returns and alphas based on several factor models. Benchmark-adjusted returns are fund returns minus the average return in that year of the mutual funds in our sample classified by Morningstar as belonging to the same investment category. To calculate alphas we require 36 months of CRSP return data prior to the current year to estimate the factor loadings. For equity funds, one-factor alphas are computed with the value-weighted equity market as the factor; three-factor alphas add a value/growth and small firm/large firm factor; four-factor alphas adds a momentum factor. Alphas are estimated by subtracting from the fund’s return the factor loading estimates product with the contemporaneous return to the factors. For the fixed-income funds, the two-factor model is based on a 10-year government bond return factor, and 10-year Moody’s Aaa corporate bond portfolio return factor. The ‘alpha h’ market-adjusted return adds to the alpha2 model the monthly return to the Moody’s 10-year Baa corporate bond portfolio. The p-value reported results from a test of the hypothesis that the means of the return measures are the same in the Broker and Direct channels.
Excluding Index FundsAll Sample Funds
27
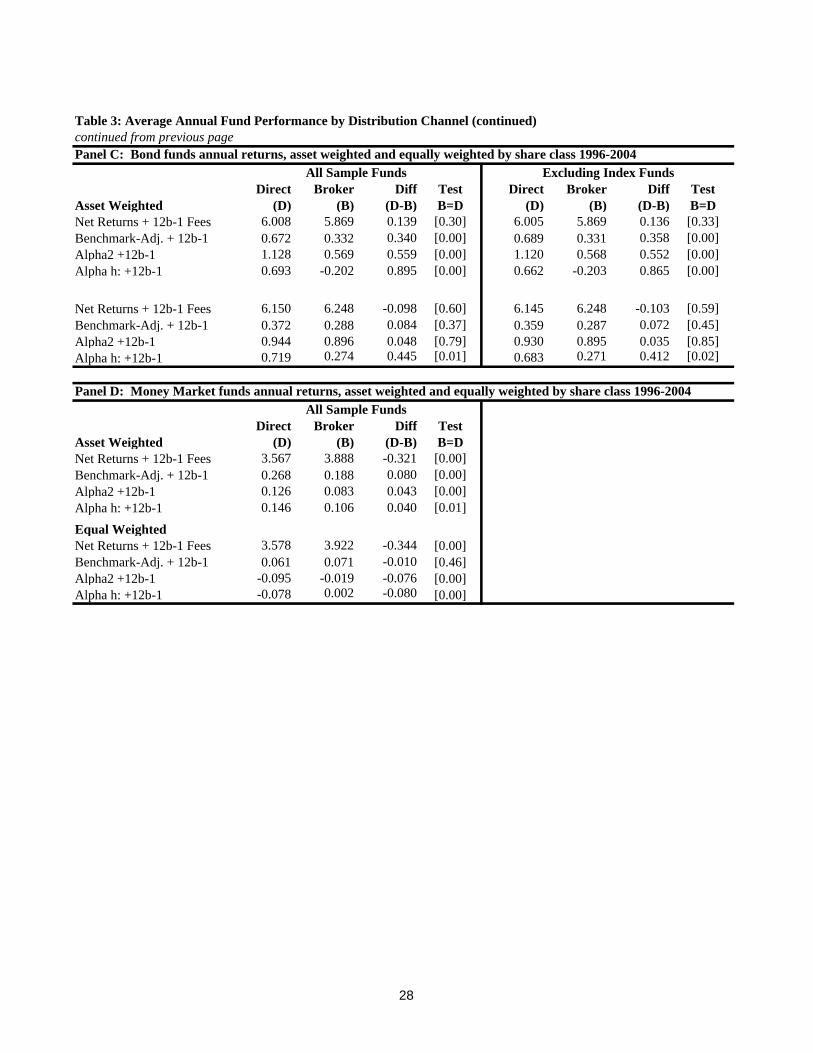
Table 3: Average Annual Fund Performance by Distribution Channel (continued)continued from previous pagePanel C: Bond funds annual returns, asset weighted and equally weighted by share class 1996-2004
Direct Broker Diff Test Direct Broker Diff TestAsset Weighted (D) (B) (D-B) B=D (D) (B) (D-B) B=DNet Returns + 12b-1 Fees 5.869 0.139 [0.30] 5.869 0.136 [0.33]Benchmark-Adj. + 12b-1 0.332 0.340 [0.00] 0.331 0.358 [0.00]Alpha2 +12b-1 0.569 0.559 [0.00] 0.568 0.552 [0.00]Alpha h: +12b-1 -0.202 0.895 [0.00] -0.203 0.865 [0.00]
Net Returns + 12b-1 Fees 6.248 -0.098 [0.60] 6.248 -0.103 [0.59]Benchmark-Adj. + 12b-1 0.288 0.084 [0.37] 0.287 0.072 [0.45]Alpha2 +12b-1 0.896 0.048 [0.79] 0.895 0.035 [0.85]Alpha h: +12b-1 0.274 0.445 [0.01] 0.271 0.412 [0.02]
Panel D: Money Market funds annual returns, asset weighted and equally weighted by share class 1996-2004
Direct Broker Diff TestAsset Weighted (D) (B) (D-B) B=DNet Returns + 12b-1 Fees 3.888 -0.321 [0.00]Benchmark-Adj. + 12b-1 0.188 0.080 [0.00]Alpha2 +12b-1 0.083 0.043 [0.00]Alpha h: +12b-1 0.106 0.040 [0.01]
Equal WeightedNet Returns + 12b-1 Fees 3.922 -0.344 [0.00]Benchmark-Adj. + 12b-1 0.071 -0.010 [0.46]Alpha2 +12b-1 -0.019 -0.076 [0.00]Alpha h: +12b-1 0.002 -0.080 [0.00]
6.150 6.145
6.0050.689
0.683
1.1200.662
0.9300.359
-0.095-0.078
0.1260.146
3.5780.061
3.5670.268
All Sample Funds
0.3720.9440.719
0.6721.1280.693
6.008
All Sample Funds Excluding Index Funds
28

Table 4: Characteristics of Funds by Distribution Channel, 1996-2004
Broker Test Broker(B) (B=D) (B)
1996 17.84 [0.97] 9.221998 19.59 [0.12] 9.632000 21.16 [0.00] 10.792002 21.76 [0.00] 11.812004 25.06 [0.00] 12.76
1996 6.00% [0.27] 26.20%1998 4.10% [0.38] 18.40%2000 4.00% [0.01] 16.30%2002 3.40% [0.00] 12.30%2004 3.50% [0.00] 14.00%
1996 8.39 [0.00] 4.461998 5.39 [0.02] 4.162000 5.62 [0.20] 4.312002 7.70 [0.15] 4.972004 8.39 [0.00] 5.64
1996 6.3% [0.01] 19.8%1998 6.7% [0.00] 24.1%2000 3.3% [0.01] 16.5%2002 2.3% [0.03] 13.7%2004 1.1% [0.11] 6.2%
(D)Direct
12.1110.8610.14
9.88
22.40%26.50%
12.47
11.00%10.60%17.40%
5.724.534.664.93
21.0%21.7%
6.26
0.4% 4.0%8.6%
15.3%
2.7%
1.2%2.2%
0.9%
5.795.837.319.31
2.50%1.60%1.60%
6.24
19.9421.09
5.10%3.60%
17.8218.8519.00
[0.12][0.01]
Panel A: Average Age of Funds (years)[0.07][0.13]
Panel D: Percentage of Equity Funds without Morningstar
[0.84][0.38][0.40]
[0.84][0.00]
Panel B: Proportion of Funds that are Young (<=3 Years)
Panel C: Manager Tenure (years)
[0.34]
We characterize our sample funds along four dimensions: average age in years, the proportion of funds that are less than three years old, manager tenure in years, and whether the fund is covered by Morningstar. We interpret the asset-weighted results as a reflection of investors' aggregate cumulative sales and purchase decisions, while the equally-weighted averages represent the product set offered by the channel. The hypothesis test columns show the p-value from a test that the means of the variable in a given row, and given weighting method, are the same in the Broker channel as in the Direct channel. Equally-weighted results use mutual fund, rather than fund share class, as the unit of observation. This table includes index funds, though broad pattern of results is robust to their exclusion.
Test(B=D)
Equally-WeightedAsset-Weighted
Direct(D)
[0.01][0.00][0.11][0.00][0.00]
[0.48][0.21][0.56][0.00][0.05]
29
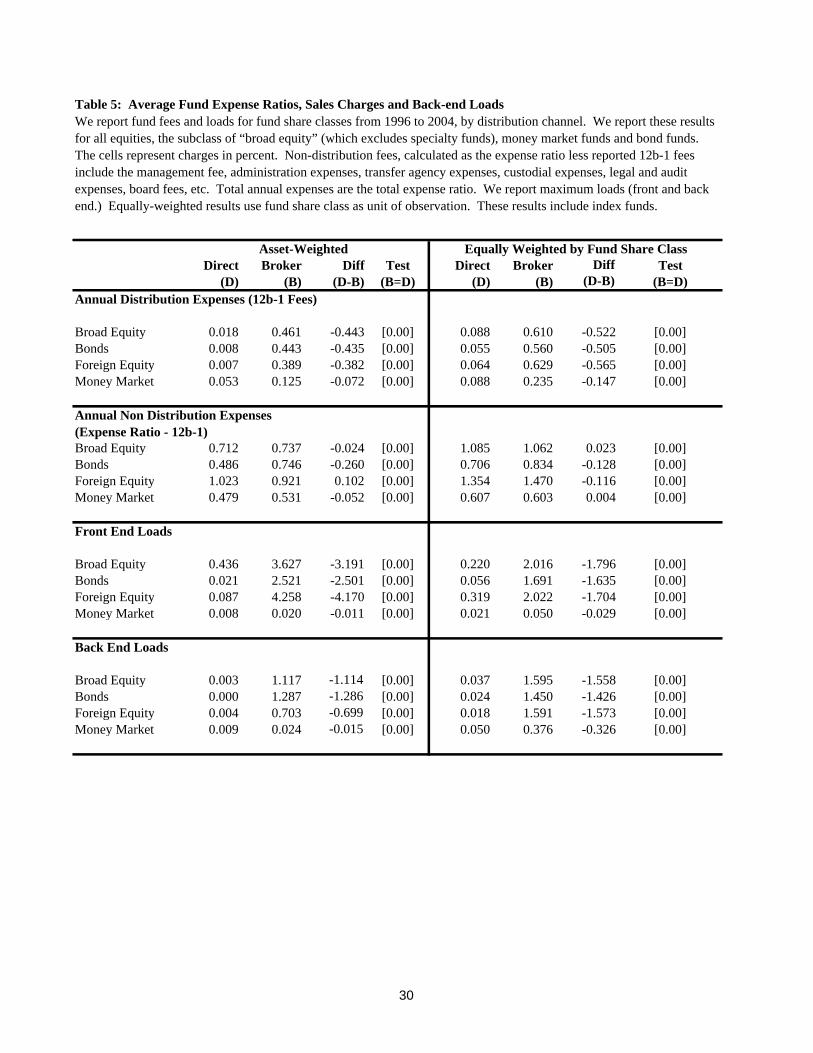
Table 5: Average Fund Expense Ratios, Sales Charges and Back-end Loads
Broker Diff Test Direct Broker Diff Test(B) (D-B) (B=D) (D) (B) (D-B) (B=D)
Broad Equity 0.461 -0.443 [0.00] 0.088 0.610 -0.522 [0.00]Bonds 0.443 -0.435 [0.00] 0.055 0.560 -0.505 [0.00]Foreign Equity 0.389 -0.382 [0.00] 0.064 0.629 -0.565 [0.00]Money Market 0.125 -0.072 [0.00] 0.088 0.235 -0.147 [0.00]
Broad Equity 0.737 -0.024 [0.00] 1.085 1.062 0.023 [0.00]Bonds 0.746 -0.260 [0.00] 0.706 0.834 -0.128 [0.00]Foreign Equity 0.921 0.102 [0.00] 1.354 1.470 -0.116 [0.00]Money Market 0.531 -0.052 [0.00] 0.607 0.603 0.004 [0.00]
Broad Equity 3.627 -3.191 [0.00] 0.220 2.016 -1.796 [0.00]Bonds 2.521 -2.501 [0.00] 0.056 1.691 -1.635 [0.00]Foreign Equity 4.258 -4.170 [0.00] 0.319 2.022 -1.704 [0.00]Money Market 0.020 -0.011 [0.00] 0.021 0.050 -0.029 [0.00]
Broad Equity 1.117 -1.114 [0.00] 0.037 1.595 -1.558 [0.00]Bonds 1.287 -1.286 [0.00] 0.024 1.450 -1.426 [0.00]Foreign Equity 0.703 -0.699 [0.00] 0.018 1.591 -1.573 [0.00]Money Market 0.024 -0.015 [0.00] 0.050 0.376 -0.326 [0.00]
We report fund fees and loads for fund share classes from 1996 to 2004, by distribution channel. We report these results for all equities, the subclass of “broad equity” (which excludes specialty funds), money market funds and bond funds. The cells represent charges in percent. Non-distribution fees, calculated as the expense ratio less reported 12b-1 fees include the management fee, administration expenses, transfer agency expenses, custodial expenses, legal and audit expenses, board fees, etc. Total annual expenses are the total expense ratio. We report maximum loads (front and back end.) Equally-weighted results use fund share class as unit of observation. These results include index funds.
Back End Loads
Front End Loads
0.053
0.712
Asset-Weighted
Annual Non Distribution Expenses (Expense Ratio - 12b-1)
0.4861.0230.479
0.436
Annual Distribution Expenses (12b-1 Fees)
Direct(D)
0.0180.0080.007
Equally Weighted by Fund Share Class
0.0030.0000.0040.009
0.0210.0870.008
30
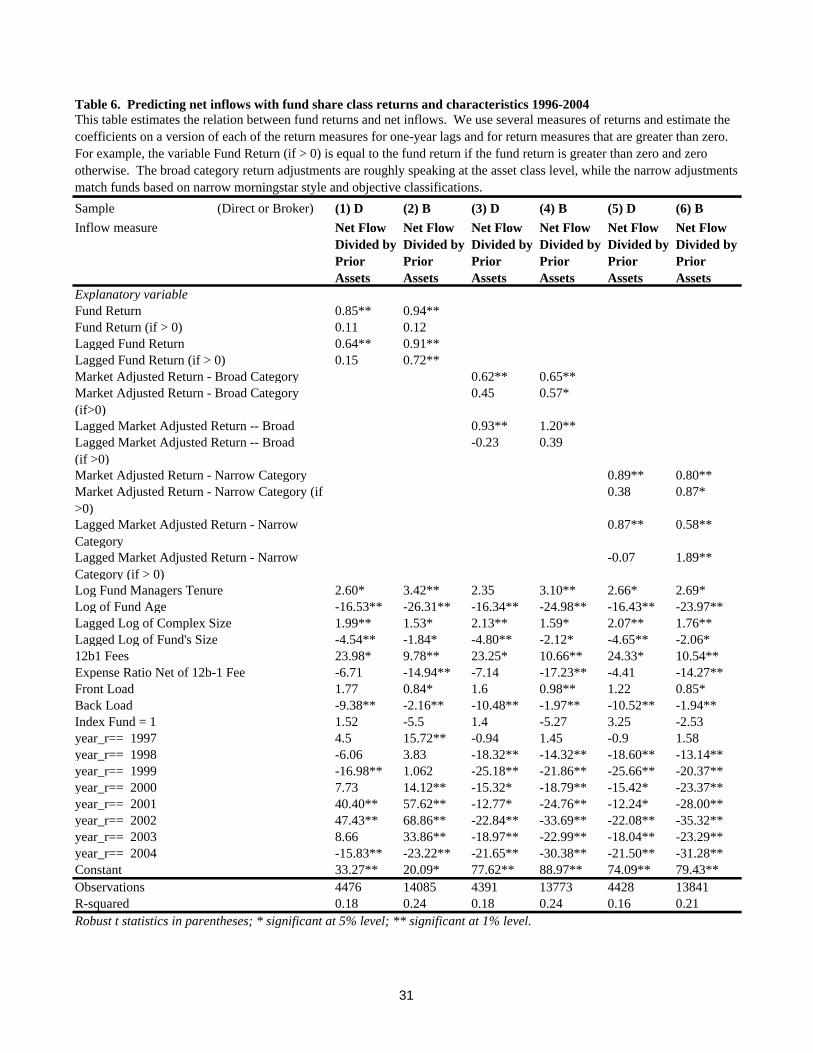
Table 6. Predicting net inflows with fund share class returns and characteristics 1996-2004
Sample (Direct or Broker) (1) D (2) B (3) D (4) B (5) D (6) BInflow measure Net Flow
Divided by Prior Assets
Net Flow Divided by Prior Assets
Net Flow Divided by Prior Assets
Net Flow Divided by Prior Assets
Net Flow Divided by Prior Assets
Net Flow Divided by Prior Assets
Explanatory variableFund Return 0.85** 0.94**Fund Return (if > 0) 0.11 0.12Lagged Fund Return 0.64** 0.91**Lagged Fund Return (if > 0) 0.15 0.72**Market Adjusted Return - Broad Category 0.62** 0.65**Market Adjusted Return - Broad Category (if>0)
0.45 0.57*
Lagged Market Adjusted Return -- Broad 0.93** 1.20**Lagged Market Adjusted Return -- Broad (if >0)
-0.23 0.39
Market Adjusted Return - Narrow Category 0.89** 0.80**Market Adjusted Return - Narrow Category (if >0)
0.38 0.87*
Lagged Market Adjusted Return - Narrow Category
0.87** 0.58**
Lagged Market Adjusted Return - Narrow Category (if > 0)
-0.07 1.89**
Log Fund Managers Tenure 2.60* 3.42** 2.35 3.10** 2.66* 2.69*Log of Fund Age -16.53** -26.31** -16.34** -24.98** -16.43** -23.97**Lagged Log of Complex Size 1.99** 1.53* 2.13** 1.59* 2.07** 1.76**Lagged Log of Fund's Size -4.54** -1.84* -4.80** -2.12* -4.65** -2.06*12b1 Fees 23.98* 9.78** 23.25* 10.66** 24.33* 10.54**Expense Ratio Net of 12b-1 Fee -6.71 -14.94** -7.14 -17.23** -4.41 -14.27**Front Load 1.77 0.84* 1.6 0.98** 1.22 0.85*Back Load -9.38** -2.16** -10.48** -1.97** -10.52** -1.94**Index Fund = 1 1.52 -5.5 1.4 -5.27 3.25 -2.53year_r== 1997 4.5 15.72** -0.94 1.45 -0.9 1.58year_r== 1998 -6.06 3.83 -18.32** -14.32** -18.60** -13.14**year_r== 1999 -16.98** 1.062 -25.18** -21.86** -25.66** -20.37**year_r== 2000 7.73 14.12** -15.32* -18.79** -15.42* -23.37**year_r== 2001 40.40** 57.62** -12.77* -24.76** -12.24* -28.00**year_r== 2002 47.43** 68.86** -22.84** -33.69** -22.08** -35.32**year_r== 2003 8.66 33.86** -18.97** -22.99** -18.04** -23.29**year_r== 2004 -15.83** -23.22** -21.65** -30.38** -21.50** -31.28**Constant 33.27** 20.09* 77.62** 88.97** 74.09** 79.43**Observations 4476 14085 4391 13773 4428 13841R-squared 0.18 0.24 0.18 0.24 0.16 0.21
This table estimates the relation between fund returns and net inflows. We use several measures of returns and estimate the coefficients on a version of each of the return measures for one-year lags and for return measures that are greater than zero. For example, the variable Fund Return (if > 0) is equal to the fund return if the fund return is greater than zero and zero otherwise. The broad category return adjustments are roughly speaking at the asset class level, while the narrow adjustments match funds based on narrow morningstar style and objective classifications.
Robust t statistics in parentheses; * significant at 5% level; ** significant at 1% level.
31

32
Figure 1. Investor Expenditures on Mutual Fund Management and 12b-1 Fees, by Distribution Channel
0
5
10
15
20
25
30
1996 1997 1998 1999 2000 2001 2002 2003 2004Year
Fee
Am
ount
($bi
llion
s)
Broker--Expense Ratio Net of 12b-1 Broker--12b1-Fees Direct - Expense Ratio Net of 12b-1 Direct - 12b1-Fees

33
Figure 2: Mapping of Fund Distribution Channel Classifications by Various Experts This figure describes how our direct, broker and institutional channel classifications map into the channel classifications used by mutual fund experts. The headings describes our classifications and each subsequent row describes the categories that fit into our classification scheme for each of four mutual fund experts. Direct Channel Broker Channel Institutional Channel Financial Research Corporation Direct Wholesale (non-proprietary)
Wholesale (proprietary) Bank
Institutional
Investment Company Institute Direct Supermarket
Advice Institutional Retirement Plan
Strategic Insight Direct to Do-it-Yourself Individual Investors Through No-load Supermarkets
Through Registered Investment Advisor Broker-Dealer Distributed Mutual Fund Wrap Bank
Institutional Defined Contribution Plans Variable Annuities
Lipper Direct Marketer Dealer Regional Broker Dealer Wirehouse (NYSE Member w/funds) Captive Bank Retail
Institutional Insurance Affinity Funds Employee Funds Bank-related Fiduciary & Institutionally Focused
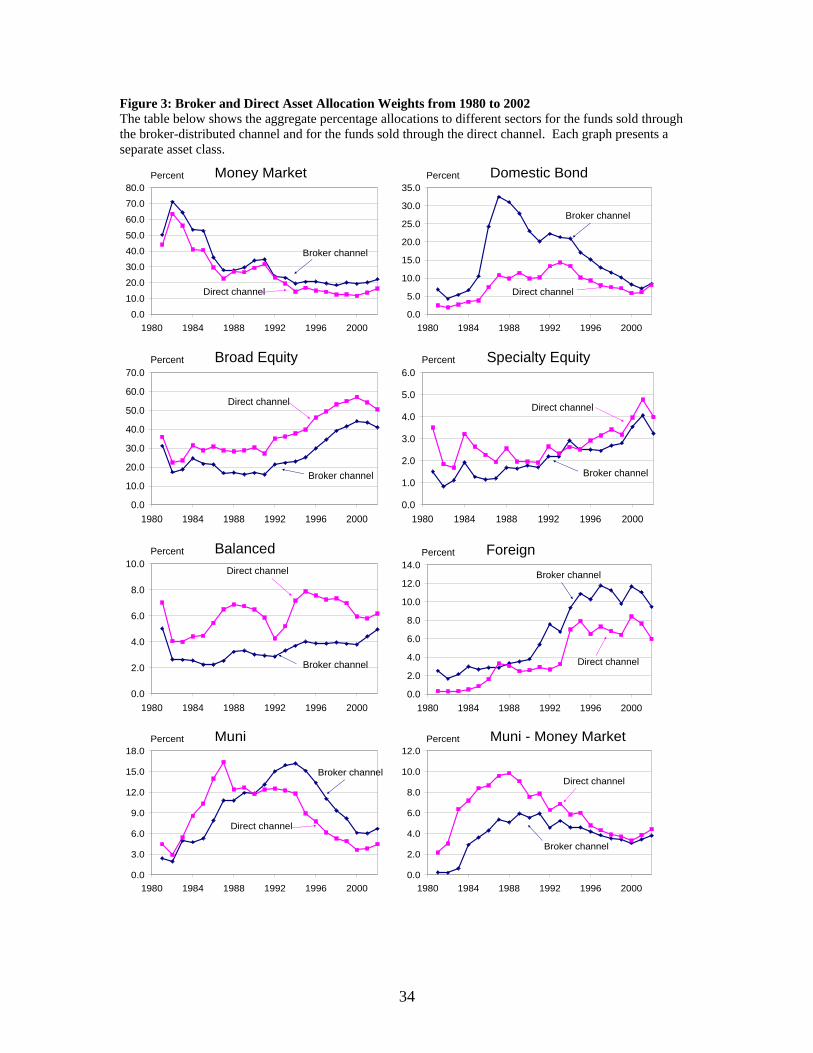
34
Figure 3: Broker and Direct Asset Allocation Weights from 1980 to 2002 The table below shows the aggregate percentage allocations to different sectors for the funds sold through the broker-distributed channel and for the funds sold through the direct channel. Each graph presents a separate asset class.
0.0
10.0
20.0
30.0
40.0
50.0
60.0
70.0
80.0
1980 1984 1988 1992 1996 2000
Percent
Broker channel
Direct channel
Money Market
0.0
5.0
10.0
15.0
20.0
25.0
30.0
35.0
1980 1984 1988 1992 1996 2000
Percent
Broker channel
Direct channel
Domestic Bond
0.0
10.0
20.0
30.0
40.0
50.0
60.0
70.0
1980 1984 1988 1992 1996 2000
Percent
Broker channel
Direct channel
Broad Equity
0.0
1.0
2.0
3.0
4.0
5.0
6.0
1980 1984 1988 1992 1996 2000
Percent
Broker channel
Direct channel
Specialty Equity
0.0
2.0
4.0
6.0
8.0
10.0
1980 1984 1988 1992 1996 2000
Percent
Broker channel
Direct channel
Balanced
0.0
2.0
4.0
6.0
8.0
10.0
12.0
14.0
1980 1984 1988 1992 1996 2000
Percent
Broker channel
Direct channel
Foreign
0.0
3.0
6.0
9.0
12.0
15.0
18.0
1980 1984 1988 1992 1996 2000
Percent
Broker channel
Direct channel
Muni
0.0
2.0
4.0
6.0
8.0
10.0
12.0
1980 1984 1988 1992 1996 2000
Percent
Broker channel
Direct channel
Muni - Money Market

35
Figure 4: Value of a Dollar Invested in a Model Portfolio Composed of Market Indices Weighted by the Asset Weights of the Two Channels, 1980-2002 The figure below shows the value of a dollar invested in 1980 when invested in model portfolios holding four classes of assets: cash, stocks, bonds and municipal bonds. The indexes used for the asset returns are the Value weighted CRSP index returns for the NYSE, ASE and NASDAQ stocks, the Lehman Aggregate Domestic Bond index, the Lehman Aggregate Municipal Bond index, and the returns to the 30 day treasury bill. We calculate returns based upon only four of the asset classes available: Domestic Equity, Domestic Bond, Municipal Bond and Money Market, and rescale the weights under the assumption that these four asset classes represent the entire investment universe for these funds
$0.00
$1.00
$2.00
$3.00
$4.00
$5.00
$6.00
$7.00
$8.00
$9.00
$10.00D
ec-8
0
Dec
-82
Dec
-84
Dec
-86
Dec
-88
Dec
-90
Dec
-92
Dec
-94
Dec
-96
Dec
-98
Dec
-00
Dec
-02
Cum
ulat
ive
Valu
e of
$1
Direct channel: Mean monthly excess return = 0.25%Standard deviation of excess returns = 2.46%Monthly Sharpe ratio = 0.102
Broker channel: Mean monthly excess return = 0.19%Standard deviation of excess returns = 1.84%Monthly Sharpe ratio = 0.102