Assessing the autogenous shrinkage cracking propensity of concrete · PDF file ·...
184
Assessing the autogenous shrinkage cracking propensity of concrete by means of the restrained ring test Die Bewertung der autogenen Schwindrissneigung von Beton mit Hilfe des Ring-Tests Dissertation zur Erlangung des Grades eines Doktors der Ingenieurwissenschaften vorgelegt von Herrn Dipl.-Ing. Sören Eppers geboren am 22.06.1972 in Bremerhaven angenommen von der Fakultät Bauingenieurwesen der Technischen Universität Dresden begutachtet von Herrn Prof. Dr.-Ing. Viktor Mechtcherine Herrn Prof. Dr.-Ing. Rolf Breitenbücher verteidigt in Dresden am 24. November 2010
Transcript of Assessing the autogenous shrinkage cracking propensity of concrete · PDF file ·...
Assessing the autogenous shrinkage cracking propensity of concrete by means of the restrained ring test
Die Bewertung der autogenen Schwindrissneigung von Beton mit Hilfe des Ring-Tests
Dissertat ion
zur Erlangung des Grades eines
Doktors der Ingenieurwissenschaften
vorgelegt von
Herrn Dipl.-Ing. Sören Eppers
geboren am 22.06.1972 in Bremerhaven
angenommen von der
Fakultät Bauingenieurwesen der
Technischen Universität Dresden
begutachtet von
Herrn Prof. Dr.-Ing. Viktor Mechtcherine
Herrn Prof. Dr.-Ing. Rolf Breitenbücher
verteidigt in Dresden
am 24. November 2010

Vorwort
Die vorliegende Arbeit entstand am Forschungsinstitut der Zementindustrie in Düsseldorf. Dem Verein Deutscher Zementwerke e.V. danke ich für die Förderung des Projekts und die Möglichkeit, eine Dissertation darüber anzufertigen. Insbesondere möchte ich mich beim Hauptgeschäftsführer, Herrn Prof. Dr. rer. nat. Martin Schneider, für seine Unterstützung bedanken. Für die kritische Begleitung und freundliche Betreuung der Arbeit danke ich dem Hauptreferenten Herrn Prof. Dr.-Ing. Viktor Mechtcherine von der Universität Dresden. Mein Dank gilt auch dem Korreferenten Herrn Prof. Dr.-Ing. Rolf Breitenbücher von der Ruhr-Universität Bochum. Dank gebührt darüber hinaus den Kolleginnen und Kollegen des Forschungsinstituts, die mir mit Rat und Tat zur Seite standen, besonders Herrn Dr.-Ing. Christoph Müller und seinen Mitarbeitern in der Abteilung Betontechnik. Ferner bedanke ich mich bei der Deutschen Forschungsgemeinschaft für die bewilligten Fördermittel. Düsseldorf, März 2011 Sören Eppers

Summary
The autogenous shrinkage due to self-desiccation of high- and ultra-high performance con-cretes with very low water-cement ratio in case of restraint leads to considerable stresses start-ing from very early age. The resultant risk of cracking presently cannot be adequately investi-gated. Parameters that are particularly difficult to capture experimentally are the concrete temperature and the viscoelasticity.
The primary objective of this work was to assess as precise as possible the autogenous shrink-age cracking propensity of representative concretes at strong restraint and constant room tem-perature. Test methods needed to be chosen and enhanced in a way that preferably allowed for the efficient and precise investigation of all relevant factors in the future. Ideally, a method suitable for a complete empirical modeling was provided.
First the methodological requirements and the advantages and disadvantages of existing test methods were discussed. Based on this, optimized test methods were proposed. Their suitabil-ity was verified using the example of ultra-high strength concrete. The choice of concrete compositions considered the essential measures for reducing shrinkage (internal curing, shrinkage-reducing admixtures, reduction of the fraction of Portland cement in the binder).
The autogenous shrinkage was measured with the shrinkage cone method. This new test method was validated by investigations of the repeatability and reproducibility and proved ef-ficient and precise. It allows for measurements under non-isothermal conditions; no estab-lished test method exists for that purpose to date. The autogenous shrinkage of the ultra-high strength concretes at the age of 24 h, investigated under quasi-isothermal conditions (20 °C), was between 0,25 mm/m and 0,70 mm/m. It was particularly low when a shrinkage-reducing admixture was added and when superabsorbent polymers were used.
The stresses due to restraint were determined with the restrained ring test. A large part of the stresses to be expected according to Hooke’s Law was eliminated by creep and relaxation. The relaxation capacity being very pronounced at very early age was the main reason that no visible cracking occurred, not even with the concretes with high autogenous shrinkage.
The development of the autogenous shrinkage cracking propensity was described as ratio of restraint stress and splitting tensile strength. By means of modified ring tests, used to deter-mine the maximum tensile stress, it could be shown that the ratio of stress to strength is an appropriate failure criterion. However, the cracking propensity can be calculated correctly only if the strongly age-dependent ratio of uniaxial to splitting tensile strength is accounted for. Besides, it needs to be considered that at very early age a plastic stress redistribution may occur in restrained ring tests.
The reference concrete showed a high cracking propensity of up to 0.68. The fact that shrink-age-reducing measures led to significantly lower values reveals their relevance for the safe application of ultra-high strength concrete. However, the investigations carried out here at 20 °C do not allow for a final assessment of the cracking propensity under typical on-site con-ditions. To empirically model the autogenous shrinkage cracking propensity as a function of temperature and stress level in the future, an analytical stress solution for non-isothermal re-strained ring tests and a new approach for investigating the residual stress and relaxation ca-pacity by means of non-passive restrained ring tests was suggested.

Kurzfassung
Das durch Selbstaustrocknung verursachte autogene Schwinden von besonders leistungsfähi-gen Betonen mit sehr niedrigem Wasserzementwert führt bei Dehnungsbehinderung bereits in sehr frühem Alter zu erheblichen Zwangsspannungen. Die Gefahr der Rissbildung, die sich daraus ergibt, lässt sich bislang nur unzureichend untersuchen. Experimentell besonders schwer zu erfassende Faktoren sind die Betontemperatur und die Viskoelastizität.
Das vorrangige Ziel der Arbeit war die möglichst genaue Ermittlung der autogenen Schwind-rissneigung repräsentativer Betone bei starker Dehnungsbehinderung und konstanter Raum-temperatur. Dabei waren die Prüfverfahren möglichst so zu wählen und weiterzuentwickeln, dass sich zukünftig alle relevanten Faktoren effizient und genau untersuchen lassen. Im Ideal-fall sollte eine Methode entstehen, die eine vollständige empirische Modellierung erlaubt.
Zunächst wurden die methodischen Anforderungen und die Vor- und Nachteile existierender Prüfverfahren diskutiert. Darauf aufbauend wurden optimierte Verfahren vorgeschlagen. Ihre Eignung wurde an ultrahochfestem Beton überprüft. Bei der Auswahl der Betone wurden die wesentlichen Maßnahmen zur Schwindreduzierung berücksichtigt (innere Nachbehandlung, schwindreduzierende Zusatzmittel, Verringerung des Portlandzementanteils am Bindemittel).
Das autogene Schwinden wurde mit dem Schwindkegelverfahren gemessen. Das neue Ver-fahren wurde durch Untersuchungen zur Wiederhol- und Vergleichsgenauigkeit validiert und erwies sich als effizient und genau. Es ermöglicht Messungen unter nicht-isothermen Bedin-gungen; hierfür existiert bisher kein etabliertes Verfahren. Das autogene Schwinden der un-tersuchten ultrahochfesten Betone unter quasi-isothermen Bedingungen (20 °C) betrug im Al-ter von 24 h zwischen 0,25 mm/m und 0,70 mm/m. Besonders gering war es bei Zugabe eines schwindreduzierenden Zusatzmittels bzw. Verwendung superabsorbierender Polymere.
Mit dem Ring-Test wurden die bei Dehnungsbehinderung entstehenden Spannungen ermittelt. Ein großer Teil der gemäß Hooke’schem Gesetz zu erwartenden Spannungen wurde durch Kriechen und Relaxation abgebaut. Die im sehr frühen Alter stark ausgeprägte Relaxationsfä-higkeit war der wesentliche Grund dafür, dass es selbst bei Betonen mit hohem autogenen Schwinden zu keiner erkennbaren Rissbildung kam.
Die Entwicklung der autogenen Schwindrissneigung wurde als Verhältnis von Zwangsspan-nung und Spaltzugfestigkeit beschrieben. Durch modifizierte Ring-Tests, mit deren Hilfe die maximale Zugspannung ermittelt wurde, konnte gezeigt werden, dass das Verhältnis von Spannung und Festigkeit als Versagenskriterium geeignet ist. Die Rissneigung lässt sich aber nur dann korrekt berechnen, wenn das stark altersabhängige Verhältnis von einaxialer Zugfes-tigkeit und Spaltzugfestigkeit berücksichtigt wird. Außerdem ist zu beachten, dass es im sehr frühen Alter zu einer plastischen Spannungsumlagerung in Ring-Tests kommen kann.
Der Referenzbeton wies eine hohe Rissneigung von bis zu 0,68 auf. Dass die schwindreduzie-renden Maßnahmen zu deutlich geringeren Werten führten, zeigt deren Bedeutung für den si-cheren Einsatz von ultrahochfestem Beton. Die hier bei 20 °C durchgeführten Untersuchun-gen erlauben allerdings keine abschließende Bewertung der Rissneigung unter baustellentypi-schen Bedingungen. Um die autogene Schwindrissneigung zukünftig als Funktion der Tempe-ratur und des Lastniveaus empirisch modellieren zu können, wurden eine analytische Span-nungslösung für nicht-isotherme Ring-Tests und ein neuer Ansatz zur Untersuchung der Resttrag- und Relaxationsfähigkeit mit Hilfe nicht-passiver Ring-Tests vorgeschlagen.

1 Introduction 3
2 Autogenous shrinkage 5 2.1 Shrinkage and hydration 5 2.2 Definitions and research approaches 10 2.3 Metrological issues 14 2.3.1 Multitude of test methods 14 2.3.2 Time-zero 16 2.3.3 Other metrological issues 18 2.4 Corrugated tube method 19 2.5 Influencing parameters 21 2.5.1 Concrete composition 21 2.5.2 Temperature 23 2.5.3 Specific countermeasures 25 2.6 Summary and conclusions with respect to the own work 25
3 Concretes used in the own investigations 27 3.1 Preliminary remarks 27 3.2 Concrete compositions 27 3.3 Constituents 28 3.3.1 Cement 28 3.3.2 Ground-granulated blast furnace slag 28 3.3.3 Silica fume 28 3.3.4 Admixtures 29 3.3.5 Aggregates 29 3.4 Mixing 29 3.5 Basic properties 30 3.5.1 Compressive strength 30 3.5.2 Splitting tensile strength 31 3.5.3 Modulus of elasticity 33 3.5.4 Analysis of mechanical properties 35 3.5.5 Coefficient of thermal expansion 38 3.5.6 Isothermal calorimetry 39 3.6 Summary 39
4 Shrinkage cone method for measuring autogenous shrinkage 41 4.1 Introduction 41 4.2 Setup and measurement procedure 41 4.3 Temperature control 44 4.4 Precision under quasi-isothermal conditions 47 4.4.1 Repeatability 47 4.4.2 Reproducibility 49 4.4.3 Shrinkage cone method vs. corrugated tube method 49 4.5 Autogenous shrinkage of the investigated concretes at 20 °C 54

4.6 Tests under non-isothermal conditions 55 4.7 Summary 56
5 Stress and cracks due to restrained autogenous shrinkage 58 5.1 Introduction 58 5.2 Degree of restraint 58 5.3 Formation of cracks 60 5.4 Very early age and importance of stress relaxation 63 5.5 Creep and cracking - further methodological aspects 65 5.6 Autogenous shrinkage cracking propensity 69 5.7 Role of temperature history 70 5.8 Further state of knowledge 72 5.8.1 Preliminary remarks on test methods 72 5.8.2 Quantitative investigations under restraint conditions 73 5.8.3 A full-scale model for assessing the cracking risk at very early age 77 5.9 Summary 78
6 Investigation of the autogenous shrinkage cracking propensity 80 6.1 Introduction 80 6.2 Suitability of temperature-stress testing machines 80 6.2.1 Development, setup and use 80 6.2.2 Results of round robin tests 83 6.3 Restrained ring test - methodological foundations 86 6.3.1 Setup and use 86 6.3.2 Evaluation of restrained ring tests 90 6.3.3 Use of temperature changes for the investigation of creep and relaxation 96 6.4 Own investigations with the restrained ring test 97 6.4.1 Setup 97 6.4.2 Compensation of disturbing temperature effects 99 6.4.3 Repeatability 100 6.4.4 Measured steel ring strains 101 6.4.5 Simple stress analysis 102 6.4.6 Autogenous shrinkage cracking propensity - further analysis 106 6.4.7 Thermal stress component 116 6.4.8 Period of maximum cracking propensity 118 6.4.9 Restraint stress versus autogenous shrinkage 119 6.4.10 Cracking propensity versus autogenous shrinkage 120 6.4.11 Further considerations on creep 121 6.5 Summary 126
7 Summary, conclusions and outlook 128 7.1 Summary and conclusions 128 7.2 Outlook 130
8 Literature 131
9 Annex 159


3
1 Introduction
Autogenous shrinkage is the major shrinkage component of concretes that contain much less water than would be required for complete hydration. This mainly applies to ultra-high strength concrete and, to a lesser extent, to high strength concrete. Both have particularly low water-cement ratios. The relative surplus of cement leads to an internal drying, irrespective of whether the concrete dries out to the ambient air or not. This process of so called self-desiccation is associated with autogenous shrinkage which, if restrained, can lead to cracks, potentially impairing the in many respects outstanding durability of these kinds of concrete. Hence, to fully benefit from the advantages of high and ultra-high strength concrete, it is es-sential to minimize the risk of autogenous shrinkage cracking. Attempts to do so, however, require a reliable method for assessing this risk. Presently, there is no such method.
Cracks are the result of relatively complex processes, in particular at early age as concrete properties change rapidly. A dependable assessment of the cracking risk requires comprehen-sive testing and a thorough understanding of the interacting parameters. Early age cracking in cementitious systems is not a new problem; cracking due to restrained drying shrinkage and thermal contraction has been examined at length. However, the investigation and prediction of stresses and cracks due to autogenous shrinkage brings about new challenges. The essential issue is the onset of stresses at very early age. This greatly increases the influence of creep and relaxation. Especially at stress levels close to failure this influence is highly non-linear and difficult to quantify, experimentally as well as mathematically.
Another challenge is the fact that temperature strongly influences the autogenous shrinkage and, presumably, the cracking risk as well. From isothermal tests at different temperatures it appears that this influence cannot be accounted for by formulas conventionally used to de-scribe the temperature dependency of cement hydration. The lack of clarity in this regard in part is a consequence of a series of methodological issues, most importantly the large number of different test methods and the difficulties in defining the onset of the autogenous shrinkage. The measurement of autogenous shrinkage, yet error-prone at constant temperatures, becomes particularly demanding at realistic temperature histories. The thermal deformations that inevi-tably superimpose the shrinkage strains are difficult to compensate for. At present there is no general agreement on how to measure the autogenous shrinkage under non-isothermal condi-tions.
In brief, the current knowledge about the influence of creep and temperature on autogenous shrinkage, restraint stress and cracking is insufficient. Obviously the experimental methods need to be improved in order to overcome the existing deficiencies. The main aim of this study therefore is to contribute to this improvement. The experimental focus is put on tests of the autogenous shrinkage and on restrained ring tests. The common stress-strength failure cri-terion is used to assess the risk of cracking due to restrained autogenous shrinkage, or as it will be called herein, the ‘autogenous shrinkage cracking propensity’. The strength is deter-mined mainly by splitting tension tests. Special restrained ring tests are carried out to further examine the applicability of the chosen failure criterion. The potential of the comparably sim-ple restrained ring test in quantifying creep is investigated. While the principal tests are con-ducted under quasi-isothermal conditions, the methodological analysis takes into account that tests of shrinkage and stresses under non-isothermal conditions will be required as well.

4
Non-reinforced fine-grained ultra-high strength concrete is used as material. Steel fibers are disregarded to obtain a more undisturbed view on essential phenomena, and large aggregates are omitted to reduce the test efforts as well as to control thermal effects more easily. The autogenous shrinkage of the chosen reference concrete can be expected to be very high, mak-ing it particularly suitable. To provide for a wide range of results, concrete compositions in-clude superabsorbent polymers, shrinkage-reducing admixture and ground-granulated blast furnace slag, representing common measures for reducing the autogenous shrinkage.
The following chapters report the individual aspects and results of this study. In Chapter 2, following an introduction into the autogenous shrinkage and the primary research approaches, the major issues regarding its measurement are described. The present knowledge as to the in-fluencing parameters is briefly depicted. The concretes used in the own investigations are pre-sented in Chapter 3, including mechanical and some other properties. Development and vali-dation of the new shrinkage cone method for measuring the autogenous shrinkage are com-prehensively described in Chapter 4. The autogenous shrinkage of the concrete compositions investigated is given. Furthermore, the method’s suitability for tests under non-isothermal conditions is outlined. The subsequent Chapter 5 summarizes the basics of stress development and cracking due to restrained autogenous shrinkage and provides explanations of the terms ‘autogenous shrinkage cracking propensity’ and ‘very early age’. In Chapter 6 it is first ex-plained why an available temperature-stress testing machine was not used in this study. Then the restrained ring test is analyzed as to its suitability for investigating the autogenous shrink-age cracking propensity. The methodological foundations of this method are given and the own investigations with the restrained ring test are presented. The work is summarized and conclusions are drawn in Chapter 7. The utilized literature can be found in Chapter 8 and ad-ditional data are annexed in Chapter 9.

5
2 Autogenous shrinkage
2.1 Shrinkage and hydration
Shrinkage and swelling of cement-based materials are load-independent volume changes caused by drying and wetting [Loc 00] or, in other words, by changes of the supply and state of water (“Wasserhaushalt”) [Gru 91], [Gru 03]. These volume changes originate mainly from the cement paste, therefore shrinkage and swelling of concrete depend on the cement paste content. Commonly, shrinkage denominates a volume decrease and swelling a volume in-crease, both terms referring to the external volume of a sample or a specimen, including its voids. Experimentally, either shrinkage or swelling is observed, however, the respective un-derlying mechanisms may proceed simultaneously. Wetting and drying of concrete and the related volume changes usually cannot be fully prevented under field conditions. Especially shrinkage is a concern, mainly because of the cracks it can cause. Cracks are disadvantageous in several respects (cf. 5.3).
According to the mechanisms and the period it takes place, shrinkage can be subdivided into four types, viz. chemical, plastic, drying and carbonation shrinkage [Gru 91]. The autogenous shrinkage generally is considered part of the chemical shrinkage which comprises all non-thermal volume changes due to hydraulic reactions in cementitious systems [Dav 40], [Taz 99]. Autogenous shrinkage occurs irrespective of whether moisture is released to the sur-roundings or not, whereas plastic and drying shrinkage mainly take place due to evaporation from the surface during the fresh and the hardened state, respectively. The loss of water that leads to plastic shrinkage can be largely prevented by external curing measures, for example by water ponding. Drying shrinkage to a large extent can only be postponed by such meas-ures. Generally, shrinkage due to evaporation from surfaces is not uniform. The resultant Ei-genstresses can lead to cracks even if there is no external restraint (cf. 5.2). Such cracks usu-ally begin at the surface but may affect deeper regions of the cross section later on.
Contrary to plastic and drying shrinkage, autogenous shrinkage is caused by an internal lack of water and therefore largely uniform. In most cases it cannot be minimized efficiently by an external supply of water, because it mainly occurs in particularly dense concretes with few capillary pores able to transport water. It usually leads to cracks only if restrained, mainly by aggregates, reinforcement, formwork or adjacent structures (cf. 5.2). The fourth type of shrinkage, carbonation shrinkage, is a volume reduction that begins at and usually is limited to the surface area, potentially leading to fine surface cracks. It is caused by the gradual car-bonation of calcium hydroxide and therefore is more pronounced with less dense concrete sur-faces which allow more of the required carbon dioxide to be absorbed from the ambient air. Consequently, carbonation shrinkage usually is negligible whenever autogenous shrinkage is not, in particular in dense or very dense high and ultra-high strength concretes.
It is noted that the term ‘ultra-high strength concrete’ in Germany is used for concrete with a compressive strength of minimum 150 MPa. Sometimes the term ‘ultra-high performance concrete’ is preferred in order to express that the compressive strength is not the only out-standing property. The development of ultra-high strength concrete goes back to the works of Bache [Bac 80], [Bac 81], [Bac 87]; substantial contributions were later made by Richard and Cheyrezy [Ric 95]. Historically, the addition of silica fume to concrete was a decisive step. The positive influence of silica fume on density and strength was recognized in the 1970ies [Sel 86]; a Swiss patent dates back to 1971 [Sik 76].

6
Shrinkage is a complex process. One factor fundamental for all types of shrinkage, except for plastic shrinkage, is the structure of the hardening cement paste. This structure is a result of hydration, a process of numerous chemical reactions, primarily of cement and water. Today, the principles of hydration of Portland cement are largely understood [Loc 00], [VDZ 08]. The main compounds of Portland cement clinker are tricalcium silicate (3CaO·SiO2, ‘C3S’ as per cement chemist notation), dicalcium silicate (2CaO·SiO2, ‘C2S’), tricalcium aluminate (3CaO·Al2O3, ‘C3A’) and tetracalcium aluminoferrite (4CaO·Al2O3·Fe2O3, ‘C4AF’). Calcium silicates (C3S, C2S) make up the major fraction. The most important group of reactions is the formation of poorly crystalline calcium silicate hydrates and crystalline calcium hydroxide from calcium silicates and water. The hydrates of calcium silicates, usually abbreviated as ‘C-S-H phases’, are extremely small needles that grow on the cement grains, increasing the sur-face area by a factor of more than 100 to 1000 [Cze 77]. Due to their size these needles are largely X-ray amorphous and one also speaks of ‘C-S-H gel’ [Tay 86]. A recent investigation evidenced the crystalline structure of C-S-H phases of C3S hydration [Röß 06].
Hardened Portland cement paste mainly consists of C-S-H phases. The development of strength and most other properties of the hardened cement paste is governed by the growth of these phases and the concurrent increase of Van der Waals forces [Loc 00]. In addition, cal-cium hydroxide is formed, mainly because the ratio of calcium to silicium on average is higher in C3S than in the formed C-S-H phases. The high alkalinity that is provided for by the calcium hydroxide is essential for reinforced concrete because it protects reinforcing steel from corrosion. The other compounds, i.e. tricalcium aluminate (C3A) and tetracalcium alu-minoferrite (C4AF), react in the presence of sulfates to calcium aluminate hydrates and cal-cium ferrite hydrates. The required sulfates stem from calcium sulfate and alkali sulfates. The amount of available sulfates is important for order, type and rate of reactions and typically is controlled by the addition of calcium sulfates to the clinker during the grinding process, mainly in the form of gypsum and anhydrite. The most frequent reaction products of the hy-dration of C3A and C4AF are ettringite and monosulfate, i.e. crystalline calcium sulfoalumi-nate hydrates with different amounts of water and sulfate. Especially ettringite binds large amounts of water. Pronounced autogenous shrinkage was observed with C3A-rich cements (cf. 2.5.1).
The given description of hydration is very much simplifying, and hydration comprises many other reactions and processes which partly have not been fully clarified, yet. Also the bonding forces acting within the C-S-H phases are the object of a continuous discussion [Pow 58], [Wit 77], [Set 08]. Refined experimental techniques for investigations at micro- and nanome-ter scale continuously allow for new insights and improved understanding. For instance, C-S-H gel today is assumed to consist of areas with low and high density [Jen 00]. Nevertheless, the properties and the behavior of hardening Portland cement paste cannot yet be predicted by models in a general and precise way [Jen 08]. Notably, hydration can be even more complex with cement pastes or concretes that contain cements other than Portland cement. Ultra-high strength concrete commonly contains additional latent hydraulic or pozzolanic materials as well as chemical admixtures that may significantly alter the hydration process [Kor 09].
The chronological course of Portland cement hydration can be divided into three periods, viz. pre-induction, induction and acceleration period [VDZ 08]. These periods are characterized by a more or less rapid transformation of cement compounds into hydrate phases. Generally, C3S and C3A hydrate more rapidly than C2S and C4AF. During the short initial pre-induction

7
period mainly the C3A is involved in very rapid and exothermic reactions. A large part of the sulfates is dissolved as soon as cement and water come into contact, and short crystals of et-tringite form on the C3A surfaces. After less than an hour the induction period begins, which is also called dormant period because reactions appear to be virtually halted. It is still not fully clear whether reactions at this early stage are slowed down because the first hydration prod-ucts coat the cement grains and act as a barrier, or because of the dissolution and precipitation processes involved [Jui 09]. In any case, the induction period is of great practical importance because it allows for a sufficient time span for casting a concrete.
After one to three hours the formation of C-S-H phases restarts at more notable rates, gradu-ally leading to the setting of the cement paste; as will be outlined below, this phase of solidifi-cation plays an important role for the onset of autogenous shrinkage (cf. 2.2 and 2.3.2). The concentration of ions (mainly Ca2+, OH-, K+, Na+, SO4
2−) increases, complete solidification is reached (final set), and approximately four hours after mixing the acceleration period begins, characterized by rapid hydration of calcium silicates and strong hardening of the cement paste. This final period of early hydration lasts until approximately 12 to 24 h. Afterwards, hydration proceeds at lower and constantly decreasing rates, occasionally considered a fourth period of hydration.
The hydration progress in general and the setting and hardening in particular notably depend on temperature. The acceleration that is caused by higher temperatures can be described quite precisely by the so called maturity approach. It is based on the Arrhenius equation which re-lates temperature to the rate of a chemical reaction. Temperature also influences the autoge-nous shrinkage, yet in a way that is less well understood (cf. 2.5.2). Hydration as such is an exothermic process. Especially in large concrete elements hydration may significantly in-crease the concrete temperature. The associated thermal strains complicate the investigation of autogenous shrinkage (cf. 2.3.3).
The hydration process furthermore is influenced by the water-cement ratio. It is known that the complete hydration of Portland cement theoretically requires a water-cement ratio of ap-proximately 0.40 [Loc 00]. Notably, even then only 60 to 65 % of the water contained in the paste are chemically bound in hydrate phases. The other 35 to 40 % are bound physically in a way that prevents the water from participating in further chemical reactions. Powers and Brownyard comprehensively investigated this aspect and introduced the terms ‘evaporable’ and ‘non-evaporable’ water [Pow 46a]. The evaporable water can be quantified by drying at 105 °C, whereas the non-evaporable water, i.e. the water that is chemically bound in hydrates, requires temperatures of up to 1000 °C to be removed from the hardened cement paste. Some hydrates, in particular ettringite and monosulfoaluminate, may start to dehydrate below 105 °C [Loc 00].
The pioneering work of Powers and Brownyard revealed, among many other things, that the compressive strength proportionally increases with increasing ratio of non-evaporable water to overall water [Pow 48]. This finding also explains essential properties of ultra-high strength concretes which have water-cement ratios of about 0.20 to 0.28. Due to the relative surplus of cement, the ratio of non-evaporable to overall water converges to its theoretical maximum in the course of hydration. Hence, the condition for maximum strength as per Powers and Brownyard is practically fulfilled.
8
At such low water-cement ratios a significant part of the cement does not hydrate. From an investigation of the phase development in ultra-high strength concrete it actually was found that 13 % of the particularly reactive main compound C3S did not hydrate [Kor 09]. Yet, the fraction of grains that remain completely anhydrous may be smaller, because most of the C3S can be assumed to hydrate at least at the very surface (cf. [Mös 08]). Thus, even if the overall water allows for the hydration of less than for instance 50 % of the cement, most cement grains probably become interlocked by the C-S-H phases and do not function as a mere filler. This can be seen as another reason for the enormous compressive strength of ultra-high strength concretes.
Whatever the constituents and the boundary conditions of hydration are, the structure of the hardening and hardened cement paste to a considerable extent consists of pores of a widely varying size [Cze 77]. Grossly assuming these pores to be spherical and neglecting entrained air pores and larger voids due to incomplete compaction, the pore radius ranges from several micrometers to less than a nanometer. Generally, the terms ‘micropores’ (below 2 nm), ‘mesopores’ (2 nm to 50 nm) and ‘macropores’ (above 50 nm) may be used for the subdivi-sion of pores [Loc 00].
Often pores are classified as gel pores and capillary pores. However, the range of pore radii these terms were attributed to greatly varies. In literature, the radius that separates the smaller gel pores from the larger capillary pores ranges from two nanometer (2 nm in [Koe 97], 2.5 nm in [Iga 05]) to some tens of nanometer (30 nm in [Set 94], 50 nm in [Gru 03]), making this distinction somewhat arbitrary.
Nevertheless this classification is important because it is based on the origin and the effects of pores of different size. If there is more water than can be bound by hydration, i.e. beginning from water-cement ratios of approximately 0.40, the capillary porosity disproportionally in-creases with increasing water-cement ratio. Contrary to that, the gel porosity is largely inde-pendent of the water-cement ratio. Gel pores primarily develop within the C-S-H gel and be-tween the various hydrates. The essential reason for gel porosity is the fact that the products of hydration have a higher density than the reactants. Thus, the space that is freed in the course of hydration is gradually replaced by pores initially filled with water [Pow 46b], [Loc 00].
Drying of hardened cement paste and of concrete begins from the larger capillary pores. Gen-erally, capillary forces that act in a moist capillary network transport water to less saturated areas. When a pore is partly emptied due to capillary forces, the residual water forms a menis-cus which separates the saturated fluid phase from the unsaturated gaseous phase. Menisci can develop in a range of relative humidity of approximately 40 to 90 % [Loc 00]. The relative humidity at which a water-filled pore starts to dry out depends on its size. At pore radii of 1 µm, 0.1 µm, 10 nm and 1 nm the respective thresholds of relative humidity are 99.9 %, 99.0 %, 89.9 % and 34.8 % [Cze 77]. These values can be calculated by means of the Kelvin equation which relates the pore radius to relative humidity and temperature (Equation 2–1, as per [Lur 03a]). Accordingly, a circular pore with a radius of 1 nm at constant temperature will not be emptied by capillary forces as long as the relative humidity does not fall below 35 %. No capillary forces act in completely dry pores.

9
)cos2
exp(TRr
MRH K
Equation 2–1
γ: surface tension, M: molar weight of fluid, θ: contact angle between fluid and solid, ρ: den-sity of fluid, r: radius of meniscus, R: ideal gas constant, T: absolute temperature
It is understood that the Kelvin equation also accounts for the surface tension of the liquid, be-ing the source of capillary forces. Notably, pores in cement paste are not filled with pure wa-ter but with pore solution which has a surface tension different from water. The effect of shrinkage-reducing admixtures to a considerable extent can be attributed to the reduction of the surface tension of the pore solution [Raj 08]. Also dissolution processes influence the rela-tive humidity. A respective term which accounts for the drop of relative humidity due to the dissolution of salts was added to the Kelvin equation by Lura et al. [Lur 03a].
The capillary pressure that acts on a meniscus can be calculated from surface tension and pore radius by means of the Young-Laplace equation (Equation 2–2). The pressure increases with decreasing pore radius. The capillary depression within the pores compresses the solid part of the hardened cement paste structure and thereby leads to shrinkage. Hence, shrinkage also de-pends on the stiffness and viscoelasticity of the walls of the pores.
rcap
2 Equation 2–2
Pores smaller than the ones that at given boundary conditions can be emptied by capillary forces may experience a decrease of relative humidity by way of diffusion, which is a very slow process, ending only when external and internal relative humidity have leveled out. The forces that develop due to changing relative humidity in the area of such extremely small pores are difficult to investigate. The principal forces under discussion are those due to changes of the surface energy and the so called disjoining pressure [Mue 09], [Lur 03a]. The surface energy within the C-S-H phases is highest in the dry state and decreases when water is adsorbed. Thus, adsorption of water would lead to swelling, and desorption to shrinkage [Lur 03a], [Cze 77]. This effect may be limited though to ranges of comparably low relative hu-midity as the surface energy is notably changed only by the first three layers of water mole-cules [Lur 03a]. The disjoining pressure is assumed to act in areas in which no adsorption is possible, i.e. where the solid surfaces are so close to each other that water molecules cannot go in between [Fer 87], [Lur 03a]. It is assumed to be the result of attractive Van-der-Waals forces and two repulsive forces (double layer repulsion, structural force) [Der 74], [Fer 87]. It may be effective also at high relative humidity.
Ultra-high strength concrete, compared to concrete of normal strength, has extremely few capillary pores. Drying shrinkage is dominated by diffusion and proceeds at very low rates. However, a significant internal desiccation takes place and may reduce the relative humidity to less than 85 %. Although the micro-mechanisms that lead to autogenous shrinkage are sup-posed to be the same that cause drying shrinkage [Mue 09], [Wit 09], the autogenous shrink-age originates from and is part of the chemical shrinkage [Dav 40], [Taz 95], [Taz 99]. As mentioned above, the chemical shrinkage is caused by the fact that reaction products of hydra-tion have a smaller absolute (non-porous) volume than anhydrous cement and water [Pow

10
46b], [Loc 00]. The capillary forces which are induced by chemical shrinkage in the initial viscous state lead to a macroscopic contraction that proceeds without major resistance of the cement paste. When the material starts to behave as a solid body, chemical shrinkage leads to the formation of an increasingly stiff pore structure which counteracts the material’s tendency to contract [JCI 96]. In the further course of hydration, pore water continues to be incorpo-rated into hydration products. In case there is considerably less water available than required for the complete hydration of all reactive constituents, the relative humidity in the pore system starts to decrease. This internal drying of the solidifying cement paste, commonly called self-desiccation, generates the aforementioned forces and leads to a virtually uniform volume re-duction. This part of the chemical shrinkage is called ‘autogenous shrinkage’ [Taz 99]. An-other term frequently used is ‘self-desiccation shrinkage’ [Jen 01a].
2.2 Definitions and research approaches
Most aspects of autogenous shrinkage have been known for more than fifty years and are largely undisputed, yet there still is no exact univocal definition. Furthermore, some termino-logical discrepancies persist. For instance, autogenous shrinkage in some publications of French origin apparently comprises the complete chemical shrinkage [Bar 99], [Bar 05], [Mou 06b], [Bou 08a]. A comprehensive overview of terminology is given in [Jen 01a].
The autogenous shrinkage of most concretes of normal strength is negligible as no self-desiccation takes place. The interest in autogenous shrinkage significantly rose in the 1990’s when high strength concrete with relatively low water-cement ratios came into wider use. De-spite appropriate curing, early age cracks were observed which could be explained only by re-strained autogenous shrinkage [Bui 80], [Zie 82], [Taz 92], [Sel 95]. Subsequent to several years of research the Japan Concrete Institute (JCI) suggested the following definition [JCI 96], published in English in 1999 [Taz 99]: “Autogenous shrinkage is the macroscopic vol-ume reduction of cementitious materials when cement hydrates after initial setting. Autoge-nous shrinkage does not include volume change due to loss or ingress of substances, tempera-ture variation, application of an external force and restraint.”
The definition explicitly excludes thermal deformations and deformations due to loss of wa-ter. The initial setting is defined as the beginning of autogenous shrinkage (cf. Figure 2–1). Hence, the definition is of the ‘time-zero’-type: the onset of autogenous shrinkage is not di-rectly linked to self-desiccation or underlying micro-mechanisms but to a somehow related point in time that is determined experimentally. This point generally is called ‘time-zero’ and the subsequent shrinkage is termed ‘autogenous’ (cf. 2.3.2). According to the JCI’s definition, time-zero is to be determined by needle penetration.
The authors’ motivation is explained as follows: “Since autogenous shrinkage is generally used for prediction of cracking, the strain generated in a period when cementitious material is fresh is excluded. Therefore, the time of initial setting of cement is specified as the start point of autogenous shrinkage measurement.” This emphasizes the functional character of the definition: it is assumed that strains from the moment of initial setting are relevant for the prediction of cracking.

11
Init
ial s
ettin
g
Fina
l set
ting
Chemical shrinkage
Autogenous shrinkage
Void due to hydration
Age
Vol
ume
redu
ctio
n
Chemical shrinkage at initial setting
Figure 2–1 Autogenous shrinkage as defined by the Japan Concrete Institute (from [JCI 96])
A second definition, suggested by Jensen and Hansen a few years later, differentiates between “autogenous deformation” and “self-desiccation shrinkage” [Jen 01a]. “Autogenous deforma-tion” is defined as the “bulk deformation of a closed, isothermal, cementitious material not subjected to external forces”, whereas “self-desiccation shrinkage” is the “autogenous de-formation of a set cementitious material system caused by chemical shrinkage”.
This differentiation accounts for the underlying mechanisms, in particular for the fact that the present knowledge in this regard is incomplete. The meaning of the term ‘autogenous’ is ex-tended to all isothermal bulk deformations that occur without external influence, whatever the mechanisms are. The term ‘deformation’ comprises negative as well as positive strains. This part of the definition is sufficiently general not to be compromised by future findings on the mechanisms. On the other hand the fraction of autogenous deformation that is known to be caused by self-desiccation is precisely named as such. “Self-desiccation shrinkage” is sup-posed to occur in a “set system”. Rather than to define a starting point, this recalls the solidify-ing pore structure as a precondition to self-desiccation.
Notably, neither definition fully accounts for the influence of temperature on autogenous shrinkage. Autogenous deformations as defined by Jensen and Hansen are deformations of “isothermal material”. A strict interpretation would have the consequence that autogenous de-formations only occur at constant temperatures, which, of course, is not the case. The JCI’s definition excludes thermal deformations, however, it is not specified at which temperature the autogenous shrinkage is to be measured. The vague consideration of temperature partly can be attributed to the methodological problems associated with measuring its effects (2.3.3, 2.5.2).
The definition suggested by the JCI is more pragmatic and committed to the practical problem of cracking, whereas the definition proposed by Jensen and Hansen is more fundamental be-cause it renounces to simplifying assumptions. The JCI defines the initial setting as the begin-ning of autogenous shrinkage. Jensen and Hansen do not clearly specify a starting point, even though such a point is required for evaluation. Thus the outlined definitions reflect two differ-ent research approaches: a phenomenological and a micro-analytical approach. Both are briefly described in the next paragraphs.

12
Phenomenological research mainly focuses on the measurement of the autogenous shrinkage strain and the consequences it brings about if restrained, i.e. stresses and cracking (cf. Figure
2–2). In view of the numerous difficulties associated with such measurements, this is a com-prehensive and challenging task (2.3, 5). Sometimes relative humidity [Per 97], [Lou 99], [Per 01], [Jia 05] or capillary pressure [Aly 09], [Suz 09], [Rad 98], [Hol 05], [Liu 06], [Mia 07] are examined as well and related to the measured shrinkage strains. Provided that measure-ment methods are precise and efficient, phenomenological parameter studies can contribute to the clarification of essential relations, for instance the influence of single concrete constituents on autogenous shrinkage. However, phenomenological research usually cannot provide thor-ough explanations of observed behavior.
Cement paste structure, pore system
Physico-chemical
explanation and
modelling
Pure cement paste
Nano
PredictionCement paste incl. admixturesStructure and micro-mechanisms, e.g.
Hydration products
Porosity and transport processes
Disjoining pressure
Tension of capillary water
Dissolution and precipitation
Micro
Micro-
analytical
ValidationConcrete / mortar specimen
Relative humidity (Self-desiccation)
Capillary pressure
Meso
Experimental
determination
Concrete element / structure
Autogenous shrinkage strain
Macro
Pheno-
menological
SignificanceInvestigated ObjectInvestigated PropertyScaleApproach
Figure 2–2 Autogenous shrinkage: schematic comparison of phenomenological and micro-analytical approach
Contrary to that, micro-analytical research is dedicated to the structure and the micro-mechanisms and forces that cause autogenous shrinkage, including their quantitative contribu-tion. Apart from theoretical considerations, experiments typically include various aspects of hydration, the state of water, the pore system, chemical shrinkage and other properties, often observable only at nano- or micro-scale. To reduce the complexity, micro-mechanical models usually are formulated not for concrete but for more simple combinations of constituents, for instance pure cement paste or, more rarely, for cement paste with silica fume and superplasti-cizer. As a consequence, the autogenous shrinkage strain typically is measured on cement paste for validating a model. Often good agreement of predicted and measured values is achieved, usually limited though to isothermal conditions [Lur 03a].
Jensen and Hansen explicitly criticized that most research on autogenous shrinkage is phe-nomenological. They called for more physical, chemical and thermodynamic studies aiming at a more complete understanding of underlying mechanisms and the prediction of autogenous shrinkage [Jen 01a]. Lura, Jensen and van Breugel in 2003 reviewed the knowledge about autogenous shrinkage mechanisms [Lur 03a]. They described the close correlation of autoge-

13
nous shrinkage and internal relative humidity, found in a number of studies [Lou 99], [Per 02], [Naw 04], [Jia 05]. The underlying micro-mechanisms, however, were referred to as un-known. Three potential mechanisms were mentioned: changes in the surface tension of solid gel particles, disjoining pressure and surface tension in capillary water (cf. 2.1). Müller listed the same micro-mechanisms, however, he referred to drying and autogenous shrinkage [Mue 09]. Obviously the micro mechanisms of drying and autogenous shrinkage can be considered the same [Wit 09], [Taz 95]. Wittmann recently pointed out that general quantitative solutions based on a micro-analytical approach are not at hand, although drying shrinkage is being re-searched since more than 50 years [Wit 09].
To predict the micro-mechanisms’ quantitative contribution to autogenous shrinkage from one of the current models, several hydration-related parameters are required: in the most simple case the pore volume, the pore size distribution, the state of water in the pores and the stiff-ness of the cement paste [Lur 03a], [Lur 03c]. Such parameters are difficult to investigate and change rapidly at early age. An efficient solution would be to model these parameters as well. However, this appears to be very difficult. Jennings states [Jen 08]: “Despite the fact that pre-cise characterization of the pore system in cement paste has been the subject of research for more than half a century, we still do not have […] a full geometric description of the pore system. Therefore, models […] are still incomplete, and none can adequately predict per-formance over a wide range of mineral and chemical formulations.” Or, as Bažant put it, “A fully rational prediction of concrete creep and shrinkage properties from its composition is a formidable problem, not yet solved satisfactorily” [Baz 01].
An additional obstacle to the practical application of micro-analytical models is the fact that results of cement paste investigations for several reasons cannot be directly transferred to concrete [Bjø 04], [Lur 03c]. For instance, a cement paste may bleed, while a concrete made from that cement paste may not; the reabsorption of bleeding water alters the autogenous shrinkage. Alternatively the water-cement ratio of the cement paste may be modified to avoid bleeding. However, then a direct comparison would be hampered by the different pore sys-tems. Furthermore, concrete usually contains aggregates which restrain deformations, absorb and release water and modify the mechanical properties [Bjø 04]. These influences can cause a different development of relevant micro-mechanical parameters in hardening cement paste and concrete, respectively, limiting the compatibility of results.
Then again, if concrete is investigated instead of cement paste, apart from the major complex-ity there is another problem: in some cases the influence of certain parameters simply cannot be examined independently. For instance, ultra-high strength concrete typically contains silica fume. In the fresh mix it fills the space in between the cement particles and thereby allows for a reduction of the water content. If the silica fume is left out, the gaps need to be filled largely by water. This can result in the complete loss of workability. Hence, it may be impossible to investigate the influence of cement and silica fume independently. Likewise, superplasticizers in most cases are indispensable for producing ultra-high strength concrete. As they typically modify hydration, results obtained from tests on pure cement paste may not be comparable.
The micro-analytical approach can be considered the key to a more profound understanding of autogenous shrinkage and shrinkage in general. It may even turn restraint stress and cracking into phenomena that can be calculated from the properties of the concrete constituents and the prevailing boundary conditions. However, this will require large resources and take a consid-

14
erable amount of time. Presently there is no efficient way to precisely predict the autogenous shrinkage for a wide range of concrete compositions and boundary conditions, let alone the stresses and the cracks it may cause. One goal of this study was to improve the assessment of the autogenous shrinkage cracking propensity in order to allow for the efficient investigation and short-term elimination of a major obstacle to the broader application of ultra-high strength concrete. Therefore the phenomenological approach was chosen, and, as a consequence of the numerous challenges, micro-analytical aspects had to be disregarded.
2.3 Metrological issues
2.3.1 Multitude of test methods
Since the autogenous shrinkage of high and ultra-high strength concrete usually begins during or shortly after setting, the measurement period necessarily encompasses the transition from viscous suspension to porous solid. Hence, paste, mortar or concrete need to be placed in some kind of container, at least at the beginning of the measurement. A multitude of different setups and test methods has been developed for this purpose, e.g. [Jen 95a] (2.4), [Taz 99] (Figure 2–3), [Gag 99], [Lou 00], [Ham 03], [Naw 04], [Bou 06], [San 06], [Cra 06], [Ong 06]. At the 2006 Conference on Volume Changes of Hardening Concrete held in Denmark, 20 contributions provided results of autogenous shrinkage [RIL 06]. These results were obtained with 15 different test setups; either the measuring technique was different or there were sig-nificant differences in the specimen geometry [Epp 08b]. Most setups can be supposed to be in use only in a small number of institutions. The precision of test methods in many cases is unclear.
400 mm 100 mm
Polyester film
PTFE sheet
SpecimenGauge plugMold
Polysterene sheet
Polyester film
Figure 2–3 Setup for the measurement of autogenous shrinkage of concrete (from [Taz 99])
The large number of test methods represents a serious problem since the measurement of the autogenous shrinkage is difficult, and results are partly inconsistent. A recent round robin test with different test methods and a relatively simple mortar revealed a large scatter (Figure 2–4)
[Bjø 06]. According to the statistical evaluation of these tests, at least eight individual meas-urements of the autogenous shrinkage would have been required to achieve a reliable result [Kra 06]. The results of another round robin test with rather unfavorable outcome are pre-sented in chapter 6.2 dealing with the suitability of temperature-stress testing machines [IPACS].
15
-300
-250
-200
-150
-100
-50
0
50
100
0 4 8 12 16 20 24 28 32 36 40 44 48
Time [h]
Mea
sure
d le
ngth
cha
nge
[10-
6]
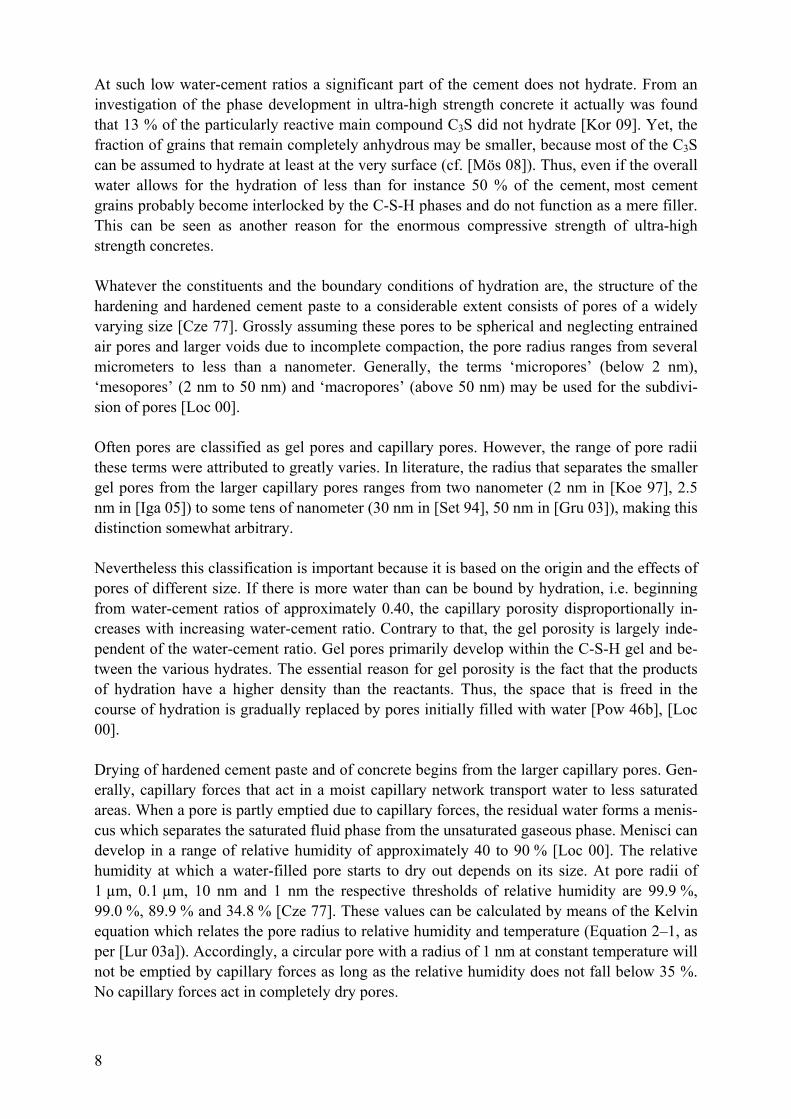
Figure 2–4 Result of a round robin test (RILEM Technical Committee 195-DTD), 30 tests of the free autoge-nous shrinkage of a mortar, constant set temperature (20 °C), 10 institutions involved [Bjø 06]
Widely differing values also were reported for the autogenous shrinkage of ultra-high strength concretes. As the concretes had similar compositions, the discrepancies indicate a significant influence of the test method employed in the respective institution (Figure 2–5) [Epp 08a].
0.0
0.2
0.4
0.6
0.8
1.0
1.2
1.4
1.6
1.8
0 7 14 21 28
Age from time-zero [d]
Aut
ogen
ous
Shr
inka
ge [
mm
/m]
fc28=156 MPa, CEM I 42,5 R, w/c=0.268, s/c=0.20, max. grain size 0.8 mm
fc28=155 MPa, CEM I 52,5 R, w/c=0.20, s/c=0.325, max. grain size: sand
fc28=140 MPa, CEM I 52,5, w/c=0.276, s/c=0.20, 77 kg/m³ steel fibers, max. grain size: 16 mm
fc28=171 MPa, CEM I 42,5 R-HS, w/c=0.27, s/c=0.30
Figure 2–5 Autogenous shrinkage under quasi-isothermal conditions of similarly composed ultra-high strength concretes, measured with different setups; data (in the order of magnitude of autogenous shrinkage) from [Sch 02] (highest values), [Bjø 03], [Sta 04] and [Ma 03] (lowest values)
Considering the multitude of test methods on the one hand and the observed inconsistencies on the other, the comparability of a large part of the results obtained in the past is in doubt. It was argued that research should focus on reliability of measurement methods before further conclusions are drawn [Bjø 04].

16
2.3.2 Time-zero
Chemical shrinkage virtually begins with the contact of cement and water and proceeds as long as hydration continues. Autogenous shrinkage is part of the chemical shrinkage and is caused by the decrease of relative humidity in a pore structure that has become sufficiently stiff to partly withstand the internal forces (2.2). Solidification, the decrease of relative hu-midity as well as the concurrent change of capillary pressure start very slowly, and it is practi-cally impossible to determine the precise onset of these processes. Therefore, many authors attempted to find other criteria that are suitable to define and determine a threshold as a start-ing point of the autogenous shrinkage. This point in time commonly is called time-zero (cf. 2.2). Earlier and later time-zero result in higher and lower autogenous shrinkage, respectively.
The application of a time-zero criterion in most cases is indispensable for the evaluation of autogenous shrinkage measurements. From a practical point of view the suitability of a crite-rion mainly depends on its universal ability to delimit the crack-relevant shrinkage as accu-rately as possible (2.2). However, it would require extremely laborious and sophisticated ex-periments to examine to which degree a criterion actually fulfills this requirement. No such investigation is known. Alternatively it can be investigated when deformations start to gener-ate restraint stress and how closely the time-zero determined by a given criterion coincides with this onset of stress. However, the development of stresses is a gradual process, too, and its onset depends so much on the sensitivity of the test method, that reliable and precise re-sults would be very difficult to obtain. In conclusion, it is hardly feasible to thoroughly exam-ine the suitability of a time-zero criterion as to the abovementioned requirement.
Partly as a consequence of these difficulties a second requirement gains importance: the ap-plication of a criterion should be as simple as possible. The most simple approach is to rely on tests of the solidification process. Two of the most common criteria for determining a thresh-old within the transition from viscous fluid to porous solid are the initial and final setting time, determined by Vicat needle penetration tests. As mentioned above, the definition of autogenous shrinkage given by the JCI stipulates the initial setting as time-zero (2.2), other authors recommended or used the final setting time, e.g. [Ham 06], [San 06]. The evaluation of shrinkage data from initial setting largely avoids skipping any of the crack-relevant shrink-age. However, the autogenous shrinkage may be considerably overestimated. To apply the fi-nal setting time may have the opposite consequence, i.e. an underestimation of autogenous shrinkage.
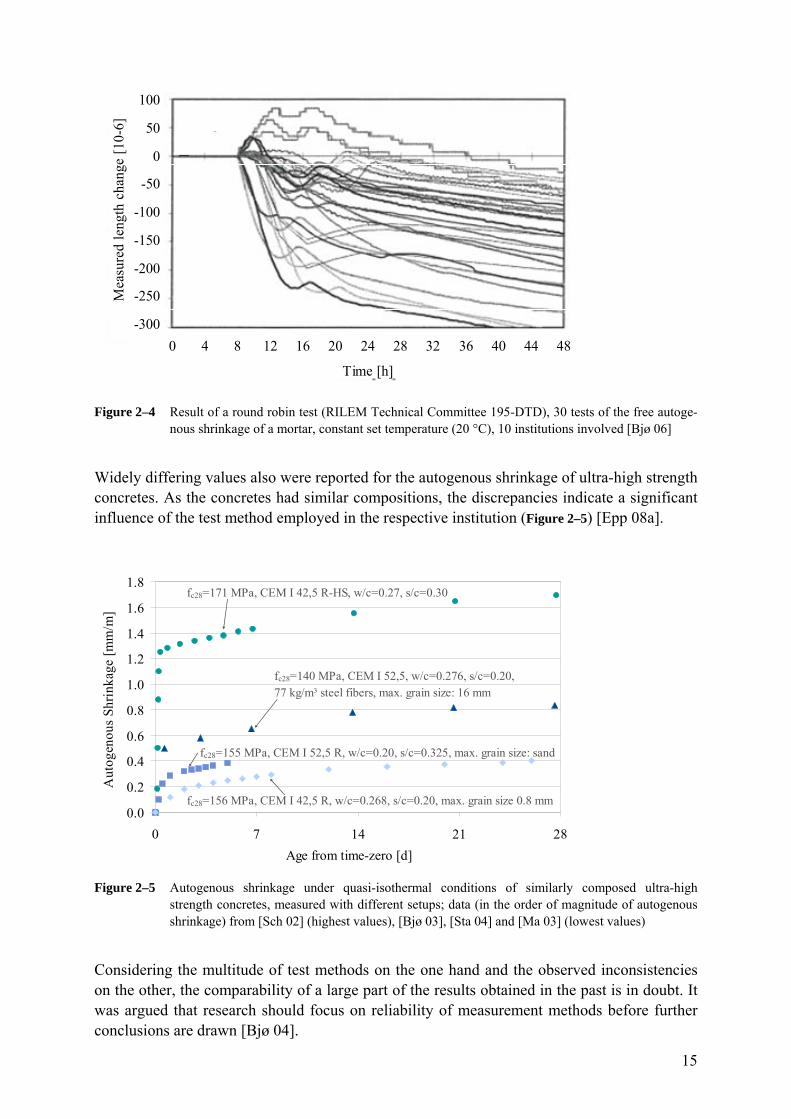
The significance of time-zero and the impact that the use of different criteria can have on re-sults is illustrated in Figure 2–6. The dashed and the solid curve of autogenous shrinkage are calculated from initial and final setting, respectively. The figure is based on own tests with an ultra-high strength concrete. At the age of 18 h the autogenous shrinkage differs by approxi-mately 350 µm/m, corresponding to more than 50 % of the shrinkage strain from final setting. Hence, it depends essentially on the choice of the time-zero criterion whether results of differ-ent investigations can be reasonably compared or not.
17
0.0
0.2
0.4
0.6
0.8
1.0
1.2
6 8 10 12 14 16 18
Age [h]
Aut
ogen
ous
Shri
nkag
e [m
m/m
] time-zero: initial setting
time-zero: final setting
Figure 2–6 Autogenous shrinkage of an ultra-high strength concrete: influence of time-zero
Notably, different standards exist for the determination of setting times by needle penetration tests. For instance, the needle diameter according to ASTM C191-08 is approximately 10 % smaller than the one given in EN 196-3 (Table 2–1). Also, the penetration depth for initial set-ting differs considerably. Furthermore, it is important to consider the precision of needle penetration tests. According to ASTM C191 the repeatability for initial and final setting is 34 min and 56 min, respectively. This data is in line with experience gathered at German Ce-ment Works Association. The respective values for the reproducibility are 45 min and 122 min. In other words: results for final setting when determined in different laboratories may differ by 2 h and still would have to be considered precise. Moreover, the values apply when final setting occurs within the first 312 min. If it occurs much later, as it is the case with some ultra-high strength concretes, precision tends to be worse.
Table 2–1 Vicat needle penetration tests: differences between ASTM C191-08 and EN 196-3
ASTM C 191-08 EN 196-3
Needle diameter 1 mm 1.13 mm
Initial setting1) penetration ≤ 25 mm (sample height: 40 mm)
penetration ≤ 37 mm (sample height: 40 mm)
Climate 23 °C / 95 % RH 20 °C / under water
1) Final setting in both standards: needle does not leave a complete impression in the surface anymore
Another disadvantage of needle penetration tests is the disturbing influence of changing con-sistencies. For the regular control of cement quality by Vicat tests the consistency of the ce-ment paste is adjusted to a standardized value. To achieve this so called normal consistency, the cement’s water demand is determined prior to the preparation of the mix for the penetra-tion test. Yet, if the Vicat test is used to determine time-zero, different viscosities of the inves-tigated pastes or mortars are unavoidable. Adding water to adjust the consistency of course would change the shrinkage behavior and yield inadequate results.

18
Finally, the determination of the final setting time according to the mentioned standards re-quires manual operation. This may represent an obstacle in case the final setting occurs only after many hours, because it may require tests during night times. Alternatively, an apparatus for the automatic determination of initial setting can be employed and the quasi-continuous needle penetration data it provides may be used to extrapolate final setting times [Epp 08b]. Yet, the precision of such a procedure is unknown.
Several other time-zero criteria have been suggested and applied, for example a point of maximum or minimum shrinkage rate [San 06b], [Fon 06], the increase of the rate of heat re-lease after the induction period as well as changes in the electrical conductivity, in the trans-mission of ultrasonic waves and in the acoustic emission activity [Lee 06], [Wei 03], [Lur 09]. An overview of various criteria was given recently [San 09]. No criterion was proven to be more suitable and in particular more precise than penetration tests, yet. Especially those crite-ria that require sophisticated equipment and uncommon know-how may not become widely accepted unless the results for time-zero are more precise and generated largely automatically.
The determination of time-zero becomes a minor problem if parallel tests under restraint con-ditions are carried out. Then the onset of stress development, for instance in restrained ring tests, can be used as time-zero for the evaluation of free shrinkage tests. Any earlier shrinkage would be irrelevant for the further evaluation of stresses, anyway.
2.3.3 Other metrological issues
The multitude of test methods and the uncertain comparability of results led to an intense dis-cussion about the correct measurement and the possible sources of error. In particular, the fact that measurement needs to begin when concrete is still almost fluid can lead to errors. Arti-facts tend to be the larger, the lower the stiffness of the concrete is [Tia 09]. The container it-self may restrain the deformation of the concrete. Friction between the container’s walls and the concrete may influence results. An underestimation of autogenous shrinkage may be caused by mechanically coupled sensors whose functioning depends on the stiffness of the specific concrete the coupling part is embedded in. Alternatively the autogenous shrinkage can be measured without contact between measuring unit and specimen, for instance with a laser [Epp 08b], [Alo 02], a digital image analysis [Ong 06] or eddy current sensors [Bou 08a].
A major problem lies in thermal strains, especially with large specimens. Concrete in practice is subjected to various temperature histories. As temperature is known to influence autoge-nous shrinkage, concrete temperature is an essential parameter that needs to be investigated [Jen 99], [Bjø 04]. On the other hand, temperature changes can be a significant source of error since thermal deformations which superimpose the autogenous shrinkage are difficult to ac-count for [Ham 03], [Bjø 04]. A RILEM committee suggested that a maximum temperature difference of 2 K is acceptable for quasi-isothermal tests [Ham 06]. Cross sections of more than approximately 30 x 30 mm² to 50 x 50 mm² usually require an efficient external cooling system to provide for such a constant and uniform temperature. To account for thermal strains in non-isothermal tests, precise knowledge of the coefficient of thermal expansion as a func-tion of time is required. The coefficient can vary considerably at early and very early age and its accurate determination is very difficult [Cus 06], [Sel 06], [Los 10]. Attempts were made to model its development, in particular for high-strength concrete [Oza 06]. Presently, there is
19
no widely accepted method for measuring the autogenous shrinkage under non-isothermal conditions.
Other metrological aspects frequently discussed are the effects of bleeding, linear vs. volu-metric measurement and vertical vs. horizontal measurement. Bleeding is relevant mainly with cement pastes, as high- and ultra-high strength concretes usually do not bleed [Aït 02]. Reabsorbed bleeding water can lower the measured autogenous shrinkage [Bjø 04]. The con-stant rotation of samples may prevent bleeding effects [Bou 08a].
For geometric reasons volumetric methods should yield a volume decrease three times as high as linear methods. This was not always the case, mostly due to inconsistencies of at least one of the confronted methods [Bar 99], [Ham 03], [Bjø 04], [Lur 05], [San 06], [Lur 07], [Bou 08a]. To avoid artifacts, paraffin oil was recommended instead of water for measuring the volumetric autogenous shrinkage of an immersed sample by the buoyancy method, i.e. by hy-drostatic weighing [Lur 07], [Bou 08a].
In some investigations horizontal and vertical linear measurement led to notable differences, however, the evaluation in all cases appears to have included the chemical shrinkage prior to self-desiccation [Bou 06], [Mou 06b], [Bou 08a]. It was shown that the linear autogenous shrinkage after final setting does not significantly depend on the direction of measurement [Tia 08]. If vertical measurement methods are used, the length of the container should be much greater than its width. Otherwise the horizontal shrinkage component may influence re-sults before and around final setting.
Measurement errors may also result from insufficient sealing, especially at very early age as more water is not yet bound. Loss of moisture inevitably leads to drying shrinkage. A maxi-mum mass loss of 0.01 % with respect to the specimen weight was reported in [Sta 04], corre-sponding to roughly 0.16 % of the contained water. Similar results were obtained in own in-vestigations [Epp 08b]. The accurate measurement of such small weight changes requires a very good balance, especially if the sample is located in comparably heavy measurement set-ups. No general agreement on the allowable moisture loss does exist, yet.
2.4 Corrugated tube method
The corrugated tube method was introduced by Jensen and Hansen in 1995 [Jen 95a] and re-cently standardized by ASTM [ASTM 2]. It is the most established method for measuring the autogenous shrinkage of cement paste and mortar under quasi-isothermal conditions [Epp 08b]. Numerous investigations carried out over a period of more than 15 years have shown its suitability for this purpose [Jen 96], [Jen 99], [San 07], [Mia 09]; own investigations of the method’s precision are described in section 4.4.3.2. The basic setup described in the ASTM standard C1698 consists of the following items: (a) a corrugated tube mold made of plastic with a length of 420 mm and an outer diameter of 29 mm (Figure 2–7); (b) a testing frame (‘di-latometer bench’) on which the filled corrugated mold is placed; (c) a measuring gauge with a minimum resolution of 2.5 µm/m and a measuring range of at least 10 mm.

20
Figure 2–7 Corrugated tube mold, length: 420 mm, outer diameter: 29 mm
The corrugated mold’s stiffness in longitudinal direction is very low. Thus the longitudinal deformation is virtually unrestrained. The recommended maximum grain size is 4.75 mm. The ASTM standard implies quasi-isothermal conditions. Due to the relatively small diameter of the tube, the temperature of a cementitious material inside the tube typically does not increase by more than 2 K. The method presently cannot be used for tests under non-isothermal condi-tions. It would be very difficult to precisely account for the influence of the thermal expansion of the tube since plastics have a much higher coefficient of thermal expansion than cement based materials. Notably, the standard recommends not to use water for controlling the tem-perature of the specimen since the mold may not be completely impermeable to water.
The test procedure is comparably simple. Only the process of filling can be critical. Due to the small inlet diameter of approximately 20 mm it can be difficult to fill the corrugated tubes if paste or mortar are stiff or sticky. Ultra-high strength concretes often are sticky. This can also lead to the inclusion of air bubbles (Figure 2–8). It is noted that larger corrugated tubes do exist as well, however they were not tested as comprehensively as the smaller ones, yet.
Figure 2–8 Incompletely filled corrugated tube
The standardized procedure is intended for discontinuous readings. The first reading is taken at final setting. Before further readings can be taken the tested material needs to become suf-ficiently hard so that the handling of the specimen does not significantly alter its length any-more. The precision of the discontinuous readings can be further improved by the use of a ref-erence bar made of invar, which, together with the aforementioned items, is provided by the manufacturer of the test setup [Germann].

21
Continuous readings require a somewhat different setup. The testing frame should accommo-date at least two or three molds at the same time. An identical number of measuring gauges is required, each of them connected to a data logger. Furthermore, one end of the mold needs to be fixed to the frame; alternatively the deformation can be measured at both ends of the mold.
The fact that the corrugated tube method was standardized by ASTM and adopted by many researchers will eventually lead to more reliable results and improved comparability, even though the time-zero issue (2.3.2) will continue limiting the precision. Other methods for measuring the autogenous shrinkage can be validated against the corrugated tube method (4); given that samples come from the same mix and that temperature does not differ notably, the time-zero issue can be disregarded in such comparative investigations.
2.5 Influencing parameters
2.5.1 Concrete composition
Water-cement and water-binder ratio govern the autogenous shrinkage of hardening cement and concrete. Significant autogenous shrinkage occurs if less water is available than would be required for the complete hydration of all cementitious constituents. This usually is the case below water-cement ratios of roughly 0.40 to 0.45. The autogenous shrinkage of pure cement paste with very low water-cement ratios between 0.15 and 0.3 can reach more than two thou-sandth, whereas the strain measured for ultra-high strength concrete with variable cement paste volume typically is less than one thousandth, cf. e.g. [Lur 03c] and [Epp 09]. As the ab-solute values can depend very much on the determination of time-zero (2.3.2) and since the measurement of the autogenous shrinkage in the past was carried out by numerous partly very different test methods with unknown precision (2.3.1, 2.3.3), here the further focus is not on absolute values but on the influence of the essential parameters.
The autogenous shrinkage increases with decreasing water-cement ratio (or water-binder ra-tio); it begins the earlier the lower this ratio is (Figure 2–9), cf. also [Taz 95], [Naw 04], [Sch 04]. A close correlation of water-cement ratio and autogenous shrinkage strain at the age of 28 days was found for a wide range of water-cement ratios [Bar 06].
Figure 2–9 Autogenous shrinkage of cement pastes with different water-cement ratio [Taz 95]

22
Similar results were obtained for variable water-cement ratios of high and ultra-high strength concrete [Zha 03], [Epp 08a] (Figure 2–10). Notably, to compare the effect of different water-cement ratios on autogenous shrinkage of concrete, the cement content should be varied, not the water content. Otherwise the changing volume fraction of hydrating paste would have to be accounted for [Epp 08a].
w/c = 0.23
w/c = 0.26
w/c = 0.30
-1,2
-1,0
-0,8
-0,6
-0,4
-0,2
0,00 7 14 21 28
Age [d]
Aut
ogen
ous
stra
in [
mm
/m]
w/c = 0.23 w/c = 0.26
w/c = 0.30
-1,2
-1,0
-0,8
-0,6
-0,4
-0,2
0,00 7 14 21 28
Age [d]
Aut
ogen
ous
stra
in [
mm
/m]
Figure 2–10 Autogenous shrinkage of ultra-high strength concretes with different water-cement ratio at con-stant water content; silica fume content: 16.2 % of cement; left: cement A (CEM I 52,5 R, 2.0 % C3A, 14.3 % C4AF), right: cement B (CEM I 52,5 R, 8.4 % C3A, 2.7 % C4AF); fineness of both cements approx. 4700 cm²/g [Epp 08a]
Type and fineness of cement significantly influence the autogenous shrinkage, too. In experi-ments with cement pastes made with different cements, the autogenous shrinkage increased with increasing content of C3A and C4AF [Taz 97], [Taz 97b]. Similar results as to the influ-ence of C3A were found for ultra-high strength concrete [Epp 08a] (Figure 2–10). From ther-modynamic calculations it was concluded that the hydration of C2S is slowed down at low relative humidity. Therefore high proportions of C2S may restrict autogenous shrinkage [Jen 95b]. Higher fineness of cement accelerates hydration and generally increases autogenous shrinkage [Taz 97], [Naw 04], [Ben 01b].
In many investigations the addition of silica fume increased the autogenous shrinkage, and higher proportions of silica fume led to higher autogenous shrinkage over a wide range of dosages [Jen 95c], [Jen 96], [Per 97], [Zha 03], [Epp 08a]. Substitution of Portland cement by ground granulated blast furnace slag tended to result in decreased autogenous shrinkage [Yan 07], [Epp 09]. Yet, opposite results, for instance for ground granulated blast furnace slag with high fineness, were reported as well [Taz 97b], [Jia 05], [Lee 06]. As hydration is slowed down by ground granulated blast furnace slag, autogenous shrinkage in part may be merely postponed. Fly ash and metakaolin reduced the autogenous shrinkage [Naw 04], [Sta 04], [Yan 07]. It was shown that supplementary cementitious materials alter the pore system and thereby influence shrinkage (cf. [Bui 87], [Iga 05], [Med 09] and 2.1).

23
Superplasticizers considerably retarded the hydration and influenced the autogenous shrink-age at early and very early age, whereas the autogenous shrinkage at later age did depend less on type and amount of superplasticizer [Taz 95], [Naw 04], [Epp 08a]. For ultra-high strength concrete with two different superplasticizers Schachinger measured autogenous shrinkage strains of 0.8 and 1.2 mm/m at the age of 1 d [Sch 07]. Air-entrainment by apposite chemical admixtures did not significantly influence autogenous shrinkage [Per 97].
2.5.2 Temperature
Temperature considerably influences the autogenous shrinkage [Lou 00]. However, no gener-ally valid equations were found to quantify this influence, yet. It appears to be rather unsys-tematic (Figure 2–11) [Lur 03b] or at least not linear (Figure 2–12) [Jen 99]. As different tem-perature levels change the onset of autogenous shrinkage (time-zero), its determination is a potential source of errors in such investigations (cf. 2.3.2).
-240
-210
-180
-150
-120
-90
-60
-30
0
30
0 24 48 72 96 120 144
Autogenous deformation [µstrain]
Time [hours]
Mix C 10 °C
Mix C 20 °CMix C 30 °C
Mix C 40 °C
Figure 2–11 Autogenous shrinkage of high-strength concrete, cured at 10 to 40 °C (from [Lur 03b])
-2500
-2000
-1500
-1000
-500
0
0 7 14 21 28
Deformation (microstrain)
Time (d)
15 °C
30 °C
40 °C
20 °C
Figure 2–12 Autogenous deformation from final setting of cement past made of white Portland cement (w/c = 0.30, 20 % silica fume addition), (from [Jen 99])

24
The influence of temperature on the development of mechanical properties of normal strength concrete at early age can be modeled by so called maturity concepts. The maturity concept is based on the correlation of concrete properties and temperature-dependent hydration progress. The degree of hydration usually is given as a function of time and of the rate of cement hydra-tion. The rate of cement hydration is a function of temperature. It is generally assumed that the influence of temperature on the rate of hydration does not depend on the degree of hydra-tion and that it can be expressed by a constant activation energy [Jen 99]. The activation en-ergy is a parameter within the Arrhenius equation which describes the influence of tempera-ture on the rate of a chemical reaction.
It was shown that the conventional maturity concept as applied to compressive strength and other mechanical properties of normal strength concrete is not generally applicable to high-strength concrete [Jen 99], [Zha 05]. One general obstacle is that chemical reactions of fre-quently used supplementary cementitious materials proceed at a rate different from that of pure Portland cement hydration. Thus, no single activation energy may be sufficient to de-scribe maturity [Jen 99], [Zha 05].
Furthermore, Zhang et al. observed that the activation energy depends on the property to be described. In their experiments with high-strength concrete the activation energy also changed with temperature [Zha 05]. A reverse maturity method was suggested according to which the activation energy is determined from different specimens which have achieved the same level of a given property under different curing temperatures [Zha 08].
Jensen and Hansen substantiated that the conventional maturity concept cannot be applied to autogenous shrinkage. The authors argued that the surface tension of water as well as the dis-solution of salts does not only depend on the rate of reaction but also on the temperature range. Both parameters are known to influence self-desiccation (2.1). The authors’ experi-ments confirmed these theoretical considerations [Jen 99].
Several other experimental investigations likewise revealed that the conventional maturity concept cannot be applied to autogenous shrinkage [Bjø 00], [Lur 03b], [Bar 04], [Per 05], [Mou 06], [Mou 06b]. Contrary to that, a good correlation between degree of hydration and autogenous shrinkage was found for a high-strength concrete [Sta 06]. Some affirmative re-sults have also been reported for the case of plain cement paste: The maturity concept was successfully applied within a temperature range of 10 °C to 40 °C [Tur 02]. However, speci-mens were prepared in latex condoms and continuously weighed under water. Latex condoms are not sufficiently impermeable to water [Lur 05].
In another investigation the autogenous shrinkage was divided into two phases. A good corre-lation between maturity equivalent age and autogenous shrinkage of the cement paste was found for the second phase [Ter 08], [Ter 08b]. Elevated curing temperature may accelerate autogenous shrinkage in the beginning and lead to lower autogenous shrinkage at later ages [Kam 07]. The application of maturity concepts is continued, mainly because no better alter-native has been established, yet [Miy 01] [Suz 05], [Yan 07].
25
2.5.3 Specific countermeasures
Several types of chemical admixtures were successfully used to counteract autogenous shrinkage, mainly shrinkage reducing admixtures, water-repellent treated powders and expan-sive admixtures [Taz 97b], [Sub 02], [Ich 05], [Suz 05], [San 07], [Wei 08]. The effect of shrinkage reducing admixtures sometimes was entirely attributed to reduced surface tension of pore water, however, other mechanisms may be involved as well [San 10], [Sch 08].
Furthermore, internal curing was found to be an effective method for mitigating self-desiccation and autogenous shrinkage. Internal curing comprises all measures which provide a reserve of water which is released when mixing water is gradually consumed by hydration. Different materials with the ability to store significant amounts of water have proven effective in this regard, mainly superabsorbent polymers [Jen 01b], [Jen 02], [Mec 06], [Mec 08] and light-weight aggregates [Ben 01a], [Zhu 02], [Cus 05], [Hen 09], furthermore recycled mate-rials like porous ceramic waste aggregates [Suz 09]; cf. also [Ben 08a]. In 2006 a complete symposium was dedicated to the reduction of autogenous shrinkage by internal curing [RIL 06], followed by a conference on the use of superabsorbent polymers in 2010 [RIL 10].
2.6 Summary and conclusions with respect to the own work
Autogenous shrinkage is a consequence of hydration and consequently considered part of the chemical shrinkage. Self-desiccation occurs in concretes with very low water-cement ratio, especially in ultra-high strength concrete, leading to a uniform macroscopic volume decrease. While it is clear that a certain solidification of the pore structure is a precondition to that proc-ess, the precise onset of the autogenous shrinkage is difficult to determine. The most common criteria for defining such an onset are initial and final setting, leading to different results though. From a practical point of view it is essential to obtain the stress-relevant shrinkage. Parallel stress tests therefore are helpful in finding the required threshold, commonly called ‘time-zero’. This practice was chosen for this study.
Micro-analytical models that would allow for predicting the autogenous shrinkage from the properties of the constituents and the concrete temperature do not exist, yet. Hydration in gen-eral and the development of the pore structure in particular are complex processes whose in-fluence on autogenous shrinkage is only partly understood. Especially the influence of tem-perature has not been clarified, yet. Conventional maturity concepts do not seem to apply. Moreover, autogenous shrinkage, even if not externally restrained, depends on the viscoelastic behavior of the hardening pore structure being particularly difficult to examine.
In the framework of a more pragmatic phenomenological approach aiming at the assessment of the autogenous shrinkage cracking propensity, the free autogenous shrinkage is primarily an auxiliary quantity, its precise measurement being the most important issue. The autogenous shrinkage of very fluid pastes and mortars can be measured by means of the corrugated tube method. However, sticky or stiff mixes are difficult to fill into the tubes, and the method is limited to isothermal conditions. An alternative test method without these limitations would signify a substantial methodological improvement. However, a thorough validation would be required in order not to just add another test method to the multitude of existing methods largely generating hardly comparable data.

26
Several measures for reducing the autogenous shrinkage have been suggested, most impor-tantly internal curing, shrinkage-reducing admixtures and a modification of the binder. It is one of the advantages of the chosen phenomenological approach that their effect on the crack-ing propensity can be directly investigated. Furthermore, such measures can provide for a wide range of results, potentially revealing whether the employed test methods are generally suitable or not. Therefore it was decided to also consider concrete compositions with superab-sorbent polymers, with a shrinkage reducing-admixture and with a large amount of blast fur-nace slag.
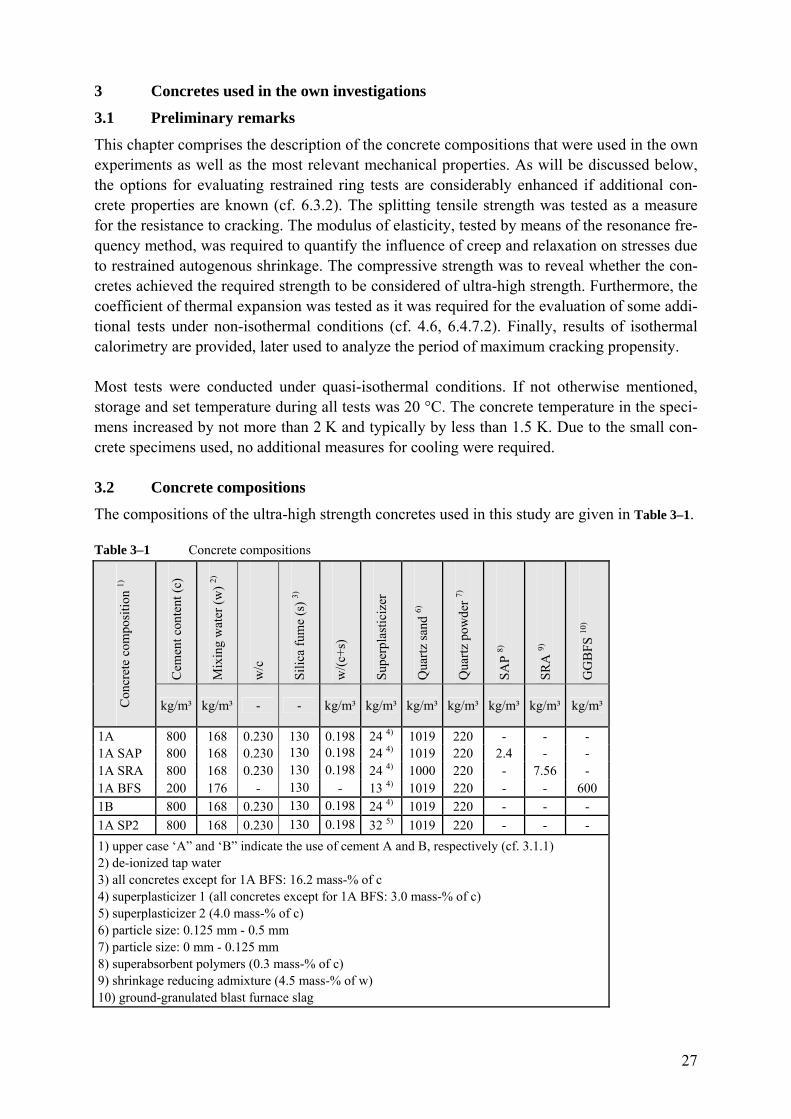
27
3 Concretes used in the own investigations
3.1 Preliminary remarks
This chapter comprises the description of the concrete compositions that were used in the own experiments as well as the most relevant mechanical properties. As will be discussed below, the options for evaluating restrained ring tests are considerably enhanced if additional con-crete properties are known (cf. 6.3.2). The splitting tensile strength was tested as a measure for the resistance to cracking. The modulus of elasticity, tested by means of the resonance fre-quency method, was required to quantify the influence of creep and relaxation on stresses due to restrained autogenous shrinkage. The compressive strength was to reveal whether the con-cretes achieved the required strength to be considered of ultra-high strength. Furthermore, the coefficient of thermal expansion was tested as it was required for the evaluation of some addi-tional tests under non-isothermal conditions (cf. 4.6, 6.4.7.2). Finally, results of isothermal calorimetry are provided, later used to analyze the period of maximum cracking propensity.
Most tests were conducted under quasi-isothermal conditions. If not otherwise mentioned, storage and set temperature during all tests was 20 °C. The concrete temperature in the speci-mens increased by not more than 2 K and typically by less than 1.5 K. Due to the small con-crete specimens used, no additional measures for cooling were required.
3.2 Concrete compositions
The compositions of the ultra-high strength concretes used in this study are given in Table 3–1.
Table 3–1 Concrete compositions
Cem
ent c
onte
nt (
c)
Mix
ing
wat
er (
w)
2)
w/c
Sil
ica
fum
e (s
) 3)
w/(
c+s)
Sup
erpl
asti
cize
r
Qua
rtz
sand
6)
Qua
rtz
pow
der
7)
SA
P 8)
SR
A 9)
GG
BF
S 10
)
Con
cret
e co
mpo
sitio
n 1)
kg/m³ kg/m³ - - kg/m³ kg/m³ kg/m³ kg/m³ kg/m³ kg/m³ kg/m³
1A 800 168 0.230 130 0.198 24 4) 1019 220 - - - 1A SAP 800 168 0.230 130 0.198 24 4) 1019 220 2.4 - - 1A SRA 800 168 0.230 130 0.198 24 4) 1000 220 - 7.56 - 1A BFS 200 176 - 130 - 13 4) 1019 220 - - 600 1B 800 168 0.230 130 0.198 24 4) 1019 220 - - -
1A SP2 800 168 0.230 130 0.198 32 5) 1019 220 - - -
1) upper case ‘A” and ‘B” indicate the use of cement A and B, respectively (cf. 3.1.1) 2) de-ionized tap water 3) all concretes except for 1A BFS: 16.2 mass-% of c 4) superplasticizer 1 (all concretes except for 1A BFS: 3.0 mass-% of c) 5) superplasticizer 2 (4.0 mass-% of c) 6) particle size: 0.125 mm - 0.5 mm 7) particle size: 0 mm - 0.125 mm 8) superabsorbent polymers (0.3 mass-% of c) 9) shrinkage reducing admixture (4.5 mass-% of w) 10) ground-granulated blast furnace slag
28
Concretes had a maximum grain size of 0.5 mm (quartz aggregate) and did not contain any fibers. Fibers would have complicated the investigation of basic methodological issues. Lar-ger aggregates would have necessitated larger specimens, thereby leading to more notable thermal effects and increasing the general test effort. Different measures for influencing the autogenous shrinkage were taken to provide for a wide range of shrinkage results. This was supposed to facilitate the clarification of methodological questions. Most investigations in-volved concrete 1A (reference), concrete 1A SAP (with superabsorbent polymers), concrete 1A SRA (with shrinkage reducing admixture) and concrete 1 BFS (with a high proportion of ground granulated blast furnace slag). Concretes 1A and 1B differed only in the cement that was used (cements A and B). Concrete 1A SP2 contained an alternative superplasticizer. All concretes contained the same amount of (de-ionized) water. The water content of the super-plasticizer was accounted for in the calculation of the mixing water. The water-cement ratio of all concretes except for concrete 1A BFS was 0.23. The content of silica fume was 16.25 % with respect to the cement content, again with the exception of concrete 1A BFS. As was out-lined above, hydration under these conditions remains incomplete. The theoretical maximum degree of hydration of reference concrete 1A was approximately 0.52 (calculated according to [Mil 66], silica fume considered as cement).
3.3 Constituents
3.3.1 Cement
Two Portland cements were used in the own experiments, both originating from German ce-ment works and conforming with the European standard EN 197-1 (Cement – Part 1: Compo-sition, specifications and conformity criteria for common cements). They will be referred to as cement ‘A” and ‘B”. Cement A was a CEM I 52,5 R-HS/NA. The abbreviation ‘NA” is speci-fied in the German standard DIN 1164-10 (Special cement - Part 10: Composition, require-ments and conformity evaluation for special common cement) and stands for a sodium oxide equivalent below 0.6 %. Cement B was a CEM I 52,5 R. It also went below the mentioned al-kali limit, however was not specified accordingly. Cement A and B, being similar in many re-spects, notably differed in the content of aluminate phases. The C3A content of cement A and B was approximately 2.0 % and 8.0 %, respectively; in turn, the content of C4AF was higher with cement A. The water demand of cement B was higher than that of cement A. The spe-cific Blaine surface of both cements was approximately 4.700 cm²/g. The cements’ chemical composition as well as basic granulometric and physical parameters can be found in the An-nex (Table 9–1). The differences among the individual batches of each cement were within common limits. If not indicated otherwise, comparisons and conclusions presented herein are based on test series throughout which the same batch of cement was used.
3.3.2 Ground-granulated blast furnace slag
One type of ground-granulated blast furnace slag was used. It conformed with the European standard 15167 (Ground granulated blast furnace slag for use in concrete, mortar and grout). Its chemical composition was tested, results are given in the Annex (Table 9–1).
3.3.3 Silica fume
One type of silica fume powder was used, conforming with the European standard EN 13263 (Silica fume for concrete). It had a specific BET surface of approx. 20 m²/g and a content of amorphous silicon dioxide of approx. 98 % (data provided by the manufacturer).

29
3.3.4 Admixtures
Two superplasticizers, one shrinkage reducing admixture and one type of superabsorbent polymers were used. Both superplasticizers were polycarboxylate ether based and had a solids content of approximately 35.0 mass-%. The shrinkage reducing substance in the shrinkage re-ducing admixture was dipropylene glycol tertiary butyl ether. The superabsorbent polymers were of the cross-linked poly-acrylic acid type and more than 95 % of the particles were smaller than 63 µm. This information was provided by the manufacturers. In own experiments with the superabsorbent polymers a 22fold weight increase after 30 min immersion in syn-thetic pore solution was observed. The solids content of superplasticizer 1 used in most tests was determined to 35.0 mass-%, confirming the data provided by the manufacturer.
3.3.5 Aggregates
Quartz sand and quartz powder were used as aggregates. The nominal particle size of the quartz sand ranged from 0.125 mm to 0.5 mm, whereas the quartz powder contained particles up to a diameter of 0.125 mm. The aggregates were delivered and maintained in a dried state. Their density and coefficient of thermal expansion was 2.65 kg/dm³ and 14·10-6*K-1, respec-tively. The silicon dioxide content was above 99 % (data provided by the manufacturer).
3.4 Mixing
Materials were stored in airtight containers at a temperature of approximately 20 °C. Air tem-perature and relative humidity in the room the concrete was mixed in were 20 °C ± 2 °C and 65 % ± 5 %, respectively. A mortar mixer as per EN 196 with a nominal capacity of five liters and two rotation speeds (140 and 285 rotations/min) was used. The actual maximum concrete volume was approximately 1.5 liters. If more than 1.5 liters of concrete were required, two mixers were used simultaneously. Mixer type and mixing procedure are shown in Figure 3–1.
Figure 3–1 Mortar mixer (left) and mixing procedure (right), (SP: superplasticizer)
Mixing in all cases took six minutes. First the mixing water and one third of the superplasti-cizer were premixed and filled into the mixer bin, followed by cement and, where applicable, other constituents. The partial addition of superplasticizer in preliminary tests was found to increase the workability of the concretes. The residual amount of superplasticizer was added after 2 minutes while mixing was continued. Then quartz sand, quartz powder and silica fume were added through the feeder while mixing proceeded at the lower speed for one minute. The
1 min 1 min 1 min 1 min 1 min 1 min Duration
high high low high high low Speed
aggregates, silica fume 2/3 SP water, 1/3 SP, cement, GGBFS
1A BFS
aggregates, silica fume 2/3 SP water, 1/3 SP, cement, SRA
1A SRA
SAP + 70 gquartz sand
aggregates, silica fume
2/3 SP water, 1/3 SP, cement
1A SAP
aggregates, silica fume 2/3 SP water, 1/3 SP, cement
1A, 1B, 1A SP2
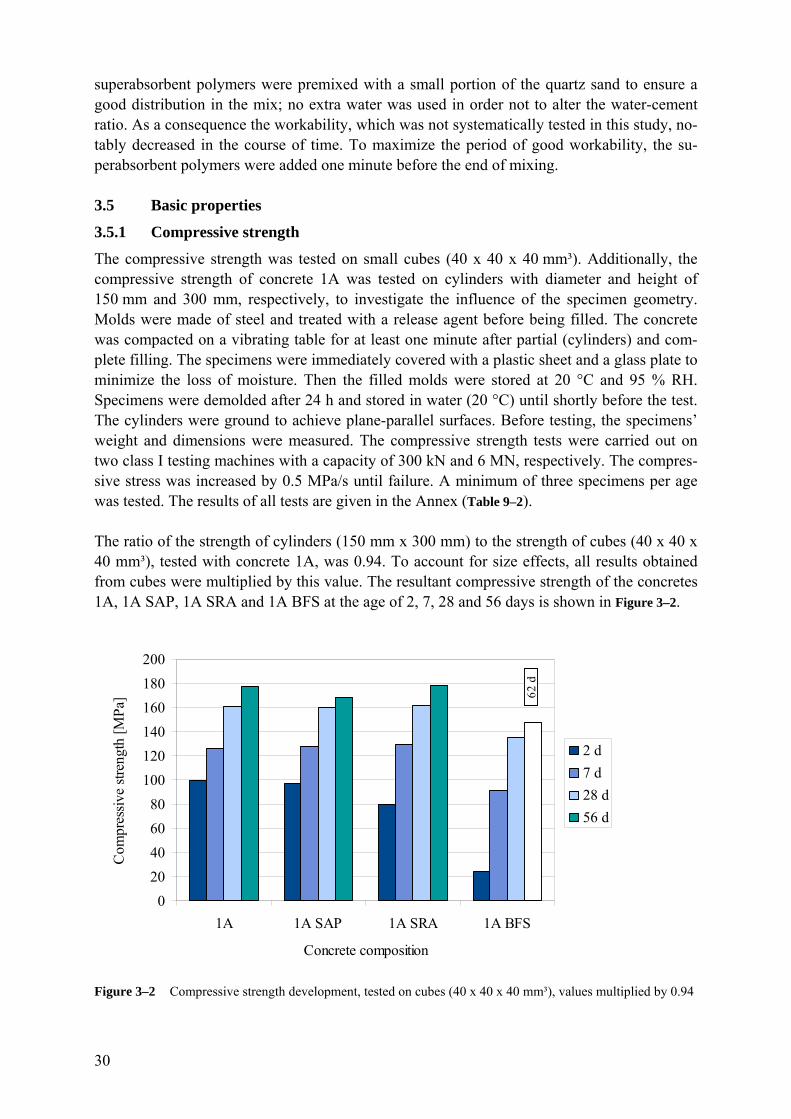
30
superabsorbent polymers were premixed with a small portion of the quartz sand to ensure a good distribution in the mix; no extra water was used in order not to alter the water-cement ratio. As a consequence the workability, which was not systematically tested in this study, no-tably decreased in the course of time. To maximize the period of good workability, the su-perabsorbent polymers were added one minute before the end of mixing.
3.5 Basic properties
3.5.1 Compressive strength
The compressive strength was tested on small cubes (40 x 40 x 40 mm³). Additionally, the compressive strength of concrete 1A was tested on cylinders with diameter and height of 150 mm and 300 mm, respectively, to investigate the influence of the specimen geometry. Molds were made of steel and treated with a release agent before being filled. The concrete was compacted on a vibrating table for at least one minute after partial (cylinders) and com-plete filling. The specimens were immediately covered with a plastic sheet and a glass plate to minimize the loss of moisture. Then the filled molds were stored at 20 °C and 95 % RH. Specimens were demolded after 24 h and stored in water (20 °C) until shortly before the test. The cylinders were ground to achieve plane-parallel surfaces. Before testing, the specimens’ weight and dimensions were measured. The compressive strength tests were carried out on two class I testing machines with a capacity of 300 kN and 6 MN, respectively. The compres-sive stress was increased by 0.5 MPa/s until failure. A minimum of three specimens per age was tested. The results of all tests are given in the Annex (Table 9–2).
The ratio of the strength of cylinders (150 mm x 300 mm) to the strength of cubes (40 x 40 x 40 mm³), tested with concrete 1A, was 0.94. To account for size effects, all results obtained from cubes were multiplied by this value. The resultant compressive strength of the concretes 1A, 1A SAP, 1A SRA and 1A BFS at the age of 2, 7, 28 and 56 days is shown in Figure 3–2.
0
20
40
60
80
100
120
140
160
180
200
1A 1A SAP 1A SRA 1A BFS
Concrete composition
Com
pres
sive
str
engt
h [M
Pa]
2 d
7 d
28 d
56 d
62 d
Figure 3–2 Compressive strength development, tested on cubes (40 x 40 x 40 mm³), values multiplied by 0.94

31
All concretes except for concrete 1A BFS (148 MPa at 62 days) achieved ultra-high strength as defined in Germany, i.e. 150 MPa or more. The compressive strength of the reference con-crete 1A at 2, 28 and 56 days was 99, 161 and 178 MPa, respectively. In comparison to con-crete 1A the strength development of concrete 1A BFS was much slower and final strength was significantly lower. The shrinkage reducing admixture led to a slightly slower hydration and strength development (1A SRA); however, final strength was as high as that of concrete 1A. The addition of superabsorbent polymers caused a slightly lower compressive strength at 56 days, while the earlier strength development was not significantly affected (1A SAP).
3.5.2 Splitting tensile strength
The splitting tensile strength was tested on specimens with diameter and height of 37 mm and 50 mm, respectively. Specimens were cast in cylindrical polypropylene molds with a wall thickness of 0.6 mm. The filled molds were tightly closed with a cap and stored at a tempera-ture of 20 °C. Specimens were demolded and cut to length by means of a water-cooled saw shortly before testing. The specimens’ weight and dimensions were measured. The diameter was callipered; no deviations from circularity were found. The load-controlled splitting ten-sion tests were carried out on a class I testing machine with a maximum capacity of 50 kN. Photos of the specimen preparation and the testing procedure can be found in the Annex (Figure 9–1). Masonite load bearing strips with a thickness and width of 3 mm and 7 mm, re-spectively, were used for load distribution. A minimum of three specimens was tested. The rate of stress increase in the principal tests was 3 MPa/min as per EN 12390-6. In addition, a rate of stress increase of 0.2 MPa/min was used with concretes 1A and 1A BFS to investigate the influence of the rate of stress increase.
The splitting tensile strength of concretes 1A, 1A SAP, 1A SRA and 1A BFS until the age of approximately 40 h, tested at a rate of stress increase of 3.0 MPa/min, is shown in Figure 3–3. Bars indicate the range of the individual test results. The splitting tensile strength of the refer-ence concrete 1A increased from 0.28 MPa at 9 h to 4.1 MPa at approximately 16.5 h and 9.8 MPa at 40 h. In comparison to concrete 1A the strength development was much slower with concrete 1A BFS and slightly slower with concrete 1A SRA. The splitting tensile strength of concretes 1A and 1A SAP developed similarly. Not shown in Figure 3–3, concrete 1A BFS reached a splitting tensile strength of 7.5 MPa at the age of 163 h. The results of all individual tests are given in the Annex (Table 9–3, Table 9–4). The mean coefficient of variation for all tests was 8.8 %.

32
0.0
2.0
4.0
6.0
8.0
10.0
12.0
6 12 18 24 30 36 42 48
Age [h]
Spli
ttin
g te
nsil
e st
reng
th [
MPa
] .
1A BFS
1A SRA
1A1A SAP
Figure 3–3 Splitting tensile strength, rate of stress increase: 3.0 MPa/min
As is shown in Figure 3–4 (1A) and Figure 3–5 (1A BFS), the splitting tensile strength was de-pendent on the rate of stress increase. Strength tended to result higher at the lower rate of stress increase. This tendency was confirmed by repeating some of the tests. At later age the influence of the stress rate on strength usually is vice versa, cf. e.g. [Car 94]. However, the splitting tensile strength is known to be sensitive to a number of test parameters [Roc 99], [Mal 07]. Possibly the failure mechanisms are different at very early age. Here, this important aspect could not be further looked into. Generally, the location of the crack initiation and the ratio of splitting to uniaxial tensile strength depend on concrete strength, specimen geometry and test setup [Mal 10]. This issue is discussed further in section 6.4.6.2.
0.0
2.0
4.0
6.0
8.0
10.0
4 8 12 16 20 24
Age [h]
Spl
itti
ng t
ensi
le s
tren
gth
[MP
a] .
0.2 MPa/min
3.0 MPa/min
1A
Figure 3–4 Splitting tensile strength of concrete 1A at different rates of stress increase
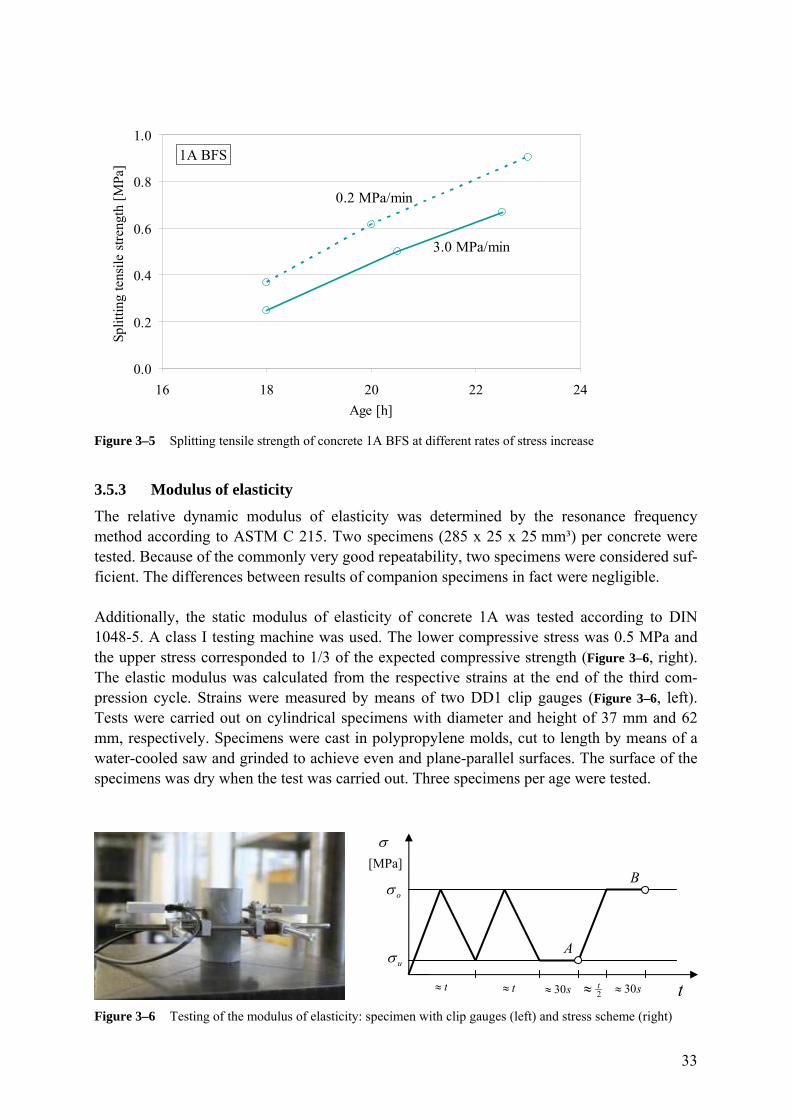
33
[MPa]
t
o
u
t t s30 2t s30
A
B
0.0
0.2
0.4
0.6
0.8
1.0
16 18 20 22 24
Age [h]
Split
ting
tens
ile s
tren
gth
[MPa
] . 1A BFS
0.2 MPa/min
3.0 MPa/min
Figure 3–5 Splitting tensile strength of concrete 1A BFS at different rates of stress increase
3.5.3 Modulus of elasticity
The relative dynamic modulus of elasticity was determined by the resonance frequency method according to ASTM C 215. Two specimens (285 x 25 x 25 mm³) per concrete were tested. Because of the commonly very good repeatability, two specimens were considered suf-ficient. The differences between results of companion specimens in fact were negligible.
Additionally, the static modulus of elasticity of concrete 1A was tested according to DIN 1048-5. A class I testing machine was used. The lower compressive stress was 0.5 MPa and the upper stress corresponded to 1/3 of the expected compressive strength (Figure 3–6, right). The elastic modulus was calculated from the respective strains at the end of the third com-pression cycle. Strains were measured by means of two DD1 clip gauges (Figure 3–6, left). Tests were carried out on cylindrical specimens with diameter and height of 37 mm and 62 mm, respectively. Specimens were cast in polypropylene molds, cut to length by means of a water-cooled saw and grinded to achieve even and plane-parallel surfaces. The surface of the specimens was dry when the test was carried out. Three specimens per age were tested.
Figure 3–6 Testing of the modulus of elasticity: specimen with clip gauges (left) and stress scheme (right)
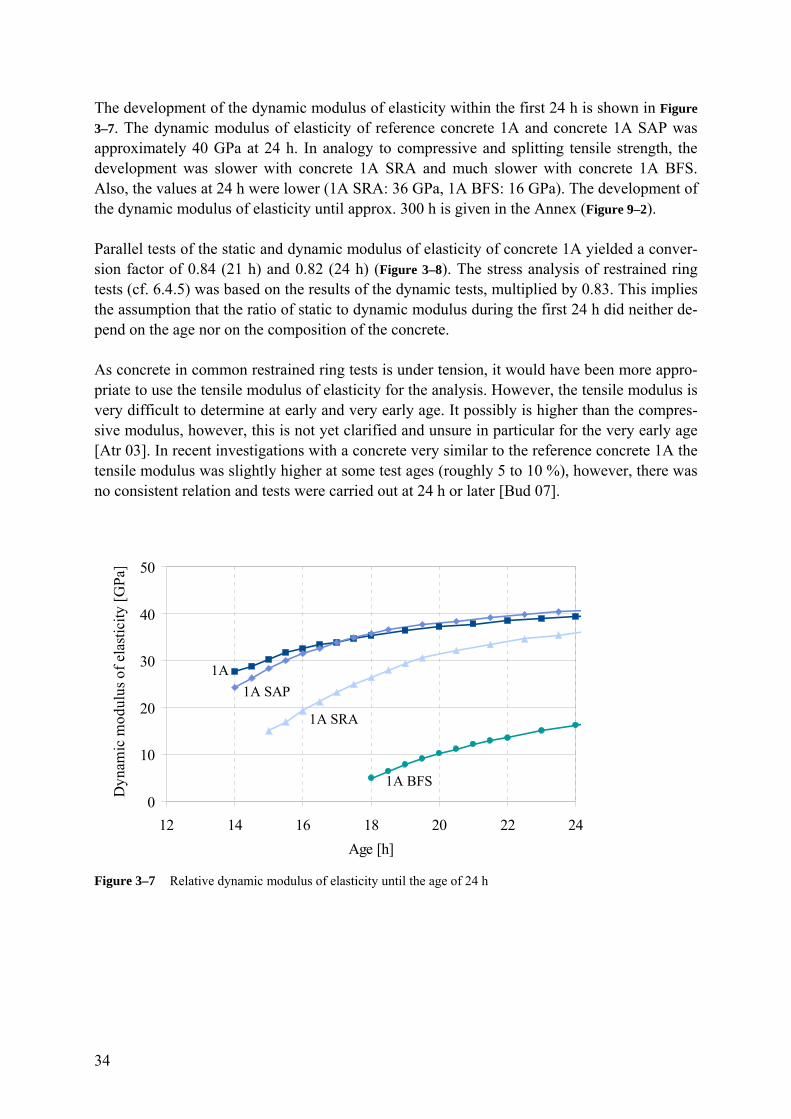
34
The development of the dynamic modulus of elasticity within the first 24 h is shown in Figure
3–7. The dynamic modulus of elasticity of reference concrete 1A and concrete 1A SAP was approximately 40 GPa at 24 h. In analogy to compressive and splitting tensile strength, the development was slower with concrete 1A SRA and much slower with concrete 1A BFS. Also, the values at 24 h were lower (1A SRA: 36 GPa, 1A BFS: 16 GPa). The development of the dynamic modulus of elasticity until approx. 300 h is given in the Annex (Figure 9–2).
Parallel tests of the static and dynamic modulus of elasticity of concrete 1A yielded a conver-sion factor of 0.84 (21 h) and 0.82 (24 h) (Figure 3–8). The stress analysis of restrained ring tests (cf. 6.4.5) was based on the results of the dynamic tests, multiplied by 0.83. This implies the assumption that the ratio of static to dynamic modulus during the first 24 h did neither de-pend on the age nor on the composition of the concrete.
As concrete in common restrained ring tests is under tension, it would have been more appro-priate to use the tensile modulus of elasticity for the analysis. However, the tensile modulus is very difficult to determine at early and very early age. It possibly is higher than the compres-sive modulus, however, this is not yet clarified and unsure in particular for the very early age [Atr 03]. In recent investigations with a concrete very similar to the reference concrete 1A the tensile modulus was slightly higher at some test ages (roughly 5 to 10 %), however, there was no consistent relation and tests were carried out at 24 h or later [Bud 07].
0
10
20
30
40
50
12 14 16 18 20 22 24
Age [h]
Dyn
amic
mod
ulus
of
elas
ticity
[G
Pa]
1A SRA
1A
1A SAP
1A BFS
Figure 3–7 Relative dynamic modulus of elasticity until the age of 24 h
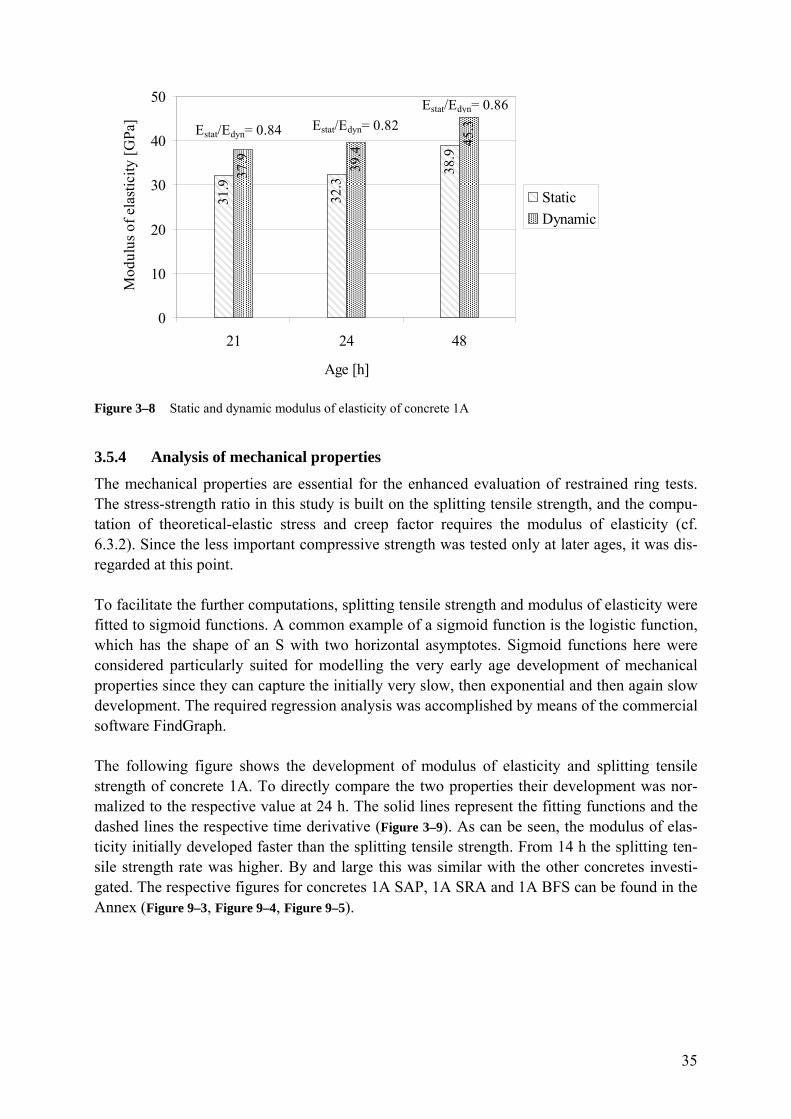
35
31.9
32.3
38.9
37.9 39.4
45.3
0
10
20
30
40
50
21 24 48
Age [h]
Mod
ulus
of
elas
ticity
[G
Pa]
Static
Dynamic
Estat/Edyn= 0.84 Estat/Edyn= 0.82
Estat/Edyn= 0.86
Figure 3–8 Static and dynamic modulus of elasticity of concrete 1A
3.5.4 Analysis of mechanical properties
The mechanical properties are essential for the enhanced evaluation of restrained ring tests. The stress-strength ratio in this study is built on the splitting tensile strength, and the compu-tation of theoretical-elastic stress and creep factor requires the modulus of elasticity (cf. 6.3.2). Since the less important compressive strength was tested only at later ages, it was dis-regarded at this point.
To facilitate the further computations, splitting tensile strength and modulus of elasticity were fitted to sigmoid functions. A common example of a sigmoid function is the logistic function, which has the shape of an S with two horizontal asymptotes. Sigmoid functions here were considered particularly suited for modelling the very early age development of mechanical properties since they can capture the initially very slow, then exponential and then again slow development. The required regression analysis was accomplished by means of the commercial software FindGraph.
The following figure shows the development of modulus of elasticity and splitting tensile strength of concrete 1A. To directly compare the two properties their development was nor-malized to the respective value at 24 h. The solid lines represent the fitting functions and the dashed lines the respective time derivative (Figure 3–9). As can be seen, the modulus of elas-ticity initially developed faster than the splitting tensile strength. From 14 h the splitting ten-sile strength rate was higher. By and large this was similar with the other concretes investi-gated. The respective figures for concretes 1A SAP, 1A SRA and 1A BFS can be found in the Annex (Figure 9–3, Figure 9–4, Figure 9–5).
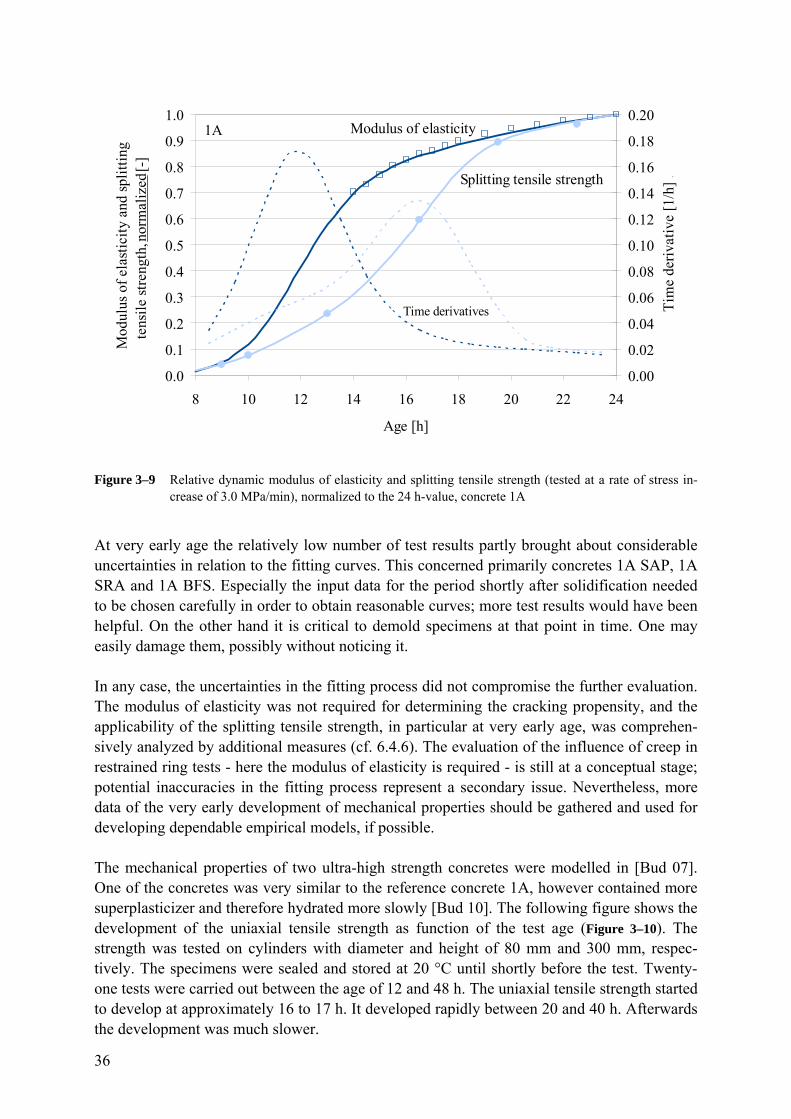
36
0.0
0.1
0.2
0.3
0.4
0.5
0.6
0.7
0.8
0.9
1.0
8 10 12 14 16 18 20 22 24
Age [h]
Mod
ulus
of
elas
tici
ty a
nd s
plit
ting
te
nsil
e st
reng
th, n
orm
aliz
ed [
-] .
0.00
0.02
0.04
0.06
0.08
0.10
0.12
0.14
0.16
0.18
0.20
Tim
e de
riva
tive
[1/
h] .
Modulus of elasticity
Splitting tensile strength
Time derivatives
1A
Figure 3–9 Relative dynamic modulus of elasticity and splitting tensile strength (tested at a rate of stress in-crease of 3.0 MPa/min), normalized to the 24 h-value, concrete 1A
At very early age the relatively low number of test results partly brought about considerable uncertainties in relation to the fitting curves. This concerned primarily concretes 1A SAP, 1A SRA and 1A BFS. Especially the input data for the period shortly after solidification needed to be chosen carefully in order to obtain reasonable curves; more test results would have been helpful. On the other hand it is critical to demold specimens at that point in time. One may easily damage them, possibly without noticing it.
In any case, the uncertainties in the fitting process did not compromise the further evaluation. The modulus of elasticity was not required for determining the cracking propensity, and the applicability of the splitting tensile strength, in particular at very early age, was comprehen-sively analyzed by additional measures (cf. 6.4.6). The evaluation of the influence of creep in restrained ring tests - here the modulus of elasticity is required - is still at a conceptual stage; potential inaccuracies in the fitting process represent a secondary issue. Nevertheless, more data of the very early development of mechanical properties should be gathered and used for developing dependable empirical models, if possible.
The mechanical properties of two ultra-high strength concretes were modelled in [Bud 07]. One of the concretes was very similar to the reference concrete 1A, however contained more superplasticizer and therefore hydrated more slowly [Bud 10]. The following figure shows the development of the uniaxial tensile strength as function of the test age (Figure 3–10). The strength was tested on cylinders with diameter and height of 80 mm and 300 mm, respec-tively. The specimens were sealed and stored at 20 °C until shortly before the test. Twenty-one tests were carried out between the age of 12 and 48 h. The uniaxial tensile strength started to develop at approximately 16 to 17 h. It developed rapidly between 20 and 40 h. Afterwards the development was much slower.

37
Uni
axia
l ten
sile
str
engt
h [M
Pa]
10
2
4
6
8
Age [h]
040 80 100 180600 20 120 140 160
Figure 3–10 Uniaxial tensile strength of an ultra-high strength concrete similar to concrete 1A, from [Bud 07]
This data was evaluated by the authors according to the model of Laube which had been de-veloped to describe restraint stress in mass concrete [Lau 90], cf. also [Gut 98]. To apply the model, the age was converted to a degree of hydration by means of formulas proposed by Jonasson [Jon 94]. To account for the incomplete hydration, a maximum degree of hydration of 0.55 was assumed. The model uses linear extrapolation of the tensile strength data to de-termine the degree of hydration at the onset of tensile strength development. The following figure shows the uniaxial tensile strength as function of the degree of hydration, normalized to the strength value at maximum degree of hydration which was approximately 9.5 MPa as per the linear model; the straight line represents the model, the single points are the measured strength values (Figure 3–11, [Mue 10a], [Bud 10]).
Uni
axia
l ten
sile
str
engt
h, n
orm
aliz
ed [
-] 1.0
0.0
0.2
0.4
0.6
0.8
Degree of hydration [-]
0.0 0.1 0.3 0.4 0.50.2
Model of Laube [Lau 90]
Figure 3–11 Uniaxial tensile strength of an ultra-high strength concrete similar to concrete 1A, normalized to the value at maximum degree of hydration, as function of the degree of hydration, from [Bud 10]

38
The figure reveals that this linear approach may be suitable for describing the tensile strength at higher degrees of hydration but not for the very early age. One can speak of a reasonable agreement above a degree of hydration of approximately 0.3. According to the model, at this point the uniaxial tensile strength exceeded 6.0 MPa. As can be seen from the previous Figure
3–10, the corresponding age is roughly 40 h, i.e. much later than the period relevant for inves-tigating the maximum cracking risk (cf. also 6.4.8). At a degree of hydration of 0.2 the model overestimated the actual uniaxial tensile strength by more than 100 %. Hence, this simple model was, as expected, not appropriate for this study. No other suitable model was found in literature, either. A specific study would be required to more comprehensively investigate and to empirically model the mechanical properties from the point of solidification.
3.5.5 Coefficient of thermal expansion
The coefficient of thermal expansion of concrete was tested on slender prisms (160 x 40 x 10 mm³, Figure 3–12, left). The coefficient was required only for the evaluation of some addi-tional tests under non-isothermal conditions (cf. 4.6 and 6.4.7.2). Three specimens per age and concrete were heated up in a water bath with a temperature of approx. 85 °C from approx. 20 °C to approx. 80 °C in 4 min. The temperature inside the prisms was continuously meas-ured via a resistance temperature detector (Pt 100). The length of the specimens was measured before and after heating with a dilatometer setup as per ASTM 157. Shrinkage within the pe-riod of heating was neglected. The effect of the gauge studs made of steel was accounted for by subtracting their expansion (calculated with a coefficient of thermal expansion of 16 µm/m/K) from the measured deformation. Each prism was used only once.
The coefficient of thermal expansion of reference concrete 1A amounted to approximately 11.5·10-6/K at 14 h and 17.5 h and to 11.2·10-6/K at 22 h (Figure 3–12, right). Results for con-crete 1A SAP were very similar. The partly higher values observed for concretes 1A SRA and 1A BFS may be due to the slower hydration and the different state of water [Loc 00]. The mean coefficient of variation of this test series was 7.1 %.
10.0
11.0
12.0
13.0
14.0
15.0
16.0
12 14 16 18 20 22 24 26
Age [h]
CT
E [
10 -6
/K]
1A1A SAP1A SRA1A BFS
Figure 3–12 Left: Specimen (160 x 40 x 10 mm³) with embedded resistance temperature detector for testing the coefficient of thermal expansion, right: results

39
3.5.6 Isothermal calorimetry
The heat of hydration of concrete 1A and 1A SRA was measured by isothermal heat flux calorimetry (TAM Air), mainly to obtain additional information on the reference concrete and to examine whether such data is helpful in the further analysis of the autogenous shrinkage cracking propensity (cf. 6.4.8). Concretes were mixed as shown in Figure 3–1 and then filled into the test jar. The following figure shows the rate of heat of hydration in the first 24 h (Figure 3–13). In comparison to reference concrete 1A, the maximum rate with concrete 1A SRA was lower and occurred later, clearly indicating the considerable retardation caused by the admixture.
0.00
0.25
0.50
0.75
1.00
1.25
1.50
0 2 4 6 8 10 12 14 16 18 20 22 24Age [h]
Rat
e of
hea
t of
hydr
atio
n [m
W/g
] .
1A
1A SRA
Figure 3–13 Rate of heat of hydration of concretes 1A and 1A SRA (isothermal heat flux calorimetry)
3.6 Summary
Fine-grained, plain ultra-high strength concretes were tested as to their mechanical properties. Investigations focused on four concrete compositions, three of which being modifications of the reference concrete 1A with only Portland cement as binder and superplasticizer being the only admixture. Concrete 1A SAP additionally contained superabsorbent polymers, concrete 1A SRA a shrinkage-reducing admixture and concrete 1A BFS a large amount of ground granulated blast furnace slag, replacing 3/4 of the Portland cement. The concretes’ composi-tion was to provide for a wide range of results in order to facilitate the examination of test methods.
The influence of the specific constituents on the development of the mechanical properties was as expected. The overall development was retarded by the high amount of superplasti-cizer. The shrinkage-reducing admixture increased the retardation effect. The very slow de-velopment of mechanical properties of concrete 1A BFS was due to the large amount of ground granulated blast furnace slag. The superabsorbent polymers, which were added to the reference concrete without any extra water, did not significantly alter the development of the mechanical properties. For instance, the splitting tensile strength of concretes 1A and 1A SAP increased from virtually nil to 6.0 MPa between the age of 8 h and 18 h and thereafter to 7.0 MPa at 24 h. In comparison, the splitting tensile strength of concretes 1A SRA and 1A

40
BFS was 5.0 and 0.75 MPa at 24 h. The dynamic modulus of elasticity of concrete 1A, 1A SAP, 1A SRA and 1A BFS at 1 d was 40, 40, 36 and 16 GPa, respectively. The static modulus corresponded to 83 % of the dynamic modulus of elasticity. Furthermore, the coeffi-cient of thermal expansion ranged from 11 to 15 µm/m/K.
The analysis of the mechanical properties during the first 24 h revealed that the modulus of elasticity initially developed faster than the splitting tensile strength. Sigmoid functions may be more suitable than linear functions for describing the development over time in this period.
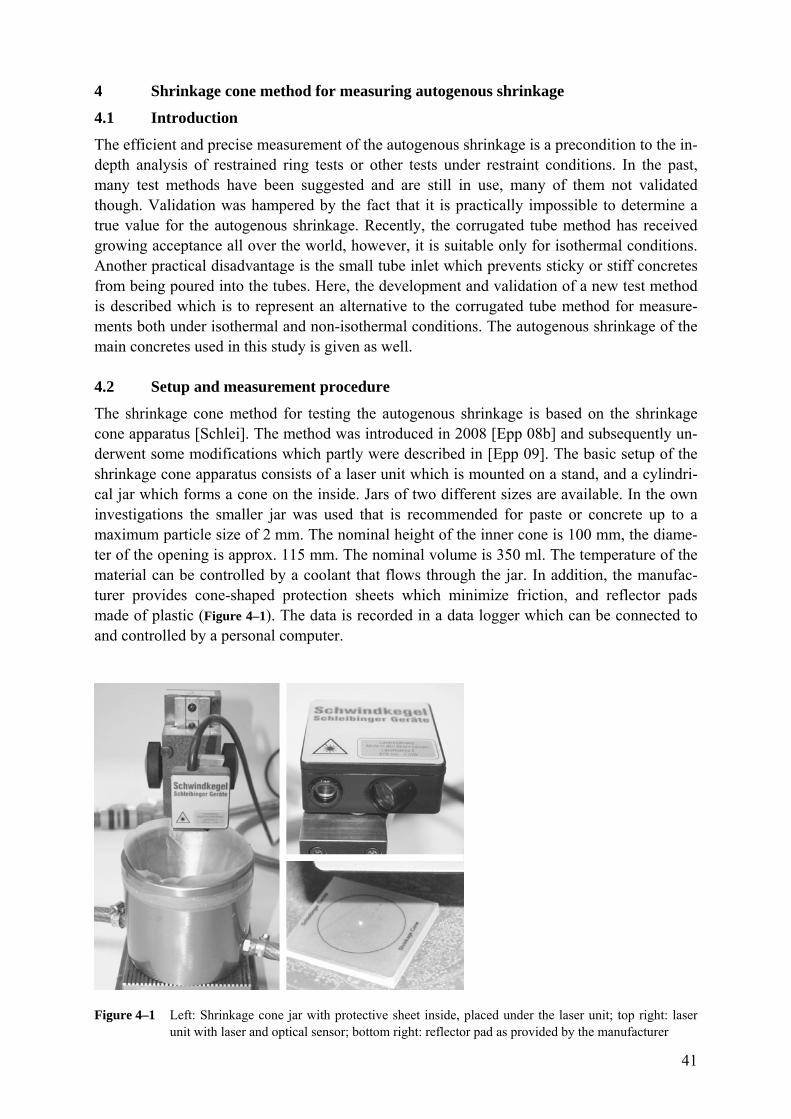
41
4 Shrinkage cone method for measuring autogenous shrinkage
4.1 Introduction
The efficient and precise measurement of the autogenous shrinkage is a precondition to the in-depth analysis of restrained ring tests or other tests under restraint conditions. In the past, many test methods have been suggested and are still in use, many of them not validated though. Validation was hampered by the fact that it is practically impossible to determine a true value for the autogenous shrinkage. Recently, the corrugated tube method has received growing acceptance all over the world, however, it is suitable only for isothermal conditions. Another practical disadvantage is the small tube inlet which prevents sticky or stiff concretes from being poured into the tubes. Here, the development and validation of a new test method is described which is to represent an alternative to the corrugated tube method for measure-ments both under isothermal and non-isothermal conditions. The autogenous shrinkage of the main concretes used in this study is given as well.
4.2 Setup and measurement procedure
The shrinkage cone method for testing the autogenous shrinkage is based on the shrinkage cone apparatus [Schlei]. The method was introduced in 2008 [Epp 08b] and subsequently un-derwent some modifications which partly were described in [Epp 09]. The basic setup of the shrinkage cone apparatus consists of a laser unit which is mounted on a stand, and a cylindri-cal jar which forms a cone on the inside. Jars of two different sizes are available. In the own investigations the smaller jar was used that is recommended for paste or concrete up to a maximum particle size of 2 mm. The nominal height of the inner cone is 100 mm, the diame-ter of the opening is approx. 115 mm. The nominal volume is 350 ml. The temperature of the material can be controlled by a coolant that flows through the jar. In addition, the manufac-turer provides cone-shaped protection sheets which minimize friction, and reflector pads made of plastic (Figure 4–1). The data is recorded in a data logger which can be connected to and controlled by a personal computer.
Figure 4–1 Left: Shrinkage cone jar with protective sheet inside, placed under the laser unit; top right: laser unit with laser and optical sensor; bottom right: reflector pad as provided by the manufacturer

42
To test the plastic shrinkage of a cementitious material, it is first poured into the jar. Then the reflector is placed on top of the material and the jar is positioned under the laser unit so that the focused laser beam is reflected by the reflector pad. The diffusive part of the reflected light is received by an optical sensor. The distance to the reflector can be calculated by means of the triangulation principle. Lasers with different resolution are available. The lasers used in the own tests had a resolution of 0.6 and 0.1 µm. After the test the actual height of the speci-men needs to be measured. It is the reference for the calculation of the linear strain.
Assuming deformations to be uniform, the cone geometry of the specimen ensures that the change of the recorded distance to the specimen surface corresponds to the linear length change. The ratio of radius r to height h is constant for any volume; therefore the ratio of two volumes V1 and V2 is equal to the third power of the ratio of the respective heights h1 and h2 (Figure 4–2). In a cylinder the relation of radius and height is variable prior to solidification. For this reason a cylinder is appropriate for the one-dimensional measurement of volume changes before setting only if it is much longer than wide.
h1h2
r2
r1
V = 1/3 π · r² · h
r1/h1 = r2/h2
V1/V2 = (h1/h2)³
Figure 4–2 Cross section of two cones with different radius and height and identical angles. Equations de-scribing the resultant volumes V1 and V2
The shrinkage cone originally had been developed for measuring the plastic shrinkage [Kau 04]. To measure the autogenous shrinkage, it is required to prevent evaporation from the sur-face. A thin and transparent plastic film was used to cover the surface [Toppits]. Sealing the surface sometimes led to the formation of bubbles under the plastic film during the test, nota-bly altering the position of the reflector pad when this was put on top of the film [Epp 08b]. To avoid this effect, the reflector pad was directly placed into the concrete. Prior to that, the film and the pad were tightly connected to each other by double-faced adhesive tape. A small part of the film was removed in the center of the pad to allow for the laser to directly hit the concrete surface. Pads made of concrete were used instead of the plastic pad to ensure a more neutral behavior in terms of thermal expansion. Diameter and height of the pads were ap-proximately 3 mm and 18 mm, respectively. Before being used the pads were stored for at least one week to minimize the influence of shrinkage of the pad. Possible swelling when immersed into concrete could be neglected. In preliminary tests the concrete which was used for producing the pads (concrete 1A) was found to hardly take up any water.
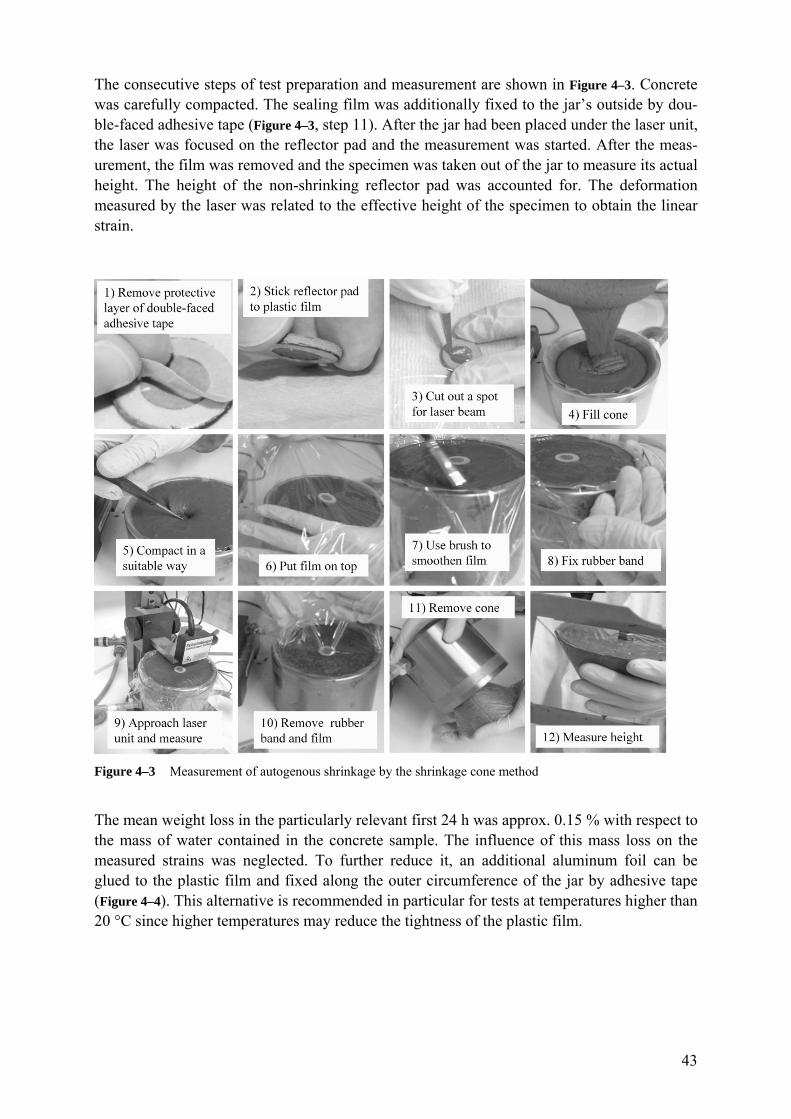
43
The consecutive steps of test preparation and measurement are shown in Figure 4–3. Concrete was carefully compacted. The sealing film was additionally fixed to the jar’s outside by dou-ble-faced adhesive tape (Figure 4–3, step 11). After the jar had been placed under the laser unit, the laser was focused on the reflector pad and the measurement was started. After the meas-urement, the film was removed and the specimen was taken out of the jar to measure its actual height. The height of the non-shrinking reflector pad was accounted for. The deformation measured by the laser was related to the effective height of the specimen to obtain the linear strain.
Figure 4–3 Measurement of autogenous shrinkage by the shrinkage cone method
The mean weight loss in the particularly relevant first 24 h was approx. 0.15 % with respect to the mass of water contained in the concrete sample. The influence of this mass loss on the measured strains was neglected. To further reduce it, an additional aluminum foil can be glued to the plastic film and fixed along the outer circumference of the jar by adhesive tape (Figure 4–4). This alternative is recommended in particular for tests at temperatures higher than 20 °C since higher temperatures may reduce the tightness of the plastic film.

44
Figure 4–4 Sealing of the jar with a combination of plastic and aluminum foil, fixed to the jar by adhesive tape
4.3 Temperature control
The concrete temperature significantly influences the autogenous shrinkage (cf. 2.5.2). For that reason it is an essential requirement for any complete test method that the concrete tem-perature can be effectively controlled. The effectiveness of the temperature control of the shrinkage cone method, tested on concrete 1A, is illustrated in Figure 4–5. Without temperature control there was a significant increase in the centre of the cone of approximately 3.8 K due to the release of heat of hydration. The increase was approximately 0.7 K when a coolant (water, 20 °C) flowed through the jar. Furthermore, the cooling quickly reduced the relatively high temperature soon after mixing.
18.0
20.0
22.0
24.0
26.0
28.0
0 4 8 12 16 20 24
Age [h]
Tem
pera
ture
[°C
]
without temperature control
temperature controlled at 20 °C
Figure 4–5 Temperature in the center of the cone with and without temperature control, concrete 1A
There are two alternatives to conduct tests under non-isothermal conditions. The first is to place the setup in a room with constant air temperature and to control the concrete tempera-ture by means of the coolant that flows through the jar. Theoretically, in this case notable dif-ferences between the temperature in the centre of the specimen and at its surface may occur

45
since the temperature at the surface may be influenced by the air temperature which deviates from the temperature of the coolant. To investigate this, a non-isothermal test was carried out during which the temperatures in the centre and approx. 2 mm underneath the surface were measured. The temperature regime comprised some abrupt changes of temperature. A maxi-mum difference between core and surface temperature of approximately 0.5 K was observed which can be considered negligible (Figure 4–6, left). Although the room temperature (20 °C) was lower than the concrete temperature, the temperature at the surface was slightly higher than in the centre of the specimen. However, the differences were hardly significant. Possibly the observed effect was due to the heat conduction of the aluminum foil placed on top of the surface (cf. Figure 4–4),
The second alternative is to place the complete shrinkage cone apparatus inside a temperature chamber. Then the temperature of the concrete can be controlled by the air that surrounds the apparatus. In this case, one concern may be the slow adaption of the air temperature by the concrete. The result of a respective test is shown in Figure 4–6 on the right side. The test was carried out in an oven which normally is used for drying of materials. Despite the abrupt changes of air temperature the temperature in the centre of the specimen changed rather stead-ily. The maximum time shift between air and concrete temperature was approx. 1 h. If the air temperature could have been controlled more precisely, the control of the concrete tempera-ture would have been better.
15
20
25
30
35
40
4 8 12 16 20 24
Age [h]
Tem
pera
ture
[°C
]
Centre of specimen
Surface of specimen
15
20
25
30
35
40
4 8 12 16 20 24
Age [h]
Tem
pera
ture
[°C
]
Air
Centre of specimen
Figure 4–6 Concrete temperature in shrinkage cones: temperature control by coolant (left) and by air (right)
Hence, reasonable control of the concrete temperature can be achieved with both methods. However, if the complete apparatus is placed in a temperature chamber, the thermal deforma-tions of each element (stand, base, laser, connecting parts) need to be accounted for in the cal-culation of the autogenous shrinkage. These elements are made of different materials, making a correction of thermal deformations very difficult.
Contrary to that, if concrete temperature is controlled by the coolant, only the thermal defor-mation of the bottom part of the jar needs to be considered. The geometry of the upper part, i.e. the area from the tip of the cone to the top, is not temperature dependent. The angle is constant for arbitrary temperatures.

46
A strongly exaggerated thermal expansion of the jar is shown in Figure 4–7 to illustrate this ef-fect. Under the assumption that the base on which the jar is placed does not deform, the posi-tion of the cone tip is altered only by the displacement t. The displacement can be calculated from the temperature change, the distance from the bottom to the tip of the jar (approx. 10 mm) and the coefficient of thermal expansion. The jar is made of an aluminum alloy with a coefficient of thermal expansion of approximately 23 µm/m/K.
T1
T ≈ 23 µm/m/K
Base made of material with very low T
t
T2
T
Figure 4–7 Shrinkage cone: thermal deformation of the jar at two different temperatures T1 and T2 (schematic)
In the following figure the jar is supposed to be filled with concrete. Jar and concrete are as-sumed to undergo a uniform increase of temperature. Shrinkage is neglected and thermal de-formation of concrete is assumed to be uniform. Then the difference in the distance between laser and concrete surface (d1-d2) is the sum of the displacement t of the tip of the cone and the displacement a caused by the thermal deformation of the concrete specimen. If the coeffi-cients of thermal expansion and the temperatures are known, a and t can be calculated and ac-counted for in the calculation of shrinkage.
t
Position of laser
d1
d2
at
T1 T2T
Figure 4–8 Shrinkage cone method: thermal deformation of jar and concrete (cf. Figure 4–7)

47
4.4 Precision under quasi-isothermal conditions
4.4.1 Repeatability
To investigate the repeatability of the shrinkage cone method, the autogenous shrinkage of concrete 1A was measured five times in a row under quasi-isothermal conditions (20 °C). Cement batch 2 was used for these tests (Table 9–1). The deformations in this case were evalu-ated from initial setting (approximately 6 h) in order to also cover the period which usually is more difficult to measure correctly (cf. 2.3).
The mean strain at the age of 24 h amounted to 0.99 mm/m (Figure 4–9). Generally, the scatter was low. The standard deviation at the age of 24 h was 0.02 mm/m and the coefficient of variation 2.0 %. The repeatability precision according to ISO 5725-2:2002 (assuming a 5 % error probability) was 0.056 mm/m, equivalent to 5.6 % with respect to the mean.
-1.2
-1.0
-0.8
-0.6
-0.4
-0.2
0.0
0 4 8 12 16 20 24
Age [h]
Str
ain
[mm
/m]
Figure 4–9 Strain under sealed conditions between the age of 6 and 24 h measured five times in a row with the shrinkage cone method, concrete 1A
Further investigations were carried out with concrete compositions 1A and 1A SRA, partly involving a second laboratory (BAM, Federal Institute for Materials Research and Testing, Berlin, Germany). Both concretes were tested thrice with the shrinkage cone method under repeatability conditions. Cement batch 4 was used for this test series (cf. Table 9–1). The onset of stress development in restrained ring tests was used as time-zero (1A: 8 h, 1A SRA: 12 h). The results of the own investigations (Lab 1) are shown in Figure 4–10. Again the scatter was low.

48
-1.2
-1.0
-0.8
-0.6
-0.4
-0.2
0.0
6 8 10 12 14 16 18 20 22 24
Age [h]
Str
ain
[mm
/m] 1A
1A SRA
Figure 4–10 Strain under sealed conditions measured by the shrinkage cone method, onset of stress develop-ment in deformation-restrained tests as time-zero, three tests in a row with each concrete
At the time these investigations were carried out, only one shrinkage cone was available at German Cement Works Association. The second laboratory (Lab 2) was equipped with two shrinkage cone apparatus. The following figure shows the results of two out of three consecu-tive tests on concrete 1A, carried out with two shrinkage cones in parallel (Figure 4–11). A third test failed. The agreement of results obtained from the two mixes can be considered good, the agreement between the results of the single tests very good. Presumably the mixes had a slightly different shrinkage behavior.
-1.2
-1.0
-0.8
-0.6
-0.4
-0.2
0.0
6 8 10 12 14 16 18 20 22 24
Age [h]
Str
ain
[mm
/m]
test a
test b
Figure 4–11 Strain under sealed conditions measured by the shrinkage cone method (lab 2), onset of stress de-velopment as time-zero, two tests with two shrinkage cone apparatus, concrete 1A
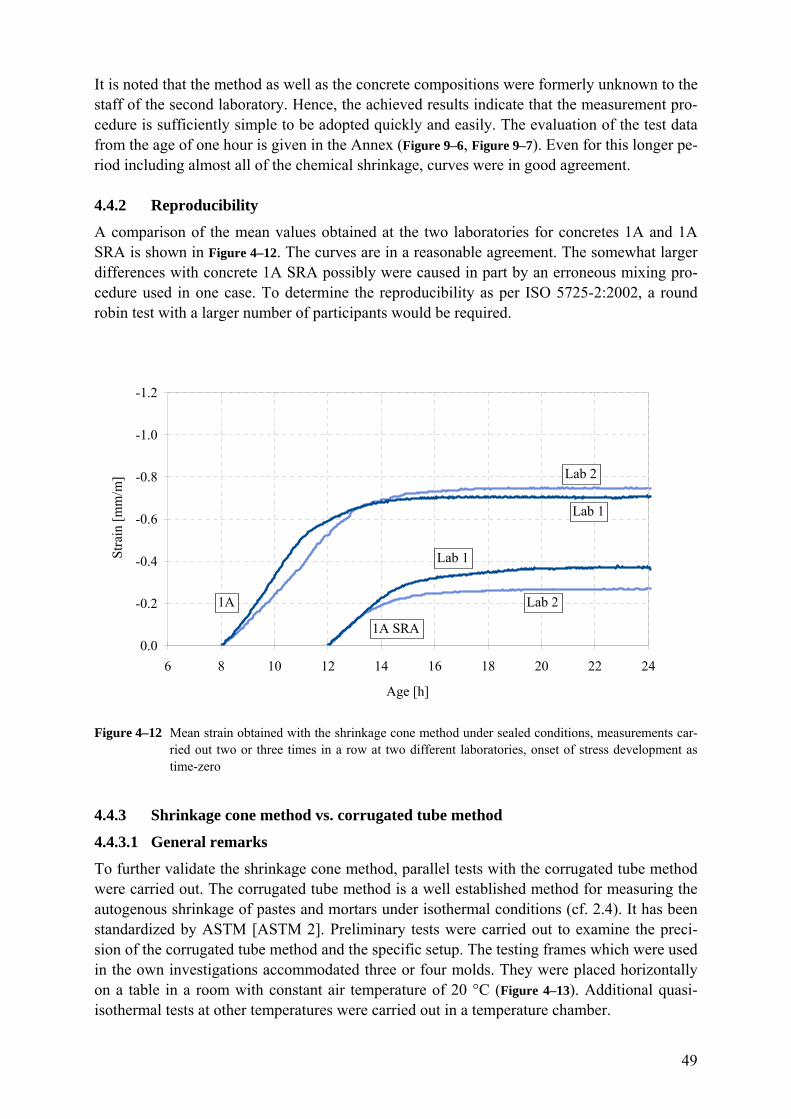
49
It is noted that the method as well as the concrete compositions were formerly unknown to the staff of the second laboratory. Hence, the achieved results indicate that the measurement pro-cedure is sufficiently simple to be adopted quickly and easily. The evaluation of the test data from the age of one hour is given in the Annex (Figure 9–6, Figure 9–7). Even for this longer pe-riod including almost all of the chemical shrinkage, curves were in good agreement.
4.4.2 Reproducibility
A comparison of the mean values obtained at the two laboratories for concretes 1A and 1A SRA is shown in Figure 4–12. The curves are in a reasonable agreement. The somewhat larger differences with concrete 1A SRA possibly were caused in part by an erroneous mixing pro-cedure used in one case. To determine the reproducibility as per ISO 5725-2:2002, a round robin test with a larger number of participants would be required.
-1.2
-1.0
-0.8
-0.6
-0.4
-0.2
0.0
6 8 10 12 14 16 18 20 22 24
Age [h]
Str
ain
[mm
/m] Lab 2
Lab 1
Lab 2
Lab 1
1A
1A SRA
Figure 4–12 Mean strain obtained with the shrinkage cone method under sealed conditions, measurements car-
ried out two or three times in a row at two different laboratories, onset of stress development as time-zero
4.4.3 Shrinkage cone method vs. corrugated tube method
4.4.3.1 General remarks
To further validate the shrinkage cone method, parallel tests with the corrugated tube method were carried out. The corrugated tube method is a well established method for measuring the autogenous shrinkage of pastes and mortars under isothermal conditions (cf. 2.4). It has been standardized by ASTM [ASTM 2]. Preliminary tests were carried out to examine the preci-sion of the corrugated tube method and the specific setup. The testing frames which were used in the own investigations accommodated three or four molds. They were placed horizontally on a table in a room with constant air temperature of 20 °C (Figure 4–13). Additional quasi-isothermal tests at other temperatures were carried out in a temperature chamber.

50
In the principal test series the tubes, having an inlet diameter of approximately 20 mm, were filled with the help of an applicator gun to facilitate the procedure. The concrete, in most cases being too sticky to be poured into the tube opening, was filled into the apposite car-tridge and pressed into the tube through a long rubber hose (Figure 4–13). For this purpose the tubes were fixed vertically to a stand which was placed on a vibrating table during the process of filling. The plastic end plugs for closing the tubes were retrofitted with metallic caps pro-viding a particularly smooth end surface and allowing for the fixation of one end of the specimen to the frame by means of a magnet (Figure 4–13). Digital feather touch spring push probes (Solartron DT/2/S) with extra-low tip force (0.18 N) were used to avoid compression of the tubes.
Figure 4–13 Filling of the corrugated tube with applicator gun (left), dilatometer benches (top right), probe and metallic cap (mid right), opposite end fixed with a magnet (bottom right)
4.4.3.2 Repeatability precision of tests with corrugated tube method
The autogenous shrinkage of concretes 1A and 1A SRA was tested with the corrugated tube method three times in a row with two specimens. With concrete 1A, the scatter among the six specimens was low. The standard deviation at the age of 24 h was 0.02 mm/m. In relation to the mean value of 0.83 mm/m this corresponded to a coefficient of variation of 2.7 %. The re-peatability precision according to ISO 5725-2:2002 (assuming a 5 % error probability) was 0.056 mm/m, equivalent to 6.7 % with respect to the mean. The results for the three mixes of concrete 1A SRA showed more notable differences (Figure 4–14). Since the agreement was very good among the two specimens made from each mix, the overall scatter can be mainly attributed to different shrinkage behavior of the single mixes. Obviously the shrinkage behav-ior of different mixes of concrete 1A SRA generally varied more than that of concrete 1A (cf. Figure 4–10 and Figure 4–12).

51
-1.2
-1.0
-0.8
-0.6
-0.4
-0.2
0.0
6 8 10 12 14 16 18 20 22 24
Age [h]
Str
ain
[mm
/m]
1A
1A SRA
test a
test ctest b
Figure 4–14 Strain under sealed conditions measured by the corrugated tube method, onset of stress develop-ment as time-zero, three tests in a row for each concrete, two specimens per test
4.4.3.3 Comparison of corrugated tube method and shrinkage cone method
The following two figures show comparisons of the results obtained with the shrinkage cone and the corrugated tube method for concretes 1A and 1A SRA. All results are based on own experiments which were carried out on concrete samples from identical mixes. The autoge-nous shrinkage strain at the age of 24 h was higher when measured with the corrugated tube method (Figure 4–15, 1A: +19 %, 1A SRA: +6 %). This tendency was even more pronounced at a constant temperature of 5 °C (Figure 4–20, +32 %).
-1.2
-1.0
-0.8
-0.6
-0.4
-0.2
0.0
6 8 10 12 14 16 18 20 22 24
Age [h]
Stra
in [
mm
/m]
1A
1A SRA
Corrugated tube method
Corrugated tube method
Shrinkage cone method
Shrinkage cone method
Figure 4–15 Shrinkage cone method vs. corrugated tube method: comparison of mean autogenous shrinkage strain for concretes 1A and 1A SRA, onset of stress development as time-zero
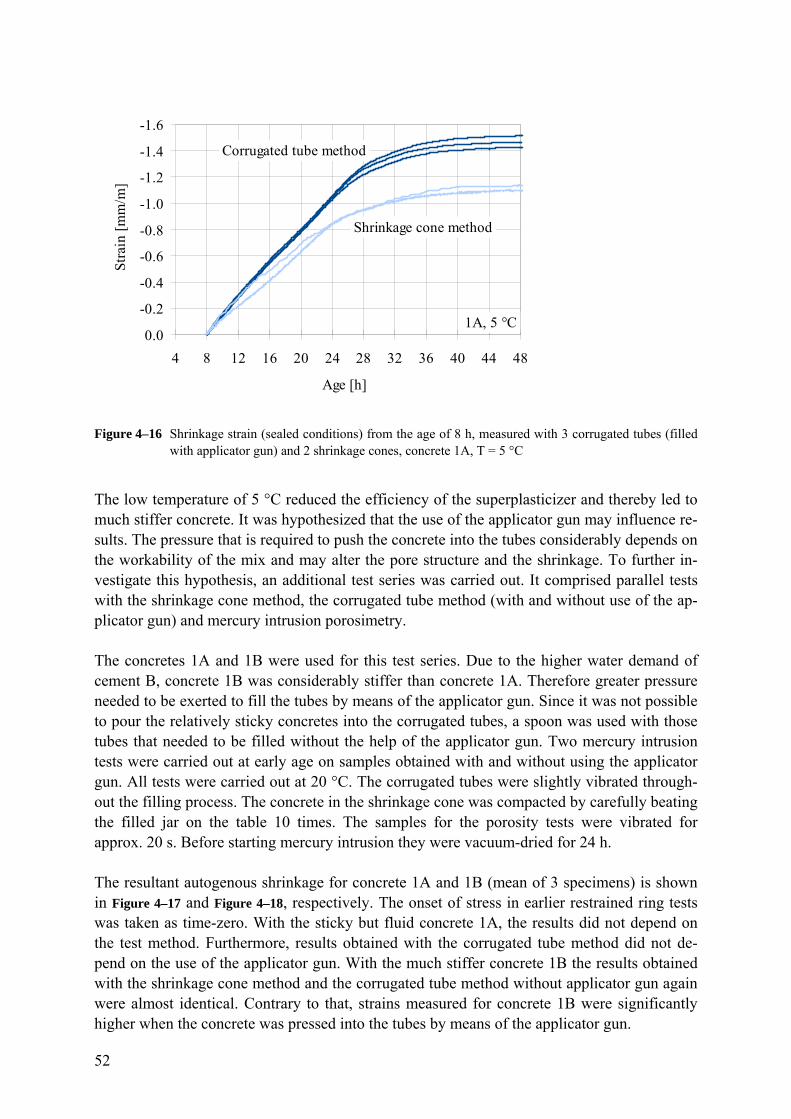
52
-1.6
-1.4
-1.2
-1.0
-0.8
-0.6
-0.4
-0.2
0.0
4 8 12 16 20 24 28 32 36 40 44 48
Age [h]
Str
ain
[mm
/m]
Shrinkage cone method
Corrugated tube method
1A, 5 °C
Figure 4–16 Shrinkage strain (sealed conditions) from the age of 8 h, measured with 3 corrugated tubes (filled with applicator gun) and 2 shrinkage cones, concrete 1A, T = 5 °C
The low temperature of 5 °C reduced the efficiency of the superplasticizer and thereby led to much stiffer concrete. It was hypothesized that the use of the applicator gun may influence re-sults. The pressure that is required to push the concrete into the tubes considerably depends on the workability of the mix and may alter the pore structure and the shrinkage. To further in-vestigate this hypothesis, an additional test series was carried out. It comprised parallel tests with the shrinkage cone method, the corrugated tube method (with and without use of the ap-plicator gun) and mercury intrusion porosimetry.
The concretes 1A and 1B were used for this test series. Due to the higher water demand of cement B, concrete 1B was considerably stiffer than concrete 1A. Therefore greater pressure needed to be exerted to fill the tubes by means of the applicator gun. Since it was not possible to pour the relatively sticky concretes into the corrugated tubes, a spoon was used with those tubes that needed to be filled without the help of the applicator gun. Two mercury intrusion tests were carried out at early age on samples obtained with and without using the applicator gun. All tests were carried out at 20 °C. The corrugated tubes were slightly vibrated through-out the filling process. The concrete in the shrinkage cone was compacted by carefully beating the filled jar on the table 10 times. The samples for the porosity tests were vibrated for approx. 20 s. Before starting mercury intrusion they were vacuum-dried for 24 h.
The resultant autogenous shrinkage for concrete 1A and 1B (mean of 3 specimens) is shown in Figure 4–17 and Figure 4–18, respectively. The onset of stress in earlier restrained ring tests was taken as time-zero. With the sticky but fluid concrete 1A, the results did not depend on the test method. Furthermore, results obtained with the corrugated tube method did not de-pend on the use of the applicator gun. With the much stiffer concrete 1B the results obtained with the shrinkage cone method and the corrugated tube method without applicator gun again were almost identical. Contrary to that, strains measured for concrete 1B were significantly higher when the concrete was pressed into the tubes by means of the applicator gun.

53
Note that the deviation of absolute values for concrete 1A from results of earlier or later tests (cf. e.g. Figure 4–20) can have several reasons, for instance aging of materials, different tem-peratures and variation of mixes. The potential influence of a slightly deviating hydration was illustrated in Figure 2–6.
-1.2
-1.0
-0.8
-0.6
-0.4
-0.2
0.0
4 8 12 16 20 24
Age [h]
Aut
ogen
ous
stra
in [
mm
/m]
.
Corrugated tube method, concrete pressed / not pressed(curves nearly identical)
Shrinkage cone method (concrete not pressed)
1A
Figure 4–17 Autogenous shrinkage measured with the shrinkage cone method and with the corrugated tube method with and without use of an applicator gun (pressed / not pressed), concrete 1A
-1.4
-1.2
-1.0
-0.8
-0.6
-0.4
-0.2
0.0
4 8 12 16 20 24
Age [h]
Aut
ogen
ous
stra
in [
mm
/m]
. Corrugated tube method, concrete pressed
Shrinkage cone method (concrete not pressed)
concrete not pressed
1B
Figure 4–18 Autogenous shrinkage measured with the shrinkage cone method and with the corrugated tube method with and without use of an applicator gun (pressed / not pressed), concrete 1B
The results of the porosity measurements are shown in Figure 4–19. Porosities at early age of pressed and not pressed concrete were almost identical with concrete 1A and notably differed with concrete 1B. Obviously concrete 1A was sufficiently fluid to be pressed into the tubes

54
without significant changes to the pore structure. Contrary to that, it appears that the pore structure of concrete 1B was significantly changed by the pressure. These observations, along with the different shrinkage behavior of pressed and not pressed concrete 1B, confirm the as-sumption that using an applicator gun can influence the results of shrinkage measurements.
In view of the excellent agreement that was achieved when there was no disturbing influence of the applicator gun, the discrepancies observed in the earlier test series (Figure 4–15, Figure 4–
16) largely can be attributed to this influence. Moreover, the agreement indicates the validity and precision of both test methods.
0.0
10.0
20.0
30.0
40.0
50.0
60.0
0.001 0.010 0.100 1.000Pore radius [µm]
Spec
ific
vol
ume
[mm
³/g]1A, pressed
1A, not pressed21 h
18 h
0.0
10.0
20.0
30.0
40.0
50.0
0.001 0.010 0.100 1.000Pore radius [µm]
Spec
ific
vol
ume
[mm
³/g]1B, pressed
1B, not pressed16 h
19 h
Figure 4–19 Cumulative pore volume tested at early age, concrete sampled with and without the use of an ap-
plicator gun (pressed / not pressed), concrete 1A (left) and 1B (right)
4.5 Autogenous shrinkage of the investigated concretes at 20 °C
The autogenous shrinkage of concretes 1A, 1A SRA, 1A SAP and 1A BFS, measured three to four times in a row with the shrinkage cone method under quasi-isothermal conditions (20 °C) is shown in Figure 4–20. Cement batch 4 (cf. Table 9–1) was used for these tests of the autoge-nous shrinkage as well as for the corresponding restrained ring tests and the tests of mechani-cal properties described in section 3.5. The onset of stress development in restrained ring tests was taken as time-zero (cf. Figure 6–8). The solid curves represent best-fit functions obtained from regression analysis of the mean values of the single tests. Dotted curves indicate the minimum and maximum values obtained in the single tests. The results of all tests are given in the Annex (Figure 9–8 to Figure 9–11). The best-fit functions were used for the further evaluation of the restrained ring tests (cf. 6.4.5.2 and 6.4.5.3).
Autogenous shrinkage developed most rapidly with concrete 1A which also showed the high-est shrinkage throughout the entire test period of 24 h. Although no asymptotic end value was determined, it can be assumed that more than roughly 70 % of the autogenous shrinkage oc-curred between 8 h and 16 h. The shrinkage strain was 0.69 mm/m at 16 h and hardly in-creased anymore afterwards. The period from 8 h to 16 h can be further divided into two phases. Between 8 h and 11 h the rate of shrinkage was virtually constant at approximately 0.2 mm/m/h. In the second phase between 11 h and 16 h the rate decreased continuously and converged to nil.

55
The autogenous shrinkage of concrete 1A BFS started to develop from 15 h and proceeded thereafter at considerable rates. The strain at 24 h was 0.52 mm/m. Compared to the reference concrete 1A, the autogenous shrinkage of the concretes 1A SAP and 1A SRA was substan-tially reduced. The value at 24 h was approximately 0.25 mm/m and 0.35 mm/m, respectively, corresponding to a reduction of the autogenous shrinkage by 64 % and 50 % with respect to concrete 1A.
The scatter among the single results was very low with concrete 1A. The more notable scat-tering with the other concrete compositions may be attributable to larger variations among the single mixes or to a lower homogeneity of the mixes. A similar trend was observed with con-crete 1A SRA in the investigation of the reproducibility of the test method, cf. 4.4.3.2.
0.0
0.2
0.4
0.6
0.8
1.0
6 8 10 12 14 16 18 20 22 24
Age [h]
Aut
ogen
ous
shri
nkag
e [m
m/m
]
1A
1A SAP
1A SRA
1A BFS
Figure 4–20 Autogenous shrinkage measured with the shrinkage cone method, concretes 1A, 1A SRA, 1A SAP, 1A BFS, dotted curves: minimum and maximum values of three to four consecutive tests
4.6 Tests under non-isothermal conditions
To further examine the suitability of the shrinkage cone method for measuring the autogenous shrinkage also under non-isothermal conditions, three consecutive tests with concrete 1A were carried out during which the temperature of the coolant was increased between 18 h and 24 h. This period was chosen for this tentative test series since the autogenous shrinkage at that age proceeded at very low rates (at a concrete temperature of 20 °C). This facilitated the separation of thermal and shrinkage strains.
The concrete had a constant temperature of approximately 21.5 °C before the heating began. The jar was placed on two prisms of borosilicate glass having a very low coefficient of ther-mal expansion in order to minimize the influence of increasing temperature on the base of the stand (cf. Figure 4–7). The temperature of the concrete was measured in a second jar in order not to disturb the measurement of the autogenous shrinkage. The concrete temperature was increased constantly to approx. 33 °C at 24 h.
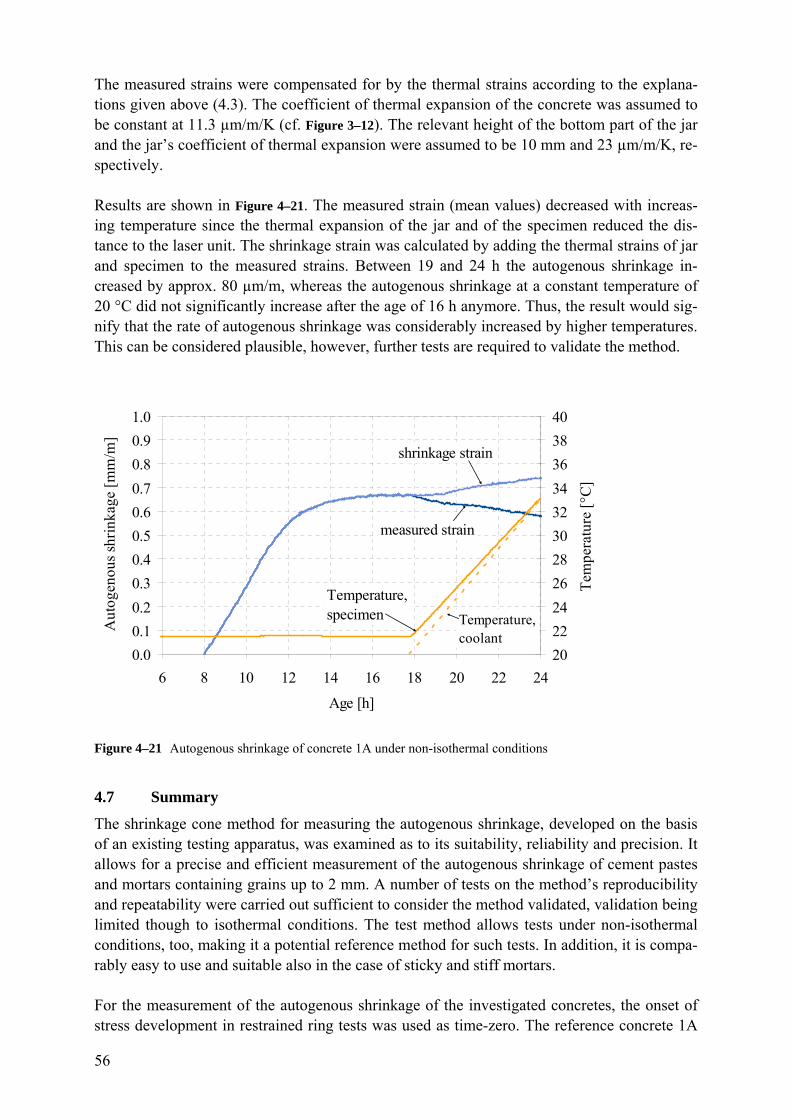
56
The measured strains were compensated for by the thermal strains according to the explana-tions given above (4.3). The coefficient of thermal expansion of the concrete was assumed to be constant at 11.3 µm/m/K (cf. Figure 3–12). The relevant height of the bottom part of the jar and the jar’s coefficient of thermal expansion were assumed to be 10 mm and 23 µm/m/K, re-spectively.
Results are shown in Figure 4–21. The measured strain (mean values) decreased with increas-ing temperature since the thermal expansion of the jar and of the specimen reduced the dis-tance to the laser unit. The shrinkage strain was calculated by adding the thermal strains of jar and specimen to the measured strains. Between 19 and 24 h the autogenous shrinkage in-creased by approx. 80 µm/m, whereas the autogenous shrinkage at a constant temperature of 20 °C did not significantly increase after the age of 16 h anymore. Thus, the result would sig-nify that the rate of autogenous shrinkage was considerably increased by higher temperatures. This can be considered plausible, however, further tests are required to validate the method.
0.0
0.1
0.2
0.3
0.4
0.5
0.6
0.7
0.8
0.9
1.0
6 8 10 12 14 16 18 20 22 24
Age [h]
Aut
ogen
ous
shri
nkag
e [m
m/m
]
20
22
24
26
28
30
32
34
36
38
40
Tem
pera
ture
[°C
] Temperature,specimen Temperature,
coolant
shrinkage strain
measured strain
Figure 4–21 Autogenous shrinkage of concrete 1A under non-isothermal conditions
4.7 Summary
The shrinkage cone method for measuring the autogenous shrinkage, developed on the basis of an existing testing apparatus, was examined as to its suitability, reliability and precision. It allows for a precise and efficient measurement of the autogenous shrinkage of cement pastes and mortars containing grains up to 2 mm. A number of tests on the method’s reproducibility and repeatability were carried out sufficient to consider the method validated, validation being limited though to isothermal conditions. The test method allows tests under non-isothermal conditions, too, making it a potential reference method for such tests. In addition, it is compa-rably easy to use and suitable also in the case of sticky and stiff mortars.
For the measurement of the autogenous shrinkage of the investigated concretes, the onset of stress development in restrained ring tests was used as time-zero. The reference concrete 1A
57
yielded the highest autogenous shrinkage until the age of 24 h with approximately 0.69 mm/m. This value was already achieved at about 16 h. The autogenous shrinkage was considerably reduced by the shrinkage-reducing admixture and the superabsorbent polymers. The reduction amounted to 50 % (1A SRA) and 64 % (1A SAP) with respect to the 24 h-value of concrete 1A. In both cases the autogenous shrinkage like with concrete 1A started to converge to an end value. Contrary to that, with concrete 1A BFS the autogenous shrinkage continued to increase at considerable rates from the onset at 15 h to 24 h and reached ap-proximately 0.52 m/m at 24 h.

58
5 Stress and cracks due to restrained autogenous shrinkage
5.1 Introduction
In this chapter the most relevant aspects of restraint stress and cracking due to restraint stresses are described, serving as a general introduction into the subject and the subsequent investigation of the autogenous shrinkage cracking propensity (cf. 6). The first parameter dealt with is the degree of restraint. Its calculation is explained in detail; the given formulas are used later for finding an analytical solution for ring tests under non-isothermal conditions (cf. 6.3.2.3). The next point that is addressed is the formation of cracks; some related aspects like durability, self-healing and the effect of fibers are outlined as well. Then the strong influ-ence of viscoelastic deformations on restraint stress at early age and especially at very early age is discussed; a definition of the very early age is suggested. Also, the difficulties that re-sult from the importance of the very early age in terms of creep investigations are analyzed; it is shown that there is hardly any relevant data for the influence of creep on early age cracking. The stress-strength criterion for quantifying the autogenous shrinkage cracking propensity is described, including its capacities and limitations. The role of temperature is highlighted, be-ing one of the fundamental difficulties in the investigation of restraint stress and related crack-ing. Finally, relevant results on restraint stress and stress-strength ratios obtained by other re-searchers are depicted.
5.2 Degree of restraint
Autogenous shrinkage can lead to significant stresses in hardening concrete if deformations are restrained. Restraint in concrete structures is a common issue and often unavoidable. It can be internal or external, according to whether it originates from the concrete itself or from its surroundings [Ben 04]. In the case of autogenous shrinkage, internal restraint can mainly arise from enclosed aggregates [Iga 02] and reinforcement, external restraint from adjacent structures and from formwork. It was hypothesized that anhydrous cement grains significantly contribute to internal restraint [Lou 99], [Gua 06]. Volume changes due to autogenous shrink-age are largely uniform and therefore do not generate Eigenstresses. Eigenstresses are caused by local gradients of moisture (e.g. due to drying shrinkage) or temperature (e.g. in mass con-crete).
Restraint is either partial or complete. The deformations of the lower concrete layers of a dam during cooling can be considered almost completely restrained by the bedrock [Spr 95b]. However, except for in such special applications restraint is virtually complete only around initial setting and notably decreases with increasing modulus of elasticity of the concrete. The variable degree to which deformations in practice are restrained can be accounted for by the so called degree of restraint. In a general form it can be expressed by the ratio of stiffness of two ideal elastic bodies restraining each other. The stiffness is the ratio of an external force, acting in arbitrary direction on an elastic body of arbitrary geometry, to the resulting non-rigid displacement. (Displacements are called rigid if a body is shifted as a whole, and non-rigid if they occur within the body itself.)
The most simple case is the mutual restraint of two ideal elastic springs 1 and 2 with respec-tive spring constants k1 and k2 and lengths l1 and l2 (Figure 5–1). For any force F, the ratio of deflection of both springs (length change u1 and u2) is constant and equal to the inverse ratio of the spring constants. (In the following, absolute values are considered to avoid signs which
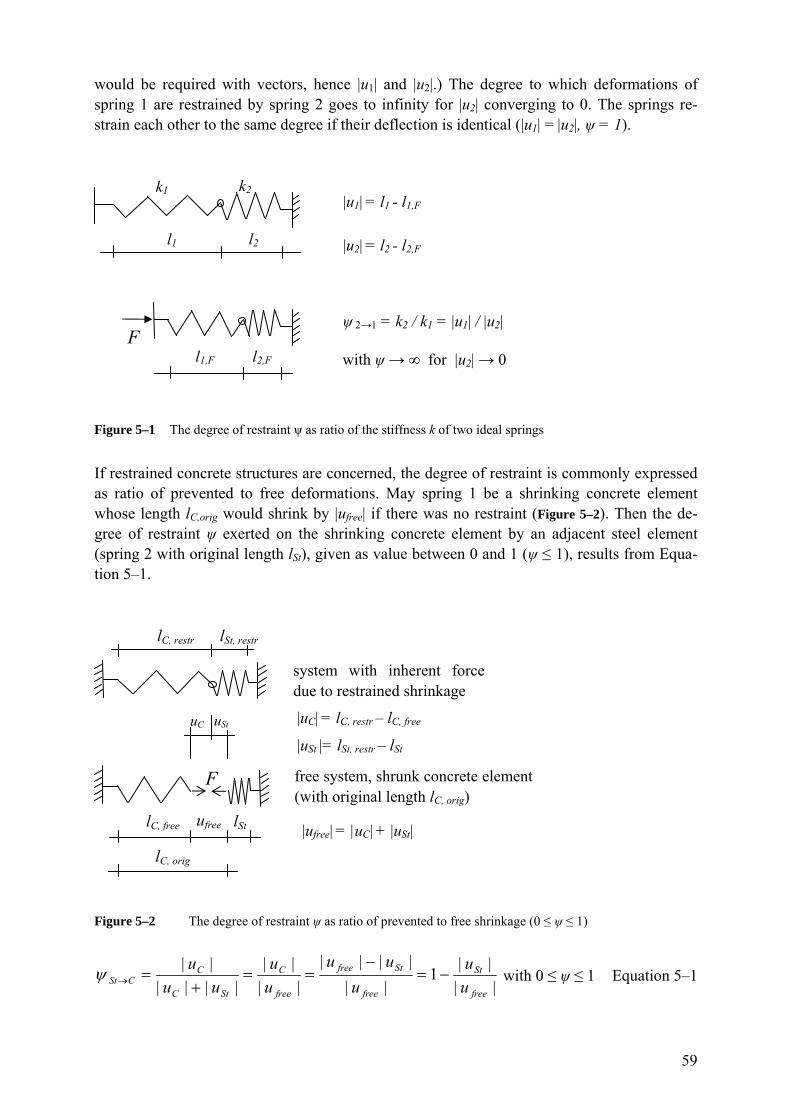
59
would be required with vectors, hence |u1| and |u2|.) The degree to which deformations of spring 1 are restrained by spring 2 goes to infinity for |u2| converging to 0. The springs re-strain each other to the same degree if their deflection is identical (|u1| = |u2|, ψ = 1).
Figure 5–1 The degree of restraint ψ as ratio of the stiffness k of two ideal springs
If restrained concrete structures are concerned, the degree of restraint is commonly expressed as ratio of prevented to free deformations. May spring 1 be a shrinking concrete element whose length lC,orig would shrink by |ufree| if there was no restraint (Figure 5–2). Then the de-gree of restraint ψ exerted on the shrinking concrete element by an adjacent steel element (spring 2 with original length lSt), given as value between 0 and 1 (ψ ≤ 1), results from Equa-tion 5–1.
Figure 5–2 The degree of restraint ψ as ratio of prevented to free shrinkage (0 ≤ ψ ≤ 1)
||
||1
||
||||
||
||
||||
||
free
St
free
Stfree
free
C
StC
CCSt u
u
u
uu
u
u
uu
u
with 0 ≤ ψ ≤ 1 Equation 5–1
|uC| = lC, restr – lC, free
|uSt |= lSt, restr – lSt
system with inherent force due to restrained shrinkage
free system, shrunk concrete element (with original length lC, orig)
lC, restr lSt, restr
lC, free lSt
F
uC uSt
lC, orig
ufree |ufree| = |uC| + |uSt|
|u1| = l1 - l1,F
|u2| = l2 - l2,F
F
l1 l2
l1,F l2,F
k1
with ψ → ∞ for |u2| → 0
k2
ψ 2→1 = k2 / k1 = |u1| / |u2|

60
Depending on the direction of force and displacement, the stiffness is called either exten-sional, flexural or rotational. The extensional stiffness is given as the ratio of a force F and a body’s resultant non-rigid displacement u in the direction of force. It is noted that the dis-placement u can be rewritten as the product of the unit elongation (linear strain) and the ini-tial length l. Furthermore, the linear strain is the ratio of the stress to the modulus of elastic-ity E (Hooke’s Law), and stress is the ratio of the force (load) to the loaded area A. Given this, the axial extensional stiffness kext of an elastic and laterally unrestrained prism can be written as the product of the modulus of elasticity in the direction of force and the cross-sectional area perpendicular to it, divided by the length (Equation 5–2).
l
AE
u
Fk ext
Equation 5–2
Equation 5–2 illustrates that stiffness is not the property of a material but of a three-dimensional body. The extensional stiffness goes to infinity if the length in the direction of force goes to zero. At given length the stiffness increases proportionally with increasing modulus of elasticity. As the modulus of elasticity of concrete increases with time, the stiff-ness of a concrete body increases as well. The stiffness can be calculated for a given point in time if the modulus of elasticity is known. If the stiffness of the restraining counterpart is con-stant, the degree of restraint increases proportionally with the stiffness of the concrete ele-ment.
At given mechanical properties and shrinkage strains, the stress in a concrete element due to restrained shrinkage increases with increasing degree of restraint. If concrete was a purely elastic material, the stresses in a shrinking concrete element within a period of constant modulus of elasticity would be a linear function of the degree of restraint and the free shrink-age strain SH, and in case of either no shrinkage or no restraint the stress would be nil. The stress after arbitrary time intervals i with variable mean modulus of elasticity E and degree of restraint ψ could be calculated by means of Equation 5–3.
i
iiSHi tttEt )()()()(
with 0 ≤ ψ ≤ 1 Equation 5–3
However, concrete is a viscoelastic material. Under load it undergoes time-dependent defor-mations which are partly elastic and reversible and partly plastic and irreversible. These time-dependent deformations may considerably influence the stress, especially at earlier ages when the viscoelastic behavior is more pronounced (5.4).
5.3 Formation of cracks
A crack is a local failure due to stresses. Depending on whether the non-elastic deformations prior to failure are large or small one speaks of ductile or brittle fracture. The failure of plain, hardened cementitious materials is brittle. Concrete is an aging material whose brittleness in-creases with time. The pronounced brittleness of concrete, in conjunction with its relatively high modulus of elasticity, is disadvantageous because the strain capacity in many cases is too small to prevent cracking. Reinforcement with ductile materials, for instance steel, reduces the brittleness.
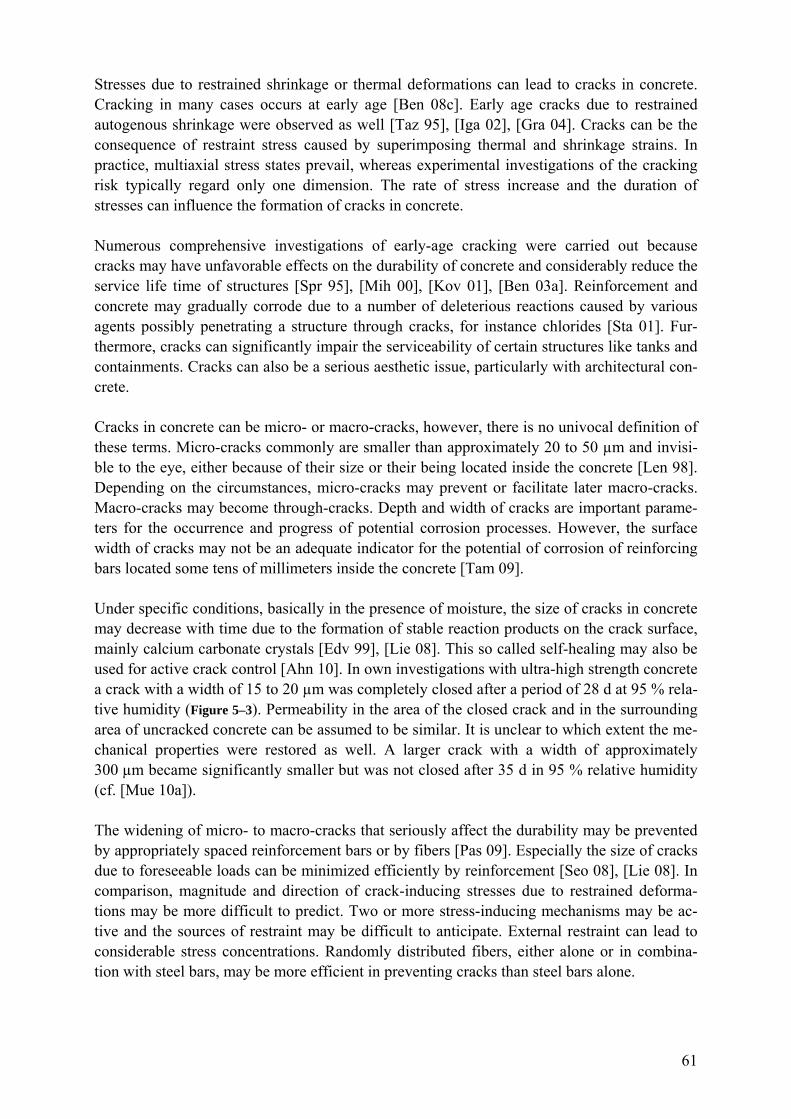
61
Stresses due to restrained shrinkage or thermal deformations can lead to cracks in concrete. Cracking in many cases occurs at early age [Ben 08c]. Early age cracks due to restrained autogenous shrinkage were observed as well [Taz 95], [Iga 02], [Gra 04]. Cracks can be the consequence of restraint stress caused by superimposing thermal and shrinkage strains. In practice, multiaxial stress states prevail, whereas experimental investigations of the cracking risk typically regard only one dimension. The rate of stress increase and the duration of stresses can influence the formation of cracks in concrete.
Numerous comprehensive investigations of early-age cracking were carried out because cracks may have unfavorable effects on the durability of concrete and considerably reduce the service life time of structures [Spr 95], [Mih 00], [Kov 01], [Ben 03a]. Reinforcement and concrete may gradually corrode due to a number of deleterious reactions caused by various agents possibly penetrating a structure through cracks, for instance chlorides [Sta 01]. Fur-thermore, cracks can significantly impair the serviceability of certain structures like tanks and containments. Cracks can also be a serious aesthetic issue, particularly with architectural con-crete.
Cracks in concrete can be micro- or macro-cracks, however, there is no univocal definition of these terms. Micro-cracks commonly are smaller than approximately 20 to 50 µm and invisi-ble to the eye, either because of their size or their being located inside the concrete [Len 98]. Depending on the circumstances, micro-cracks may prevent or facilitate later macro-cracks. Macro-cracks may become through-cracks. Depth and width of cracks are important parame-ters for the occurrence and progress of potential corrosion processes. However, the surface width of cracks may not be an adequate indicator for the potential of corrosion of reinforcing bars located some tens of millimeters inside the concrete [Tam 09].
Under specific conditions, basically in the presence of moisture, the size of cracks in concrete may decrease with time due to the formation of stable reaction products on the crack surface, mainly calcium carbonate crystals [Edv 99], [Lie 08]. This so called self-healing may also be used for active crack control [Ahn 10]. In own investigations with ultra-high strength concrete a crack with a width of 15 to 20 µm was completely closed after a period of 28 d at 95 % rela-tive humidity (Figure 5–3). Permeability in the area of the closed crack and in the surrounding area of uncracked concrete can be assumed to be similar. It is unclear to which extent the me-chanical properties were restored as well. A larger crack with a width of approximately 300 µm became significantly smaller but was not closed after 35 d in 95 % relative humidity (cf. [Mue 10a]).
The widening of micro- to macro-cracks that seriously affect the durability may be prevented by appropriately spaced reinforcement bars or by fibers [Pas 09]. Especially the size of cracks due to foreseeable loads can be minimized efficiently by reinforcement [Seo 08], [Lie 08]. In comparison, magnitude and direction of crack-inducing stresses due to restrained deforma-tions may be more difficult to predict. Two or more stress-inducing mechanisms may be ac-tive and the sources of restraint may be difficult to anticipate. External restraint can lead to considerable stress concentrations. Randomly distributed fibers, either alone or in combina-tion with steel bars, may be more efficient in preventing cracks than steel bars alone.
62
Figure 5–3 Electron-microscopical image of a crack in ultra-high strength concrete with an original width of approx. 15 to 20 µm (left), after 7 days in 95 % RH (centre) and after 28 days in 95 % RH (right); concrete 1A (cf. Table 3–1), cf. [Mue 10a]
Although ultra-high strength concrete in most applications is reinforced with fibers, the as-sessment of the cracking risk for a number of reasons needs to be based on investigations with unreinforced concrete. Crack-inducing stresses due to restrained autogenous shrinkage can occur shortly after the solidification of ultra-high strength concrete. The influence of stress re-laxation during that period is particularly strong and not fully understood (5.4, 5.5). Fiber re-inforcement leads to a complex composite system that is even more difficult to investigate than plain concrete.
The behavior of the composite system is influenced by the bond between concrete and rein-forcement which in turn depends on the mechanical properties of the concrete [Mue 10c]. These properties change rapidly at very early age. Furthermore, typical amounts of fibers (approx. 1 to 6 Vol.-%) do not completely prevent the formation of micro-cracks. Whether fi-bers are able to transfer tensile stresses across micro-cracks in a way that prevents the appear-ance of macro-cracks depends on numerous parameters, for example the type, the amount, the distribution and the orientation of fibers [Mec 05]. Finally, stress concentrations may occur in areas with less or unfavorably oriented fibers.
These were the main reasons not to consider fibers in this study. Nevertheless the reinforce-ment of ultra-high strength concretes with fibers in practice will remain the principal solution for optimizing its performance, and substantial progress was made in that field of research in the past decade [For 05], [Uch 05], [Hab 06].
The primary way to avoid cracks due to restraint stress in unreinforced concrete would be to avoid deformations. Although autogenous shrinkage is caused by a lack of water, external curing with water in most cases can hardly mitigate the internal desiccation since relevant types of concrete have few capillary pores which would take up the water in time [Ben 04] (cf. 2.1). This gives particular importance to modifications of concrete compositions that are suited to reduce the autogenous shrinkage without compromising desired properties. Three principal measures have been suggested: the use of supplementary cementitious materials, the addition of chemical admixtures and internal water-curing (cf. 2.5.3). All three measures were adopted in this study (cf. 3.2).
63
5.4 Very early age and importance of stress relaxation
Concrete is generally considered a viscoelastic material. Accordingly, the load-dependent de-formations are the sum of immediate elastic and time-dependent viscous (or ‘viscoelastic’) deformations [VDZ 08]. Deformations due to viscous flow are partly elastic (reversible) and partly plastic (irreversible). The hardening or hardened cement paste, in particular the water contained in it, is constitutive for the viscous deformation component. Due to the increasing formation of micro-cracks, the fraction of plastic deformations in the viscous deformations in-creases at stress levels beyond approximately 40 % [Mue 09], [Atr 03].
Phenomenologically, the time-dependent deformations strongly depend on the age at loading and the stress-strength ratio. Viscous deformations are larger at earlier loading ages and at higher stress levels. The viscoelastic behavior of concrete commonly is investigated with creep and relaxation tests, carried out at different stress levels and for different loading ages of at least 1 d, furthermore at constant room temperature. In these tests, creep is time-dependent deformation due to constant stress, and relaxation is time-dependent decrease of stress due to constant deformation. Load-independent deformations within the test period need to be measured and accounted for as well.
Results are used for setting up so called compliance functions which describe the long-term deformations of concrete under load. Apart from the measured deformations, empirical mod-els for predicting creep typically consider the concrete’s modulus of elasticity and compres-sive strength at 28 d, the geometry of the concrete member, the relative humidity of the ambi-ent environment as well as factors that may strongly influence the hydration progress, in first place the type of cement and the temperature [Baz 01], [Mue 09], [Atr 03], [VDZ 08], [fib 10].
A large part of the autogenous shrinkage of ultra-high strength concrete takes place within the first 24 h (cf. 2.5 and 4.5). High stress levels can occur few hours after solidification if defor-mations are restrained. In that case the viscous deformations are very large and strongly re-duce the stress that would arise at purely elastic behavior, the so called ‘theoretical-elastic’ stress [Epp 08c].
In tests with three different ultra-high strength concretes made from ordinary Portland cement the actual restraint stress at the age of one day was approximately 10 % of the theoretical-elastic stress [Sch 07]. Hence, 90 % of the stress that would have occurred under restraint conditions if the concrete behaved completely elastically, were eliminated by relaxation. In addition, the modulus of elasticity between 12 h and 3 d was tested; a compressive stress of one third of the compressive strength was applied for 10 s. The time-dependent (viscoelastic) deformations after that short period were divided by the instantaneous elastic deformations. The ratio exponentially increased with decreasing age (Figure 5–4).
Hence, the influence of creep and relaxation on restraint stresses shortly after solidification can be very strong. In comparison, restraint stresses due to negative thermal strains develop not until the concrete temperature starts to decrease, hence, several or many hours after solidi-fication (cf. e.g. [Bre 89]). To adequately specify this difference, it is helpful to differentiate between ‘early age’, a well-established term for the first days of hardening, and ‘very early

64
age’. Actually, the latter term is already in use [Bou 08b], [Ham 01], [Ong 06], [Rad 98], [Ste 09]. However, a threshold that separates early and very early age was not agreed upon, yet.
0.25 0.5 0.75 1 7 14 21 28
Rat
io o
f vi
scoe
last
ic to
el
astic
def
orm
atio
ns [
%]
0
5
10
15
20
Age [d]
Range of 24 results, 3 different ultra-high strength concretes
Figure 5–4 Ratio of time-dependent viscoelastic deformations after 10 s of stress of 1/3 of the compressive strength to the immediate elastic deformations (from [Sch 07])
The definition that is suggested for the term ‘very early age’ is illustrated in Figure 5–5. The figure comprises the principal types of tensile restraint stress. Their typical onset is related to the qualitative course of temperature in a small or medium-sized concrete element, stored at constant temperature. The temperature peak is due to heat of hydration. Stresses due to re-strained autogenous shrinkage can occur from solidification and prior to the maximum rate of heat release, stresses due to thermal contraction only after the concrete has started to cool down. Stresses due to drying shrinkage typically begin even later.
The stress relaxation capacity strongly decreases with time [Atr 03]. It is very high at very early age, as was shown above. Stress relaxation still can have a very notable influence on stresses due to negative thermal strains, yet, reasonable results in some cases were achieved without its consideration [Spr 95b], [Thi 95]. Elastic relations may be sufficient to predict stresses due to restrained drying shrinkage, however, creep and relaxation are still noticeable [Bis 07].
It is suggested to use the term ‘very early age’ for the period from solidification to the mo-ment the concrete temperature starts to decrease. A superposition of tensile stresses due to autogenous shrinkage and thermal contraction according to this definition can occur only after the end of the very early age, i.e. at early age. Increasing temperatures at very early age would have the usually beneficial effect to counteract the negative strains due to shrinkage. Notably, this does not predetermine the worst case in terms of cracking. Temperature changes do not only cause thermal strains, they also influence the autogenous shrinkage as well as the me-chanical properties. Cracking at very early age is a consequence of the interaction of these pa-rameters.

65
AgeS
tres
s re
laxa
tion
capa
city
Con
cret
e te
mpe
ratu
re
Later Age
stress due to restr. autogenous shrinkage
stress due to restrained thermal contraction
stress due to restrained drying shrinkage
max. rate of heat release
Very Early Age Early Age
Con
cret
e te
mpe
ratu
re
Later Age
stress due to restr. autogenous shrinkage
stress due to restrained thermal contraction
stress due to restrained drying shrinkage
max. rate of heat release
Very Early Age Early Age
very high
very low
Figure 5–5 Very early age: period from solidification (first appearance of stress due to restrained autogenous shrinkage) to maximum temperature, characterized by very high stress relaxation capacity
The fact that stresses and cracking due to restrained autogenous shrinkage at very early age are strongly influenced by the high stress relaxation capacity make the experimental investi-gation and the mathematical description of these phenomena more difficult than they are at early age. However, no complete assessment of the cracking risk of ultra-high strength con-crete is feasible without a quantification of this influence.
5.5 Creep and cracking - further methodological aspects
The essential task of most investigations of creep of concrete is to predict the long-term de-formations that occur in structures due to dead loads or post-tensioning forces. The thorough understanding of time-dependent deformations is vital. An unfortunate example is the Koror-Babeldaob Bridge in Palau. At the time of its erection in 1977 it was the world’s largest prestressed concrete box girder bridge. It collapsed in 1996, basically due to wrong estima-tions of tensile creep; two people were killed [Baz 08], [Kri 08].
The experimental investigation and mathematical description of creep and relaxation of con-crete is largely based on the assumption of linear viscoelasticity. According to this concept the time-dependent deformations are proportional to the imposed stresses. This assumption is ap-propriate for stress levels below 40 to 50 %, i.e. in the range of service loads. For this reason most experiments are carried out at stress-strength ratios below 50 to 60 % [Mue 09].
Another assumption that is usually made in empirical creep models is the superposition prin-ciple. Accordingly, creep due to variable stresses is the sum of the creep deformations at each stress increment, i.e. a potential influence of the stress history on creep is neglected. This al-lows for a relatively straightforward consideration of the aging of concrete, i.e. the develop-ment of mechanical properties that changes the stress level after loading. Compared to the rapid development of mechanical properties of ultra-high strength concrete at very early age,
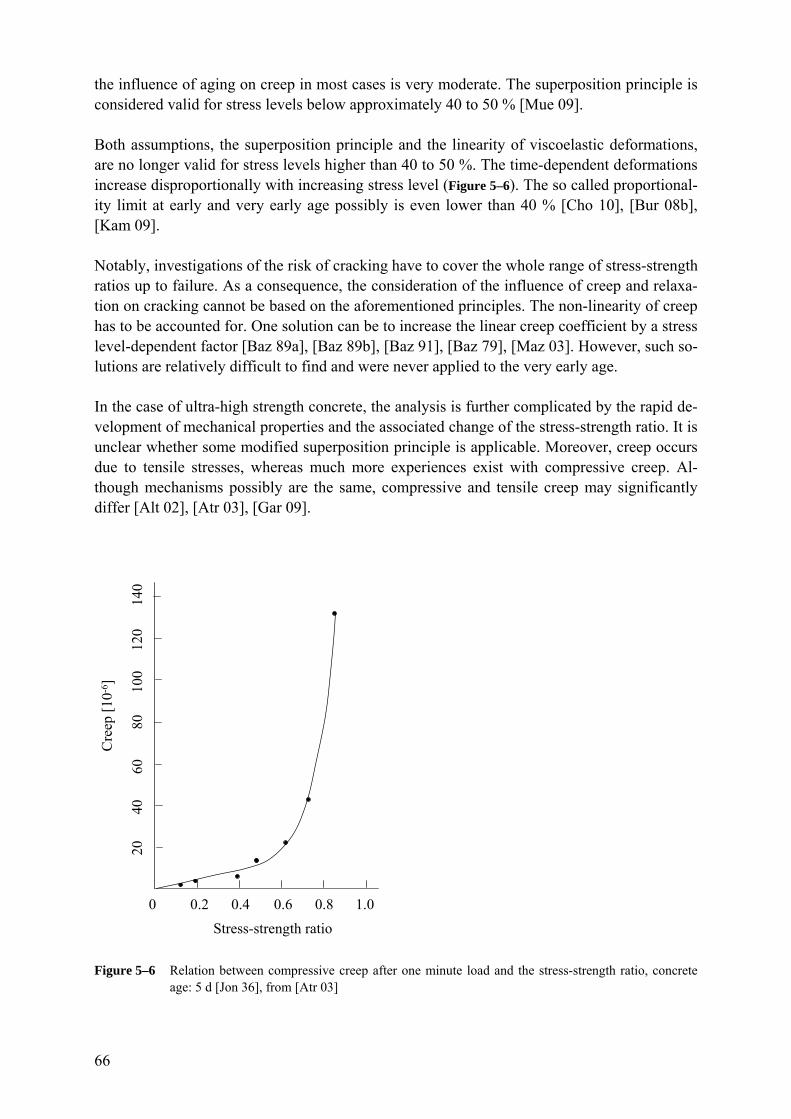
66
the influence of aging on creep in most cases is very moderate. The superposition principle is considered valid for stress levels below approximately 40 to 50 % [Mue 09].
Both assumptions, the superposition principle and the linearity of viscoelastic deformations, are no longer valid for stress levels higher than 40 to 50 %. The time-dependent deformations increase disproportionally with increasing stress level (Figure 5–6). The so called proportional-ity limit at early and very early age possibly is even lower than 40 % [Cho 10], [Bur 08b], [Kam 09].
Notably, investigations of the risk of cracking have to cover the whole range of stress-strength ratios up to failure. As a consequence, the consideration of the influence of creep and relaxa-tion on cracking cannot be based on the aforementioned principles. The non-linearity of creep has to be accounted for. One solution can be to increase the linear creep coefficient by a stress level-dependent factor [Baz 89a], [Baz 89b], [Baz 91], [Baz 79], [Maz 03]. However, such so-lutions are relatively difficult to find and were never applied to the very early age.
In the case of ultra-high strength concrete, the analysis is further complicated by the rapid de-velopment of mechanical properties and the associated change of the stress-strength ratio. It is unclear whether some modified superposition principle is applicable. Moreover, creep occurs due to tensile stresses, whereas much more experiences exist with compressive creep. Al-though mechanisms possibly are the same, compressive and tensile creep may significantly differ [Alt 02], [Atr 03], [Gar 09].
0 0.2 0.4 0.6 0.8 1.0
Stress-strength ratio
8010
012
040
2060
140
Cre
ep [
10-6
]
Figure 5–6 Relation between compressive creep after one minute load and the stress-strength ratio, concrete age: 5 d [Jon 36], from [Atr 03]
67
Very few investigations of tensile creep were carried out that considered stress levels beyond the proportionality limit. No such investigation is known that would have included the very early age. Yet, there are some investigations that addressed in some way one of the elements of the problem, either tensile creep, ultra-high performance concrete, the very early age or very high stress levels.
Creep under compression at very early age was analyzed in [Cho 10]. The stress level was 20 %. The focus was on separating quasi-instantaneous and time-dependent deformations. It was found that the solidification theory ([Baz 89a], [Baz 89b]) underestimated creep and that the rate of stress increase had to be accounted for to satisfactorily model creep at very early age.
Basic creep of C-S-H phases from the point of solidification was treated in [Ste 09]. It was tried to model the creep compliance with the ‘effective Young’s modulus’ concept. The ef-fects of aging could not be satisfactorily embodied.
A comprehensive study of tensile and compressive creep at early age was presented by Atrushi [Atr 03]. The experiments with high performance concrete considered stress levels up to 80 % and ages at loading of 1 to 8 d. The term ‘sealed creep’ was introduced to account for the unavoidable drying creep component due to autogenous shrinkage. Creep was higher un-der tension than under compression. The proportionality limit for tensile creep was found at a stress level of approximately 60 % (age at loading: 1 d). Model parameters obtained from compressive creep tests led to a better agreement between calculated and measured tensile creep than the parameters obtained from tensile creep tests. As a possible explanation the au-thor mentioned the uncertainties in separating tensile creep and autogenous shrinkage. Addi-tional tests of stress relaxation at different temperature levels led to inconsistent results.
Very high stress levels were considered in a study on tensile creep of high strength concrete [Rei 06]. Specimens were loaded at the age of 28 d. Failure occurred after seconds or few minutes at stress-strength ratios of 90 and 95 %. Specimens did not fail at a stress level of 80 % maintained for two years. It was found that loaded concrete shrank and hydrated more than non-loaded; similar results previously had been found by Kovler [Kov 99].
Recently Garas et al. presented a study on the tensile creep behavior of ultra-high strength concrete incorporating steel fibers [Gar 09]. Specimens were cured at different temperatures and loaded at 7 d to stress-strength ratios of 40 or 60 %. Thermal treatment at 90 °C for 48 h and the incorporation of steel fibers were found to reduce the tensile creep after 7 d of load-ing.
A model for the early-age stress development that considered tensile creep was proposed [Pan 08b]. The model was based on a comprehensive investigation of splitting tensile strength, modulus of elasticity, autogenous shrinkage, coefficient of thermal expansion and heat of hy-dration [Pan 08a]. Good agreement between model and measurements were found, however, experiments were limited to a stress level of 30 %.
Kamen et al. investigated the early age viscoelastic behavior of fibre reinforced ultra-high strength concrete under tension [Kam 09]. Specimens were loaded at the age of 35, 46 and 72 h, the stress level ranged from 30 to 63 %. The proportionality limit was found at a stress
68
level of 35 %. The undertaken numerical simulation based on Maxwell chains led to a reason-able agreement with test results, however, only within the proportionality limit.
A comprehensive study of creep of ultra-high strength concrete was carried out by Burkhart and Müller [Bur 08a], [Bur 08b]. Specimens were loaded at 1, 3 and 28 d and stress levels used were 30 and 60 %. Creep was much higher at earlier age at loading. The final scope of the study is a thermodynamically sound constitutive nonlinear model.
More investigations and models could be added, for instance [Pig 00], [Mar 02], [Tao 06], [Koe 08], [Sch 09], [Swi 09], [Swi 10] as well as the valuable summary of early age creep compiled by Lange and Altoubat [Lan 03]. However, the essence would not change: there is no investigation that focused on tensile creep at early or very early age with stress levels close to cracking, and none of the existing models can provide a precise solution of this problem.
Experimentally, the combination of very high stress levels, tensile forces and a start of tests from shortly after the solidification represents an enormous challenge. Such investigations in principle can be carried out with temperature-stress testing machines or similar uniaxial stress rigs (cf. 6). However, few institutions dispose of such a machine and very few of more than one. At high stress levels, specimens may easily fail prematurely due to imperfections, stress concentrations and overestimation of the tensile strength. As a consequence, a large number of tests is required. Insofar the considerable costs for tests with temperature-stress testing ma-chines represent a significant disadvantage. Technical shortcomings will be addressed in chapter 6.
Conventional creep tests require a constant stress. Thus, such tests are designed in accordance with the requirements of structural engineers to predict the deformations for a period of 50 to 100 years. The loads in most cases are constant and well known in advance.
In the case of restrained autogenous shrinkage of ultra-high strength concrete the situation is completely different. The load is a complex function of autogenous shrinkage, modulus of elasticity and relaxation. The autogenous shrinkage depends on the concrete composition and in a hardly understood way on temperature, and the modulus of elasticity changes with time and temperature. Furthermore, cracking is not a matter of years but of hours.
The considerable experimental and mathematical difficulties described above as well as the fundamental differences between long-term creep due to service loads and relaxation-dependent cracking give good reason to question whether the conventional approach is appro-priate for the investigation and description of the influence of creep and relaxation on stresses and cracking due to restrained autogenous shrinkage. Possibly a different approach would be more efficient.
In the passive restrained ring test, strains and stresses cannot be controlled and therefore not kept constant. However, there are also remarkable advantages. The test is relatively simple and economic, hence a large number of tests is feasible and premature failure is no issue. Due to the geometry no coupling elements are required and stress concentrations are negligible, so the test can capture the entire stress development due to restrained shrinkage without any problems, including the very early age.
69
The influence of time-dependent deformations on stresses in restrained ring tests can be quan-tified by relating the actual stress to the theoretical-elastic stress (cf. 6.3.2.2). The suitability of this approach for the very early age was not analyzed, yet. This is done below (6.4.5.3 and 6.4.11).
5.6 Autogenous shrinkage cracking propensity
The principal goal of investigations of restraint stresses in concrete is to quantify the risk of cracking. This risk commonly is investigated one-dimensionally and specified as stress level, i.e. as ratio of uniaxial tensile stress to uniaxial tensile strength [Bre 00], [Miz 00], [Ros 00], [Sch 07], [Hay 08b]. Cracking is expected to occur at latest at a ratio of 1. The stress-strength criterion is to indicate the risk of crack initiation [Kan 08]; a precise description of the crack growth requires a fracture mechanical approach [Mue 02], [Mec 00], [Bra 88]. Alternatively, a strain criterion can be applied to assess the risk of crack initiation. Accordingly, cracking would be supposed to occur if the ultimate tensile strain is reached. The stress-strength crite-rion was considered more reliable than the strain criterion [Ham 07].
A general problem is the precise quantification of the resistance to failure. Uniaxial tensile strength tests are difficult to carry out, in particular at very early age. Some kind of mechani-cal coupling between specimen and testing machine is required. Usually steel parts are used which either clamp the specimen, are embedded in the concrete or glued to the specimen’s surface [Kas 75], [Ham 07]. The mechanical coupling of specimens during or shortly after so-lidification is particularly demanding. Also, results of uniaxial tensile strength tests are influ-enced by test geometry and setup.
To determine the resistance to failure, splitting tension tests often are preferred to uniaxial tests since they are easier to perform. Results can be converted to the uniaxial tensile strength by empirically determined coefficients. However, results of splitting tension tests depend on a number of parameters, for instance the type, size and age of the specimen; widely differing coefficients have been suggested [Roc 99], [Mal 07], [fib 08]. Olesen et al. pointed out the non-elastic failure at early age [Ole 06]. Malarics et al. showed that no single formula is suit-able for the conversion of splitting into uniaxial tensile strength values [Mal 10]; for cylindri-cal specimens with diameter and width of 150 mm and 300 mm, respectively, it was found that the ratio of uniaxial to splitting tensile strength considerably increased with decreasing concrete strength (Figure 5–7). A similar tendency was observed in [Sch 07].
The stress-strength criterion is based on several simplifying assumptions. First, strength is as-sumed to develop equally under restrained and under free conditions, i.e. independent of the stress history. Yet, it is known that compressive forces can increase the strength when exerted on hardening concrete [Ric 95]. Tensile forces can have an opposite effect [Tao 06], [Hay 08b]. They may promote micro-cracking [Alt 02] and, at very high stress levels, alter hydra-tion through changes in the state of water [Rei 06].
Second, it is assumed that the influence of different loading rates on failure is negligible. The loading rate in static short-time tensile strength tests exceeds that in tests under restraint con-ditions many times over. Plastic deformations, more pronounced at earlier age, possibly alter the failure mechanism under restraint [IPACS].

70
0.0
0.5
1.0
1.5
2.0
0 40 80 120
Compressive strength [MPa]
Rat
io o
f un
iaxi
al to
sp
litt
ing
tens
ile
stre
ngth
[-]
gravel aggregate
crushed aggregate
Figure 5–7 Ratio of uniaxial to splitting tensile strength as function of concrete compressive strength for two concretes with crushed and gravel aggregate, respectively (from [Mal 10])
Third, the stress-strength ratio usually is determined in a limited range. Two concretes with an identical maximum stress-strength ratio of e.g. 0.5 may have a different stress relaxation ca-pacity beyond that stress level. Hence, in practical applications with higher stress levels they may turn out to have a different propensity to form cracks.
In conclusion, the assessment of the risk of cracking due to autogenous shrinkage by means of the stress-strength failure criterion presently is an approximate solution. In particular, the rela-tion may not be linear. In other words, cracking is surely more probable at a ratio of 0.8 than at 0.4 but not necessarily twice as probable.
In view of these uncertainties and the scarce knowledge about the influence of creep and tem-perature, the term ‘cracking risk’, often associated with a probability of cracking, in the case of restrained autogenous shrinkage appears less suitable. To avoid a statistical connotation and to indicate the remaining uncertainties, here the term ‘autogenous shrinkage cracking propensity’ is used instead.
5.7 Role of temperature history
The autogenous shrinkage as well as the mechanical properties of concrete at early and very early age are considerably influenced by temperature (2.1, 2.5.2). This also appears to hold true for the autogenous shrinkage cracking propensity [Mar 08]. Few investigations of the autogenous shrinkage cracking propensity of ultra-high strength concrete were carried out; in-sofar it is not surprising that even less investigations considered the influence of temperature and that there is hardly any relevant data. The methodological challenges are considerable. Nevertheless, tests at a constant temperature of for instance 20 °C do not represent realistic on-site conditions and are, at least for the time being, only a provisional basis for the assess-ment of the cracking propensity of different concretes.
71
Experimentally, the major problem is that temperature changes influence strains and stresses in two ways: they alter the autogenous shrinkage and they lead to thermal strains. Since no general relation between temperature regime and autogenous shrinkage was found yet, the co-efficient of thermal expansion of the concrete is required to individually account for the ef-fects of thermal and shrinkage deformations. Notably, the coefficient of thermal expansion varies with the concrete, the concrete age and the temperature regime. It is very difficult and laborious to precisely measure its development (2.3.3).
From an engineering point of view, two scenarios need to be distinguished: temperature ef-fects due to heat of hydration and those due to changes of the ambient temperature. The latter involves arbitrary curves of concrete temperature. Stresses due to restrained autogenous shrinkage can be superimposed by stresses due to restrained thermal expansion or contraction at any point of time. This scenario is common in practice. Generally, the worst case is a strong temperature decrease in the period of highest autogenous shrinkage cracking propensity. Then the stresses due to thermal contraction add up to those due to autogenous shrinkage. Such complex situations will not be further considered herein, however it should be kept in mind that cracks are possible even if the autogenous shrinkage cracking propensity is not very high.
The other scenario of virtually constant ambient temperatures is less complex and therefore more suitable for gradually improving the understanding of the influence of temperature on autogenous shrinkage, restraint stress and cracking propensity. Also, in a number of applica-tions, for instance in precast works, this scenario comes relatively close to the real conditions. Accordingly, temperature changes are caused only by heat of hydration. Their magnitude mainly depends on the size of the concrete element and on the concrete composition. To fur-ther reduce the complexity, thermal strains can be completely eliminated (quasi-isothermal conditions).
In detail, four cases can be specified (Figure 5–8). The first and easiest case is a constant con-crete temperature equivalent to the common laboratory temperature, in Germany e.g. 20 °C. No additional temperature control is required to avoid a significant temperature increase due to heat of hydration if specimens are sufficiently small. The second case comprises investiga-tions at other practically relevant temperature levels, approximately in the range of 0 to 75 °C (concrete temperature). The higher the temperature level, the more difficult it becomes to pro-vide for quasi-isothermal conditions because the temperature increase becomes larger with in-creasing hydration rate. The third case are combinations of different temperature levels, for instance a temperature of 40 °C until shortly before the onset of autogenous shrinkage and 20 °C afterwards. Thus the influence of temperature history can be investigated without the need of separating thermal and shrinkage strains. The forth case are variable concrete tem-peratures as they occur in medium-sized or large concrete elements if the concrete tempera-ture is not actively controlled. In this case it is indispensable to know the thermal strains in order to analyze the influence of temperature on stresses and cracking due to restrained auto-genous shrinkage.

72
20 °C
Age
Temperature
case 1
case 2
case 2
case 3
case 4
Figure 5–8 Four cases relevant for the experimental clarification of the influence of temperature on the auto-genous shrinkage cracking propensity
Presently, the autogenous shrinkage cannot be modeled as function of temperature and time (2.5.2). Likewise, no general relation exists between temperature regime and autogenous shrinkage cracking propensity. Not even a tendency can be given. Hence, there is also no way to establish which temperature regime is worst in terms of cracking. A concrete could be less prone to cracking than another at a given temperature regime, but more if the temperature re-gime is different, irrespective of whether the temperature is constant or variable.
In conclusion, a stepwise, systematical investigation is essential to better understand the influ-ence of temperature and to find out whether there are large differences in the autogenous shrinkage cracking propensity at different temperature regimes. Tests under quasi-isothermal conditions may or may not be a suitable way for comparing different concretes in that regard. Possibly the improved understanding will allow for omitting the most difficult and laborious case of variable temperatures in the future.
5.8 Further state of knowledge
5.8.1 Preliminary remarks on test methods
The following section is to summarize the most relevant results of previous quantitative in-vestigations concerned with the cracking risk or stresses due to restrained autogenous shrink-age. The existing test methods can be subdivided into three groups: (1) tests with temperature-stress testing machines and other uniaxial stress rigs, (2) restrained ring tests and (3) other test methods. The test methods used most frequently, the temperature-stress testing machine and the restrained ring test, will be discussed in detail in chapters 6.2 and 6.3, respectively.
The most common test method of the third group is based on restraint due to reinforcement. Restraint stress in a prismatic concrete member can be calculated from the deformations of re-inforcement bars [Sat 99], [Mat 99], [Ohn 99], [Sul 01], [Ima 04], [Cus 05]. Sato et al., for in-stance, found a reasonable agreement of predicted and measured stresses due to restrained thermal strains and autogenous shrinkage [Sat 99]. As was pointed out above, tests with rein-forced concrete are more difficult to evaluate (5.3, cf. also [Sul 04]). Here, only investigations of unreinforced concrete will be considered.

73
Bentz et al. embedded a spherical sensor in sealed cement paste. The sensor consisted of two connected glass marble halves and contained a special wire whose conductivity changed with the surrounding pressure [Ben 01b]. This method may be a valuable alternative for the inves-tigation of stresses due to autogenous shrinkage restrained by large aggregates. Bentur and Kovler, who classified early age cracking test methods, in addition mentioned panel tests which commonly are used to investigate plastic shrinkage cracking, and tests in which cracks result from non-uniform stresses in overlays or repair coatings which are restrained by the substrate [Ben 03b]. Here, these test methods are disregarded as they are not or less suitable for a comprehensive assessment of the autogenous shrinkage cracking propensity.
5.8.2 Quantitative investigations under restraint conditions
Schachinger et al. conducted tests with ultra-high strength concrete in a cracking frame, the precursor of the temperature-stress testing machine (cf. 6.2). They found that the maximum cracking risk, expressed as ratio of restraint stress to splitting tensile strength, was approxi-mately 0.5 for ultra-high strength concrete made with a slag cement [Sch 02]. For ultra-high strength concrete with ordinary Portland cement, the ratio of stress to splitting tensile strength partly exceeded 1 between the age of 9 and 13 h, however, no cracks were observed. Schachinger attributed this to the fact that the uniaxial tensile strength at early age was higher than the splitting tensile strength [Sch 07] (cf. Figure 5–7).
Several investigations were carried out by means of temperature-stress testing machines. Ha-yano et al. found that the stress-strength ratio of high-strength concrete increased with de-creasing water-cement ratio [Hay 08b] (Figure 5–9). In their study the uniaxial tensile strength at 7 d was measured directly in the temperature-stress testing machine on two specimens per concrete. For the age of 1, 3 and 7 d splitting tension tests on cylinders were carried out as well. The splitting tensile strength at the age of 7 d was similar to the uniaxial tensile strength. The ratio of stress to splitting tensile strength of the concrete with the lowest water-cement ra-tio (0.20) was between 0.8 and 0.9 at the age of 1, 3 and 7 d. Remarkably, the stress-strength ratio did not change very much with time, although the maximum restraint stress was reached after approximately 2 d (cf. [Hay 08b]). No cracks were observed.
0
20
40
60
80
100
0 1 2 3 4 5 6 7
Age (days)
Str
ess-
stre
ngth
rat
io (
%)
0.20
0.25
0.30
0.35
Figure 5–9 Influence of water-cement ratio (0.20, 0.25, 0.30, 0.35) on stress-strength ratio, from [Hay 08b]
Several other investigations with temperature-stress testing machines showed that pre-saturated light-weight aggregates and porous ceramic aggregates as well as expansive agents and shrinkage reducing agents can significantly reduce the stresses due to restrained autoge-

74
nous shrinkage [Cus 05], [Suz 08], [Tan 08]. The maximum stress-strength ratio of high strength concrete that contained an expansive agent was less than 0.15 at 1, 3 and 7 d, whereas similar concretes without the expansive agent led to much higher stress-strength ra-tios [Hay 08b], cf. also Figure 5–9.
Bouasker et al. investigated the influence of temperature on stresses and cracking. Restrained ring tests with sealed cement pastes at constant temperatures of 20 °C and 25 °C were carried out [Bou 08a]. (The measurement setup employed is shown in Figure 6–7). The age at cracking was lower at higher temperature (Figure 5–10); the degree of hydration at cracking, simulated with the model CemHyd3D, was similar for both temperature histories (Figure 5–11).
-25
-20
-15
-10
-5
0
5
0 20 40 60 80 100 120 140
Age (h)
Ste
el r
ing
defo
rmat
ions
(10
-6)
20 °C
25 °C
Cracking of the cement paste
Figure 5–10 Restrained ring tests on cement paste, w/c = 0.30, constant temperatures of 20 °C and 25 °C: steel ring deformation vs. age [Bou 08a]
-25
-20
-15
-10
-5
0
5
0 0.1 0.2 0.3 0.4 0.5 0.6 0.7
CemHyd3D hydration degree (-)
Ste
el r
ing
defo
rmat
ions
(10
-6)
20 °C25 °C
Figure 5–11 Restrained ring tests on cement paste, w/c = 0.30, constant temperatures of 20 °C and 25 °C: steel ring deformation vs. simulated degree of hydration [Bou 08a]
Weiss et al. conducted restrained ring tests on cement paste to investigate the influence of a shrinkage-reducing admixture [Wei 08]. A dual ring was employed to also monitor compres-sive stresses (cf. Figure 6–4). Specimens were sealed until the age of 7 d. The tensile stress at

75
that age was approx. 3.5 MPa and 2.5 MPa in pure cement paste and in cement paste with shrinkage reducing admixture, respectively (Figure 5–12). Visible cracks occurred only after drying from the top was allowed for.
Sealed Drying at 50 % RH
w/c = 0.30
w/c = 0.30 + 5% SRA
Tension
CompressionTime of visible cracking
-1.5
0.0
1.5
3.0
4.5
6.0
0 24 48 72 96 120 144 168 192 216 240 264
Age of Specimen (Hours)
Res
idua
l S
tres
s (M
Pa)
Figure 5–12 Restrained ring tests (dual ring) on cement paste with and without shrinkage-reducing admixture (SRA) (from [Wei 08])
Bentz et al. investigated the influence of cement fineness on stresses [Ben 08b]. Again, a dual ring was employed. Tests were carried out at constant temperature of 23 °C. Two Portland cements (ASTM type I/II) were used with a fineness of 380 cm²/g and 311 cm²/g, respec-tively. The water-cement ratio was 0.35 and the cement pastes contained 0.5 % of a water-reducing agent. The finer cement caused early age cracking while the coarser cement did not (Figure 5–13). The coarser cement between approximately 10 and 60 h led to compressive stresses, whereas the finer cement caused tensile stresses during the whole test period.
-1.0
0.0
1.0
2.0
3.0
0 12 24 36 48 60 72 84 96 108 120
Time (h)
Res
idua
l Str
ess
(MP
a)
Fine Cement
Coarse Cement
Figure 5–13 Restrained ring tests (dual ring) on sealed cement paste: influence of fine (380 cm²/g) and coarse (311 cm²/g) cement (w/c = 0.35, T = 23 °C, 0.5 % water-reducing agent) [Ben 08b]

76
Hossain et al. employed the restrained ring test to investigate restraint stresses due to autoge-nous and drying shrinkage [Hos 08a], [Hos 08b]. The focus of the investigations was on the effect of different fly ashes. The authors used a typical ASTM class F fly ash and an ultra-fine fly ash with a mean particle size of 25 µm and 3 µm, respectively. The mortars that were pro-duced contained 50 Vol.-% of sand. The water-cement ratio was 0.35, cement ASTM type I was used. Since the concrete ring and the specimens for free shrinkage had relatively large cross sections (approx. 65 x 75 mm² and 75 x 75 mm², resp.) a temperature increase of more than 5 K was observed due to heat of hydration within the first 24 h. No attempt was made to separate thermal and shrinkage strains and their effect in restrained ring tests during this pe-riod. The cracking propensity after that age was quantified as ratio of restraint stress to split-ting tensile strength, however, rings were allowed to dry from top and bottom. Hence, no con-clusions as to the autogenous shrinkage cracking propensity were possible.
Own results of restrained ring tests on ultra-high strength concrete with an equivalent water-cement ratio of 0.20 and a cement content of 800 kg/m³ were presented in [Epp 08c]. Two concretes named UHPC-A and UHPC-B were tested, differing only in the used cement. The cements A and B significantly differed in the content of C3A and were similar in most other respects (cf. Table 9–1). The content of C3A was approximately 6 to 7 % higher with cement B (cf. 2.5.1). Six rings per concrete were produced and stored at 20 °C. Two rings remained sealed over the whole test period. Four rings were unsealed at the age of 24 h. These rings dried out from top and bottom at 65 % relative humidity. The concrete temperature during the entire test period was between 21 °C and 22.7 °C. The deformations imposed on the steel ring, being proportional to the hoop stresses, were higher with the cement with higher C3A content (Figure 5–14). Drying significantly increased the strains, and strains continued to in-crease during the whole test period of seven days. The degree of restraint during these tests constantly exceeded 80 %. Neither in the sealed nor in the unsealed rings any visible cracks occurred. From the absence of cracks in the unsealed rings it was concluded qualitatively that the cracking propensity in the sealed specimens between the age of 24 h and 144 h was low.
-60
-50
-40
-30
-20
-10
0
10
0 24 48 72 96 120 144
Age [h]
Str
ain
[µm
/m]
Sealed
Drying from 1 d
UHPC-A
-60
-50
-40
-30
-20
-10
0
10
0 24 48 72 96 120 144
Age [h]
Str
ain
[µ
m/m
]
Sealed
Drying from 1 d
UHPC-B
Figure 5–14 Restrained ring tests under quasi-isothermal conditions with ultra-high strength concrete: influence of different cements [Epp 08c]
Mechtcherine and Co-Workers comprehensively investigated the effect of internal curing by means of superabsorbent polymers on restraint stress in ultra-high strength concrete [Mec 06], [Mec 08], [Mec 09], [Dud 10]. Stress was much lower when superabsorbent polymers (0.4 mass-% of cement) were added to the reference concrete (Figure 5–15).

77
-2
0
2
4
6
8
10
0 4 8 12 16 20 24
time [h]
tens
ile s
tres
s [M
Pa]
Time [h]
Ten
sile
Str
ess
[MPa
]
Reference (Ref)
with SAP (S0.4_1)
-2
0
2
4
6
8
10
0 4 8 12 16 20 24-2
0
2
4
6
8
10
0 10 20 30 40 50 60 70
Time [d]
Ten
sile
Str
ess
[MPa
]
Reference (Ref)
with SAP (S0.4_1)
Figure 5–15 Tensile stress in restrained ring tests with sealed ultra-high strength concrete with and without su-perabsorbent polymers, 0-24 h (left) and 0-70 days (right) [Dud 10]
5.8.3 A full-scale model for assessing the cracking risk at very early age
Sorelli et al. recently presented a full-scale thermo-chemical-mechanical model for the as-sessment of the early-age cracking risk in structures made of ultra-high strength concrete [Sor 08]. The model is to combine autogenous shrinkage and thermal deformations due to heat of hydration. As was shown above, the general relation between temperature and autogenous shrinkage is unclear and maturity approaches may not be applicable (2.5.2). Remarkably, the development of shrinkage in the model is based on a single value, namely the final drying shrinkage strain.
In the reported application a specific fine-grained ultra-high strength concrete was used whose properties were described in a report issued by the Federal Highway Administration of the US Department of Transportation [Fed 06]. The long-term shrinkage measurements mentioned in that report were carried out according to ASTM C 157 on unsealed specimens and started at the age of approx. 23 h. The final drying shrinkage strain reported for concrete without heat-curing was 555 µm/m. The final set apparently occurred at approx. 16 h.
The model was applied to a bridge girder made of the aforementioned ultra-high strength con-crete reinforced with fibers. The value for final drying shrinkage was taken from [Fed 06]. The bridge girder’s deformations were restrained by formwork. The measured concrete tem-perature varied between (approx.) 10 °C until 50 h and a maximum of 70 °C at 80 h. From the late increase of temperature at the age of 50 h it can be concluded that hydration was consid-erably retarded, either due to the low temperature alone or, more probably, also due to high amounts of chemical admixtures. Hence, possibly the concrete composition used for the girder was different from the one the shrinkage was measured for.
The monitored mid-span section of the bridge girder did not begin to deform until (approx.) 55 h to 60 h after casting. The calculated maximum stress-strength ratio due to restrained de-formation was 0.39 and occurred 63 h after casting, i.e. few hours after the development of the first strains and roughly 17 h hours before the concrete temperature started to decrease.

78
According to the definition suggested above, the age of 63 h in this case would belong to the very early age (cf. 5.4).
Good agreement was observed between calculated and measured strains in this special case. However, the assumption that the risk of cracking due to restrained autogenous shrinkage at very early age and under non-isothermal conditions can be predicted with the final drying shrinkage strain as the only shrinkage input value, is in entire disagreement with fundamen-tals. Moreover, the development of the tensile strength was modeled according to the linear model of Laube. This simple model was shown not to be applicable at very early age (3.5.4).
Certainly simplifications are necessary for assessing the cracking risk of structures made of ultra-high strength concrete. However, more sophisticated input functions for the autogenous shrinkage and the development of the tensile strength appear to be required. The approach of Gawin et al. may be appropriate, however, it is very complex [Gaw 06a], [Gaw 06b].
5.9 Summary
Autogenous shrinkage is caused by self-desiccation that occurs predominantly in concretes with very low water-cement ratio (2.1). It can lead to cracks if deformations are restrained (5.3). For obvious reasons it is not sufficient to measure the free autogenous shrinkage in or-der to investigate the cracking propensity. Cracking at early and very early age is a complex process that considerably depends on the stress relaxation capacity and the development of mechanical properties in general (5.4).
The risk of cracking commonly is expressed as stress-strength ratio at a specific age or as the maximum stress-strength ratio occurring within a given period. The stress-strength ratio fail-ure criterion is based on assumptions partly not validated. Results therefore are not necessar-ily precise and generally valid (5.6). The term ‘cracking propensity’, in contrast to the term ‘cracking risk’, is to indicate that results presently do not allow for a reliable calculation of the probability of cracking.
As far as the autogenous shrinkage cracking propensity is concerned, the present knowledge is scarce. There is very few data for the cracking propensity at very early age. Most investiga-tions covered only a few discrete ages and not necessarily those of highest cracking propen-sity. The few results available indicate a high cracking propensity of concretes with very low water-cement ratio (5.8.2). However, most of these results are based on the splitting tensile strength. It is unclear if and how splitting tension tests can be used to determine the resistance to uniaxial tensile failure at very early age (5.6).
Some additional results of the restraint stress development are available (5.8.2). The investi-gations carried out so far mainly confirm in a rather qualitative manner the strong influence of the autogenous shrinkage on stresses. Several measures that reduce the autogenous shrinkage were shown to reduce the restraint stress as well, for instance shrinkage-reducing admixtures, super-absorbent polymers, less fine cements and cements with less C3A.
The autogenous shrinkage cracking propensity presumably is significantly influenced by tem-perature history (5.7). This needs to be confirmed. It is completely unclear which temperature history yields the maximum cracking propensity. Furthermore, stresses due to thermal con-
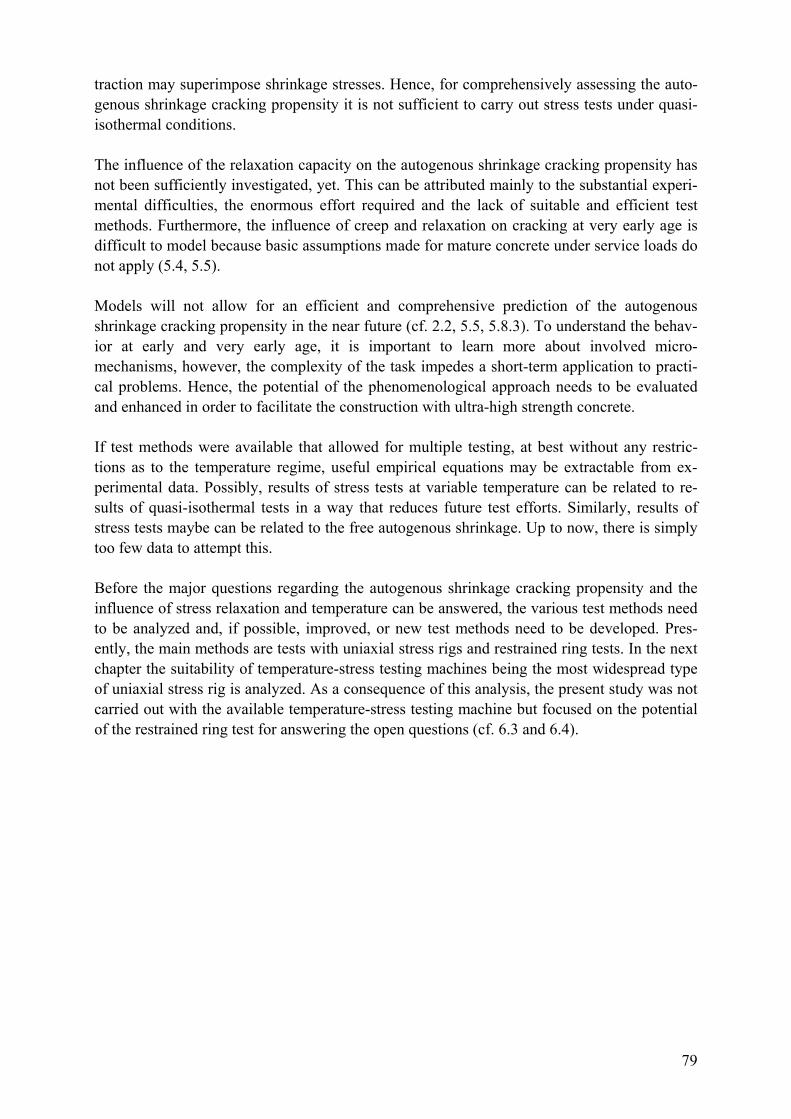
79
traction may superimpose shrinkage stresses. Hence, for comprehensively assessing the auto-genous shrinkage cracking propensity it is not sufficient to carry out stress tests under quasi-isothermal conditions.
The influence of the relaxation capacity on the autogenous shrinkage cracking propensity has not been sufficiently investigated, yet. This can be attributed mainly to the substantial experi-mental difficulties, the enormous effort required and the lack of suitable and efficient test methods. Furthermore, the influence of creep and relaxation on cracking at very early age is difficult to model because basic assumptions made for mature concrete under service loads do not apply (5.4, 5.5).
Models will not allow for an efficient and comprehensive prediction of the autogenous shrinkage cracking propensity in the near future (cf. 2.2, 5.5, 5.8.3). To understand the behav-ior at early and very early age, it is important to learn more about involved micro-mechanisms, however, the complexity of the task impedes a short-term application to practi-cal problems. Hence, the potential of the phenomenological approach needs to be evaluated and enhanced in order to facilitate the construction with ultra-high strength concrete.
If test methods were available that allowed for multiple testing, at best without any restric-tions as to the temperature regime, useful empirical equations may be extractable from ex-perimental data. Possibly, results of stress tests at variable temperature can be related to re-sults of quasi-isothermal tests in a way that reduces future test efforts. Similarly, results of stress tests maybe can be related to the free autogenous shrinkage. Up to now, there is simply too few data to attempt this.
Before the major questions regarding the autogenous shrinkage cracking propensity and the influence of stress relaxation and temperature can be answered, the various test methods need to be analyzed and, if possible, improved, or new test methods need to be developed. Pres-ently, the main methods are tests with uniaxial stress rigs and restrained ring tests. In the next chapter the suitability of temperature-stress testing machines being the most widespread type of uniaxial stress rig is analyzed. As a consequence of this analysis, the present study was not carried out with the available temperature-stress testing machine but focused on the potential of the restrained ring test for answering the open questions (cf. 6.3 and 6.4).

80
6 Investigation of the autogenous shrinkage cracking propensity
6.1 Introduction
This chapter comprehends the own experimental investigations on restraint stress and crack-ing propensity. The presentation of the results is preceded by a discussion of two alternative test methods. First, the suitability of temperature-stress testing machines for investigating the autogenous shrinkage cracking propensity is examined. From the characteristics of such ma-chines and the results of two round-robin tests the further investigation turns to the restrained ring test. First, its principal setup, possible variations and the basic evaluation of results are described. The influence of temperature changes in restrained ring tests is examined and an analytical solution for calculating the stress due to temperature changes is derived. In addi-tion, it is shown how temperature changes can be used to investigate the effects of creep and relaxation. Then the own investigations with restrained ring tests are introduced, starting with a description of the setup and the measuring technique. The measured steel ring strains are converted to stresses; degree of restraint, theoretical-elastic stress and a creep factor are calcu-lated. The further analysis comprises the suitability of the splitting tensile strength as resis-tance measure, the influence of radial stress redistribution and the use of ring tests at very low humidity for quantifying the resistance to cracking. The autogenous shrinkage cracking pro-pensity is shown to be assessable as the ratio of restraint stress and corrected splitting tensile strength. Moreover, the thermal stress component is examined further and the period of maximum cracking propensity is analyzed. Finally, restraint stress and cracking propensity are looked at as functions of the autogenous shrinkage and the feasibility of a more detailed evaluation of the influence of creep and relaxation is studied.
6.2 Suitability of temperature-stress testing machines
6.2.1 Development, setup and use
The temperature-stress testing machine was developed by Springenschmid et al. in the 1980’s. It is a uniaxial tensile and compressive stress testing machine that allows monitoring and con-trolling strains and stresses in a centrically restrained concrete specimen with a large cross section of typically 150 x 150 mm² and a length of approximately 1500 mm (Figure 6–1, Figure
6–2). A temperature-controlled mold is used to regulate the temperature of the specimen [Spr 85], [Sch 90]. The development was based on the cracking frame, consisting of a specimen restrained by a rigid steel frame [Bre 89], [Spr 95b]. The temperature-stress testing machine, contrary to the more simple cracking frame, can provide for full restraint during the whole test period. To this end the length of the specimen is kept constant by means of a movable cross-head, a principle which had already been applied by other researchers before [Pai 76], [Kas 75].
If the free deformations are measured in parallel on a second specimen, this data can be used to control the degree of restraint in the restrained specimen [Kov 94]. Any partial degree of restraint can be achieved. A constant degree of restraint of 60 %, for instance, requires to pull back the cross-head 3/5 of the free deformations. This is constantly repeated each time a de-fined deformation threshold is reached in the unrestrained specimen. Alternatively, partial de-grees of restraint can be achieved by short-term measurements of the modulus of elasticity of the concrete in the temperature-stress testing machine and the appropriate consideration of the stiffness of the testing machine [Hay 08a].

81
Figure 6–1 Temperature-stress-testing machine at VDZ (German Cement Works Association)
Figure 6–2 Scheme of the temperature-stress testing machine [Spr 95]
At the time the temperature-stress testing machine was developed, the focus was on mass concrete. The influence of the heat of hydration of cements on cracking in restrained concrete was discussed controversially [Pai 76], [Spr 95]. The fundamental problem was well known. Decreasing temperatures can cause high Eigen- and restraint stresses. The resultant risk of cracking traditionally was addressed by keeping the concrete temperature as low as possible. In fact, tests with temperature-stress testing machines confirmed that the maximum tempera-ture rise at given storage conditions is the most important property of a concrete composition in terms of cracking risk [Thi 95], [Hin 98].
Today, temperature-stress testing machines, due to their versatility and despite the consider-able costs for acquisition and deployment, can be found in a number of institutions. Many questions regarding the use of mass concrete in dams, power plants or tunnel shells can be considered resolved. Tests mostly were conducted at full restraint. Results initially were trans-

82
formed to arbitrary degrees of restraint by elastic calculations [Spr 95b]. Models were devel-oped to also account for creep [Ham 08]. Strains and mechanical parameters were modeled as functions of age and temperature [Lau 90]. Ample experimental data gave rise to models apt to predict stresses and cracking risk due to heat of hydration [Cze 05].
Contrary to mass concrete, high strength concrete, whose specific cracking propensity was fully realized in the 1980’s and 1990’s [Bui 80], [Zie 82],[Taz 92], [Sel 95] exhibits signifi-cant autogenous shrinkage. The autogenous shrinkage is notably influenced by temperature, however, this influence presently cannot be described by maturity functions (2.5.2). Changing temperatures have a twofold effect: they cause thermal strains and they alter the shrinkage strains. The stresses measured in tests under restraint conditions are the result of the sum of both kinds of strains. Two requirements arise from that. First, it is important to be able to pre-cisely control the concrete temperature. This includes the reproducibility of temperature over time as well as the uniform distribution of temperature over the specimen. Second, knowledge of the coefficient of thermal expansion is required to separate the effects of thermal and shrinkage strains (5.7).
These requirements are difficult to meet with large specimens. To provide for quasi-isothermal conditions, RILEM recommended a maximum temperature increase due to heat of hydration of 2 K [Ham 06]. Beyond that value, thermal strains as well as the alteration of autogenous shrinkage and other properties may not be negligible anymore. Although some tests under quasi-isothermal conditions were carried out with temperature-stress testing ma-chines [Sch 95], it appears questionable whether the mentioned threshold can be met under all circumstances with cross sections exceeding 100 mm x 100 mm. Especially with ultra-high strength concrete and at high temperatures the heat of hydration is released rapidly, so the ex-ternal cooling may not be sufficient to avoid differences of more than 2 K.
Similar considerations apply to the determination of the coefficient of thermal expansion by means of temperature-stress testing machines. Hammer et al. suggested increasing and de-creasing the concrete temperature stepwise and evaluating the respective length changes to determine the coefficient of thermal expansion [Ham 06]. Obviously, the steps of temperature increase must not be too large in order not to significantly alter hydration and not too small in order to achieve a sufficient precision. The main problem, however, is the thermal inertia of large specimens. Even with sophisticated cooling and heating systems it may not be possible in all cases to achieve an evenly distributed concrete temperature within a sufficiently short period of time.
Loser et al. recently suggested a procedure for measuring the coefficient of thermal expansion [Los 10]. They filled a condom with 10 ml of cement paste and immersed it into a tempera-ture-controlled bath. Then the bath temperature was increased by 6 K. It took 28 min for the temperature to be equilibrated inside the small sample. In comparison, the volume that needs to be heated up in conventional temperature-stress testing machines is by far larger, so it takes more time for temperature to be equilibrated. The autogenous shrinkage during that time span superimposes the thermal strains. Hence, to calculate the coefficient of thermal expansion, the autogenous shrinkage and the thermal strains would have to be separated. This, however, would already require the coefficient of thermal expansion, i.e. the property that still needs to be determined. Alternatively, some mean temperature obtained after a few minutes may be used, or the autogenous shrinkage may be measured in parallel under quasi-isothermal condi-

83
tions. In any case, it appears questionable whether the coefficient of thermal expansion can be determined accurately and efficiently by means of conventional temperature-stress testing machines. Notably, comparable uniaxial stress rigs with much smaller specimens have been developed recently [Koe 06], [Hab 06], [Ma 05], [Tom 00].
Another important aspect of the use of temperature-stress testing machines is the large effort required for a single test. In view of the unclear influence of temperature and stress relaxation on the autogenous shrinkage cracking propensity, a number of tests as large as possible would be desirable (5.4, 5.7). However, in many institutions only one machine is available and there-fore only one specimen at a time can be tested. Actually, most investigations with tempera-ture-stress testing machines comprised only one specimen per investigated variable (or no in-formation on the number of specimens was given), e.g. [Hay 08a], [Cus 07], [Lin 06], [Iga 06], [Bra 06], [Tao 06], [Ohy 06], [Tak 05], [Ma 05], [Lur 03c], [Atr 01], [Tom 00], [Iga 00]. From a statistical point of view such investigations have a very limited significance, espe-cially if the precision of the method is unclear (cf. 6.2.2).
Finally, tests of the autogenous shrinkage cracking propensity with temperature-stress testing machines mostly were carried out at full restraint [Lin 06], [Iga 06], [Bra 06], [Ohy 06], [Koe 06], [Iga 02]. However, few applications of high- and ultra-high strength concrete with full restraint are conceivable. It is uncertain whether investigations at full restraint alone allow for a reliable comparison of the autogenous shrinkage cracking propensity of different concretes. Higher degrees of restraint are associated with higher stress levels. The stress relaxation be-havior may be different at lower degrees of restraint.
6.2.2 Results of round robin tests
It was hypothesized that thermal and autogenous shrinkage deformations superimpose each other in a way that substantially increases the risk of cracking of high-strength concrete [Bjø 04]. Therefore, several European research groups in the 1990’s commonly attempted to inves-tigate the joint effect of thermal and autogenous shrinkage strains with temperature-stress test-ing machines. The comprehensive round robin test IPACS involved five laboratories. Free autogenous shrinkage was measured at a constant set temperature of 20 °C and at a realistic temperature history with a maximum temperature of 40 °C [IPACS]. In three laboratories, measurement was carried out on large prismatic specimens. In two laboratories, cylindrical specimens were used, allowing for a start of the measurement at a concrete age of 24 h. Re-sults are given in Figure 6–3.
Results obtained under non-isothermal conditions were called discouraging [Ham NC]. The scatter at quasi-isothermal conditions can be considered unsatisfactory, too. Bleeding, the temperature control system and temperature effects on the equipment were mentioned as po-tential sources of error [IPACS]. A part of the scatter was attributable to the non-conformity of the concrete mixtures in the participating laboratories, noticeable from supportive tests. It may be added that the overall autogenous shrinkage was low compared to several hundreds of microstrain typically generated in ultra-high strength concrete (cf. 4.5). Thus, disturbing in-fluences of absolute size can lead to a large relative error.

84
Figure 6–3 Results of the IPACS round robin test. Left: free autogenous deformation at a constant set tem-perature of 20 °C; right: overall deformations at a typical non-isothermal temperature regime with a maximum target temperature of 40 °C; measured on prismatic specimens (cross sections ≥ 100 x 100 mm², results zeroed at 12 h) or on cylinders (measurement in that case started at 24 h). [Ham NC]
Furthermore, tests under restraint conditions with temperature-stress testing machines were carried out. Full restraint was applied. Results for quasi-isothermal and non-isothermal condi-tions are given in Figure 6–4 and in Figure 6–5, respectively. In view of the somewhat smaller scatter it was concluded that the “intrinsic reproducibility” of the test method was “very high” [IPACS]. Yet, this in part may also be explained by the different nature of the tests. Free de-formations at very early age are more difficult to measure; when restrained, they contribute less to the build-up of restraint stress than later deformations since the modulus of elasticity is still low and relaxation capacity still high. Thus, the scatter possibly was diminished by the restraint.
-0.2
0.0
0.2
0.4
0.6
0.8
1.0
1.2
0 24 48 72 96 120 144 168 192Age [h]
Str
ess
[MP
a]
Figure 6–4 Results of the IPACS round robin test: restraint stress at a constant target temperature of 20 °C; measured in temperature-stress testing machines on prismatic specimens with cross sections ≥ 100 x 100 mm² (from [IPACS])

85
-3.0
-2.0
-1.0
0.0
1.0
2.0
3.0
4.0
0 24 48 72 96 120 144 168 192
Age [h]
Str
ess
[MP
a]
Figure 6–5 Results of the IPACS round robin test: restraint stress at a typical non-isothermal temperature re-gime with a maximum target temperature of 40 °C; measured in temperature-stress testing ma-chines on prismatic specimens with cross sections ≥ 100 x 100 mm² (from [IPACS])
Another round robin test was carried out more recently, including some participants of the former one [Bjø 06]. This time a more simple concrete composition was chosen in order to reduce the disturbing influence of differing concrete properties in the participating laborato-ries. The concrete contained 522 kg/m³ of a Portland cement CEM I 42.5 R, dry aggregates with a maximum particle size of 8 mm and superplasticizer as the only admixture. Presumably participants were aware of all potential sources of errors. However, results were hardly better than in the first round robin test (Figure 6–6). At the age of 48 h, for instance, the six tests with five temperature stress testing machines yielded a restraint stress of approx. 0.4, 0.4, 0.5, 1.4, 1.5 and 1.8 MPa, resulting in a mean value of 1.0, a standard deviation of approx. 0.64 MPa and a coefficient of variation of 64 %.
-0.5
0.0
0.5
1.0
1.5
2.0
2.5
3.0
0 48 96 144 192 240 288 336
Age [h]
Res
trai
nt te
nsil
e st
ress
[MP
a]
Age [h]
Res
trai
nt te
nsil
e st
ress
[M
Pa]
Figure 6–6 Result of a round robin test: restraint stress due to autogenous shrinkage, tested with temperature-stress-testing machines (100 % restraint, constant set temperature of 20 °C) (from [Bjø 06])
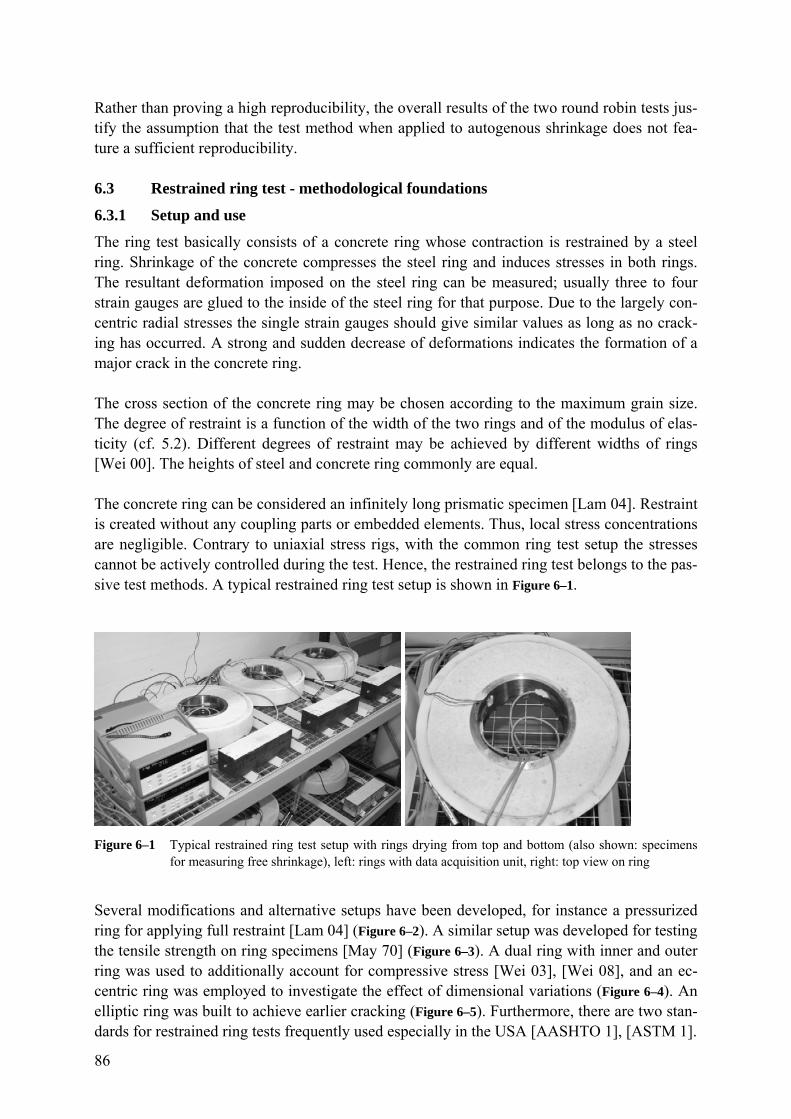
86
Rather than proving a high reproducibility, the overall results of the two round robin tests jus-tify the assumption that the test method when applied to autogenous shrinkage does not fea-ture a sufficient reproducibility.
6.3 Restrained ring test - methodological foundations
6.3.1 Setup and use
The ring test basically consists of a concrete ring whose contraction is restrained by a steel ring. Shrinkage of the concrete compresses the steel ring and induces stresses in both rings. The resultant deformation imposed on the steel ring can be measured; usually three to four strain gauges are glued to the inside of the steel ring for that purpose. Due to the largely con-centric radial stresses the single strain gauges should give similar values as long as no crack-ing has occurred. A strong and sudden decrease of deformations indicates the formation of a major crack in the concrete ring.
The cross section of the concrete ring may be chosen according to the maximum grain size. The degree of restraint is a function of the width of the two rings and of the modulus of elas-ticity (cf. 5.2). Different degrees of restraint may be achieved by different widths of rings [Wei 00]. The heights of steel and concrete ring commonly are equal.
The concrete ring can be considered an infinitely long prismatic specimen [Lam 04]. Restraint is created without any coupling parts or embedded elements. Thus, local stress concentrations are negligible. Contrary to uniaxial stress rigs, with the common ring test setup the stresses cannot be actively controlled during the test. Hence, the restrained ring test belongs to the pas-sive test methods. A typical restrained ring test setup is shown in Figure 6–1.
Figure 6–1 Typical restrained ring test setup with rings drying from top and bottom (also shown: specimens for measuring free shrinkage), left: rings with data acquisition unit, right: top view on ring
Several modifications and alternative setups have been developed, for instance a pressurized ring for applying full restraint [Lam 04] (Figure 6–2). A similar setup was developed for testing the tensile strength on ring specimens [May 70] (Figure 6–3). A dual ring with inner and outer ring was used to additionally account for compressive stress [Wei 03], [Wei 08], and an ec-centric ring was employed to investigate the effect of dimensional variations (Figure 6–4). An elliptic ring was built to achieve earlier cracking (Figure 6–5). Furthermore, there are two stan-dards for restrained ring tests frequently used especially in the USA [AASHTO 1], [ASTM 1].

87
Figure 6–2 Photo (left) and scheme (right) of a ring setup with pressurized cylinder [Lam 04]
Figure 6–3 Test setup for testing the tensile strength on a concrete ring [May 70]
St
St
St
StRIC
ROC RIS
St-out
St-int
eROC
RIC
ROC-RIC
ROC-RIC=e
RIC
ROC
RIS,INT
ROS,OUT
Figure 6–4 Ring test variations: standard ring (left), dual ring (centre), eccentric ring (right) (from [Rad 06])
Figure 6–5 Restrained ring test with elliptic ring [Zhe 04]
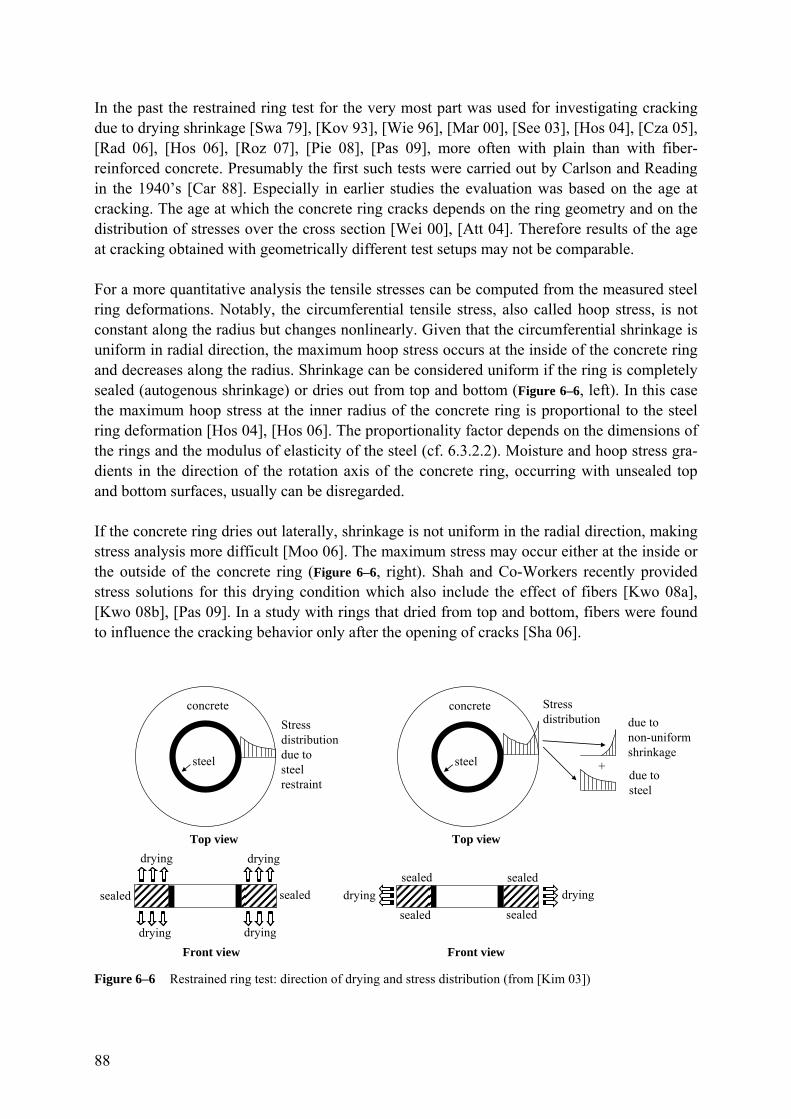
88
In the past the restrained ring test for the very most part was used for investigating cracking due to drying shrinkage [Swa 79], [Kov 93], [Wie 96], [Mar 00], [See 03], [Hos 04], [Cza 05], [Rad 06], [Hos 06], [Roz 07], [Pie 08], [Pas 09], more often with plain than with fiber-reinforced concrete. Presumably the first such tests were carried out by Carlson and Reading in the 1940’s [Car 88]. Especially in earlier studies the evaluation was based on the age at cracking. The age at which the concrete ring cracks depends on the ring geometry and on the distribution of stresses over the cross section [Wei 00], [Att 04]. Therefore results of the age at cracking obtained with geometrically different test setups may not be comparable.
For a more quantitative analysis the tensile stresses can be computed from the measured steel ring deformations. Notably, the circumferential tensile stress, also called hoop stress, is not constant along the radius but changes nonlinearly. Given that the circumferential shrinkage is uniform in radial direction, the maximum hoop stress occurs at the inside of the concrete ring and decreases along the radius. Shrinkage can be considered uniform if the ring is completely sealed (autogenous shrinkage) or dries out from top and bottom (Figure 6–6, left). In this case the maximum hoop stress at the inner radius of the concrete ring is proportional to the steel ring deformation [Hos 04], [Hos 06]. The proportionality factor depends on the dimensions of the rings and the modulus of elasticity of the steel (cf. 6.3.2.2). Moisture and hoop stress gra-dients in the direction of the rotation axis of the concrete ring, occurring with unsealed top and bottom surfaces, usually can be disregarded.
If the concrete ring dries out laterally, shrinkage is not uniform in the radial direction, making stress analysis more difficult [Moo 06]. The maximum stress may occur either at the inside or the outside of the concrete ring (Figure 6–6, right). Shah and Co-Workers recently provided stress solutions for this drying condition which also include the effect of fibers [Kwo 08a], [Kwo 08b], [Pas 09]. In a study with rings that dried from top and bottom, fibers were found to influence the cracking behavior only after the opening of cracks [Sha 06].
Front viewFront view
Top view
concrete
steelsteel
Top view
concrete
steelsteel +
sealed
Stress distribution due to
non-uniformshrinkage
due to steel
sealed
sealed
drying
drying
sealed
drying
drying
sealed
Stress distribution due to steel restraint
drying
sealed
drying
Figure 6–6 Restrained ring test: direction of drying and stress distribution (from [Kim 03])

89
If the tensile strength is known, the cracking propensity may be calculated as ratio of hoop stress and tensile strength (cf. 5.6). Furthermore, if the free shrinkage and the modulus of elas-ticity of concrete are known, the degree of restraint and the influence of creep may be quanti-fied as well. The evaluation of restrained ring tests is comprehensively dealt with in the next section (6.3.2).
Very few investigations of the autogenous shrinkage cracking propensity were carried out with restrained ring tests to date. The suitability of the restrained ring test for measuring stresses due to restrained autogenous shrinkage was hardly discussed, yet. Especially the ef-fect of changing temperatures on stresses was largely disregarded. As concrete and steel ring have different coefficients of thermal expansion, thermal stresses may superimpose stresses due to autogenous shrinkage. Hence, temperature control is essential. Bouasker et al. devel-oped a setup with temperature-controlled plates on top and bottom of the ring to provide for quasi-isothermal conditions (Figure 6–7) [Bou 06].
Figure 6–7 Restrained ring test setup with temperature control system [Bou 06]
Since it is necessary to investigate the autogenous shrinkage cracking propensity also under non-isothermal conditions, the role of temperature deserves special attention (cf. 5.7). In sec-tion 6.3.2.3 a method for the separation of thermal and shrinkage stress component is pre-sented. The use of stresses created by specific temperature changes is treated in section 6.3.3.

90
6.3.2 Evaluation of restrained ring tests
6.3.2.1 Introduction
Consider two rings, one of concrete (subscript C) and one of steel (subscript St) with respec-tive inner (i) and outer (o) radius Ri and Ro, furthermore RC,i = RSt,o (Figure 6–8). While mate-rial parameters of concrete depend on time and temperature, relevant parameters of steel can be considered constant within the temperature range of common concrete applications. Due to restraint, shrinkage of the concrete ring yields an interface pressure P between the rings which is constant along the common surface (cf. Figure 5–2). This pressure leads to radial and circumferential stresses in both rings. The circumferential (hoop) stress θ in the concrete ring is positive, i.e. tensile stress. The circumferential deformations St which are imposed on the steel ring can be measured by strain gauges mounted on the inside of the steel ring.
RC,i: inner radius of concrete ring
RC,o: outer radius of concrete ring
RSt,i: inner radius of steel ring
RSt,o: outer radius of steel ring
SH: free shrinkage t: time T: temperature EC: modulus of elasticity of concrete fct: tensile strength of concrete T,C: coefficient of thermal expansion of concrete vC: Poisson’s ratio of concrete ESt: modulus of elasticity of steel vSt: Poisson’s ratio of steel T,St: coefficient of thermal expansion of steel St: circumferential strain of the steel ring
θ: hoop stress
Figure 6–8 Scheme of restrained ring test and relevant parameters
+
RC,o RC,i
SH (t,T), EC (t,T), fct (t, T), T,C (t,T), vC ≈ const.
RSt,oRSt,i
ESt = const. vSt = const. T,St = const.
RC,i = RSt,o
Shrunk concrete ring Steel ring Restrained ring test
St
P
P
θ

91
Since pressurized tube sections are a common issue in engineering, the basic equations have been known for a long time. The general solution for stresses in an elastic pressurized ring is also called ‘thick-wall’ solution, in contrast to the ‘thin-wall’ solution which neglects the fact that the hoop stress is not constant along the radius. The solution for thin walls is applicable if the ratio of ring thickness and radius is smaller than approximately 1/30. With most setups of restrained ring tests this value is exceeded, so the thick wall solution needs to be applied, ac-counting for the non-linear distribution of stress along the ring’s radius. In the following, the thick wall solution is described.
Consider a ring under internal pressure P with inner and outer radius Ri and Ro, respectively. This ring corresponds to the shrunk concrete ring in the restrained ring test. The function for radial and hoop stress at any radius r of the ring (Ri ≤ r ≤ Ro) can be illustrated by a straight line plotted over 1/r², the so called Lamé line (Figure 6–9) [Ros 87]. Equating similar triangles yields Equation 6–1. The radial stress is negative (compression) and becomes zero for r = Ro. The hoop stress is positive along the complete radius (tension) and reaches its maximum at the inner radius r = Ri. The difference in hoop stress at inner and outer radius expressed as percentage decreases with increasing radius and decreasing ring thickness.
Figure 6–9 Hoop and radial stress in a ring with inner and outer radius Ri and Ro due to internal pressure P [Ros 87]
22
22
11
11
)(
oi
o
RR
rRPr
Equation 6–1
The maximum hoop stress at the inner radius can be calculated as per Equation 6–2. The stress is proportional to the pressure P. The proportionality factor results from the geometry
1/r²
P
stress (-)
stress (+)
1/Ro² 1/Ro²
1/Ri² 1/Ri²
Radial stress
Hoop stress
θ, o
1/r²
θ, i

92
of the rings. The only unknown quantity is P. The next section describes how P can be calcu-lated to obtain the maximum hoop stress in the concrete ring.
2,
2,
2,
2,
max,iCoC
oCiC
RR
RRP
Equation 6–2
6.3.2.2 Theoretical-elastic and actual stress, degree of restraint, creep factor
There are two different stress quantities that matter, the theoretical-elastic stress elastic and the actual stress actual. The respective interface pressures are Pelastic and Pactual. The interface pressure Pelastic would occur if concrete deformed purely elastically. It can be computed by means of elastic relations. The actual interface pressure Pactual can be calculated from the strains measured at the inner radius of the steel ring [Hos 04].
To obtain the theoretical-elastic stress, first consider a radial displacement |ufree| of the unre-strained concrete ring due to shrinkage. It can be calculated as per Equation 6–3 in which SH is the free shrinkage strain, measured by an appropriate method.
SHiCfree Ru ,|| Equation 6–3
SH: free shrinkage strain
In the restrained ring system, the resultant interface pressure Pelastic due to shrinkage concen-trically acts on the steel ring from the outside and on the concrete ring from the inside. Pro-vided that the boundary condition RC,i = RSt,o (6.3.2.1) remains valid under pressure, i.e. no gap occurs between the rings, the same relations as in 5.2 (Figure 5–2) may be used for further calculations. The pressure Pelastic leads to elastic displacements |uC| and |uSt|, relative to the po-sition of the shrunk concrete ring. The sum of these displacements is equal to the free dis-placement |ufree| (Equation 6–4).
|||||| StCfree uuu Equation 6–4
The displacements |uSt| and |uC| due to Pelastic can be calculated using Equations 6–5 and 6–6, respectively [Hos 04]. The subscript SH specifies shrinkage as source of the interface pres-sure. Furthermore, the Poisson’s ratio C is assumed to be constant.
)(
)1(1|| 2
,2
,,
2,
2,
2,
,iStoStoStSt
oStStiStStoStSHelasticSt RRRE
RRRPu
Equation 6–5
)(
)1(1||
2,
2,,
2,
2,
2,
,iCoCiCC
iCCoCCiCSHelasticC RRRE
RRRPu
Equation 6–6
Equations 6–3 to 6–6 lead to Equation 6–7 for computing the increase of elastic interface pressure due to an increase of free shrinkage [Hos 04].
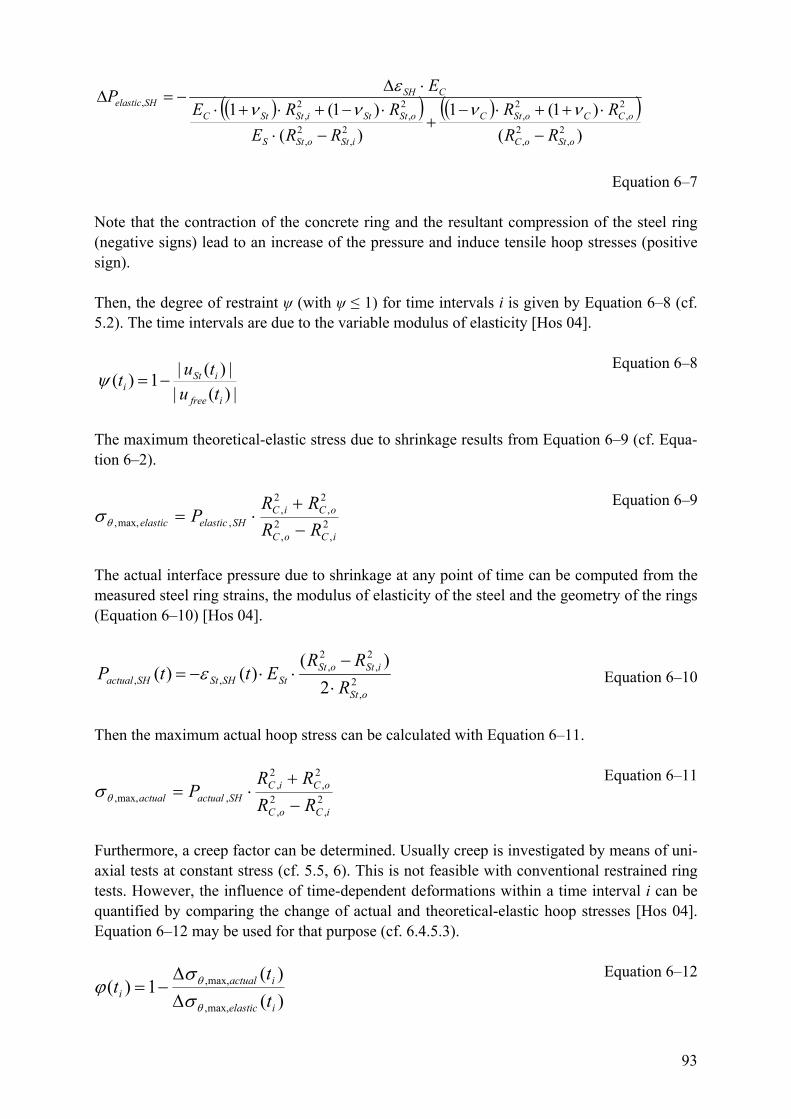
93
)(
)1(1
)(
)1(12
,2
,
2,
2,
2,
2,
2,
2,
,
oStoC
oCCoStC
iStoStS
oStStiStStC
CSHSHelastic
RR
RR
RRE
RRE
EP
Equation 6–7
Note that the contraction of the concrete ring and the resultant compression of the steel ring (negative signs) lead to an increase of the pressure and induce tensile hoop stresses (positive sign).
Then, the degree of restraint ψ (with ψ ≤ 1) for time intervals i is given by Equation 6–8 (cf. 5.2). The time intervals are due to the variable modulus of elasticity [Hos 04].
|)(|
|)(|1)(
ifree
iSti tu
tut
Equation 6–8
The maximum theoretical-elastic stress due to shrinkage results from Equation 6–9 (cf. Equa-tion 6–2).
2,
2,
2,
2,
,max,,iCoC
oCiCSHelasticelastic RR
RRP
Equation 6–9
The actual interface pressure due to shrinkage at any point of time can be computed from the measured steel ring strains, the modulus of elasticity of the steel and the geometry of the rings (Equation 6–10) [Hos 04].
2,
2,
2,
,, 2
)()()(
oSt
iStoStStSHStSHactual R
RREttP
Equation 6–10
Then the maximum actual hoop stress can be calculated with Equation 6–11.
2,
2,
2,
2,
,max,,iCoC
oCiCSHactualactual RR
RRP
Equation 6–11
Furthermore, a creep factor can be determined. Usually creep is investigated by means of uni-axial tests at constant stress (cf. 5.5, 6). This is not feasible with conventional restrained ring tests. However, the influence of time-dependent deformations within a time interval i can be quantified by comparing the change of actual and theoretical-elastic hoop stresses [Hos 04]. Equation 6–12 may be used for that purpose (cf. 6.4.5.3).
)(
)(1)(
max,,
max,,
ielastic
iactuali t
tt
Equation 6–12

94
6.3.2.3 Influence of temperature changes in restrained ring tests
Due to different coefficients of thermal expansion (CTE) of steel and concrete, a temperature change is associated with a change of stress in the restrained ring test. If, for instance, the CTE of the steel is higher, an increase of temperature leads to an increase of tensile hoop stress in the concrete ring since the steel ring expands more than the concrete ring does; the hoop stress would decrease if the temperature decreased. If the CTE of the concrete is higher than that of the steel, the effects of temperature changes are vice versa. Thus, changes of tem-perature irreversibly influence stress history. This effect in principle can be reduced by choos-ing a material for the inner ring with a CTE similar to that of concrete. However, the CTE of concrete undergoes notable changes at early age. Therefore, the thermal stress component cannot be completely avoided unless the temperature is constant. Commonly, the inner ring is made of stainless steel with a CTE of approximately 16 µm/m/K. The CTE of hardened con-crete typically is lower.
The influence of changing temperatures was mostly neglected or disregarded in the past. Re-strained ring tests on drying shrinkage usually begin at the age of 24 h or later. At that age, temperature in specimens usually has decreased to room temperature. The peak of heat release due to hydration typically occurs in the first 24 h. In contrast to drying shrinkage, this is the most relevant period for the autogenous shrinkage. Kovler et al. investigated the effect of thermal expansion in a ring test with solid core. However, the given stress solution neglected creep [Kov 93]. This would not be appropriate for the very early age.
For a solution, consider that only the difference between the thermal strains of both rings is relevant. If the coefficients of thermal expansion of the rings were identical, uniform tempera-ture changes would not alter the stress. Therefore the subscript is used in this context. The stress-effective free radial displacement at the common surface due to changing temperatures within a time-interval ti is the product of the outer radius of the steel ring, the temperature change and the difference of the coefficients of thermal expansion (Equations 6–13 and 6–14, cf. Equation 6–4). The temperature is supposed to be identical allover the rings at any time.
)()()( ,, iTioStifree ttTRtu Equation 6–13
StTiCTiT tt ,, )()( Equation 6–14
T,C: coefficient of thermal expansion of concrete T,St: coefficient of thermal expansion of steelT: temperature change ti: time-interval
The deformations due to changes of temperature and due to shrinkage can be assumed to be restrained to the same degree. Hence, the stress-effective free radial displacement due to tem-perature change as per Equation 6–13, under the temporary assumption of elastic behavior, in the restrained ring test would split into radial displacements of steel ring and concrete ring ac-cording to the inverse ratio of their stiffness (cf. Figure 5–2). Applying Equation 5–1 to Equa-tion 6–13 yields Equation 6–15 for the elastic radial displacement of the steel ring due to tem-

95
perature changes. Division by the outer steel ring radius RSt,o yields the steel ring strain due to temperature, still assuming elastic behavior, i.e. neglecting creep (Equation 6–16).
))(1()()()( ,,, iiTioStielasticSt tttTRtu Equation 6–15
))(1()()()(,, iiTiielasticSt tttTt Equation 6–16
Then, in order to calculate the creep factor under non-isothermal conditions, Equation 6–7 first is modified to Equation 6–17, considering the thermal instead of the shrinkage strain.
)(
)1(1
)(
)1(1
)()(
2,
2,
2,
2,
2,
2,
2,
2,
,
oStoC
oCCoStC
iStoStS
oStStiStStC
CiTielastic
RR
RR
RRE
RRE
EttTP
Equation 6–17
The change of theoretical-elastic stress due to temperature results from Equation 6–18. This stress increment is needed for the recalculation of the creep factor (Equation 6–19).
2,
2,
2,
2,
,,max,,iCoC
oCiCelasticelastic RR
RRP
Equation 6–18
)()(
)(1)(
,max,,,max,,
,max,,
ielasticiSHelastic
iactuali tt
tt
Equation 6–19
Now the elastic steel ring strains as per Equation 6–16 can be turned into actual strains by considering creep as per Equation 6–20. The larger the creep factor is, the lower is the actual strain of the steel ring. The age-dependency of all parameters needs to be considered by evaluating sufficiently small time intervals (cf. 6.4.11).
i
iiiTiactualSt ttttTt ))(1())(1()()()(,,
Equation 6–20
Finally, to compensate for the thermal stress component in restrained ring tests under non-isothermal conditions, the steel ring strain as per Equation 6–20 can be subtracted from the measured overall strain to calculate the hoop stress due to shrinkage alone (Equation 6–21).
2,
2,
2,
2,
2,
2,
2,
,,,0, 2)()()(
oStoC
oCoSt
oSt
iStoStStTactualStmeasuredStactual RR
RR
R
RREttt
Equation 6–21

96
Notably, Equations 6–20 and 6–21 yield approximate results. With very large thermal stress components they may not be applicable. The prevailing stress level with and without thermal stress component is different. The creep behavior depends on the stress level and presumably on the stress history as well (cf. 5.5). This presently cannot be accounted for. Furthermore, the creep factor may be difficult to determine, especially if the elastic stress in the time-interval observed does hardly change (6.4.5.3, 6.4.11).
6.3.3 Use of temperature changes for the investigation of creep and relaxation
As was outlined above, the creep and stress relaxation behavior of concrete under quasi-isothermal conditions can be quantified by comparing the actual to the theoretical-elastic stress (Equation 6–12). The latter can be calculated from the modulus of elasticity and the free shrinkage (Equation 6–9). Furthermore, in the previous section the influence of changing temperatures on the actual and the theoretical-elastic stress was described. If the coefficient of thermal expansion of the steel is higher than that of the concrete - as it is usually the case with stainless steel and hardening concrete -, a temperature increase leads to a stress increase. This effect can be used to systematically investigate the influence of time-dependent deformations.
To this end the temperature is increased at a given point of time ti (cf. Figure 6–10). The resul-tant increase of theoretical-elastic stress until the point of time ti+1 can be calculated by Equa-tion 6–18, whereas the actual stress results from the steel ring strains. The creep factor for the time period from ti to ti+1 can be calculated by Equation 6–19. Different steps of temperature increase T lead to different stress levels (Figure 6–10). The evaluation of a test series yields a matrix of creep factors (Equation 6–22) which then may be used to describe the effect of creep and relaxation on stresses.
Stress
Agetiti+1
theoretical-elastic stress
actual stressT1
actual stress under quasi-isothermal conditions
T3
T2
T1
T3
T2
T: stress-inducing temperature change
Figure 6–10 Scheme for investigating stress relaxation in restrained ring tests through temperature changes

97
.........
...),(),(
),(),(1...
.........
)/,(1
1max
iielastiielast
iiactualiiactualcti TtTt
TtTtft
Equation 6–22
It is noted that the stress level will not be constant. Also, with longer test intervals the influ-ence of temperature on hydration has to be accounted for. As an alternative to temperature changes, the stress can be increased by drying shrinkage. The ring needs to be unsealed and exposed to various relative humidities (cf. 6.4.6.4). The increase of theoretical-elastic stress in this case is calculated with Equation 6–9, based on the drying shrinkage measured separately.
Since this method has not been systematically applied yet, its potential and limitations are dif-ficult to specify. It will hardly allow setting up compliance functions (5.5). However, it may be particularly suitable for determining the residual stress capacity and for analyzing the be-havior at stress levels close to cracking. Conventional tensile creep tests are extremely diffi-cult at very early age and very high stress levels. The advantages that the restrained ring test has in that regard were described above (5.5). Furthermore, clear increases of theoretical-elastic stress can be provided for rather easily. This is essential to achieve reliable results (cf. 6.4.11).
6.4 Own investigations with the restrained ring test
6.4.1 Setup
The setup used for the conducted restrained ring tests is described. Since the maximum parti-cle size of the investigated concretes was 0.5 mm, the concrete ring could be particularly small. It had a nominal width and height of 24 mm and 25 mm, respectively. Height and width of the steel ring was 25 mm and 15.7 mm, respectively. It was made of austenitic stainless steel (Type 1.4301) and had an outer diameter of 190 mm. The steel was found to have a coefficient of thermal expansion of T = 16.5·10-6 /K. The modulus of elasticity was assumed to be 200 GPa. The mold consisted of a base plate and a pipe section, both made of plastic. Friction between steel and mold as well as between steel and concrete was minimized by grease. The steel ring was centered on the base plate and fixed by screws. The film which was used to seal the concrete after the casting, was fixed by double-faced adhesive tape and additional tape to the circumference of the mold (Figure 6–1, Figure 6–2). After sealing, the screws were unscrewed.
To obtain the mean steel ring deformation, three strain gauges with a nominal resistance of 120 Ohm and a length of 6 mm were glued to the inner surface of each steel ring, evenly dis-tributed over the ring’s inner circumference and at mid height (Figure 6–3). Change of resis-tance was directly measured by a digital multimeter (Agilent 34970A). The proportional strain could be measured with a resolution better than 0.01 µm/m. A four wire configuration was used to cancel out the lead resistance. Due to the high sensitivity and resolution of the digital multimeter, precise data were obtained without the need of a Wheatstone bridge.
Temperature was measured by so called resistance temperature detectors one of which was glued to the inner surface of each steel ring (Figure 6–3, right). The detectors were made of platinum and had a nominal resistance of 100 Ohm. The first meter of the lead was in two
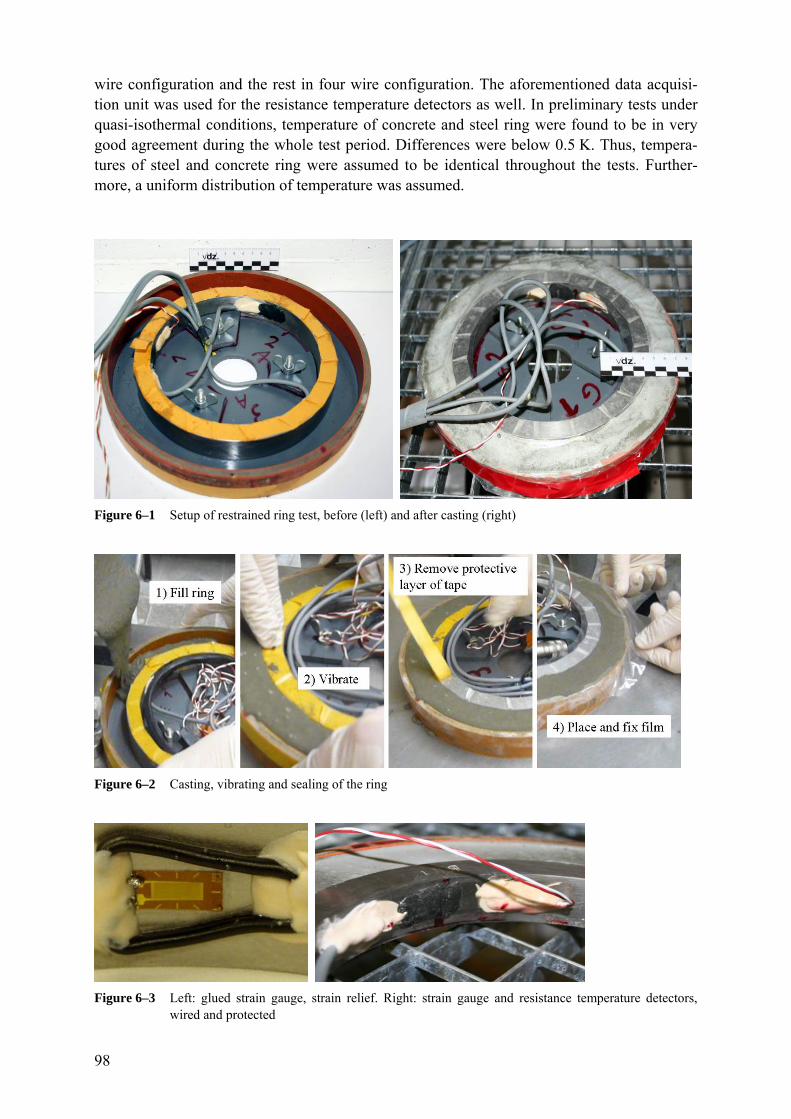
98
wire configuration and the rest in four wire configuration. The aforementioned data acquisi-tion unit was used for the resistance temperature detectors as well. In preliminary tests under quasi-isothermal conditions, temperature of concrete and steel ring were found to be in very good agreement during the whole test period. Differences were below 0.5 K. Thus, tempera-tures of steel and concrete ring were assumed to be identical throughout the tests. Further-more, a uniform distribution of temperature was assumed.
Figure 6–1 Setup of restrained ring test, before (left) and after casting (right)
Figure 6–2 Casting, vibrating and sealing of the ring
Figure 6–3 Left: glued strain gauge, strain relief. Right: strain gauge and resistance temperature detectors, wired and protected
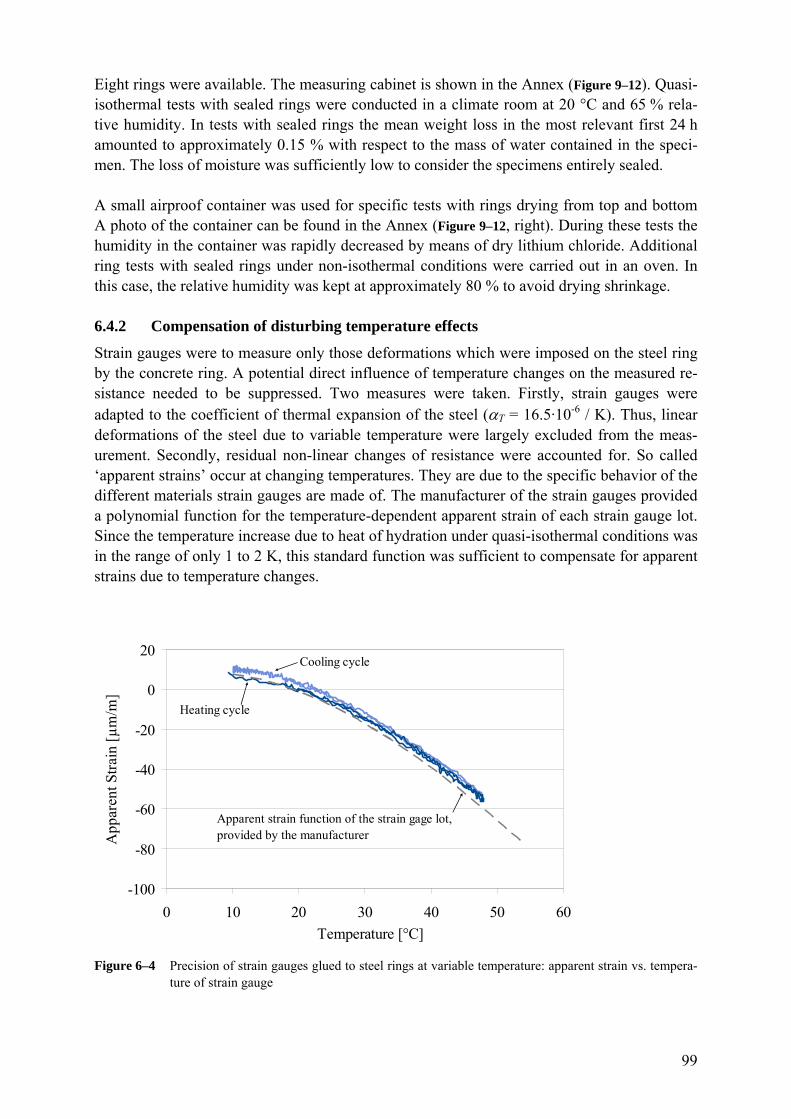
99
Eight rings were available. The measuring cabinet is shown in the Annex (Figure 9–12). Quasi-isothermal tests with sealed rings were conducted in a climate room at 20 °C and 65 % rela-tive humidity. In tests with sealed rings the mean weight loss in the most relevant first 24 h amounted to approximately 0.15 % with respect to the mass of water contained in the speci-men. The loss of moisture was sufficiently low to consider the specimens entirely sealed.
A small airproof container was used for specific tests with rings drying from top and bottom A photo of the container can be found in the Annex (Figure 9–12, right). During these tests the humidity in the container was rapidly decreased by means of dry lithium chloride. Additional ring tests with sealed rings under non-isothermal conditions were carried out in an oven. In this case, the relative humidity was kept at approximately 80 % to avoid drying shrinkage.
6.4.2 Compensation of disturbing temperature effects
Strain gauges were to measure only those deformations which were imposed on the steel ring by the concrete ring. A potential direct influence of temperature changes on the measured re-sistance needed to be suppressed. Two measures were taken. Firstly, strain gauges were adapted to the coefficient of thermal expansion of the steel (T = 16.5·10-6 / K). Thus, linear deformations of the steel due to variable temperature were largely excluded from the meas-urement. Secondly, residual non-linear changes of resistance were accounted for. So called ‘apparent strains’ occur at changing temperatures. They are due to the specific behavior of the different materials strain gauges are made of. The manufacturer of the strain gauges provided a polynomial function for the temperature-dependent apparent strain of each strain gauge lot. Since the temperature increase due to heat of hydration under quasi-isothermal conditions was in the range of only 1 to 2 K, this standard function was sufficient to compensate for apparent strains due to temperature changes.
-100
-80
-60
-40
-20
0
20
0 10 20 30 40 50 60
Temperature [°C]
App
aren
t Str
ain
[µm
/m]
Cooling cycle
Heating cycle
Apparent strain function of the strain gage lot, provided by the manufacturer
Figure 6–4 Precision of strain gauges glued to steel rings at variable temperature: apparent strain vs. tempera-ture of strain gauge

100
Mainly to further qualify the test setup for non-isothermal tests, the apparent strain was indi-vidually determined for each glued strain gauge by simply measuring the resistance in a tem-perature range of 10 °C to 50 °C. To avoid a non-uniform temperature distribution within the steel ring, temperature was increased slowly (max. approx. 20 K/h). The resistance tempera-ture detectors were additionally protected from the influence of the air temperature. An exem-plary result is shown in Figure 6–4. The individual heating and cooling cycles yielded a good agreement of the apparent strains. A small hysteresis was noticeable in the range of approxi-mately 10 to 25 °C. The measured strain curve was very similar to the compensation function.
6.4.3 Repeatability
The precision of the restrained ring test under repeatability conditions was determined. A high-strength concrete composition with comparably low cracking susceptibility (c = 600 kg/m³, w/c = 0.3, max. grain size: 0.5 mm) was used for this investigation in order to minimize the potentially irregular influence of micro-cracks. Concrete was mixed four times in a row. Two rings were produced from each mix. All eight rings remained sealed during the first 24 h and then were unsealed on top and bottom and stored at 20 °C and 65 % RH. The resultant steel ring strains are shown in Figure 6–5, the standard deviation and the coefficient of variation in Figure 6–6. Several points can be noticed. First, strains were close to zero before stresses started to develop at the age of approx. 11 h, indicating the reliability of the measur-ing system. Second, due to the desired high degree of restraint the maximum strain within the first 24 h was approx. 15 µm/m, compared to 50 µm/m recommended for good precision in [Moo 06]. Third, due to the very low strains the coefficient of variation around the onset of stress development was very high and went down to more acceptable values only some hours later. Notably, the standard deviation between 11 and 24 h was as low as 0.8 to 1.5 µm/m; sig-nificantly lower values could be achieved only with a much higher effort. In any case, a rea-sonably high number of ring tests is required for investigations at very early age. The ob-served variation of strains mainly can be attributed to the variation of batches, of temperature, of concrete ring dimensions as well as of the strain gauges and their assembly within the setup.
-20.0
-15.0
-10.0
-5.0
0.0
0 4 8 12 16 20 24
Age [h]
Ste
el r
ing
stra
in [
µm
/m]
-60.0
-50.0
-40.0
-30.0
-20.0
-10.0
0.0
0 12 24 36 48 60 72
Age [h]
Ste
el r
ing
stra
in [
µm
/m]
Figure 6–5 Eight restrained ring tests under repeatability conditions with a high-strength concrete (c = 600 kg/m³, w/c = 0.3, max. grain size of 0.5 mm): steel ring strain vs. age, left: 0-24 h, right: 0-72 h

101
0.0
5.0
10.0
15.0
20.0
25.0
30.0
12 18 24 30 36 42 48 54 60 66 72
Age [h]
Sta
ndar
d de
viat
ion
[µm
/m]
/C
oeff
icie
nt o
f va
riat
ion
[%]
Coefficient of variation [%]
Standard deviation [µm/m]
Figure 6–6 Standard deviation and coefficient of variation for eight restrained ring tests under repeatability conditions with a high-strength concrete (c = 600 kg/m³, w/c = 0.3, max. grain size of 0.5 mm)
6.4.4 Measured steel ring strains
The main investigations with restrained ring tests involved the reference concrete composition (1A), the concrete composition with a large amount of ground-granulated blast furnace slag (1A BFS) and the two concrete compositions with superabsorbent polymers and shrinkage-reducing admixture (1A SAP, 1A SRA). Six rings were produced from three mixes of each concrete composition, except for concrete 1A BFS which was mixed only twice, hence four rings were produced in this case. Measurements were continued until the age of 72 h. The sin-gle results of all tests can be found in the Annex (Figure 9–13 to Figure 9–16). Here, the evalua-tion is limited to the first 24 h which turned out to be most relevant. The mean steel ring strains until the age of 24 h are shown in Figure 6–7.
Steel ring strains were close to zero until the age of 8 h. This indicates the reliability of the data (cf. 6.4.2). The steel rings started to deform at approximately 8, 9, 12 and 15 h for con-crete 1A, 1A SAP, 1A SRA and 1A BFS, respectively. Strains then constantly increased with concrete 1A BFS. With concrete 1A SAP this was the case until 16 h, thereafter the strain was almost constant. By contrast, with concretes 1A and 1A SRA the strains reached a maximum at approx. 14 h (14 µm) and 19 h (6 µm/m), respectively, and significantly decreased after-wards, obviously due to time-dependent deformations. At 24 h the strains were in the range of 4 to 10 µm/m for all concretes. The reference concrete 1A yielded the highest strains. No cracks were observed on any of the rings.

102
-20
-15
-10
-5
0
5
0 2 4 6 8 10 12 14 16 18 20 22 24
Age [h]
Ste
el r
ing
stra
in [
µm
/m]
.
1A BFS
1A 1A SAP
1A SRA
Figure 6–7 Steel ring strain up to the age of 24 h
6.4.5 Simple stress analysis
6.4.5.1 Maximum hoop stress
The maximum restraint stress, i.e. the hoop stress at r = RC,i as per Equation 6–11, is shown in Figure 6–8. It is reminded that this stress is proportional to the steel ring strain (Figure 6–7). For the conversion of strains to stresses, the Poisson’s ratio of concrete was assumed to be 0.18. Concrete 1A yielded the highest stress at 14 h (1.87 MPa); at 24 h the stress amounted to 1.39 MPa, corresponding to a decrease of approx. 25 %. Concrete 1A SAP reached a stress of 1.0 MPa at 16 h which did not significantly change anymore afterwards. The lowest stress at the age of 24 h was found for concrete 1A SRA (0.54 MPa); the maximum in this case oc-curred at approx. 19 h (0.8 MPa). Concrete 1A BFS yielded a tensile stress of 0.67 MPa at 24 h and was the only concrete with a positive stress rate at 24 h.
0.0
0.5
1.0
1.5
2.0
2.5
6 8 10 12 14 16 18 20 22 24
Age [h]
Res
trai
nt s
tres
s [M
Pa]
. 1A
1A SAP
1A SRA
1A BFS
Figure 6–8 Restrained ring tests: stress due to restrained autogenous shrinkage in ultra-high strength concrete

103
Additional tests with an alternative superplasticizer were carried out (SP2, cf. Table 3–1). As is shown in Figure 6–9, the superplasticizer significantly influenced the development of restraint stresses. Although concrete 1A SP2 contained more superplasticizer than the reference con-crete 1A, hydration was much less retarded. Stresses were higher and increased more rapidly. Again, the maximum stress was followed by a characteristic decrease.
0.0
0.5
1.0
1.5
2.0
2.5
4 6 8 10 12 14 16 18 20 22 24
Age [h]
Res
trai
nt s
tres
s [M
Pa]
.
1A
1A SP 2
Figure 6–9 Influence of different superplasticizers on restraint stress in ultra-high strength concrete
6.4.5.2 Degree of restraint
As was illustrated in section 5.2, the degree of restraint describes how two elastic bodies are restrained by each other when a force acts in between them. The resultant deformations are proportional to the inverse ratio of the stiffness of the two bodies (Figure 5–1). For the re-strained ring tests the degree of restraint was calculated as ratio of prevented to free radial displacement of the concrete ring in the restrained ring test (cf. Equation 5–1).
The static modulus of elasticity which is required to compute the prevented deformations (cf. Equations 6–4 to 6–8), evolves with time (cf. 3.5.3). The fitting procedure that was required to obtain the development of the modulus of elasticity was described in section 3.5.4. To com-pute the degree of restraint until the age of 24 h by means of Equation 6–8, intervals of 1 h were considered.
The development of the degree of restraint is shown in Figure 6–10. Note that the dashed lines represent the range of extrapolation of the modulus of elasticity. Restraint was complete until the onset of steel ring deformations, i.e. the degree of restraint was 1. With concretes 1A and 1A SAP the degree of restraint decreased to approximately 0.84 at the age of 24 h. Reflecting the slower development of the modulus of elasticity, the degree of restraint with concretes 1A SRA and 1A BFS decreased later and amounted to approximately 0.86 and 0.93 at 24 h, re-spectively.

104
0.80
0.85
0.90
0.95
1.00
6 8 10 12 14 16 18 20 22 24
Age [h]
Deg
ree
of r
estr
aint
[-]
1A BFS
1A SRA
1A
1A SAP
Figure 6–10 Degree of restraint in restrained ring tests (dashed: extrapolation of modulus of elasticity)
Notably, the fact that the degree of restraint differed, does not mean that the further results ob-tained from the four concretes were not comparable. The same stress levels that resulted from the respective degree of restraint in the restrained ring tests would have occurred in praxis if shrinkage was restrained not by the steel ring but by an object with the steel ring’s stiffness. On the other hand, the degree of restraint influences the stress history, i.e. the stress level over time. The maximum autogenous shrinkage cracking propensity of the four concretes possibly would have been different and would have occurred at another point of time if the stress his-tory had been different. To investigate this, different ring geometries with different degrees of restraint would be required.
6.4.5.3 Theoretical-elastic stress and creep factor
The theoretical-elastic stress is important for the evaluation of restrained ring tests because it allows quantifying the influence of stress relaxation (cf. 5.4 and 6.3.2.2). It essentially de-pends on the modulus of elasticity and the autogenous shrinkage. The following figure shows the development of the theoretical-elastic stress as per Equation 6–9 (Figure 6–11). If concrete behaved entirely elastically, autogenous shrinkage of concrete 1A would have yielded a stress of approximately 5.8 MPa at the age of 24 h. As a consequence of the lower modulus of elas-ticity and/or lower autogenous shrinkage, the other concretes led to much lower theoretical-elastic stresses.
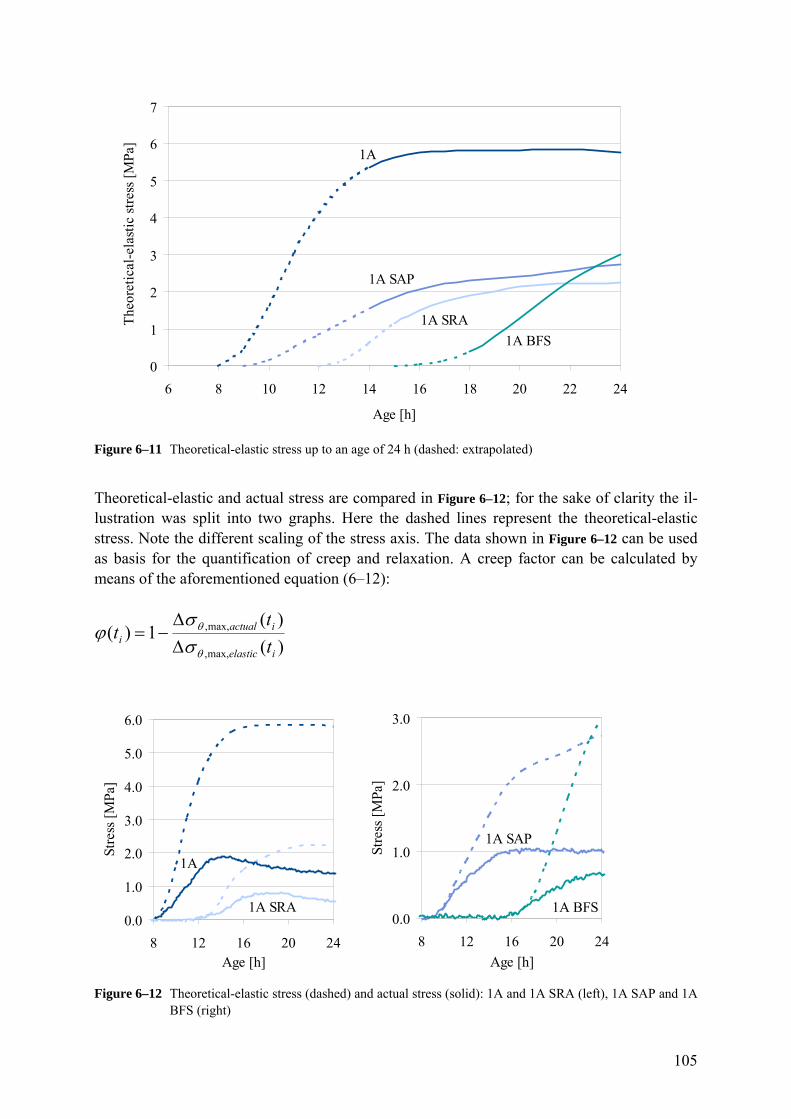
105
0
1
2
3
4
5
6
7
6 8 10 12 14 16 18 20 22 24
Age [h]
The
oret
ical
-ela
stic
str
ess
[MPa
]
1A BFS
1A SRA
1A
1A SAP
Figure 6–11 Theoretical-elastic stress up to an age of 24 h (dashed: extrapolated)
Theoretical-elastic and actual stress are compared in Figure 6–12; for the sake of clarity the il-lustration was split into two graphs. Here the dashed lines represent the theoretical-elastic stress. Note the different scaling of the stress axis. The data shown in Figure 6–12 can be used as basis for the quantification of creep and relaxation. A creep factor can be calculated by means of the aforementioned equation (6–12):
)(
)(1)(
max,,
max,,
ielastic
iactuali t
tt
0.0
1.0
2.0
3.0
4.0
5.0
6.0
8 12 16 20 24Age [h]
Stre
ss [
MPa
]
1A SRA
1A
0.0
1.0
2.0
3.0
8 12 16 20 24
Age [h]
Stre
ss [
MPa
]
1A BFS
1A SAP
Figure 6–12 Theoretical-elastic stress (dashed) and actual stress (solid): 1A and 1A SRA (left), 1A SAP and 1A BFS (right)

106
The result depends on the time interval that is considered. Figure 6–13 shows the creep factor for the entire period observed (0 to 24 h), calculated from theoretical-elastic and actual stress at the age of 24 h. Between 64 and 78 % of the stresses which would have been expected with purely elastic behavior were eliminated by creep and relaxation. The creep factor of concretes 1A, 1A SRA and 1A BFS was very similar. The slightly different behavior of concrete 1A SAP is addressed in chapter 6.4.9.
0.76
0.64
0.76 0.78
0.0
0.2
0.4
0.6
0.8
1.0
1A 1A SAP 1A SRA 1A BFS
Concrete
Cre
ep f
acto
r [-
]
Figure 6–13 Creep factor up to the age of 24 h
The creep factors were generally lower than the 0.9 that were observed in [Sch 07] and [Sch 02] for ultra-high strength concrete. However, in that investigation the autogenous shrinkage was measured with a test method with unknown precision and the autogenous shrinkage was higher than in any other previous investigation of ultra-high strength concrete, cf. Figure 2–5. An overestimation of the autogenous shrinkage would lead to an overestimation of the influ-ence of relaxation and creep. Of course there are other potential sources of error as well, for instance the extrapolation of the very early age values of the modulus of elasticity. The con-crete composition was different as well. Insofar one can speak of a reasonable agreement of the creep factors observed for the first 24 h. A creep factor for long periods with rapidly changing concrete properties is a very rough description of the viscoelastic behavior, anyway. To possibly obtain a more detailed picture of the creep behavior, shorter time-intervals need to be considered (cf. 6.4.11).
6.4.6 Autogenous shrinkage cracking propensity - further analysis
6.4.6.1 Introduction
To compute the autogenous shrinkage cracking propensity as function of time, the stresses due to restrained autogenous shrinkage can be related to the tensile strength development (cf. 5.6). This approach was employed here, too. To achieve reliable results, the two input pa-rameters of the stress-strength ratio were comprehensively analyzed. It is noted that for the following computations the stress values shown in Figure 6–8 were fitted to best-fit functions. The data used for the stress analysis can be found in the Annex (Table 9–5 to Table 9–8).
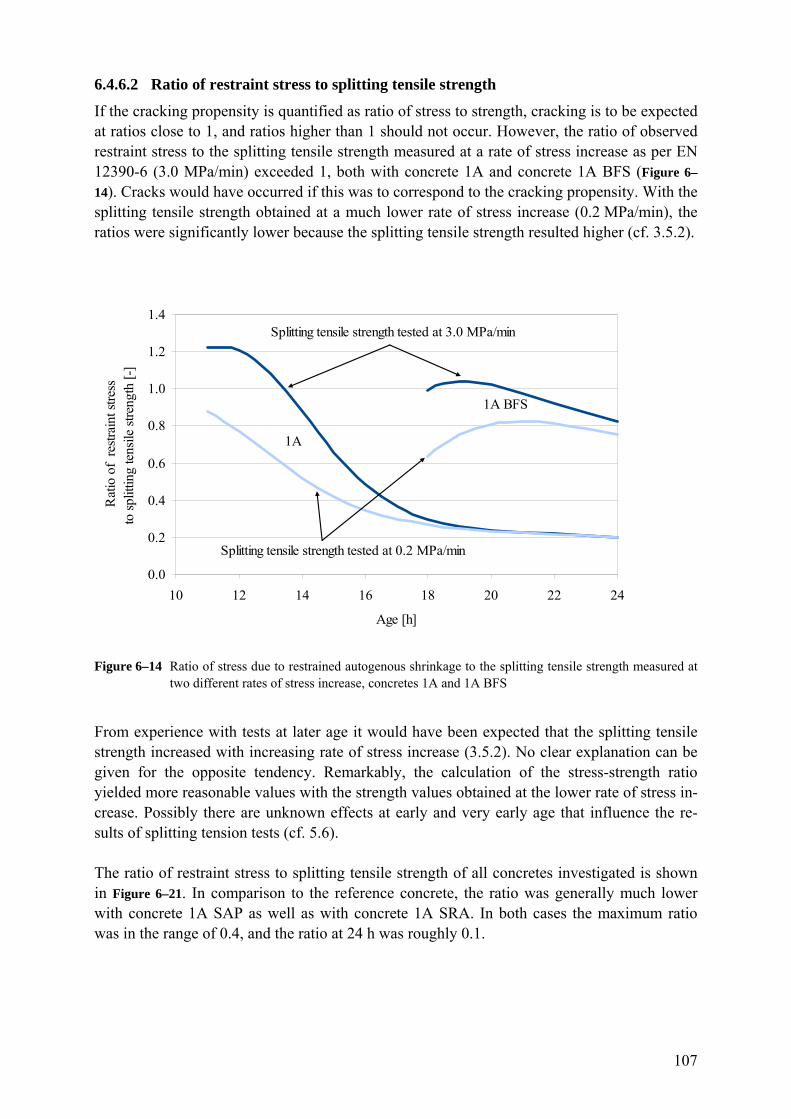
107
6.4.6.2 Ratio of restraint stress to splitting tensile strength
If the cracking propensity is quantified as ratio of stress to strength, cracking is to be expected at ratios close to 1, and ratios higher than 1 should not occur. However, the ratio of observed restraint stress to the splitting tensile strength measured at a rate of stress increase as per EN 12390-6 (3.0 MPa/min) exceeded 1, both with concrete 1A and concrete 1A BFS (Figure 6–
14). Cracks would have occurred if this was to correspond to the cracking propensity. With the splitting tensile strength obtained at a much lower rate of stress increase (0.2 MPa/min), the ratios were significantly lower because the splitting tensile strength resulted higher (cf. 3.5.2).
0.0
0.2
0.4
0.6
0.8
1.0
1.2
1.4
10 12 14 16 18 20 22 24
Age [h]
Rat
io o
f r
estr
aint
str
ess
to s
plitt
ing
tens
ile s
tren
gth
[-]
Splitting tensile strength tested at 3.0 MPa/min
Splitting tensile strength tested at 0.2 MPa/min
1A
1A BFS
Figure 6–14 Ratio of stress due to restrained autogenous shrinkage to the splitting tensile strength measured at two different rates of stress increase, concretes 1A and 1A BFS
From experience with tests at later age it would have been expected that the splitting tensile strength increased with increasing rate of stress increase (3.5.2). No clear explanation can be given for the opposite tendency. Remarkably, the calculation of the stress-strength ratio yielded more reasonable values with the strength values obtained at the lower rate of stress in-crease. Possibly there are unknown effects at early and very early age that influence the re-sults of splitting tension tests (cf. 5.6).
The ratio of restraint stress to splitting tensile strength of all concretes investigated is shown in Figure 6–21. In comparison to the reference concrete, the ratio was generally much lower with concrete 1A SAP as well as with concrete 1A SRA. In both cases the maximum ratio was in the range of 0.4, and the ratio at 24 h was roughly 0.1.

108
0.0
0.2
0.4
0.6
0.8
1.0
1.2
1.4
10 12 14 16 18 20 22 24
Age [h]
Rat
io o
f r
estr
aint
str
ess
to s
plitt
ing
tens
ile s
tren
gth
[-]
1A SAP
1A SRA
1A
1A BFS
Figure 6–15 Ratio of restraint stress to splitting tensile strength, concretes 1A, 1A SAP, 1A SRA and 1A BFS
6.4.6.3 Stress redistribution
As described above, the steel ring strains measured in restrained ring tests usually are con-verted to hoop stresses under the assumption of an elastic non-linear stress distribution along the radial direction of the concrete cross section (cf. 6.3.2). According to the elastic solution the hoop stresses are highest at the inner and lowest at the outer radius of the concrete ring. The hoop stress at an arbitrary radius r results from the Lamé line (cf. Figure 6–9).
However, in this and in other studies a strong influence of stress relaxation on stresses due to restrained autogenous shrinkage was observed (cf. Figure 6–13). In such cases it is not reason-able to assume that the hoop stresses are distributed along the concrete ring radius like in a purely elastic material. Instead, it must be assumed that a hoop stress redistribution occurs during the period of high stress relaxation capacity. Larger deformations caused by higher stress-strength ratios at the inner concrete radius lead to an outward stress redistribution (Figure 6–16, left).
Figure 6–16 Stress redistribution in restrained ring tests. Left: hoop stresses between two points in time in-crease more at the outer than at the inner radius (o,t1→t2 > i,t1→t2); right: stress equilibrium as the theoretical state of maximum stress redistribution (i = o).
i,t1 i,t2
o,t1 o,t2
i o
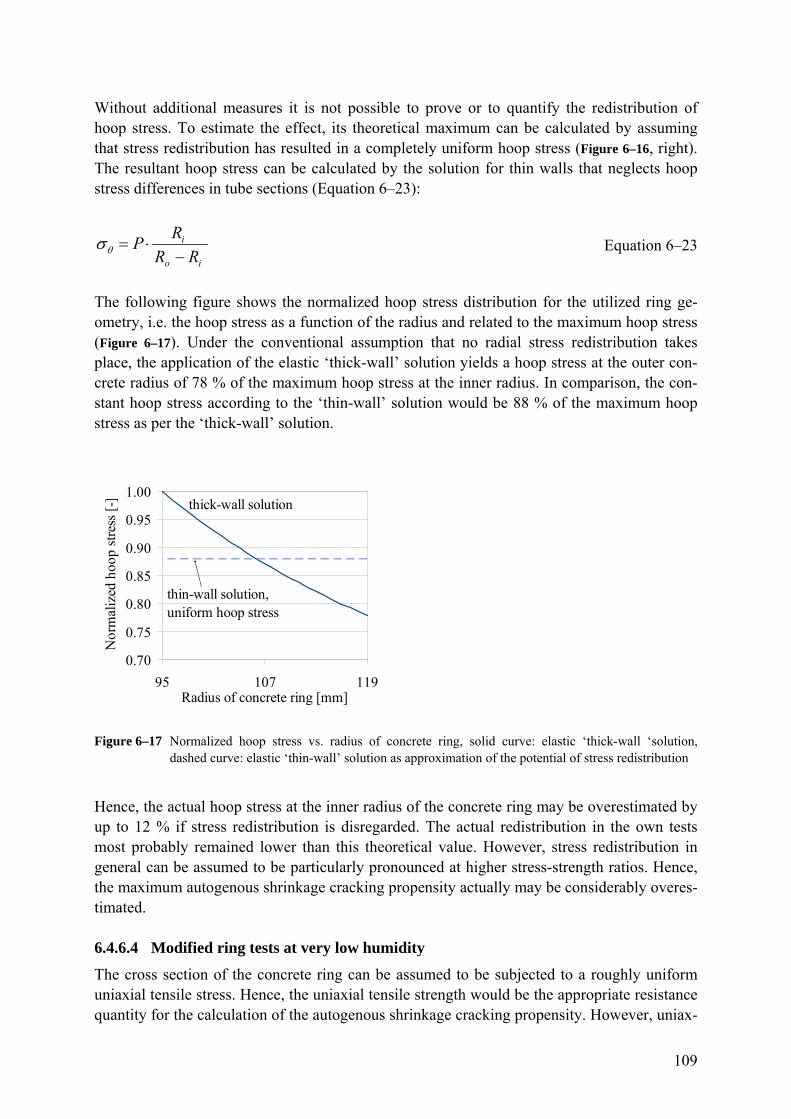
109
Without additional measures it is not possible to prove or to quantify the redistribution of hoop stress. To estimate the effect, its theoretical maximum can be calculated by assuming that stress redistribution has resulted in a completely uniform hoop stress (Figure 6–16, right). The resultant hoop stress can be calculated by the solution for thin walls that neglects hoop stress differences in tube sections (Equation 6–23):
io
i
RR
RP
Equation 6–23
The following figure shows the normalized hoop stress distribution for the utilized ring ge-ometry, i.e. the hoop stress as a function of the radius and related to the maximum hoop stress (Figure 6–17). Under the conventional assumption that no radial stress redistribution takes place, the application of the elastic ‘thick-wall’ solution yields a hoop stress at the outer con-crete radius of 78 % of the maximum hoop stress at the inner radius. In comparison, the con-stant hoop stress according to the ‘thin-wall’ solution would be 88 % of the maximum hoop stress as per the ‘thick-wall’ solution.
0.70
0.75
0.80
0.85
0.90
0.95
1.00
95 107 119Radius of concrete ring [mm]
Nor
mal
ized
hoo
p st
ress
[-] thick-wall solution
thin-wall solution, uniform hoop stress
Figure 6–17 Normalized hoop stress vs. radius of concrete ring, solid curve: elastic ‘thick-wall ‘solution, dashed curve: elastic ‘thin-wall’ solution as approximation of the potential of stress redistribution
Hence, the actual hoop stress at the inner radius of the concrete ring may be overestimated by up to 12 % if stress redistribution is disregarded. The actual redistribution in the own tests most probably remained lower than this theoretical value. However, stress redistribution in general can be assumed to be particularly pronounced at higher stress-strength ratios. Hence, the maximum autogenous shrinkage cracking propensity actually may be considerably overes-timated.
6.4.6.4 Modified ring tests at very low humidity
The cross section of the concrete ring can be assumed to be subjected to a roughly uniform uniaxial tensile stress. Hence, the uniaxial tensile strength would be the appropriate resistance quantity for the calculation of the autogenous shrinkage cracking propensity. However, uniax-

110
ial tensile strength tests at very early age would be very difficult and results possibly not reli-able. Here, splitting tension tests were carried out instead (cf. 3.5.2). As the uniaxial tensile strength was not tested, the ratio of splitting to uniaxial tensile strength could not be deter-mined. Other studies did not provide appropriate coefficients, either.
To examine the relation of the tested splitting tensile strength to the tensile strength in the re-strained concrete rings, modified ring tests were carried out with concretes 1A and 1A BFS. First, rings remained sealed like in the main test series. Then, starting from different ages, ring by ring was allowed drying from top and bottom at very low relative humidity. To this pur-pose, the rings were placed in an airtight container, together with approximately 200 g of dry lithium chloride (cf. Figure 9–12). The lithium chloride decreased the relative humidity inside the ventilated container within 15 min to approximately 30 %. The temperature increased by 2 to 3 K due to the exothermic reaction of the lithium chloride, however this temperature in-crease can be disregarded in this context.
The drying led to a rapid increase of strains. With concrete 1A, macro-cracks occurred after few minutes when drying began at 8 h and 10 h (Figure 6–18). Later onsets of drying led to a rapid increase of strains, followed by a more (11 h) or less (12 h) abrupt decrease of the strain rate, probably indicating substantial micro-cracking. Drying from the age of 14 h led to a smaller peak of strains; possibly micro-cracks occurred, however, the strain rate afterwards was almost as high as before the peak. Similarly, with concrete 1A BFS, harsh drying from 18 h led to a through-crack, whereas micro-cracking is supposed to have occurred in the rings that were unsealed at 18 h and 22.75 h (Figure 6–19).
-25
-20
-15
-10
-5
0
8 9 10 11 12 13 14 15
Age [h]
Stee
l rin
g st
rain
[µ
m/m
] .
8 h 10h 11 h 12 h 14 h
Sealed until and harsh drying from the age of:
Through-crack
Presumed micro-cracking
Figure 6–18 Results of modified restrained ring tests with rings rapidly drying out from top and bottom from different ages, steel ring strain vs. age of concrete, concrete 1A

111
-15
-12
-9
-6
-3
0
15 16 17 18 19 20 21 22 23 24 25Age [h]
Stee
l rin
g st
rain
[µ
m/m
] .
18 h 20 h 22.75 h
Sealed until and harsh drying from the age of:
Through-crack
Presumed micro-cracking
Figure 6–19 Results of modified restrained ring tests with rings rapidly drying out from top and bottom from different ages, steel ring strain vs. age of concrete, concrete 1A BFS
Since the rings dried out from top and bottom but not from the circumference, the moisture profile in radial direction can be assumed to have remained uniform. Hence, the same equa-tions apply that were used to calculate the maximum hoop stress due to restrained autogenous shrinkage. With concrete 1A, the stress at failure at the age of 8 h and 10 h was calculated from the respective maximum steel ring strains. In the case of harsh drying from 11, 12 and 14 h, not leading to complete failure, the stress which corresponded to the local strain peak was calculated. The same was done for the through crack that was observed at 18 h with con-crete 1A BFS and the presumed micro-cracking at 20 and 23 h.
The obtained peak and failure stresses then were divided by the respective splitting tensile strength values (obtained at a rate of stress increase of 3.0 MPa/min, cf. 3.5.2). The resultant ratios of maximum hoop stress to splitting tensile strength as function of concrete age are shown in Figure 6–20 for concrete 1A (left) and 1A BFS (right). With concrete 1A, the ratio strongly decreased from approximately 2.7 at 10 h to 1.1 at 14 h, with concrete 1A BFS from 2.9 at 18 h to 2.2 at 23 h. Non-linear trends were tentatively added to the single values. Obvi-ously the splitting tensile strength needs to be corrected by a non-linear function to be compa-rable to the tensile strength in the rings at very early age.

112
1.0
1.5
2.0
2.5
3.0
9 10 11 12 13 14 15
Age [h]
Rat
io o
f m
ax. r
ing
stre
ss .
to s
plitt
ing
tens
ile s
tren
gth
1.0
1.5
2.0
2.5
3.0
16 18 20 22 24
Age [h]
Rat
io o
f m
ax. r
ing
stre
ss .
to s
plitt
ing
tens
ile s
tren
gth
Figure 6–20 Ratio of failure/peak stress measured in modified restrained ring tests to splitting tensile strength, as a function of concrete age; single values and trend. Left: concrete 1A, right: concrete 1A BFS
6.4.6.5 Very early age effects and autogenous shrinkage cracking propensity
In the previous sections three potential ‘very early age effects’ were described: the influence of the rate of stress increase on the results of splitting tension tests (6.4.6.2), stress redistribu-tion in restrained ring tests (6.4.6.3), and the fact that restraint stresses at failure were much higher than the splitting tensile strength (6.4.6.4). Hence, the computation of the autogenous shrinkage cracking propensity at very early age required a correction of the input parameters hoop stress and splitting tensile strength.
The splitting tensile strength was corrected on the basis of recently published findings of Ma-larics and Müller [Mal 10], (cf. also 5.6). In their comprehensive study the ratio of uniaxial to splitting tensile strength overproportionally increased with decreasing compressive strength (Figure 5–7). Based on experimental and numerical investigations, the authors suggested vari-ous power functions for the conversion of the two types of tensile strength. For cylindrical specimens (150 mm/300 mm) and concrete with crushed aggregate the following formula was proposed (Equation 6–24, cf. also Figure 5–7).
20.064.2 cmfA Equation 6–24
A: ratio of uniaxial to splitting tensile strength; fcm: mean compressive strength
Three other formulas concerned drilled cores or concrete with gravel aggregate and were con-sidered less suitable to represent cylinders made from fine-grained ultra-high strength con-crete. Notably, specimens for splitting tension tests in the own investigation were considera-bly smaller and the test setup was different. However, there was no other conversion formula in literature that would have been as appropriate.
The input parameter in Equation 6–24 is the compressive strength which in the own study was not tested at very early age. Therefore a constant ratio of compressive strength to splitting ten-sile strength of 10 was assumed (cf. [fib 10]). This factor was applied to the function that was fitted to the results of splitting tensile strength obtained at a rate of stress increase of 3.0 MPa/min.

113
The lowest compressive strength of the concretes tested by Malarics and Müller was 20 MPa. Here, the calculated compressive strength partly was much lower. For instance, the compres-sive strength of concrete 1A increased from approximately 5 to 12 MPa between 10 and 12 h.
The development of the ratio A as per Equation 6–24 is exemplified with concrete 1A and 1A BFS (Figure 6–21). Both concretes yielded ratios A above 2.5 for the period of first restraint stress (1A: 8h, 1A BFS: 15 h, cf. Figure 6–8); the ratio decreased disproportionally with in-creasing age. For the calculation of the autogenous shrinkage cracking propensity the splitting tensile strength of all concretes was multiplied by the respective ratios A.
1.0
1.5
2.0
2.5
3.0
8 10 12 14 16 18 20 22 24
Age [h]
Rat
io o
f u
niax
ial
to s
plitt
ing
tens
ile s
tren
gth
[-]
1A
1A BFS
2.64·fc-0.20 (from [Mal 10])
Figure 6–21 Expected ratio of uniaxial to splitting tensile strength as a function of age, calculated from the 10fold splitting tensile strength by means of a conversion formula suggested in [Mal 10]
Furthermore, stress redistribution in restrained ring tests due to plastic deformations needed to be accounted for. For concrete 1A stress redistribution was assumed to be at its theoretical maximum until 11 h and nil from the age of 16 h (cf. 6.4.6.3). The assumed uniform stress distribution until 11 h was calculated by Equation 6–23 (‘thin-wall’ solution). Values between 11 and 16 h were interpolated; the maximum hoop stress after 16 h was not corrected. A more precise consideration was neither possible nor necessary. In comparison to the strong correc-tion of the splitting tensile strength with factors exceeding 2, the influence of stress redistribu-tion was low.
For concrete 1A BFS stress redistribution was assumed to be maximal at 17 h and nil at 24 h. Again, other values were interpolated. Stress redistribution was neglected with concretes 1A SAP and 1A SRA which led to much lower stress-strength ratios; here only the splitting ten-sile strength was corrected.
The resultant ratio of (corrected) restraint stress to (corrected) splitting tensile strength is shown in Figure 6–22. The maximum stress-strength ratio was approximately 0.68 and 0.49 for

114
concrete 1A and 1A BFS, respectively; this is coherent with the fact that no cracks were ob-served. In comparison to concrete 1A BFS, the stress-strength ratio of the reference concrete decreased much more rapidly after the maximum. The superabsorbent polymers and the shrinkage reducing admixture reduced the maximum ratio to approximately 0.24. At 24 h, the ratio was roughly 0.1. Notably, with all concretes the maximum ratio occurred few hours after solidification.
0.0
0.2
0.4
0.6
0.8
1.0
10 12 14 16 18 20 22 24
Age [h]
Rat
io o
f c
orre
cted
res
trai
nt s
tres
s to
cor
rect
ed s
plitt
ing
tens
ile s
tren
gth
[-]
1A SAP
1A SRA
1A
1A BFS
Figure 6–22 Ratio of corrected restraint stress to corrected splitting tensile strength, concretes 1A, 1A SAP, 1A SRA and 1A BFS
To further examine the applicability of the stress-strength failure criterion and the validity of the assumptions that were required for the previous calculations, the curves as per Figure 6–22 were compared to the ratio of restraint stress to stress at failure in the modified restrained ring tests, i.e., the corrected splitting tensile strength as denominator in the stress-strength ratio was substituted by the failure stress (cf. Figure 6–18 and Figure 6–19). Since the stress at failure was tested only for selected ages, single points resulted from this. Filled points indicate through-cracks, others micro-cracking. To illustrate the rather little influence of stress redis-tribution, the curves were recalculated without its consideration (light curves).
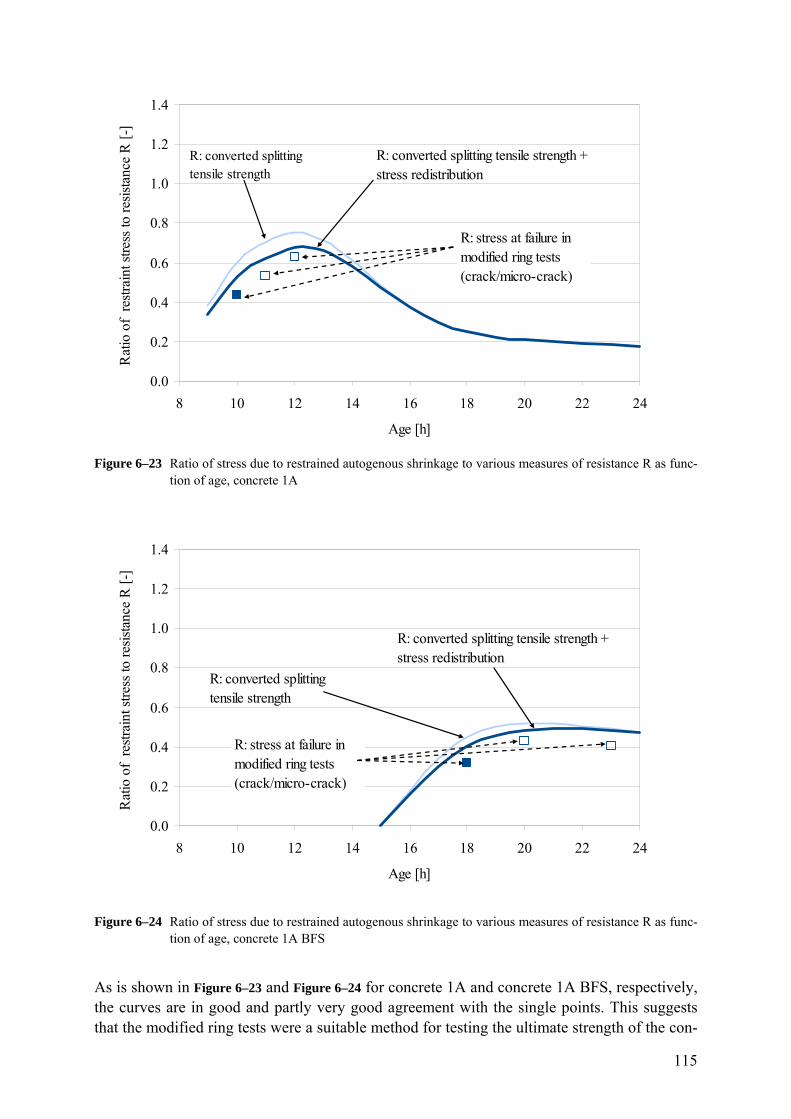
115
0.0
0.2
0.4
0.6
0.8
1.0
1.2
1.4
8 10 12 14 16 18 20 22 24
Age [h]
Rat
io o
f r
estr
aint
str
ess
to r
esis
tanc
e R
[-]
R: stress at failure in modified ring tests (crack/micro-crack)
R: converted splitting tensile strength + stress redistribution
R: converted splitting tensile strength
Figure 6–23 Ratio of stress due to restrained autogenous shrinkage to various measures of resistance R as func-tion of age, concrete 1A
0.0
0.2
0.4
0.6
0.8
1.0
1.2
1.4
8 10 12 14 16 18 20 22 24
Age [h]
Rat
io o
f r
estr
aint
str
ess
to r
esis
tanc
e R
[-]
R: stress at failure in modified ring tests (crack/micro-crack)
R: converted splitting tensile strength + stress redistribution
R: converted splitting tensile strength
Figure 6–24 Ratio of stress due to restrained autogenous shrinkage to various measures of resistance R as func-tion of age, concrete 1A BFS
As is shown in Figure 6–23 and Figure 6–24 for concrete 1A and concrete 1A BFS, respectively, the curves are in good and partly very good agreement with the single points. This suggests that the modified ring tests were a suitable method for testing the ultimate strength of the con-

116
crete rings. The good agreement furthermore indicates that the required assumptions were ap-propriate and that the stress-strength failure criterion can be applied also at very early age. It can be assumed that the curves that were obtained by correcting hoop stress and splitting ten-sile strength give a realistic picture of the development of the autogenous shrinkage cracking propensity under quasi-isothermal conditions (Figure 6–22).
6.4.7 Thermal stress component
6.4.7.1 Quasi-isothermal tests
At changing temperatures the hoop stress in restrained ring tests is influenced by a thermal stress component (6.3.2.3). Due to the small cross section of the rings used in this investiga-tion, temperatures of steel and concrete changed uniformly and temperature did not increase by more than 2 K in the quasi-isothermal tests. In order to examine to which extent this small temperature increase influenced results, the theoretical-elastic hoop stress due to temperature changes was calculated for concrete 1A (cf. 6.3.2.3). The maximum of approximately 0.06 MPa occurred at 14 h (Figure 6–25). The overall theoretical-elastic stress at that age was approximately 4.7 MPa (Figure 6–12). Thus, the thermal stress component corresponded to 1.3 % of the overall elastic stress and was therefore negligible in its effect on the actual stress.
-0.2
-0.1
0.0
0.1
0.2
8 12 16 20 24
Age [h]
Str
ess
[MP
a]
20
21
22
23
24T
empe
ratu
re [
°C]
Figure 6–25 Theoretical-elastic stress (dashed) due to temperature changes (solid), concrete 1A
6.4.7.2 Tests under non-isothermal conditions
In section 6.3.2.3 a way to compensate for the thermal stress component in non-isothermal ring tests was suggested. The application of this method to very early age results is very diffi-cult, partly because the concrete’s coefficient of thermal expansion varies during that period. Its precise determination is very demanding (cf. 2.5.2 and 5.7). The required creep factor may be difficult to determine, too (cf. 6.3.2.2 and 6.4.11). The decreased precision of strain gauge measurements at changing temperatures and a non-uniform temperature increase throughout the ring system are other potential sources of error. Furthermore, the quality of the stress

117
analysis depends on the accurate measurement of the autogenous shrinkage and the elastic modulus under the same, non-isothermal conditions. As was mentioned above, there presently is no widely accepted method for measuring the autogenous shrinkage under non-isothermal conditions (cf. 2.3.3).
To examine the applicability of the suggested stress solution, the effect of temperature changes was investigated at a later age. By doing so, it was possible to largely overcome the aforementioned difficulties. Specific ring tests were carried out with reference concrete 1A between the age of 26 and 33 h. Hydration at that age had slowed down considerably. The autogenous shrinkage proceeded at high rates only until approx. 16 h and thereafter at very low rates close to zero (cf. 4.5). Here it was assumed that the autogenous shrinkage had come to a complete stop at 26 h. Likewise, the stress component due to autogenous shrinkage was taken as nil between 26 and 33 h. The CTE was assumed to be 11.2 µm/m/K (cf. 3.5.5).
Three rings were produced from a single mix of concrete 1A. The rings were sealed and placed in an oven. The relative humidity was maintained at approximately 80 % during the tests to avoid evaporation. At the age of (approx.) 26.5 h the air temperature inside the oven was rapidly increased from 24 °C to 35 °C, leading to an increase of ring temperatures and negative strains of 10 K and 9.5 µm/m, respectively, until 29 h (Figure 6–26). Note that the ini-tial peak in the strain curve is an artefact owing to the abrupt increase of air temperature and the associated non-uniform heating of the rings and the strain gauges. Then, at 29 h the air temperature was reduced rapidly from 35 °C to 22 °C. As a consequence, the ring temperature decreased by 12 K and the strain by 13.5 µm/m until 32 h. Again, the abrupt change of tem-perature led to a strain peak not corresponding to the change of stresses, this time smaller and in opposite direction.
20.0
25.0
30.0
35.0
40.0
45.0
18 21 24 27 30
Age [h]
Tem
pera
ture
[°C
]
-20
-15
-10
-5
0
5
Str
ain
[µm
/m] Measured Strains
Ring temperatures
Strains: artefacts due to abrupt change of air temperature
T2≈33 °C
T1≈23 °CT3≈21 °C
e1≈6.5 µm/m
Air temperature
e2≈16 µm/m
e3≈2.5 µm/m
Figure 6–26 Non-isothermal restrained ring tests: mean steel ring strain and temperature vs. age

118
The change of stress was calculated from the changes of strain and temperature. The increase of temperature between 26.5 h and 29 h led to an increase of the actual stress of 1.29 MPa. The increase of the theoretical-elastic stress was 1.48 MPa. The creep factor amounted to 0.128. Hence, 12.8 % of the theoretical-elastic stress were eliminated by creep or relaxation. In view of the much advanced hydration this appears a realistic value. At very early age the creep factors were much higher (cf. 6.3.2.2 and 6.4.11).
The calculation of the theoretical-elastic stress was carried out with an elastic modulus of 35.0 GPa for the entire period of temperature increase, whereas for the period of cooling a value of 36.5 GPa was assumed as a consequence of advanced hydration at increased tem-peratures. The decrease of the theoretical-elastic stress due to cooling amounted to 1.84 MPa. The actual stress within that period decreased by 1.84 MPa, too. Hence, the creep factor was zero. This can be seen as an indication of the reliability of the measurements and calculations because creep can be expected to play a negligible role whenever the stress decreases con-stantly and rapidly. However, slightly different input parameters would have significantly changed the value of the elastic stress. For instance, a coefficient of thermal expansion of 11.5 µm/m/K, i.e. only 0.3 µm/m/K higher than the applied one, would have yielded an elastic stress of 1.74 MPa, i.e. a notable difference. Also, several simplifying assumptions were made. More work is required to eventually establish the suitability of the outlined method.
6.4.8 Period of maximum cracking propensity
For future investigations of the autogenous shrinkage cracking propensity it can be helpful to localize in advance the period of maximum cracking propensity. Then especially the required tensile strength tests can be intensified during that period to get more reliable results. The fol-lowing figures show the autogenous shrinkage and the rate of heat of hydration over time for concrete 1A and 1A SRA (Figure 6–27 and Figure 6–28). In addition, the period of highest auto-genous shrinkage cracking propensity is indicated by the shaded bar.
0.0
0.2
0.4
0.6
0.8
1.0
1.2
1.4
1.6
1.8
2.0
6 8 10 12 14 16 18 20 22 24
Age [h]
Rat
e of
hea
t of
hydr
atio
n [m
W/g
] .
0.0
0.1
0.2
0.3
0.4
0.5
0.6
0.7
0.8
0.9
1.0
Aut
ogen
ous
shri
nkag
e [m
m/m
]
max
. ASC
P 1A
Shrinkage
Heat of hydration
(ASCP: autogenous shrinkage cracking propensity)
Figure 6–27 Period of maximum autogenous shrinkage cracking propensity (ASCP, shaded area) in comparison to free autogenous shrinkage and rate of heat of hydration, concrete 1A

119
0.0
0.2
0.4
0.6
0.8
1.0
6 8 10 12 14 16 18 20 22 24
Age [h]
Rat
e of
hea
t of
hydr
atio
n [m
W/g
] .
0.0
0.1
0.2
0.3
0.4
0.5
Aut
ogen
ous
shri
nkag
e [m
m/m
]
Shrinkage
Heat of hydration
max
. ASC
P, 1
A S
RA
(ASCP: autogenous shrinkage cracking propensity)
Figure 6–28 Period of maximum autogenous shrinkage cracking propensity (ASCP, shaded area) in comparison to free autogenous shrinkage and rate of heat of hydration, concrete 1A SRA
In both cases the maximum cracking propensity occurred before the maximum of heat release: 2 h earlier with concrete 1A and 4 h with concrete 1A SRA, approximately. Furthermore, in both cases the period of maximum cracking propensity coincided with the transition period from very rapid to very slow shrinkage. Results are based on investigations with one cement, and the development of the influencing parameters is closely related to the utilized cement. Hence, the findings at this point cannot be generalized. More tests with different cements are required to clarify whether the similarities found for the reference concrete and the concrete with shrinkage-reducing admixture indicate some general rule.
6.4.9 Restraint stress versus autogenous shrinkage
An interesting aspect of investigations of the autogenous shrinkage cracking propensity is the relation between free shrinkage and stress under restraint conditions. The following figure shows the restraint stress as function of the free autogenous shrinkage (Figure 6–29). Irrespec-tive of the concrete composition almost linear relations existed up to a strain of approximately 0.1 mm/m. These linear relations remained valid up to strains of 0.2, 0.3 and 0.4 mm/m for concretes 1A SAP, 1A and 1A BFS, respectively. With concretes 1A SAP and 1A BFS one can roughly speak of a linear relation throughout the whole test period. This can be attributed to the more steady development of autogenous shrinkage and mechanical properties. In con-trast to that, with concretes 1A and 1A SRA the stress first increased and then decreased dis-proportionally. The rapid decrease occurred when shrinkage was proceeding at very low rates (cf. Figure 4–21). In relation to the free autogenous shrinkage the stress development was most pronounced with concrete 1A SAP, i.e. smaller strains led to higher stresses. This was due to the fact that the superabsorbent polymers did postpone the beginning of autogenous shrinkage whereas the mechanical properties developed as rapidly as in concrete 1A.

120
0.0
0.5
1.0
1.5
2.0
0.0 0.1 0.2 0.3 0.4 0.5 0.6 0.7
Autogenous shrinkage [mm/m]
Res
trai
nt s
tres
s [M
Pa]
.
1A BFS
1A1A SAP
1A SRA
Figure 6–29 Restraint stress vs. autogenous shrinkage from 0 to 24 h
6.4.10 Cracking propensity versus autogenous shrinkage
One of the long-term goals of research on autogenous shrinkage is to predict the cracking propensity of a concrete from its free autogenous shrinkage. The following figure shows the relation of these two properties for the ultra-high strength concretes investigated in this study (Figure 6–30). The figure is built on the data shown in Figure 4–20 and Figure 6–22.
0.0
0.1
0.2
0.3
0.4
0.5
0.6
0.7
0.0 0.1 0.2 0.3 0.4 0.5 0.6 0.7
Autogenous shrinkage [mm/m]
Aut
ogen
ous
shri
nkag
e cr
acki
ng p
rope
nsit
y [-
] .
1A
1A BFS
1A SAP
1A SRA
Figure 6–30 Autogenous shrinkage cracking propensity as function of autogenous shrinkage (solid curves), maximum cracking propensity in comparison to the function y = x (single values and dotted line)

121
Concretes with higher shrinkage led to higher maxima of cracking propensity, except for con-crete 1A SRA. Remarkably, the maxima were relatively close to the linear function y = x. Hence, as a rule of thumb, at least for concrete compositions with the utilized cement, the autogenous shrinkage cracking propensity can be assumed to be in the range of the free auto-genous shrinkage (expressed in mm/m). This rule needs to be verified for other concrete com-positions.
Furthermore, the cracking propensity of concrete 1A (and similarly that of concrete 1A SRA) decreased rapidly after the peak. Notably, in the 2 h following the point of maximum cracking propensity of concrete 1A at 0.63 mm/m, i.e. between approximately 12 and 14 h, the actual stress increased from 1.45 to 1.87 MPa (cf. Figure 6–8). Also the autogenous shrinkage in-creased by another 0.064 mm/m, i.e. by additional 10 %. However, the rates of autogenous shrinkage and modulus of elasticity already decreased during that period, whereas the rate of the splitting tensile strength increased (cf. Figure 4–20 and Figure 3–9). Hence, from this period the resistance increased more rapidly than the stress, and therefore the autogenous shrinkage cracking propensity decreased at an increasing rate.
The high rate at which the autogenous shrinkage cracking propensity of concrete 1A de-creased indicates that only large and rapid temperature decreases may increase the stress-strength ratio to values above the maximum ratio observed at the age of around 12 h. Thus, the superposition of thermal and autogenous shrinkage strains in this case appears not as seri-ous a problem as sometimes suspected for high strength concrete in general, for instance in [IPACS].
However, this may be different for concrete 1A BFS. Here the stress-strength ratio decreases much more slowly, so that rapidly decreasing concrete temperatures due to decreasing ambi-ent temperature may lead to stress-strength ratios above the one observed in the quasi-isothermal ring tests. Notably, the coefficient of thermal expansion was much higher for con-crete 1A BFS as well (cf. Figure 3–12).
6.4.11 Further considerations on creep
As was outlined in the previous two sections, the prediction of restraint stress and cracking propensity from free autogenous shrinkage and mechanical properties is an essential task of research. Due to the high stress relaxation capacity at very early age, the restraint stress can-not be computed as per Hooke’s law from autogenous shrinkage and modulus of elasticity. Some term is required to account for the influence of creep and relaxation. Commonly such terms are determined by creep and relaxation tests. This approach is not feasible with re-strained ring tests (5.5). Instead, the ratio of actual to theoretical-elastic is used to quantify the influence of time-dependent deformations (cf. 6.3.2.2).
Here, for three out of four investigated ultra-high strength concretes it was found that roughly 75 % of the theoretical-elastic stress were eliminated by creep and relaxation during the first 24 h (6.4.5.3). This was in fair agreement with results of an earlier study cited above. Fur-thermore, in the previous section it was shown that the maximum cracking propensity for the concretes investigated could be estimated with reasonable precision by means of a linear func-tion from the autogenous shrinkage. This surprisingly simple correlation in part can be attrib-uted to the fact that the overall influence of creep was similar for all concretes.

122
Nevertheless, the global consideration of elastic and actual stresses at 24 h gives a rather rough description of the influence of creep and relaxation, not suitable for predicting the pre-cise development of the actual stress from the elastic stress. In particular, it is impossible to estimate the stress development in case additional stresses occur, for instance due to drying shrinkage.
To examine whether a more detailed analysis is feasible, the creep factor was calculated from the stress increments that occurred within 1 h. Figure 6–31 shows the ‘1 h-creep factor’ for con-crete 1A between the age of 8 h and 16 h (left) and between the age of 8 h and 24 h (right). The left part of Figure 6–31 reveals that the creep factor until 14 h was roughly 0.5 to 0.75. Hence, 50 to 75 % of the theoretical-elastic stress increment were ‘relaxed’ within each hour. After 14 h the creep factor exceeded 1, meaning that the actual stress decreased while the theoretical-elastic stress still increased.
0.0
0.5
1.0
1.5
2.0
8-9
h
9-10
h
10-1
1 h
11-1
2 h
12-1
3 h
13-1
4 h
14-1
5 h
15-1
6 h
Time interval
Cre
ep f
acto
r [-
]
1A
-5.0
0.0
5.0
10.0
15.0
20.0
Time interval
Cre
ep f
acto
r [-
]
8-9
h
23-2
4 h
Figure 6–31 Creep factor for intervals of 1 h, concrete 1A, left: 8 h to 16 h, right: 8 h to 24 h
As can be seen in the right part of Figure 6–31, at approximately 18 h the creep factor started to vary enormously. During the subsequent period the theoretical-elastic stress did hardly change anymore (cf. Figure 6–12, left). The division by very small numbers obviously led to large er-rors. No consistent interpretation is possible.
For the interval from 22 h to 23 h the creep factor resulted negative because theoretical-elastic and actual stress decreased by 0.013 MPa and 0.03 MPa, respectively. The decrease of 0.03 MPa (actual stress) corresponded to a decrease of the steel ring strain of 0.22 µm/m, whereas the standard deviation in the repeatability tests was 0.8 to 1.5 µm/m during that pe-riod, cf. Figure 6–5. The decrease of 0.013 MPa (theoretical-elastic stress) corresponded to a free shrinkage deformation of approximately 0.06 µm, which was one tenth of the resolution of the utilized laser. Hence, the deformations in the time-intervals observed were too small to be reasonably measured with the utilized test setups.
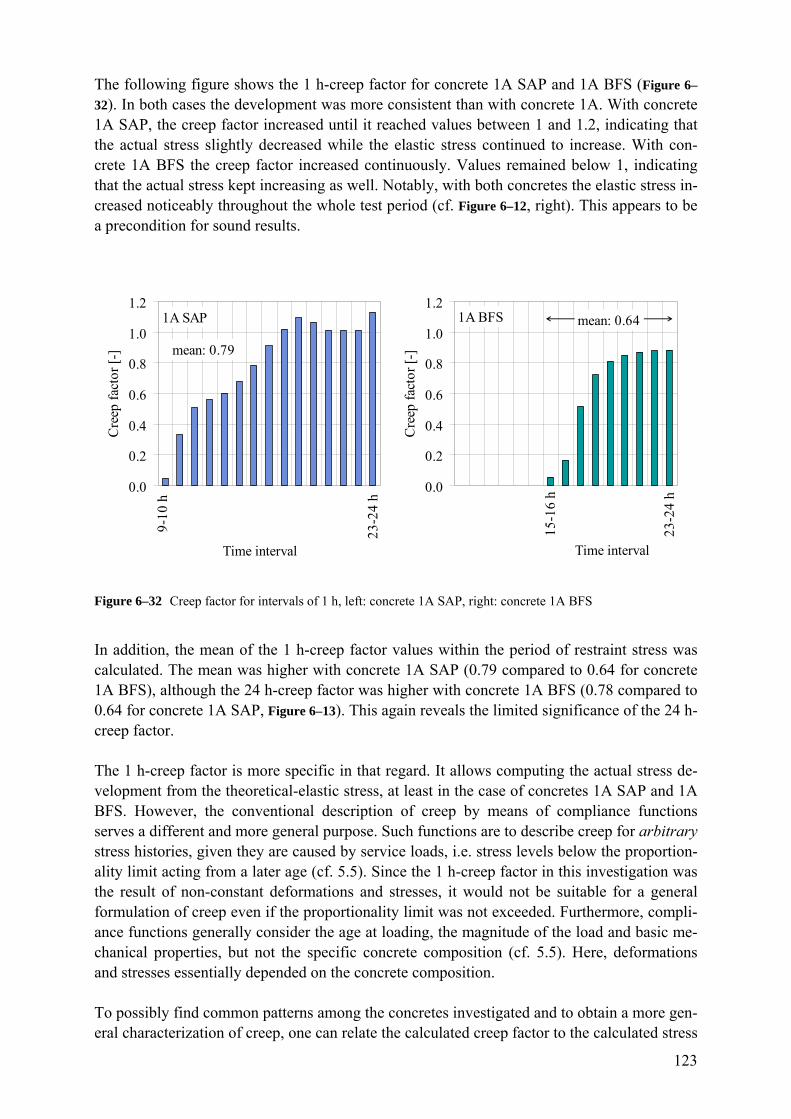
123
The following figure shows the 1 h-creep factor for concrete 1A SAP and 1A BFS (Figure 6–
32). In both cases the development was more consistent than with concrete 1A. With concrete 1A SAP, the creep factor increased until it reached values between 1 and 1.2, indicating that the actual stress slightly decreased while the elastic stress continued to increase. With con-crete 1A BFS the creep factor increased continuously. Values remained below 1, indicating that the actual stress kept increasing as well. Notably, with both concretes the elastic stress in-creased noticeably throughout the whole test period (cf. Figure 6–12, right). This appears to be a precondition for sound results.
0.0
0.2
0.4
0.6
0.8
1.0
1.2
Time interval
Cre
ep f
acto
r [-
]
9-10
h
23-2
4 h
1A SAP
mean: 0.79
0.0
0.2
0.4
0.6
0.8
1.0
1.2
Time interval
Cre
ep f
acto
r [-
]
15-1
6 h
23-
24 h
1A BFS mean: 0.64
Figure 6–32 Creep factor for intervals of 1 h, left: concrete 1A SAP, right: concrete 1A BFS
In addition, the mean of the 1 h-creep factor values within the period of restraint stress was calculated. The mean was higher with concrete 1A SAP (0.79 compared to 0.64 for concrete 1A BFS), although the 24 h-creep factor was higher with concrete 1A BFS (0.78 compared to 0.64 for concrete 1A SAP, Figure 6–13). This again reveals the limited significance of the 24 h-creep factor.
The 1 h-creep factor is more specific in that regard. It allows computing the actual stress de-velopment from the theoretical-elastic stress, at least in the case of concretes 1A SAP and 1A BFS. However, the conventional description of creep by means of compliance functions serves a different and more general purpose. Such functions are to describe creep for arbitrary stress histories, given they are caused by service loads, i.e. stress levels below the proportion-ality limit acting from a later age (cf. 5.5). Since the 1 h-creep factor in this investigation was the result of non-constant deformations and stresses, it would not be suitable for a general formulation of creep even if the proportionality limit was not exceeded. Furthermore, compli-ance functions generally consider the age at loading, the magnitude of the load and basic me-chanical properties, but not the specific concrete composition (cf. 5.5). Here, deformations and stresses essentially depended on the concrete composition.
To possibly find common patterns among the concretes investigated and to obtain a more gen-eral characterization of creep, one can relate the calculated creep factor to the calculated stress

124
level. The ratio of the 1 h-creep factor to the respective stress level, i.e. to the autogenous shrinkage cracking propensity (ASCP), is shown in Figure 6–33. (The calculation was based on mean stress levels; for instance, the stress level for the time interval from 12 h to 13 h was the mean of the cracking propensity at 12 h and 13 h.) In addition, the period of highest cracking propensity is indicated. With concretes 1A and 1A SRA, the inconsistent data within the pe-riod of very small changes of theoretical-elastic stress are marked light grey.
0.0
1.0
2.0
3.0
4.0
5.0
6.0
Time interval
Rat
io o
f cr
eep
fact
or to
AS
CP
[-]
8-9
h
23-2
4 h
1A
max
. AS
CP
15-1
6 h
0.0
1.0
2.0
3.0
4.0
5.0
6.0
Time interval
Rat
io o
f cr
eep
fact
or to
AS
CP
[-]
9-10
h
23-2
4 h
1A SAP
max
. AS
CP
0.0
1.0
2.0
3.0
4.0
5.0
6.0
Time interval
Rat
io o
f cr
eep
fact
or to
AS
CP
[-]
12-1
3 h
23-2
4 h
1A SRA
max
. AS
CP
17-1
8 h 0.0
1.0
2.0
3.0
4.0
5.0
6.0
Time interval
Rat
io o
f cr
eep
fact
or to
AS
CP
[-]
15-1
6 h
23-2
4 h
1A BFS
max
. AS
CP
Figure 6–33 Ratio of 1 h-creep factor to autogenous shrinkage cracking propensity (ASCP), concrete 1A (top left), concrete 1A SAP (top right), concrete 1A SRA (bottom left) and concrete 1A BFS (bottom right)
Two different patters can be observed. With concrete 1A and 1A SRA, the ratio of creep fac-tor to cracking propensity initially was higher and strongly decreased during the first hours af-ter solidification. The ratio was lowest in the period of maximum cracking propensity. Subse-quently the ratio strongly increased again. This increase may be attributed to the high stress

125
levels in the preceding period. A similar behavior of concretes 1A and 1A SRA had already been observed for the restraint stress as a function of the autogenous shrinkage (Figure 6–29).
With concretes 1A SAP and 1A BFS, the pattern was different. The ratio gradually increased and then remained in the range of the maximum values. Compared to concretes 1A and 1A SRA, the absolute values were significantly lower, especially with concrete 1A BFS. In the case of concrete 1A SAP this probably was due to the attenuation of the autogenous shrinkage (in comparison to concrete 1A). With concrete 1A BFS the reason may be seen in the fact that hydration proceeded at much lower rates and mechanical properties developed more slowly.
Although being the result of a relatively simplistic evaluation, the clearly different patterns indicate that the creep and relaxation behavior of ultra-high strength concrete at very early age may be difficult to generalize. Optional constituents like shrinkage reducing admixtures and supplementary cementitious materials not only reduce the autogenous shrinkage, they also considerably alter the very early hydration. On the other hand, the different behavior does not seem to be a mere function of the degree of hydration. The creep pattern of concrete 1A and concrete 1A SAP was completely different, although it can be concluded from the very simi-lar development of the mechanical properties that also the degree of hydration developed similarly.
The description of creep due to service loads by means of conventional creep and relaxation tests allows for generalizing the behavior of different concretes. Although models may not in all cases provide very precise predictions of long-term deformations, it is often not required to individually test the viscoelastic behavior of a specific concrete composition. Knowledge of the mechanical properties usually is sufficient. This does not seem to be the case with ultra-high strength concrete at very early age.
It appears that the conventional way of describing the influence of time-dependent deforma-tions is less appropriate for the problem of very early age cracking due to restrained autoge-nous shrinkage. Especially in view of the enormous experimental difficulties with very high tensile stress levels at very early age, an approach that does not aim at a complete and general description of creep and relaxation but focuses on the residual stress capacity appears more promising. It possibly can provide the data that is needed to use ultra-high strength concrete safely, i.e. without risking cracks that impair the durability, tightness or aesthetics of struc-tures.
The main questions within such a residual stress capacity approach would be: how much addi-tional stress can a concrete sustain, and how rapidly can this stress be applied without causing cracks. This study already executed some of the steps required to systematically investigate the relevant phenomena in accordance with this approach. The modified ring tests that made use of harsh drying actually were to test the residual stress capacity (6.4.6.4). To gain infor-mation on the tensile strength, it was attempted to provoke failure. By varying not only the age at additional loading but also the relative humidity, the effects of very high stress levels can be investigated more systematically.
The restrained ring test is sufficiently simple and inexpensive to allow for a sufficient number of tests, and possibly multiple tests of a number of similar concrete compositions reveal gen-erally valid relations. The different time-dependent relaxation of stresses can be described by

126
the creep factor and the ratio of creep factor to cracking propensity. In case the additional load is triggered by drying, the free drying shrinkage needs to be measured to compute the theo-retical-elastic stress. As an alternative the specific heating of the rings can be used; the re-quired equations and a schematic illustration of the test procedure were given herein (6.3.2.3, 6.3.3).
The residual stress capacity approach offers the chance for a straightforward phenomenologi-cal investigation of the influence of creep and relaxation on cracking at early and very early age. It can be complemented by micro-analytical tests of the development of the pore struc-ture and of other properties characterizing hydration. In addition, fracture mechanics may be a useful tool to understand and describe the development of micro-cracks and failure at that early stage of hydration.
6.5 Summary
The methodological analysis of alternative test methods proved the restrained ring test to be more suitable than large temperature-stress testing machines for investigating the autogenous shrinkage cracking propensity of fine-grained ultra-high strength concrete. The restrained ring test was used to determine tensile stresses due to restrained autogenous shrinkage. Steel ring strains in restrained ring tests started to increase at 8 h (concrete 1A), 9 h (1A SAP), 12 h (1A SRA) and 15 h (1A BFS). Restraint stresses were highest with the reference concrete 1A, reaching up to 1.87 MPa. The concrete compositions with reduced autogenous shrinkage led to lower stresses.
The standard deviation of the restrained ring test in a specific repeatability test series was roughly 1 µm/m. If assessed on the basis of the coefficient of variation, repeatability during the first 24 h was rather mediocre. However, the initially very high coefficient of variation mostly was a consequence of the period under investigation. The steel ring strains were cap-tured from the very beginning and developed slowly at the beginning. Generally, even with a very low standard deviation the coefficient of variation is high as long as strains are very low.
In any case a minimum of three to four tests is recommended. Three strain gauges per ring appear to be sufficient. They should be glued to the ring with utmost care. A Wheatstone bridge is not mandatory. Furthermore, the temperature of the steel ring should be continu-ously measured, and, if the cross section is large, also the temperature of the concrete. This not only allows for eliminating disturbing temperature artifacts in the recorded resistance data, it also can show to which degree isothermal conditions were provided for. The higher the de-gree of restraint is, the lower are the strains and the more care is required to achieve precise results. The steel ring strains should be close to nil prior to solidification. The onset of steel ring compression can be specified approximately to half an hour, at best to a quarter of an hour.
An analytical solution for the thermal stress component in non-isothermal restrained ring tests was added to the existing evaluation methods. Specific temperature changes and additional drying were suggested as means for investigating the influence of relaxation and creep with restrained ring tests. Furthermore, the possible effect of stress redistribution, generally ne-glected in the past, was quantified and considered in the stress calculations.

127
The early splitting tensile strength development was investigated. It was found that an age-dependent correction of the splitting tensile strength is required to determine the resistance to cracking at early and very early age. The applicability of the correction factor, calculated on the basis of a recently suggested formula for the conversion of splitting to uniaxial tensile strength, was confirmed by restrained ring tests with harsh drying to the ambient air, leading to cracking and thereby indicating the maximum stress capacity at different ages.
The maximum autogenous shrinkage cracking propensity was observed for concrete 1A. It amounted to approximately 0.68. Values were lower for concrete 1A BFS (0.49) and much lower for concretes 1A SRA (0.24) and 1A SAP (0.24). No cracks were observed on any of the rings. For all concretes the maximum cracking propensity was roughly equivalent to the free autogenous shrinkage expressed in mm/m.
In relation to the autogenous shrinkage the restraint stress development was most pronounced with concrete 1A SAP containing superabsorbent polymers. This was explained by the fact that the mechanical properties developed as fast as in the reference concrete whereas the autogenous shrinkage was delayed.
Evidenced for concretes 1A and 1A SRA, the maximum autogenous shrinkage cracking pro-pensity occurred in the transition period from rapid to slow autogenous shrinkage and prior to the maximum rate of heat release, i.e. at very early age. Furthermore, the cracking propensity of concrete 1A after having peaked decreased much faster than that of concrete 1A BFS. This may signify that concrete 1A is less vulnerable to additional tensile stresses due to decreasing ambient temperatures.
The creep factor, when evaluated from theoretical-elastic and actual stress on an hourly basis, was determinable only for periods with substantial changes of stress. This underlines the rele-vance of the suggested residual stress capacity approach which makes use of additional ther-mal or drying shrinkage stresses to investigate and quantify the influence of creep and relaxa-tion. Creep factors for a longer period of e.g. 24 h do neither give a sufficiently precise picture of very-early age viscoelasticity nor do they allow for the separation of thermal and shrinkage stresses according to the analytical solution that was suggested for non-isothermal restrained ring tests.

128
7 Summary, conclusions and outlook
7.1 Summary and conclusions
Restrained autogenous shrinkage can lead to considerable tensile stresses in concrete with low water/cement-ratio, especially in ultra-high strength concrete that was focused upon herein. To avoid cracking, it is essential to comprehensively investigate free and restrained autoge-nous shrinkage. However, the nature of these phenomena, in particular their very early onset, brings about some formidable challenges in terms of methodology.
Hydration is a complex process, in Portland cement paste and even more so in concretes with numerous constituents influencing hydration. It is very difficult and laborious to completely capture the very early development of hydration and of micro-structural properties. Therefore micro-analytical approaches, aiming at the complete understanding and modeling of underly-ing mechanisms, will require much time and large resources.
This study was to contribute to a more pragmatic and immediate solution. The strategy behind the chosen phenomenological approach was, on the one hand, to assess the autogenous shrinkage cracking propensity for the comparably simple case of constant temperature, and, on the other hand, to select, improve and develop methods suitable for investigating those pa-rameters whose influence is most difficult to capture up to now, namely temperature and vis-coelasticity. The basic objective of this strategy is to provide the methods for measuring all relevant quantities as precisely and efficiently as possible under all relevant conditions. The long-term goal is the empirical modeling of the autogenous shrinkage cracking propensity from as few and as simple input parameters as feasible and reasonable.
As indicated, the present knowledge about the influence of temperature on autogenous shrink-age and related cracking is insufficient. The corrugated tube method for measuring the auto-genous shrinkage, recently standardized in the U.S., is precise and reliable, as was confirmed by the own tests. However, it is limited to isothermal conditions. Besides, with sticky or stiff mortars the casting is hampered by the small inlet diameter of the tubes. Therefore the ‘shrinkage cone method for measuring the autogenous shrinkage’ was developed. The inves-tigation of repeatability and reproducibility proved that the method is precise, reliable and easy to use. The very good agreement with results obtained with the corrugated tube method evidenced the accuracy. Since the method is also suitable for tests under non-isothermal con-ditions, it will facilitate the required clarification of the role of temperature.
Tensile stresses due to autogenous shrinkage were investigated by the restrained ring test. The method proved to be very efficient and sufficiently precise. Most tests were carried out at a constant temperature of 20 °C and evaluated by means of an existing stress solution. In addi-tion, an analytical solution for the thermal stress component due to different thermal expan-sion of steel and concrete ring at changing temperatures was derived. This will facilitate the future evaluation of restrained ring tests under non-isothermal conditions. Furthermore, the potential stress redistribution in restrained ring tests at early and very early age was pointed out.
The development of the stress-strength ratio was used to determine the autogenous shrinkage cracking propensity of four different ultra-high strength concretes under quasi-isothermal conditions. The applicability of the stress-strength criterion was analyzed and confirmed. Re-

129
sults of splitting tension tests at very early age needed to be multiplied by a factor of 2 to 3 to correspond to the maximum stress at failure observed when rings dried out at very low rela-tive humidity from respective ages. These values as well as the factor’s age-dependent dis-proportional decrease were in good agreement with a recently proposed function for the de-velopment of the ratio of uniaxial to splitting tensile strength.
The influence of tensile creep and relaxation on restraint stresses is known to disproportion-ally increase with increasing stress level and decreasing age at loading. However, there is hardly any quantitative knowledge as to this influence at very early age. An ample experimen-tal investigation of tensile creep at very early age with very high stress levels and of its influ-ence on the cracking propensity would be extremely demanding and has not been attempted, yet. Common stress rigs like the particularly large temperature-stress testing machines are hardly suitable for comprehensive parameter studies; actually, most investigations were found to have included too few tests to allow for any statistically backed conclusion. This appears particularly critical in view of the two round-robin tests with temperature-stress testing ma-chines on free and restrained autogenous shrinkage which failed to prove a sufficient repro-ducibility of results.
Therefore it was analyzed whether the restrained ring test could be an alternative also for this task. In its elementary form it is a passive test method, i.e. the strains cannot be controlled and the stress history is always conditional on the autogenous shrinkage and the development of the mechanical properties. The influence of time-dependent deformations can be investigated by comparing theoretical-elastic and actual stress, however, not always in a satisfactory man-ner. A more versatile investigation is feasible with an additional stress component which can be created at arbitrary points in time and with different rates of stress increase by either drying of the concrete to the ambient air or by a specific variation of temperature. If the additional free concrete strains are known, the creep factor and the ratio of creep factor to stress level may be suitable to describe the influence of time-dependent deformations.
The main conclusions regarding the methodology can be summarized as follows:
The shrinkage cone method is suitable for testing the autogenous shrinkage of harden-ing cement paste and fine-grained concrete. This includes sticky and stiff materials. Tests under non-isothermal conditions are possible as well.
The restrained ring test is suitable for determining the autogenous shrinkage cracking propensity of concrete. It is more appropriate for determining the cracking propensity of fine-grained ultra-high strength concrete than temperature-stress testing machines.
The stress-strength failure criterion is applicable at very early age. Splitting tension tests can be used to determine the strength, however, results require a strong age-dependent correction.
An additional stress component in restrained ring tests may be used to investigate the residual stress capacity and the influence of stress relaxation on cracking. The addi-tional stress can be produced by temperature changes or by drying.

130
7.2 Outlook
Splitting tension tests can be used to determine a tensile strength at very early age. However, the appropriate execution of the test and the conversion to uniaxial tensile strength values in that period are still associated with significant uncertainties. The influence of the rate of stress increase on strength needs to be clarified. The coherent results achieved in this study by com-paring the splitting tensile strength to the ultimate stress in specific restrained ring tests should be confirmed by further such tests.
Furthermore, it is required to develop suitable empirical models for the tensile strength devel-opment at very early age. It was shown that the assumption of a linear relation between tensile strength and degree of hydration is rather unsuitable at very early age. The suitability of sig-moid functions for modeling the splitting tensile strength and the modulus of elasticity should be examined.
The modulus of elasticity is required to evaluate the viscoelastic behavior. The modulus in tension would be the most appropriate quantity in this regard. It needs to be clarified whether the dynamic modulus of elasticity tested with the resonance frequency method provides proper results at very early age, as was assumed herein. From a practical point of view, auto-matic methods would be preferable.
The restrained ring test has not often been used to investigate the autogenous shrinkage crack-ing propensity, yet. Generally, the methodological as well as the absolute results of this study call for verification by other researchers. In particular, a round robin test ought to be carried out to further investigate the precision of the test method. In addition, similar investigations with concrete containing large aggregates and fibers should be undertaken in the future.
In the cases that were investigated the period of maximum autogenous shrinkage cracking propensity coincided with the transition of fast to slow autogenous shrinkage. If this turned out to be a general rule for certain types of ultra-high strength concrete, it could significantly facilitate future investigations and reduce the experimental effort. Furthermore, the maximum autogenous shrinkage cracking propensity of the concretes investigated was roughly equiva-lent to the free autogenous shrinkage expressed in mm/m. If this was confirmed for other con-crete compositions, it would be a very helpful rule of thumb and possibly the basis for future modeling attempts.
The autogenous shrinkage cracking propensity was tested at a virtually constant temperature of 20 °C. Tests at different temperature levels and also under non-isothermal conditions must follow to eventually assess the cracking propensity under realistic on-site conditions. The de-veloped shrinkage cone method and the derived stress solution for the effect of temperature changes in restrained ring tests facilitate such tests. However, much more work is to be done in that regard. Especially, an efficient and precise method for determining the development of the coefficient of thermal expansion is required.
Finally, a new approach for the experimental investigation and mathematical description of the influence of creep and relaxation on cracking was suggested. Its application is relatively straightforward but not trivial. It needs to be confirmed that the proposed residual stress ca-pacity approach is appropriate and efficient.

131
8 Literature
[AASHTO 1] American Association of State Highway and Transportation Officials: Stan-dard Practice for Estimating the Cracking Tendency of Concrete. AASHTO Provisional Standards, PP-34-99, April 2000
[Ahn 10] Ahn, T.-H., Kishi, T.: Crack self-healing behavior of cementitious composites incorporating various mineral admixtures. In: Journal of Advanced Concrete Technology, Vol. 8, No. 2, 2010, pp. 171-186
[Aït 02] Aïtcin, P.-C.: Curing high performance concrete structures to minimize early cracking. In: 6th International Symposium on Utilization of High Strength / High Performance Concrete, Germany, 2002, pp. 1-16
[Aït 99] Autogenous shrinkage measurement. In: Autogenous shrinkage of concrete. Proceedings of the International Workshop organized by JCI (Japan Concrete Institute), Hiroshima, 1998. E&FN Spon, London 1999, pp. 257-268
[Alo 02] Alonso, M.T.: Hochfester Beton. In: beton 52 (2002), Nr. 11, pp. 563-567. In English language in: VDZ (ed.): Concrete Technology Reports 2001-2003, Düsseldorf, Germany.
[Alt 02] Altoubat, S.A., Lange, D.A.: The Pickett effect at early age and experiment separating its mechanisms in tension. In: Materials and Structures, 35 (2002), No. 5, pp. 211-218
[Aly 09] Aly, T., Sanjayan, J.G.: Mechanism of early age shrinkage of concretes. In: Materials and Structures 42 (2009), pp. 461-468
[ASTM 1] ASTM International: ASTM Standard C 1581-04 – Standard Test Method for Determining Age at Cracking and Induced Tensile Stress Characteristics of Mortar and Concrete Under Restrained Shrinkage
[ASTM 2] ASTM C 1698 - 09, 'Standard Test Method for Autogenous Strain of Cement Paste and Mortar', American Society for Testing and Materials, ASTM Inter-national, November 2009
[Atr 01] Atrushi, D., Bjøntegaard, Ø., Bosnjak, D., Kanstad, T., Sellevold, E.J.: Creep deformations due to self-stresses in hardening concrete, effect of temperature. In: Ulm, F.J., Bažant, Z.P., Wittmann, F.H. (eds.): Creep, Shrinkage and Du-rability Mechanics of Concrete and other Quasi-Brittle Materials. Elsevier, 2001, pp. 613-618
[Atr 03] Atrushi, D.S.: Tensile and compressive creep of early age concrete: testing and modelling. Doctoral thesis, University Trondheim, Norway, 2003

132
[Att 04] Attiogbe, E.K., Weiss, J., See, H.T.: A look at the stress rate versus time of cracking relationship observed in the restrained ring test. In: International RILEM Symposium on Concrete Science and Engineering: A Tribute to Ar-non Bentur, 2004 (Digital version)
[Bac 80] Bache, Hans H.: Cement-bond materials with extremely high strength and du-rability. In: Beton-Teknik 8/03/1980, Aalborg, Denmark, 1980
[Bac 81] Bache, Hans H.: Densified cement/ultra-fine particle-based material. In: De-velopments in the use of superplasticizers, Ottawa, Canada 1981, ACI Publi-cation SP 68
[Bac 87] Bache, Hans H.: Introduction to compact reinforced composite. In: Nordic Concrete Research, No. 6, 1987, pp. 19-33
[Bar 04] Baroghel-Bouny, V., Mounanga, P. Loukili, A., Khelidj, A.: From chemical and microstructural evolution of cement pastes to the development of autoge-nous deformations. In: Jensen, O.M. et al. (eds.), Autogenous Deformation of Concrete. Papers presented at the American Concrete Institute’s fall conven-tion in Phoenix, Arizona, 2002, ACI SP 220, pp. 1-22
[Bar 05] Barcelo, L., Moranville, M., Clavaud, B.: Autogenous shrinkage of concrete: A balance between autogenous swelling and self-desiccation. In: Cement and Concrete Research 35 (2005) 1, pp. 177-183
[Bar 06] Baroghel-Bouny, V., Mounanga, P., Loukili, A., Khelidj, A., Noureddine, R.: Autogenous deformations of cement pastes : Part I: Temperature effects at early age and micro-macro correlations, Part II: W/C effects, micro-macro correlations, and threshold values. In: Cement and Concrete Research 36 (2006) 1, pp. 123-136
[Bar 99] Barcelo, L., Boivin, S., Rigaud, S., Acker, P., Clavaud, B., Boulay, C.: Linear vs. volumetric autogenous shrinkage measurement: Material behaviour or ex-perimental artifact? In: Proceedings of the 2nd International Research Seminar on Self-Desiccation and its Importance in Concrete Technology, Sweden 1999, pp. 109-126
[Baz 01] Bazant , Z.P.: Creep of concrete. In: Buschow et al. (eds.), Encyclopedia of Materials: Science and Technology. Vol. 2C, pp. 1797- 1800, Elsevier, Am-sterdam, Netherlands, 2001
[Baz 08] Bazant, Z.P., Yu, Q., Li, G.-H., Klein, G.J., Kristek, V.: Excessive deflections of record-span prestressed box girder: Lessons learned from the collapse of the Koror-Babeldaob Bridge in Palau. In: Concrete International 32 (2010) 6, pp. 39-43

133
[Baz 79] Bazant, Z.P.; Kim, S.S.: Nonlinear Creep of Concrete - Adaptation and Flow. Journal of the Engineering Mechanics Division, ASCE, Vol.105, June 1979, pp. 429-445
[Baz 89a] Bazant, Z.P.; Prasannan, S.: Solidification theory for concrete creep. I: For-mulation. Journal of Engineering Mechanics, Vol. 115, ASCE, August 1989, pp. 1691-1703
[Baz 89b] Bazant, Z.P.; Prasannan, S.: Solidification theory for concrete creep. II: Veri-fication and Application. Journal of Engineering Mechanics, Vol. 115, ASCE, August 1989, pp. 1704-1725
[Baz 91] Bazant, Z.P.; Kim, J.-K.: Improved prediction model for time-dependent de-formations of concrete: Part 2 - Basic creep. Materials and Structures, 24, 1991, pp. 409-421
[Ben 01a] Bentur, A., Igarashi, S., Kovler, K.: Prevention of autogenous shrinkage in high-strength concrete by internal curing using wet lightweight aggregates. In: Cement and Concrete Research 31 (2001) 11, pp. 1587-1591
[Ben 01b] Bentz, D.P., Jensen, O.M., Hansen, K.K., Olesen, J.F., Stang, H., Haecker, C.-J.: Influence of cement particle-size distribution on early age autogenous strains and stresses in cement-based materials. In: Journal of the American Ceramic Society 84 (2001), pp. 129-135
[Ben 03a] Bentur, A. (ed.): Early age cracking in cementitious systems; report of RILEM Technical Committee 181-EAS ‘Early age shrinkage induced stresses and cracking in cementitious systems. Bagneux, France, 2003
[Ben 03b] Bentur, A., Kovler, K.: Evaluation of early age cracking characteristics in cementitious systems. In: Materials and Structures 36 (2003) 257, pp. 183-190
[Ben 04] Bentz, D.P., Jensen, O.M. : Mitigation strategies for autogenous shrinkage cracking. In: Cement & Concrete Composites 26 (2004), pp. 677-685
[Ben 08a] Bentz, D.P.: A review of early-age properties of cement-based materials. In: Cement and Concrete Research 38 (2008) 2, pp. 196-204
[Ben 08b] Bentz, D.P., Sant, G., Weiss, J.: Early-Age Properties of Cement-Based Mate-rials : I: Influence of Cement Fineness. In: Journal of Materials in Civil Engi-neering (2008) 7, pp. 502-508
[Ben 08c] Bentz, D.P., Weiss, J.: Frühe Rissbildung im Beton: Einflüsse, Mechanismen und Gegenmaßnahmen. In: BWI Betonwerk International (2008) 3, pp. 62-68
134
[Bis 07] Bissonnette, B., Pigeon, M., Vaysburd, A.M.: Tensile creep of concrete: Study of its sensitivity to basic parameters. In: ACI Materials Journal 104 (2007) 4, pp. 360-368
[Bjø 00] Bjøntegaard, Ø., Sellevold, E. J.: Interaction between thermal dilation and autogenous deformation in high performance concrete. In: Shrinkage of Con-crete, International RILEM Workshop (France, 2000): Proceedings, pp. 43-55
[Bjø 03] Bjøntegaard, O., Sellevold, E.J.: Very high strength concrete. In: Early Age Cracking in Cementitious Systems. RILEM Report 25 of RILEM Technical Committee TC 181-EAS, 2003, pp. 285-294
[Bjø 04] Bjøntegaard, Ø., Hammer, T.A., Sellevold, E.J.: On the measurement of free deformation of early age cement paste and concrete. In: Cement & and Con-crete Composites 26 (2004), pp. 427-435. (Discussion in Cement & Concrete Composites 27 (2005) pp. 857-858, [Lur 05])
[Bjø 06] Bjøntegaard, Ø., Hammer, T.A.: RILEM Technical Committee 195 DTD: Motive and technical content. In: O.M. Jensen et al. (eds.), Volume Changes of Hardening Concrete: Testing and Mitigation; Proceedings of the Interna-tional RILEM Conference, Lyngby, Denmark, 2006, pp. 357-366
[Bou 06] Bouasker, M., Grondin, F., Mounanga, P., Pertué, A., Khelidj, A.: Improved measurement methods for autogenous shrinkage of cement mortars at very early age. In: 2nd international symposium on advances in concrete through science and engineering, 2006, Quebec City, Canada
[Bou 08a] Bouasker, M., Mounanga, P., Khelidj, A., Coué, R.: Free autogenous strain of early-age cement paste: metrological development and critical analysis. In: Advances in Cement Research, 2008, 20, No. 2, April, pp. 75-84
[Bou 08b] Bouasker, M., Mounanga, P., Turcry, P., Loukili, A., Khelidj, A.: Chemical shrinkage of cement pastes and mortars at very early age: Effect of limestone filler and granular inclusions. In: Cement & Concrete Composites 30 (2008) 1, pp.13-22
[Bra 06] Braam, C., van der Ham, H., Koenders, E.: Early age shrinkage control and strength development of concrete. In: O.M. Jensen et al. (eds.), Volume Changes of Hardening Concrete: Testing and Mitigation; Proceedings of the International RILEM Conference, Lyngby, Denmark, 2006, pp. 185-194
[Bra 88] Brameshuber, W.: Bruchmechanische Eigenschaften von jungem Beton. Schriftenreihe des Institutes für Massivbau und Baustofftechnologie, Univer-sität Karlsruhe, Heft 5, 1988 (in German)
[Bre 00] van Breugel, K., Lura, P.: Predicting cracks in hardening concrete using a stress-based cracking criterion. In: Proceedings of the international workshop
135
on control of cracking in early age concrete, Sendai, Japan, 2000, pp. 317-324
[Bre 89] Breitenbücher, R.: Zwangsspannungen und Rissbildung infolge Hydratati-onswärme. Dissertation, Technical University of Munich, 1989.
[Bud 07] Budelmann, H., Ewert, J.: Werkstoffverhalten von ultra-hochfestem Beton im frühen Alter. DFG-Schwerpunktprogramm 1182, Zwischenbericht zur ersten Förderperiode, Braunschweig, 2007 (in German)
[Bud 10] Budelmann, H., Ewert, J.: Werkstoffverhalten von ultra-hochfestem Beton im frühen Alter. DFG-Schwerpunktprogramm 1182, Abschlussbericht, Braun-schweig, 2010 (in German)
[Bui 80] Buil, M.; Baron, J.: Le retrait autogène de la pâte de ciment durcissante. In: 7th International Congress on the Chemistry of Cement, France 1980, pp.VI/37-VI/42
[Bui 87] Buil, M.; Delage, P.: Some further evidence on a specific effect of silica fume on the pore structure of portland cement mortars. In: Cement and Concrete Research 17 (1987) 1, pp. 65-69
[Bur 08a] Burkart, I., Müller, H.S.: Creep and shrinkage characteristics of ultra high strength concrete (UHPC). In: Proceedings of the 2nd International Sympo-sium on UHPC, Kassel, Germany, 2008, pp. 469-476
[Bur 08b] Burkart, I., Müller, H.S.: Creep and shrinkage characteristics of ultra high strength concrete. In: Proceedings of Concreep 8, Ise-Shima, Japan, 2008, pp. 689-694
[Car 88] Carlson, R.W., Reading, T.J.: Model study of shrinkage cracking in concrete building walls. In: ACI Structural Journal 85 (1988), pp. 395-404
[Car 94] Carino, N.J., Guthrie, W.F., Lagergren, E.S., Mullings, G.M.: Effects of test-ing variables on the strength of high-strength (90 MPa) concrete cylinders. In: Malhotra, V.M. (ed.), High-Performance Concrete: Proceedings of the Inter-national ACI Conference, Singapore, 1994 (ACI Publication SP 149), pp.589-632
[Cho 10] Choi, S., Cha, S.W., Park, H.: Instantaneous and short-term deformation of early-age concrete under quasi-instantaneous loading. In: Magazine of Con-crete Research 62 (2010) 3, pp. 221-227
[Cra 06] Craeye, B., De Schutter, G.: Experimental evaluation of mitigation of autoge-nous shrinkage by means of a vertical dilatometer for concrete. In: O.M. Jen-sen et al. (eds.), Volume Changes of Hardening Concrete: Testing and Mitiga-tion; Proceedings of the International RILEM Conference, Lyngby, Denmark, 2006, Bagneux, France, 2006, RILEM Publications, pp. 21-30
136
[Cus 05] Cusson, D., Hoogeveen, T., Lyndon, M.: Restrained shrinkage testing of high-performance concrete modified with structural lightweight aggregate. In: 7th International Symposium on Utilization of High-Strength/High-Performance Concrete, Washington D.C., USA, 2006, Vol. 2, pp. 1353-1372
[Cus 06] Cusson, D., Hoogeeven, T.: Measuring earl-age coefficient of thermal expan-sion in high-performance concrete. In: O.M. Jensen et al. (eds.), Volume Changes of Hardening Concrete: Testing and Mitigation; Proceedings of the International RILEM Conference, Lyngby, Denmark, 2006, pp. 321-330
[Cus 07] Cusson, D., Hoogeveen, T.: An experimental approach for the analysis of early-age behaviour of high-performance concrete structures under restrained shrinkage. In: Cement and Concrete Research 37 (2007), pp. 200-209
[Cza 05] Czarnecki, B., Kroman, J.: Evaluation of cracking tendency and unrestrained shrinkage of high-performance concrete mixes in cast-in-place and precast bridge applications. In: 7th International Symposium on the Utilization of High-Strength/High-Performance Concrete. ACI Symposium Publication 228, 2005, pp. 1315-1328
[Cze 05] Czerny, F., Breugel, K. van, Koenders, E.: The reliability of crack predictions for hardening concrete structures. In: Dhir, R. Harrison, T., Newlands, M. (Eds.): Cement combinations for durable concrete. Proceedings of the interna-tional conference "Global construction – Ultimate concrete opportunities", 2005, Thomas Telford, London, pp. 757-766
[Cze 77] Czernin, W.: Zementchemie für Bauingenieure. 3. Auflage, Bauverlag, Wies-baden und Berlin 1977
[Dav 40] Davis, R.E.: Autogenous volume change of concrete. In: Proceedings of the 43rd Annual ASTM Meeting, Atlantic City, USA, 1940, pp. 1103-1113
[Der 74] Derjaguin, B.V., Churaev, N.V.: Structural component of disjoining pressure. In: Journal of Colloid and Interface Science 49 (1974) 2, pp. 249-255
[DeS 00] De Schutter, G., Taerwe, L.: Fictitious degree of hydration method for the ba-sic creep of early age concrete. In: Materials and Structures 33 (2000) 230, pp. 370-380
[Dud 10] Dudziak, L., Mechtcherine, V.: Reducing the cracking potential of Ultra-High Performance Concrete by using Super Absorbent Polymers (SAP). In: Ad-vances in Cement-based Materials, van Zijl, G., Boshoff, W.P. (eds.), Taylor & Francis Group, London, 2010, pp. 11-19
[Edv 99] Edvardsen, Carola: Water permeability and autogenous healing of cracks in concrete cracking in RC wall. In: ACI Materials Journal 96 (1999) 4, pp. 448-454
137
[Epp 08a] Eppers, S., Mueller, C.: Autogenous shrinkage strain of ultra-high perform-ance concrete (UHPC). In: Proceedings of the 2nd International Symposium on UHPC, Kassel, Germany, 2008, pp. 433-441
[Epp 08b] Eppers, S., Mueller C.: Autogenous shrinkage and time-zero of UHPC deter-mined with the shrinkage cone. In: Proceedings of Concreep 8, Ise-Shima, Ja-pan, 2008, pp. 709-714
[Epp 08c] Eppers, S., Mueller, C.: Restrained ring tests with UHPC. In: Proceedings of the 8th International Symposium on Utilization of High-Strength and High-Performance Concrete, Tokyo, Japan, 2008, pp. 744-751
[Epp 09] Eppers, S., Müller, C.: On the examination of the autogenous shrinkage cracking propensity by means of the restrained ring test with particular con-sideration of temperature influences. In: beton 5/2009 pp. 227-230 (part 1) and beton 6/2009 pp. 283-289 (part 2)
[Epp 10a] Eppers, S., Mueller, C.: The shrinkage cone method for measuring the auto-genous shrinkage - an alternative to the corrugated tube method. In: Use of superabsorbent polymers and other new additives in concrete. International RILEM Conference, Proceedings, Lyngby, Denmark, August 2010, pp. 67-76
[Epp 10b] Eppers, S., Mechtcherine, V., Mueller, C.: Assessing the autogenous shrink-age cracking propensity of concrete - methodological aspects. In: Use of su-perabsorbent polymers and other new additives in concrete. International RILEM Conference, Proceedings, Lyngby, Denmark, August 2010, pp. 45-56
[Epp 10c] Eppers, S., Mueller, C.: Stresses due to temperature changes in restrained ring tests. In: Use of superabsorbent polymers and other new additives in concrete. International RILEM Conference, Proceedings, Lyngby, Denmark, August 2010, pp. 57-66
[Fed 06] Federal Highway Administration, US Department of Transportation (eds.): Material Property Characterization of Ultra-High Performance Concrete, Pub-lication No. FHWA-HRT-06-103, August 2006
[Fer 87] Ferraris, C.F., Wittmann, F.H.: Shrinkage mechanisms of hardened cement paste. In: Cement and Concrete Research 17 (1987) 3, pp. 453-464
[fib 08] fib Bulletin 42: Constitutive modeling of high strength / high performance concrete. State-of-the-art report, 2008
[fib 10] fib Bulletin 55: Model Code 2010 (first complete draft)
[Fon 06] Fontana, P.: Einfluss der Mischungszusammensetzung auf die frühen autoge-nen Verformungen der Bindemittelmatrix von Hochleistungsbetonen. Disser-tation, Braunschweig 2006 (in German)

138
[For 05] Formagini, S., Toledo Filho, R.D., Fairbairn, E.M.R.: Mix design, autogenous shrinkage and mechanical characterization of UHPFRCC. In: International RILEM workshop on high performance fiber reinforced cementitious com-posites (HPFRCC) in structural applications, Honolulu, Hawaii, USA, 2005, pp. 333-341
[Gag 99] Gagné, R., Aouad, I., Shen, J., Poulin, C.: Development of a new experimen-tal technique for the study of the autogenous shrinkage of cement paste. In: Materials and Structures, Vol. 32, Nov. 1999, pp. 635-642
[Gar 09] Garas, V.Y., Kahn, L.F., Kurtis, K.E.: Short-term tensile creep and shrinkage of ultra-high performance concrete. In: Cement & Concrete Composites 31 (2009) 3, pp. 147-152
[Gaw 06a] Gawin, D., Pesavento, F., Schrefler, B.A.: Hygro-thermo-chemo-mechanical modeling of concrete at early ages and beyond - Part I: Hydration and hygro-thermal phenomena. In: International Journal for Numerical Methods in En-gineering (2006) 67, pp. 299-331
[Gaw 06b] Gawin, D., Pesavento, F., Schrefler, B.A.: Hygro-thermo-chemo-mechanical modeling of concrete at early ages and beyond - Part II: Shrinkage and creep of concrete. In: International Journal for Numerical Methods in Engineering (2006) 67, pp. 332-363
[Germann] Germann Instruments, http://www.germann.org/?strArticle=test_systems
[Gra 04] Graybeal, B.A.: Fabrication of an optimized UHPC bridge. In: Proceedings of the PCI national bridge conference (CD proceedings), Atlanta, GA, USA; 2004
[Gru 03] Grube, H.: Definition der verschiedenen Schwindarten, Ursachen, Größen der Verformungen und baupraktische Bedeutung. In: beton 12/2003, pp. 598-603
[Gru 91] Grube, H.: Ursachen des Schwindens von Beton und Auswirkungen auf Be-tonbauteile. Habilitation, Düsseldorf, Germany, Beton-Verlag 1991
[Gua 06] Guangcheng, L.; Youjun, X.; Zhengwu, J.: Volume changes of very-high-performance cement-based composites. In: Magazine of Concrete Research 58 (2006) 10, pp. 657-663
[Gut 98] Gutsch, A.-W.: Stoffeigenschaften jungen Betons - Versuche und Modelle. Dissertation, Technical University, Braunschweig, 1998 (in German)
[Hab 06] Habel, K., Charron, J.-P., Denarié, E., Brühwiler, E.: Autogenous deforma-tions and viscoelasticity of UHPFRC in structures: Part 1: experimental re-sults. In: Magazine of Concrete Research 58 (2006) 3, pp. 135-145

139
[Ham 01] Hammer, T.A.: On the strain capacity and cracking mechanisms of high strength concrete at very early age. In: Ulm, F.-J., Bazant, Z.P., Wittmann, F.H. (eds.), Creep, shrinkage and durability mechanics of concrete and other quasi-brittle materials: Proceedings of the International Conference CON-CREEP 6, Cambridge, 2001, pp.657-662
[Ham 03] Hammer, T.A., Bjøntegaard, Ø., Sellevold, E.J.: Measurement methods for testing of early age autogenous strain. In: Early Age Cracking in Cementi-tious Systems. RILEM Report 25 of RILEM Technical Committee TC 181-EAS (Early age shrinkage induced stresses and cracking in cementitious sys-tems), Bagneux, France, 2003, pp. 207-215
[Ham 06] Hammer, T. A., Bjøntegaard, Ø.: Testing of autogenous deformation (AD) and thermal dilation (TD) of early age mortar and concrete – Recommended test procedure. In: O.M. Jensen et al. (eds.), Volume Changes of Hardening Concrete: Testing and Mitigation; Proceedings of the International RILEM Conference, Lyngby, Denmark, 2006, pp. 341-346
[Ham 07] Hammer, T.A., Fosså, K.T., Bjøntegaard, Ø.: Cracking tendency of HSC: Tensile strength and self generated stress in the period of setting and early hardening. In: Materials and Structure 40 (2007), pp. 319-324
[Ham 08] van der Ham, H., Koenders, E., van Breugel, K.: Creep model uncertainties in early-age concrete simulations. In: Proceedings of Concreep 8, Ise-Shima, Ja-pan, 2008, pp. 431-436
[Ham 99] Hammer, T.A., Heese, C.: Early age chemical and autogenous deformation of cement pastes. In: Proceedings of the 2nd International Seminar on Self-Desiccation and its Importance on Concrete Technology, Sweden, 1999, pp. 7-14
[Ham NC] Hammer, T.A., Kanstad, T., Bjøntegaard, Ø., Sellevold, E.J.: Autogenous de-formation of concrete: How to handle in structural design. In: Norwegian Concrete papers. Published online (03.08.2010):
http://www.tekna.no/arkiv/NB/Norwegian%20Concrete/ Autogenous%20deformation%20of%20concrete.pdf
[Hay 08a] Hayano, H., Maruyama, I., Noguchi, T.: Autogenous shrinkage behaviour and cracking potential of high-strength concrete under restraint. In: Proceedings of the 3rd International Conference ACF/VCA, Vietnam, 2008, pp. 948-954
[Hay 08b] Hayano, H.; Maruyama, I.; Noguchi, T.: Evaluation of cracking potential of high-strength concrete due to autogenous shrinkage and verification using micropore volume. In: Proceedings of Concreep 8, Ise-Shima, Japan, 2008, pp. 459-464

140
[Hen 09] Henkensiefken, R., Bentz, D., Nantung, T., Weiss, J.: Volume change and cracking in internally cured mixtures made with saturated lightweight aggre-gate under sealed and unsealed conditions. In: Cement & Concrete Compos-ites 31 (2009), pp. 427-437
[Hin 98] Hintzen, W.: Zum Verhalten des jungen Betons unter zentrischem Zwang beim Abfließen der Hydratationswärme. Dissertation, Schriftenreihe der Ze-mentindustrie Nr. 59, Verlag Bau und Technik, Düsseldorf 1998 (in German)
[Hol 05] Holt, E.: Contribution of mixture design to chemical and autogenous shrink-age of concrete at early ages. In: Cement and Concrete Research 35 (2005), pp. 464-472
[Hos 04] Hossain, A. B. and Weiss, W. J.: Assessing residual stress development and stress relaxation in restrained concrete ring specimens. Cement & Concrete Composites 26 (2004), pp. 531-540
[Hos 06] Hossain, A. B. and Weiss, W. J.: The role of specimen geometry and bound-ary conditions on stress development and cracking in the restrained ring test. Cement and Concrete Research 36 (2006), pp. 189-199
[Hos 08a] Hossain, A.B., Fonseka, A., Bullock, H.: Early age stress development, re-laxation, and cracking in restrained low W/B ultrafine fly ash mortars. In: Journal of Advanced Concrete Technology 6 (2008) 2, pp. 261-271
[Hos 08b] Hossain, A.B., Fonseka, A., Bullock, H.: Restrained shrinkage stress devel-opment and stress relaxation in low W/B mortars containing ultrafine fly ash. In: Proceedings of Concreep 8, Ise-Shima, Japan, 2008, pp. 715-721
[Hua 95] Hua, C.; Acker, P.; Ehrlacher, A.: Analyses and models of the autogenous shrinkage of hardening cement paste: 1.Modelling at macroscopic scale. In: Cement and Concrete Research 25 (1995) 7, pp. 1457-1468
[Ich 05] Ichinomiya, T., Hishiki, Y., Ohno, T., Morita, Y., Takada, K: Experimental study on mechanical properties of ultra-high-strength concrete with low-autogenous-shrinkage. In: 7th International Symposium on the Utilization of High-Strength/High-Performance Concrete. ACI Symposium Publication 228, 2005, pp. 1341-1352
[Iga 00] Igarashi, S., Bentur, A., Kovler, K.: Autogenous shrinkage and induced re-straining stresses in high-strength concretes. In: Cement and Concrete Re-search 30 (2000), pp. 1701-1707
[Iga 02] Igarashi, S., Kawamura, M.: Effects of microstructure on restrained autoge-nous shrinkage behaviour in high strength concretes at early age. In: Materials and Structures, Vol. 35 (2002), pp. 80-84

141
[Iga 05] Igarashi, S., Watanabe, A., Kawamura, M.: Evaluation of capillary pore size characteristics in high-strength concrete at early ages. in: Cement and Con-crete Research 35 (2005), pp. 513-519
[Iga 06] Igarashi, S., Watanabe, A.: Experimental study on prevention of autogenous deformation by internal curing using super-absorbent polymer particles. In: O.M. Jensen et al. (eds.), Volume Changes of Hardening Concrete: Testing and Mitigation; Proceedings of the International RILEM Conference, Lyngby, Denmark, 2006, pp. 77-86
[Ima 04] Imamoto, K.: Influences of heat of hydration on autogenous shrinkage in-duced stresses in reinforced high strength concrete columns at early ages. In: International RILEM Symposium on Concrete Science and Engineering: A Tribute to Arnon Bentur, 2004 (Digital version)
[IPACS] Improved production of advanced concrete structures (IPACS). Full report of the Brite EuRam III Research Project (1997-2001). REPORT BE96-3843/2001:42-7, Luleå University of Technology, Sweden, ISBN 91-89580-42-7. Published online (03.08.2010):
https://www.ltu.se/webarkiv/SHB/ipacs/3b3701dd745a1.pdf
[JCI 96] Japan Concrete Institute: Technical committee report on autogenous shrink-age of concrete, 1996. Partly translated into English in [Taz 99]
[Jen 00] Jennings, H.M.: A model for the microstructure of calcium silicate hydrates in cement paste. In: Cement and Concrete Research 31 (2001) 4, pp. 647-654
[Jen 01a] Jensen, O.M., Hansen, P.F.: Autogenous deformation and RH-change in per-spective. In: Cement and Concrete Research 31 (2001), pp. 1859-1865
[Jen 01b] Jensen, O.M., Hansen, P.F.: Water-entrained cement-based materials: Part 1: Principles and theoretical background. In: Cement and Concrete Research 31 (2001) 4, pp. 647-654
[Jen 02] Jensen, O.M., Hansen, P.F.: Water-entrained cement-based materials: II. Ex-perimental observations. In: Cement and Concrete Research 32 (2002) 6, pp. 973-978
[Jen 08] Jennings, H.M., Bullard, J.W., Thomas, J.T., Andrade, J.E., Chen, J.J., Sherer, G.W.: Characterization and modeling of pores and surfaces in cement paste: correlations to processing and properties. In: Journal of Advanced Concrete Technology, Vol. 6, No. 1, February 2008, pp. 5-29
[Jen 95a] Jensen, O.M., Hansen, P.F.: A dilatometer for measuring autogenous defor-mation in hardening Portland cement paste. In: Materials and Structures 28 (1995), pp. 406-409

142
[Jen 95b] Jensen, O.M.: Thermodynamic limitation of self-desiccation. In: Cement and Concrete Research 25 (1995), No. 1, pp. 157-164
[Jen 95c] Jensen, O.M.; Hansen, P.F.: Autogenous relative humidity change in silica fume-modified cement paste. In: Advances in Cement Research 7 (1995) 25, pp. 33-38
[Jen 96] Jensen, O.M.; Hansen, P.F.: Autogenous deformation and change of the rela-tive humidity in silica fume-modified cement paste. In: ACI Materials Journal (1996), pp. 539-543
[Jen 99] Jensen, O.M., Hansen, P.F.: Influence of temperature on autogenous deforma-tion and relative humidity change in hardening cement paste. In: Cement and Concrete Research 29 (1999), pp. 567-575
[Jia 05] Jiang, Z., Sun, Z., Wang, P.: Autogenous relative humidity change and auto-genous shrinkage of high-performance concrete. In: Cement and Concrete Research 35 (2005), pp. 1539-1545
[Jon 36] Jones, P.G., Richart, F.E.: The effect of testing speed on strength and elastic properties of concrete. In: ASTM proceedings35, part 2, pp. 380-391
[Jon 94] Jonasson, J.-E.: Modelling of temperature, moisture and stresses in young concrete. Dissertation, 1994, Luleå University of Technology, Luleå, Sweden
[Jui 09] Juilland, P., Gallucci, E., Flatt, R.J., Scrivener, K.L.: Mechanisms of hydra-tion of cementitious materials at early age. In: 17. Internationale Baustoffta-gung, Proceedings on CD-ROM, Weimar, Germany, 2009
[Kam 07] Kamen, A., Denarié, E., Brühwiler, E.: Thermal effects on physico-mechanical properties of ultra-high-performance fiber-reinforced concrete. In: ACI Materials Journal 104 (2007) 4, pp. 415-423
[Kam 09] Kamen, A., Denarié, E., Sadouki, H., Brühwiler, E.: Evaluation of UHPFRC activation energy using empirical models. In: Materials and Structures 42 (2009) 4, pp. 527-537
[Kan 08] Kanda, T., Momose, H., Imamoto, K., Mihashi, H.: Stochastic approach to shrinkage cracking control for reinforced concrete structural elements. In: Journal of Advanced Concrete Technology 6 (2008) 1, pp.121-133
[Kas 75] Kasai, Y., Yokohama, K., Matsui, J.: Study on properties of shrinkage of early-age concrete under restraint condition. In: Review of the 29th General Meeting of the Cement Association of Japan (1975), pp. 194-1996

143
[Kau 04] Kaufmann, J., Winnefeld, F., Hesselbarth, D.: Effect of the addition of ul-trafine cement and short fiber reinforcement on shrinkage, rheological and mechanical properties of Portland cement pastes. In: Cement & Concrete Composites 26 (2004), pp. 541-549
[Kim 03] Kim, B., Weiss, J.: Using acoustic emission to quantify damage in restrained fiber-reinforced cement mortars. Cement and Concrete Research, Nr. 2, 2003, pp. 207-214
[Koe 06] Koenders, E., Schlangen, E., Leegwater, G.: A mini-TSTM for measuring paste deformations at early age. In: O.M. Jensen et al. (eds.), Volume Changes of Hardening Concrete: Testing and Mitigation; Proceedings of the International RILEM Conference, Lyngby, Denmark, 2006, pp. 293-302
[Koe 08] Koenders, E.A.B., van der Ham, H.W.M.; van Breugel, K.: Modelling creep by microstructural changes. In: Proceedings of Concreep 8, Ise-Shima, Japan, 2008, pp. 81-87
[Koe 97] Koenders, E.A.; Breugel, K. van: Numerical modelling of autogenous shrink-age of hardening cement paste. In: Cement and Concrete Research 27 (1997) 10, pp. 1489-1499
[Kor 09] Korpa, A.; Kowald, T.; Trettin, R.: Phase development in normal and ultra high performance cementitious systems by quantitative X-ray analysis and thermoanalytical methods. In: Cement and Concrete Research 39 (2009) 2, pp. 69-76
[Kov 01] Kovler, K, Bentur, A. (eds.): Early age cracking in cementitious systems. Proceedings of the International RILEM Conference, Haifa, Israel, 2001
[Kov 93] Kovler, K., Sikuler, J., Bentur, A.: Restrained shrinkage tests of fibre-reinforced concrete ring specimens: effect of core thermal expansion. Materi-als and Structures 26 (1993), pp. 231-237
[Kov 94] Kovler, K.: Testing system for determining the mechanical behaviour of early age concrete under restrained and free uniaxial shrinkage. In: Materials and Structures, 1994, V. 27, pp. 324-330
[Kov 99] Kovler, K.: Interdependence of creep and shrinkage for concrete under ten-sion. In: Journal of Materials in Civil Engineering, No. 11, 1999, pp. 84-87
[Kra 06] Krauss, M., Bjøntegaard, Ø.: Statistical evaluation of autogenous deformation tests results performed in the RILEM Technical Committee 195-DTD frame-work. In: O.M. Jensen et al. (eds.), Volume Changes of Hardening Concrete: Testing and Mitigation; Proceedings of the International RILEM Conference, Lyngby, Denmark, 2006, pp. 347-356

144
[Kri 08] Kristek, V., Vrablik, L., Bazant, Z.P., Li, G.-H., Yu, Q.: Misprediction of long-time deflections of prestressed box girders: Causes, remedies and tendon layout effect. In: Proceedings of Concreep 8, Ise-Shima, Japan, 2008, pp. 1291-1295
[Kwo 08a] Kwon, Seung Hee; Shah, Surendra P.: Prediction of Early-Age Cracking of Fiber-Reinforced Concrete due to Restrained Shrinkage. In: ACI Materials Journal 105 (2008) 4, pp. 381-389
[Kwo 08b] Kwon, S.H.; Shah, S.P.: Prediction of shrinkage cracking for fiber-reinforced concrete. In: Proceedings of Concreep 8, Ise-Shima, Japan, 2008, pp. 511-517
[Lam 04] Lamour, V., Haouas, A., Moranville, M., Schell, R.: A new technique for characterization of early-age cracking of mortars. In: Advances in Concrete Through Science and Engineering, 2004, Proceedings (digital)
[Lan 03] Lange, D.A., Altoubat, S.A.: Early creep. In: Early age cracking in cementi-tious systems. In: Early Age Cracking in Cementitious Systems. RILEM Re-port 25 of RILEM Technical Committee TC 181-EAS (Early age shrinkage induced stresses and cracking in cementitious systems), Bagneux, France, 2003, pp. 57-62
[Lau 90] Laube, M.: Werkstoffmodell zur Berechnung von Temperaturspannungen in massigen Betonbauteilen im jungen Alter. Dissertation, TU Braunschweig, 1990 (in German)
[Lee 06] Lee, K.M., Lee, H.K., Lee, S.H., Kim, G.Y.: Autogenous shrinkage of con-crete containing granulated blast-furnace slag. In: Cement and Concrete Re-search 36 (2006) 7, pp. 1279-1285
[Len 98] Lenkenhoff, R.: Mikroskopischer Nachweis der Rissentwicklung im Betonge-füge. Dissertation, Ruhr-Universität Bochum, Germany, 1998
[Lie 08] Lieboldt, M.; Barhum, R.; Mechtcherine, V.: Effect of cracking on transport of water and gases in textile reinforced concrete. In: Proceedings of Concreep 8, Ise-Shima, Japan, 2008, pp. 199-205
[Lin 06] Lin, Z., Kishi, T.: Volume changes and restrained stress of lightweight con-crete and expansive concrete. In: O.M. Jensen et al. (eds.), Volume Changes of Hardening Concrete: Testing and Mitigation; Proceedings of the Interna-tional RILEM Conference, Lyngby, Denmark, 2006, pp. 41-50
[Liu 06] Liu, Jia-ping, Tian, Qian; Sun, Wei, Miao, Chang-wen, Tang, Ming-shu: Study on the self-desiccation effect in early-age concrete and the determina-tion of ‘time-zero’ of self-desiccation shrinkage. In: O.M. Jensen et al. (eds.), Volume Changes of Hardening Concrete: Testing and Mitigation; Proceed-ings of the Intern. RILEM Conference, Lyngby, Denmark, 2006, pp. 401-410

145
[Loc 00] Locher, F.W.: Zement - Grundlagen der Herstellung und Verwendung. Düsseldorf, Germany, Verlag Bau und Technik 2000. English: Cement – Principles of production and use. Düsseldorf, Germany, 2006
[Los 10] Loser, R., Münch, B., Lura, P.: A volumetric technique for measuring the co-efficient of thermal expansion of hardening cement paste and mortar. In: Ce-ment and Concrete Research 40 (2010) 7, pp. 1138-1147
[Lou 00] Loukili, A., Chopin, D., Khelidj, A., Le Touzo, J.-Y.: A new approach to de-termine autogenous shrinkage of mortar at an early age considering tempera-ture history. In: Cement and Concrete Research 30 (2000), pp. 915-922
[Lou 99] Loukili, A., Khelidj, A., Richard, P.: Hydration kinetics, change of relative humidity, and autogenous shrinkage of ultra-high-strength concrete. In: Ce-ment and Concrete Research 29 (1999), pp. 577-584
[Lur 03a] Lura, P., Jensen, O.M., Breugel, K. van: Autogenous shrinkage in high-performance cement paste: An evaluation of basic mechanisms. In: Cement and Concrete Research (2003), p. 223-232
[Lur 03b] Lura, P., van Breugel, K.: Effect of curing temperature on autogenous defor-mations of cement paste and high performance concrete for different cement types. In: 11th International Congress on the Chemistry of Cement: Proceed-ings, South Africa, Mai 2003, pp. 1616-1625
[Lur 03c] Lura, P.: Autogenous deformation and internal curing of concrete. PhD thesis, Netherlands, 2003
[Lur 05] Lura, P., Jensen, O.M.: Discussion: On the measurement of free deformations of early age cement paste and concrete ([Bjø 04]). In: Cement Concrete Composites 27 (2005), pp. 854-858
[Lur 07] Lura, P., Jensen, O.M.: Measuring techniques for autogenous strain of cement paste. In: Materials and Structures 40 (2007), pp. 431-440
[Lur 09] Lura, P., Couch, J., Jensen, O.M., Weiss, J.: Early-age acoustic emission measurements in hydrating cement paste: evidence for cavitation during so-lidification due to self-desiccation. In: Cement and Concrete Research 39 (2009), pp. 861-867
[Lym 34] Lyman, C.G.: Growth and Movement in Portland Cement Concrete. Oxford University Press, London, U.K., pp. 1-139 (as quoted in [Ait 99])
[Ma 03] Ma, J., Dehn, F., Koenig, G.: Autogenous shrinkage of self-compacting ultra-high performance concrete. In: Advances in Concrete and Structures, Pro-ceedings of the International Conference ICACS, Xuzhou, China, 2003, pp. 255-262
146
[Ma 05] Ma, X., Niu, C., Hooton, R.D.: Mechanical analysis of concrete specimen un-der restrained condition. In: Journal of Wuhan University of Technology - Materials Science Edition, Volume 20, No. 3, 2005, pp. 91-94
[Mal 07] Malarics, V., Müller, H.S.: Experimental and numerical analysis of the frac-ture process at the splitting tension test for concrete. In: 6th International Con-ference on Fracture Mechanics of Concrete and Concrete Structures, Catania, Italy, June 2007
[Mal 10] Malárics, V.; Müller, H. S.: Experimental and numerical analysis of the frac-ture process at the splitting tension test for concrete. In: 7th International Con-ference on Fracture Mechanics of Concrete and Concrete Structures, Seog-wipo, South Korea, 2010
[Mar 00] Martinola, G.: Rissbildung und Ablösung zementgebundener Beschichtungen auf Beton. Dissertation, Eidgenössische Technische Hochschule Zürich, Switzerland, 2000 (in German).
[Mar 02] Maruyama, I., Noguchi, T., Lura, P., van Breugel, K.: Calculation of self-induced stress in early-age concrete using creep and relaxation model. In: Proceedings of the 1st fib Congress, Osaka, Japan, 2002, pp. 215-222
[Mar 08] Maruyama, I., Suzuki, M., Sato, R.: Self-induced stress in reinforced ultra-strength concrete. In: Proceedings of Concreep 8, Ise-Shima, Japan, 2008, pp. 365-372
[Mat 99] Matsushita, H., Tsuruta, H.: The influence of quality of coarse aggregate on the autogenous shrinkage stress in high-fluidity concrete. In: Autogenous shrinkage of concrete. Proceedings of the International Workshop organized by JCI (Japan Concrete Institute), Hiroshima, 1998. E&FN Spon, London 1999, pp. 363-374
[May 70] Mayfield, B.: A new tensile strength test for concrete - or a new control test? In: Magazine of Concrete Research 22 (1970) 71, pp. 107-108
[Maz 03] Mazzotti, C., Savoia, M.: Nonlinear creep damage model for concrete under uniaxial compression. In: Journal of Engineering Mechanics 129 (2003) 9, pp. 1065-1075
[Mec 00] Mechtcherine, V.: Bruchmechanische und fraktologische Untersuchungen zur Rissausbreitung in Beton. Schriftenreihe des Institutes für Massivbau und Baustofftechnologie, Universität Karlsruhe, Heft 40, 2000 (in German)
[Mec 05] Mechtcherine, V., Schulze, J.: Testing the behavior of strain hardening ce-mentitious composites in tension. In: International RILEM workshop on high performance fiber reinforced cementitious composites (HPFRCC) in struc-tural applications, Honolulu, Hawaii, USA, 2005, pp. 37-46

147
[Mec 06] Mechtcherine. V., Dudziak, L., Schulze, J., Staehr, H.: Interna1 curing by su-per absorbent polymers (SAP) - Effects on material properties of self-compacting fibre-reinforced high performance concrete. In: O.M. Jensen et al. (eds.), Volume Changes of Hardening Concrete: Testing and Mitigation; Pro-ceedings of the International RILEM Conference, Lyngby, Denmark, 2006, pp. 87-96
[Mec 08] Mechtcherine, V.; Dudziak, L.; Hempel, S.: Mitigating early age shrinkage of Ultra-High Performance Concrete by using Super Absorbent Polymers (SAP). In: Creep, shrinkage and durability mechanics of concrete and concrete Struc-tures: Proceedings of CONCREEP 8, Ise-Shima, Japan 2008, pp. 847-853
[Mec 09] Mechtcherine, V., Dudziak, L., Hempel, S.: Internal curing to reduce cracking potential of ultra-high performance concrete by means of super absorbent polymers. In: Concrete Durability and Service Life Planning - Con-creteLife’09, Kovler, K. (ed.), RILEM PRO 66, Bagneux, France, 2009, pp. 13-20
[Med 09] Meddah, M.S., Tagnit-Hamou, A.: Pore structure of concrete with mineral admixtures and its effect on self-desiccation shrinkage. In: ACI Materials Journal 106 (2009) 3, pp. 241-250
[Mia 07] Miao Chang-wen, Tian Qiana, Sun Wei, Liu Jia-ping: Water consumption of the early-age paste and the determination of “time-zero” of self-desiccation shrinkage. In: Cement and Concrete Research 37 (2007), pp. 1496-1501
[Mia 09] Miao Chang-wen, Tian Qiana, Sun Wei, Liu Jia-ping: Early-age shrinkage and cracking of self-compacting concrete: measurement techniques and miti-gation strategies. SCC 2009, Beijing, China, 5-7 June 2009, pp. 74-83
[Mih 00] Mihashi, H., Wittmann, F.H. (eds.): Control of cracking in early age concrete. Proceedings of the international workshop on control of cracking in early age concrete, Sendai, Japan, 2000
[Mih 04] Mihashi H., Leite, J.P. de B.: State-of-the-Art Report on Control of Cracking in Early Age Concrete. In: Journal of Advanced Concrete Technology, 2004, No. 2, pp. 141-154
[Mil 66] Mills, R.H.: Factors influencing cessation of hydration in water cured cement pastes. US Department of Transportation, Highway Research Board, Special Report No. 90, Washington 1966, pp. 406-424
[Miy 01] Miyazawa, S., Tazawa, E.: Prediction model for shrinkage of concrete includ-ing autogenous shrinkage. In: Ulm, F.J., Bažant, Z.P., Wittmann, F.H. (eds.): Creep, Shrinkage and Durability Mechanics of Concrete and other Quasi-Brittle Materials. Elsevier, 2001, pp. 735-740

148
[Miz 00] Mizobuchi, T., Yokozeki, K., Nobuta, Y.: Experimental estimation of thermal cracking using the modified temperature-stress testing machine. In: Proceed-ings of the international workshop on control of cracking in early age con-crete, Sendai, Japan, 2000, pp. 153-162
[Moo 06] Moon, J. H., Weiss, J.: Estimating residual stress in the restrained ring test under circumferential drying. Cement & Concrete Composites, 2006, 5, pp. 486-496
[Mös 08] Möser, B., Pfeifer, C.: Microstructure and durability of ultra-high perform-ance concrete. In: Proceedings of the 2nd International Symposium on UHPC, Kassel, Germany, 2008, pp. 417-424
[Mou 06] Mounanga, P., Baroghel-Bouny, V., Loukili, A., Khelidj, A.: Autogenous de-formations of cement pastes: Part I. Temperature effects at early age and mi-cro-macro correlations. Cement and Concrete Research 36 (2006), pp. 110-122
[Mou 06b] Mounanga, P., Loukili, A., Bouasker, M., Khelidj, A., Coue, R.: Effect of set-ting retarder on the early age deformations of self-compacting mortars. In: Volume Changes of Hardening Concrete: Testing and Mitigation, Interna-tional RILEM Conference: Proceedings, Lyngby, Denmark, August 2006, pp. 311-320
[Mue 02] Müller, H.S., Mechtcherine, V., Kessler-Kramer, C.: Bruchmechanische Ei-genschaften von hochfestem Beton. In: Beton- und Stahlbetonbau 2002, Nr. 9, pp. 471-483 (in German)
[Mue 09] Müller, H.S., Reinhardt, H.-W.: Beton. In: Betonkalender 2009 (in German), Part 1, Ernst & Sohn, Berlin, Germany, 2009, pp. 1-139
[Mue 10a] Müller, C., Palecki, S., Möser, B., Franke, L.: Durability of Ultra-High Per-formance Concrete (UHPC). In: Proceedings of the International fib Congress 2010, Washington, D.C., USA
[Mue 10b] Müller, H.S., Burkart, I., Budelmann, H., Ewert, J., Mechtcherine, V., Dudziak, L., Müller, C., Eppers, S.: Time-dependent behaviour of UHPC. In: Proceedings of the 3rd International fib congress, Washington, USA, May/June 2010
[Mue 10c] Müller, H.S., Nolting, U., Haist, M. (eds.): Beherrschung von Rissen in Be-ton. 7. Symposium Baustoffe und Bauwerkserhaltung. Karlsruhe Institute of Technology (KIT), 2010
[Naw 04] Nawa, T., Horita, T.: Autogenous shrinkage of high-performance concrete. In: Proceedings of the international workshop on microstructure and durabil-ity to predict service life of concrete structures. Sapporo, Japan, 2004

149
[Ohn 99] Ohno, Y, Nakagawa, T.: Research of test method for autogenous shrinkage stress in concrete. In: Autogenous shrinkage of concrete. Proceedings of the International Workshop organized by JCI (Japan Concrete Institute), Hi-roshima, 1998. E&FN Spon, London 1999, pp. 375-382
[Ohy 06] Ohya, M., Nawa, T.: Evaluation of failure criteria of shrinkage cracking for restrained concrete. In: O.M. Jensen et al. (eds.), Volume Changes of Harden-ing Concrete: Testing and Mitigation; Proceedings of the International RILEM Conference, Lyngby, Denmark, 2006, pp. 215-222
[Ole 06] Olesen, J.F., Ostergaard, L., Stang, H.: Nonlinear fracture mechanics and plasticity of the split cylinder test. In: Materials and Structures 39 (2006) 4, pp. 421-432
[Ong 06] Ong, K.C., Myint-lay, Kyaw: Application of Image Analysis to Monitor Very Early Age Shrinkage. In: ACI Materials Journal 103 (2006) 3, pp.169-176
[Oza 06] Ozawa, M., Morimoto, H.: Estimation method for thermal expansion coeffi-cient of concrete at early ages. In: O.M. Jensen et al. (eds.), Volume Changes of Hardening Concrete: Testing and Mitigation; Proceedings of the Interna-tional RILEM Conference, Lyngby, Denmark, 2006, pp. 331-339
[Pai 76] Paillere, A.-M., Serrano, J.-J.: Appareil d'étude de la fissuration du béton. In: Bulletin de Liaison du Laboratoire des Ponts et Chaussées 83, 1976, pp. 29-38
[Pan 08a] Pane, I., Hansen, W.: Investigation on key properties controlling early-age stress development of blended cement concrete. In: Cement and Concrete Re-search 38 (2008) 11, pp. 1325-1335
[Pan 08b] Pane, I., Hansen, W.: Predictions and verifications of early-age stress devel-opment in hydrating blended cement concrete. In: Cement and Concrete Re-search 38 (2008) 11, pp. 1315-1324
[Pas 09] Passuello, A., Moriconi, G., Shah, S.P.: Cracking behaviour of concrete with shrinkage reducing admixtures and PVA fibers In: Cement & Concrete Com-posites 31 (2009) 10, pp. 699-704
[Per 01] Persson, B.: A NORDTEST method for verification of self-desiccation in concrete. In: Cement and Concrete Research 31 (2001) 2, pp. 199-203
[Per 02] Persson, B.: Eight-year exploration of shrinkage in high-performance con-crete. In: Cement and Concrete Research 32 (2002), pp. 1229-1237
[Per 05] Persson, B.: On the temperature effect on self-desiccation of concrete. In: Self-desiccation and its importance in concrete technology, 4th International Research Seminar: Proceedings, Gaithersburg, Maryland, USA, June 2005,

150
pp. 95-120
[Per 97] Persson, B.: Self-desiccation and its importance in concrete technology. In: Materials and Structures, Vol. 30, June 1997, pp. 293-305
[Pie 08] Pierard, J., Cauberg, N., Remy, O.: Evaluation of durability and cracking ten-dency of ultra high performance concrete. In: 8th International Conference on Creep, Shrinkage and Durability of Concrete and Concrete Structures: Pro-ceedings, 2008, Japan, pp. 695-700
[Pig 00] Pigeon, M., Toma, G., Delagrave, A., Bissonnette, B., Marchand, J., Prince, J.C.: Equipment for the analysis of the behaviour of concrete under restrained shrinkage at early ages. In: Magazine of Concrete Research 52 (2000) 4, pp. 297-302
[Pow 46a] Powers, T.C., Brownyard, T.L.: Studies of the physical properties of hardened Portland cement paste, part 2: studies of water fixation. In: Journal of the American Concrete Institute 18 ( 1946) 3, pp. 249-336
[Pow 46b] Powers, T.C., Brownyard, T.L.: Studies of the physical properties of hardened Portland cement paste, part 3: theoretical interpretation of adsorption data. In: Journal of the American Concrete Institute 18 ( 1946) 4, pp. 469-504
[Pow 48] Powers, T.C., Brownyard, T.L.: Bulletin of the Portland Cement Association 22, Chicago 1948
[Pow 58] Powers, T.C.: Structure and physical properties of hardened Portland cement paste. In: American Ceramic Society: Journal 41 (1958) 1, pp. 1-6
[Rad 06] Radlinska, A. Moon, J. H., Rajabipour, F., Weiss, J.: The ring test: a review of recent developments. In: Volume Changes of Hardening Concrete: Testing and Mitigation, International RILEM Conference: Proceedings, Lyngby, Denmark, August 2006, pp. 205-214
[Rad 98] Radocea, A.: Autogenous volume change of concrete at very early age. In: Magazine of Concrete Research 50 (1998) 2, pp. 107-113
[Raj 08] Rajabipour, F., Sant, G., Weiss, J.: Interactions between shrinkage reducing admixtures (SRA) and cement paste's pore solution. In: Cement and Concrete Research 38 (2008) 5, pp. 606-615
[Rei 06] Reinhardt, H.-W., Rinder, T.: Tensile creep of high-strength concrete. In: Journal of Advanced Concrete Technology 5 (2006), No. 2, pp. 277-283
[Ric 95] Richard, P., Cheyrezy, M.: Composition of reactive powder concretes. In: Cement and Concrete Research 25 (1995) 7, pp. 1501-1511
151
[RIL 06] O.M. Jensen et al. (eds.), Volume Changes of Hardening Concrete: Testing and Mitigation; Proceedings of the International RILEM Conference, Lyngby, Denmark, 2006, Bagneux, France, RILEM Publications
[RIL 10] O.M. Jensen et al. (eds.), Use of superabsorbent polymers and other new ad-ditives in concrete; Proceedings of the International RILEM Conference, Lyngby, Denmark, 2010, Bagneux, France, RILEM Publications
[Roc 99] Rocco, C., Guinea, G.V., Planas, J., Elices, M.: Size effect and boundary con-ditions in the Brazilian test: Experimental verification. In: Materials and Structures 32 (1999), pp. 210-217
[Ros 00] Rostasy, F.S., Krauß, M.: Effects of stress-strain relationship and relaxation on restraint, stress and crack formation in young concrete members. In: Pro-ceedings of the international workshop on control of cracking in early age concrete, Sendai, Japan, 2000, pp. 305-316
[Ros 87] Ross, C.T.F.: Advanced Applied Stress Analysis. Ellis Horwood Limited, United Kingdom, 1987, ISBN 130161551
[Röß 06] Rößler, C., Stark, J., Steiniger, F., Tichelaar, W.: Limited-dose electron mi-croscopy reveals the crystallinity of fibrous C-S-H phases. In: American Ce-ramic Society: Journal 89 (2006) 2, pp. 627-632
[Roz 07] Roziére, E., Granger, S. Turcry, Ph., Loukili, A.: Influence of paste volume on shrinkage cracking and fracture properties of self-compacting concrete. In: Cement & Concrete Composites 29 (2007) 8, pp. 626-636
[San 06] Sant, G., Lura, P., Weiss, J.: Measurement of Volume Change in Cementi-tious Materials at Early Ages: Review of Testing Protocols and Interpretation of Results. In: Journal of the Transportation Research Board (eds.): Concrete Materials 2006, Washington, USA, ISSN: 0361-1981, pp. 21-29
[San 06b] Sant, G., Lura, P., Weiss, J.: A discussion of analysis approaches for deter-mining ‘time-zero’ from chemical shrinkage and autogenous strain measure-ments in cement paste. In: O.M. Jensen et al. (eds.), Volume Changes of Hardening Concrete: Testing and Mitigation; Proceedings of the International RILEM Conference, Lyngby, Denmark, 2006, pp. 375-384
[San 07] Sant G., Rajabipour F., Radlinska A., Lura P., Weiss, J.: Volume changes in cement pastes containing shrinkage reducing admixtures under autogenous and drying conditions. In: 12th International Congress on the Chemistry of Cement, Canada, 2007
[San 09] Sant, G., Dehaudrai, M., Bentz, D., Lura, P., Ferraris, C.F., Bullard, J.W., Weiss, J.: Detecting the fluid-to-solid transition in cement pastes. In: Con-crete International 31 (2009) 6, pp. 53-58

152
[San 10] Sant G., Lura P., Scrivener, K., Weiss, J.: An overview of the mechanisms of shrinkage reducing admixtures in mitigating volume changes in fresh and hardened cementitious systems at early ages. In: Use of superabsorbent poly-mers and other new additives in concrete. International RILEM Conference, Proceedings, Lyngby, Denmark, August 2010, pp. 223-232
[Sat 99] Sato, R., Xu, M., Yang, Y.: Stresses due to autogenous shrinkage in high-strength concrete and its prediction. In: Autogenous shrinkage of concrete. Proceedings of the International Workshop organized by JCI (Japan Concrete Institute), Hiroshima, 1998. E&FN Spon, London 1999, pp. 351-362
[Sch 02] Schachinger, I., Schmidt, K., Heinz, D., Schießl, P.: Early age cracking risk and relaxation by restrained autogenous deformations of ultra high perform-ance concrete. In: 6th International Symposium on High Strength / High Per-formance Concrete, Leipzig 2002, pp 1341-1354
[Sch 04] Schiessl, P., Beckhaus, K., Schachinger, I., Rucker, P.: New Results on Early-Age Cracking of Special Concrete. In: Cement, concrete and aggregates, Vol. 26, No. 2, December 2004, pp. 139-147
[Sch 07] Schachinger, I.: Maßnahmen zur Herstellung von rissefreien Bauteilen aus ultrahochfestem Beton mit hoher Duktilität. Dissertation, München, Germa-ny, 2007 (in German)
[Sch 08] Schäffel, Patrick: Influence of shrinkage-reducing admixtures on autogenous shrinkage and other properties of hardened cement paste. In: Proceedings of Concreep 8, Ise-Shima, Japan, 2008, pp. 863-869
[Sch 09] Scheiner, S., Hellmich, C.: Continuum microviscoelasticity model for cemen-titious materials: upscaling technique and first experimental validation. In: Nanotechnology in Construction 3, 2009, pp. 89-93
[Sch 90] Schöppel, K., Breitenbücher, R., Springenschmid, R.: Untersuchungen von Massenbeton in der Temperaturspannungs-Prüfmaschine. In: Betonwerk + Fertigteil-Technik 56 (1990), No. 2, pp. 48-55 (in German)
[Sch 95] Schöppel, K., Springenschmid, R.: The effect of thermal deformation, chemi-cal shrinkage and swelling on restraint stresses in concrete at early ages. In: Thermal Cracking in Concrete at Early Ages, RILEM Proceedings 25, E&FN Spon, London 1995, pp. 213-220
[Schlei] Schleibinger Geräte Teubert u. Greim GmbH, www.schleibinger.com
[See 03] See, Heather T., Attiogbe, Emmanuel K., Miltenberger, Matthew A.: Shrink-age cracking characteristics of concrete using ring specimens. ACI Materials Journal, Nr. 3, 2003, pp. 239-245
153
[Sel 06] Sellevold, E.J., Bjøntegaard, O.: Coefficient of thermal expansion of cement paste and concrete: Mechanisms of moisture interaction. In: Materials and Structures 39 (2006) 9, pp. 809-815
[Sel 86] Sellevold, E.J., Nielsen, T.: Weltweiter Überblick über Microsilica in Beton. Elkem, 1986 (in German)
[Sel 95] Sellevold, E., Bjøntegaard, Ø., Justness, H., Dahl, P.A.: High performance concrete: early volume change and cracking tendency. In: Springenschmid, R. (ed.): Thermal Cracking in Concrete at Early Ages. International Symposium held by RILEM at the Technical University of Munich, 1994, RILEM Pro-ceedings 25, E&FN Spon, London 1995, pp. 229-236
[Seo 08] Seo, T.S., Ohno, Y.: Estimation of drying shrinkage cracking in RC wall. In: Proceedings of Concreep 8, Ise-Shima, Japan, 2008, pp. 1329-1335
[Set 08] Setzer, M.J.: The solid-liquid gel-system of hardened cement paste. In: Pro-ceedings of Concreep 8, Ise-Shima, Japan, 2008, pp. 237-243
[Set 94] Setzer, M.: Entwicklung und Präzision eines Prüfverfahrens zum Frost-Tausalz-Widerstand. In: Wissenschaftliche Zeitschrift der Hochschule für Ar-chitektur und Bauwesen Weimar, No. 5 - 7, pp. 87-93, Weimar, Germany, 1994
[Sha 06] Shah, H.R., Weiss, J.: Quantifying shrinkage cracking in fiber reinforced con-crete using the ring test. In: Materials and Structures 39 (2006) 9, pp. 887-899
[Sik 76] Sika AG: Zementmischung zur Herstellung von Erzeugnissen mit hoher Fes-tigkeit. Patentschrift 547880, Eidgenössisches Amt für geistiges Eigentum, Schweiz, 1976
[Sor 08] Sorelli, L., Daviller, R., Ulm, F.-J., Perry, V., Seibert, P.: Risk analysis of early-age cracking in UHPC structures. In: Proceedings of the 2nd Interna-tional Symposium on UHPC, Kassel, Germany, 2008, pp. 331-338
[Spr 85] Springenschmid, R., Gierlinger, E., Kiernozicky, W.: Thermal stresses in mass concrete: a new testing method and the influence of different cements. In: 15th International Congress on Large Dams, Lausanne 1985, R. 4, pp. 57-72
[Spr 95] Springenschmid, R. (ed.): Thermal Cracking in Concrete at Early Ages. Inter-national Symposium held by RILEM at the Technical University of Munich, 1994, RILEM Proceedings 25, E&FN Spon, London 1995
[Spr 95b] Springenschmid, R., Breitenbücher, R., Mangold, M.: Development of the cracking frame and the temperature-stress testing machine. In: Thermal Cracking in Concrete at Early Ages, RILEM Proceedings 25, E&FN Spon,
154
London 1995, pp. 137-144
[Sta 01] Stark, J., Wicht, B.: Dauerhaftigkeit von Beton: der Baustoff als Werkstoff. Basel, Switzerland, 2001 (in German)
[Sta 04] Staquet, S., Espion, B.: Early-age autogenous shrinkage of UHPC incorporat-ing very fine fly ash or metakaolin in replacement of silica fume. In: Interna-tional Symposium on Ultra High Performance concrete September 13-15, 2004, Kassel, pp. 587-599
[Sta 04] Staquet, S., Bernard E.: Evolution of the thermal expansion coefficient of UHPC incorporating very fine fly ash and metakaolin. In: International RILEM Symposium on Concrete Science and Engineering: A Tribute to Ar-non Bentur, 2004
[Sta 06] Staquet, S., Boulay, C., D’Aloïa, L., Toutlemonde, F.: Autogenous shrinkage of a self-compacting VHPC in isothermal and realistic temperature condi-tions. In: Proceedings of the 2nd Symposium on Advances in Concrete through Science and Engineering, Sept. 2006, Quebec, Canada
[Ste 09] Stefan, L., Benboudjema, F., Lagier, F., Torrenti, J.-M.: Percolation and creep of concrete at very early age behaviour. In: CONCREEP 8, Japan 2008, pp. 169-175
[Sub 02] Subramanian, S., Manohar, S., Malliarjun, V., Nagabhusana Rao, B., Sriniva-san, N.: Use of admixtures for reducing autogenous shrinkage of concrete. In: Innovations and developments in concrete materials and construction: Pro-ceedings of the International Conference of the University of Dundee, Scot-land, UK, 2002, pp. 235-248
[Sul 01] Sule, M., Breugel, K. van: Cracking behaviour of reinforced concrete sub-jected to early-age shrinkage. In: Materials and Structures 34 (2001) 239, pp. 284-292
[Sul 04] Sule, M., Breugel, K. van: The effect of reinforcement on early-age cracking due to autogenous shrinkage and thermal effects. In: Cement & Concrete Composites 26 (2004) 5, pp. 581-587
[Suz 05] Suzuki, M., Maruyama, I., Sato, R.: Properties of expansive-ultra-high-strength concrete. In: 7th International Symposium on the Utilization of High-Strength / High-Performance Concrete. ACI Symposium Publication 228, 2005, pp. 1159-1173
[Suz 08] Suzuki, M., Nakase, H., Maruyama, I., Sato, R.: Reduction of restrained stress in ultra high strength concrete using porous ceramic for internal curing. In: Creep, shrinkage and durability mechanics of concrete and concrete Struc-tures: Proceedings of CONCREEP 8, Japan 2008, pp. 839-845

155
[Suz 09] Suzuki, M., Meddah, M.S., Sato, R.: Use of porous ceramic waste aggregates for internal curing of high-performance concrete. In: Cement and Concrete Research 39 (2009), pp. 373-381
[Swa 79] Swamy, R. N., Bandyopadhyay, A. K., Stavrides, H.: The ring method of measuring restrained shrinkage in mortar and concrete. Cement, Concrete and Aggregates, Nr. 1 (1979), pp. 13-20
[Swi 09] Switek, A., Denarié, E., Brühwiler, E.: Tensile creep of UHPFRC under low and high stresses. In: Processing Sequence in the Production of Engineered Cementitious Composites, Vol. 1+2, Nr. 1, 2009, pp. 432-437.
[Swi 10] Switek, A., Denarié, E., Brühwiler, E.: Modeling of viscoelastic properties of Ultra High Performance Fiber Reinforced Concrete (UHPFRC) under low to high tensile stresses, Proceedings of CONMOD 2010, Vol. 1, Nr. 1, pp. 123-126
[Tak 05] Noguchi, T., Sun-Gyu, P., Maruyama, I.: Mechanical Properties of High-strength concrete with expansive additive and shrinkage reducing admixture under simulated completely-restrained condition at early age, Proceedings of the 4th International Research Seminar on Self-Desiccation and Its Importance in Concrete Technology, 2005 pp. 67-77
[Tam 09] Tammo, K., Thelandersson, S.: Crack widths near reinforcement bars for beams in bending. In: Structural Concrete, No. 1, Vol. 10, 2009, pp. 27-34
[Tan 08] Tanimura, M., Maruyama, I., Sato, R.: Autogenous deformation and resultant induced stress in low-shrinkage high-strength concrete. In: Creep, shrinkage and durability mechanics of concrete and concrete Structures: Proceedings of CONCREEP 8, Japan 2008, pp. 855-862
[Tao 06] Tao, Z., Weizu, Q.: Tensile creep due to restraining stresses in high-strength concrete at early ages. In: Cement and Concrete Research 36 (2006), pp. 584-591
[Tay 86] Taylor, Harry F.: Proposed structure for calcium silicate hydrate gel. In: American Ceramic Society: Journal 69 (1986) 6, pp. 464-467
[Taz 92] Tazawa, E., Miyazawa, S.: Autogenous shrinkage caused by self-desiccation in cementitious material, 9th International Congress on the Chemistry of Ce-ment, New Delhi, India, 1992, pp. 712-718
[Taz 95] Tazawa, E., Miyazawa, S.: Influence of cement and admixture on autogenous shrinkage of cement paste. In: Cement and Concrete Research 25 (1995), pp. 281-287
156
[Taz 97] Tazawa, E., Miyazawa, S.: Influence of cement composition on autogenous shrinkage of concrete. In: Justnes, H. (ed.): Proceedings of the 10th Interna-tional Congress on the Chemistry of Cement, Vol. 2, Sweden 1997
[Taz 97b] Tazawa, E., Miyazawa, S.: Influence of constituents and composition on autogenous shrinkage of cementitious materials. In: Magazine of Concrete Research 49 (1997), pp. 15-22
[Taz 99] Tazawa, E. (Ed.): Autogenous shrinkage of concrete. Proceedings of the In-ternational Workshop organized by JCI (Japan Concrete Institute), Hiroshima, 1998. E&FN Spon, London 1999, (Preface and Technical Committee Report)
[Ter 08] Teramoto, A., Maruyama, I.: Temperature dependent behaviour of autoge-nous shrinkage of cement paste containing silica fume with low w/b ratio. In: Proceedings of the 8th International Symposium on Utilization of High-Strength and High-Performance concrete, October 2008, Tokyo, Japan, pp. 141-147
[Ter 08b] Teramato, A., Maruyama, I., Suzuki, M.: Temperature dependency of autoge-nous shrinkage of ultra high-strength concrete. In: Creep, shrinkage and dura-bility mechanics of concrete and concrete Structures: Proceedings of CON-CREEP 8, Japan, pp. 701-707
[Thi 95] Thielen, G., Hintzen, W.: Investigation of Concrete Behaviour under Re-straint with a Temperature-Stress Test Machine. In: Thermal Cracking in Concrete at Early Ages, RILEM Proceedings 25, E&FN Spon, London 1995, pp. 145-152
[Tia 08] Tian Qian, Jensen, O.M.: Measuring autogenous strain of concrete with cor-rugated moulds. In: Microstructure related durability of cementitious compos-ites, 2008, RILEM publications, Bagneux, France, pp. 1501-1511
[Tia 09] Tian Qian, Jensen, O.M.: Measurement with corrugated tubes of early-age autogenous shrinkage of cement-based materials. In: Journal of the Chinese Ceramic Society 37 (2009), No. 1, pp. 39-45
[Tom 00] Toma, G., Pigeon, M., Marchand, J., Bissonnette, B., Delagrave, A.: Early-age autogenous restrained shrinkage: Stress build up and relaxation. In: Con-crete Science and Engineering, Vol. 2 (2000), pp. 129-133
[Toppits] Melitta, www.toppits.de/detail_d1_produkt_de,865,533.html (03.08.2010)
[Tur 02] Turcry, P. Loukili, A., Barcelo, L., Casabonne, J.M.: Can the maturity con-cept be used to separate the autogenous shrinkage and thermal deformation of a cement paste at early age? In: Cement and Concrete Research 32 (2002), pp. 1443-1450

157
[Uch 05] Uchida, Y., Niwa, J., Tanaka, Y., Katagiri, M.: Outlines of ‘Recommenda-tions for design and construction of ultra high strength fiber reinforced con-crete structures’ by JSCE. In: International RILEM workshop on high per-formance fiber reinforced cementitious composites (HPFRCC) in structural applications, Honolulu, Hawaii, USA, 2005, pp. 343-351
[VDZ 08] Verein Deutscher Zementwerke e.V. (Ed.): Zement-Taschenbuch 2008, 51th edition, Düsseldorf, Germany, Verlag Bau und Technik 2008 (in German)
[Wei 00] Weiss, W.J., Yang, Wei, Shah, S.: Influence Of specimen size/geometry on shrinkage cracking of rings. In: Journal of Engineering Mechanics (2000) 1, pp. 93-101
[Wei 03] Weiss, J.: Experimental determination of the ‘time-zero’ t0 (maturity-zero M0). In: Early Age Cracking in Cementitious Systems. RILEM Report 25 of RILEM Technical Committee TC 181-EAS (Early age shrinkage induced stresses and cracking in cementitious systems), Bagneux, France, 2003, pp. 195-206
[Wei 08] Weiss, J., Lura, P., Rajabipour, F., Sant, G.: Performance of shrinkage-reducing admixtures at different humidities and at early ages. In: ACI Materi-als Journal 105 (2008) 5, pp. 478-486
[Wie 96] Wiegrink, K., Marikunte, S., Shah, S. P.: Shrinkage cracking of high-strength concrete. ACI Materials Journal, Vol. 93, No. 5 (1996), pp. 409-417
[Wit 09] Wittmann, F.H.: Heresies on shrinkage and creep mechanisms. In: 8th Interna-tional Conference on Creep, Shrinkage and Durability of Concrete and Con-crete Structures, 2008, Ise-Shima, Japan, Proceedings, Taylor & Francis, Lon-don, 2009, pp. 709-714
[Wit 77] Wittmann, F.H.: Grundlagen eines Modells zur Beschreibung charakteristi-scher Eigenschaften des Betons. In: Schriftenreihe des Deutschen Ausschus-ses für Stahlbeton (1977) 290, pp. 43-101
[Yan 07] Yan, P.Y., Chen, Z.C., Wang, J.C., Zheng, F.: Autogenous shrinkage of con-crete prepared with the binders containing different kinds of mineral admix-ture. In: Proceedings of the 12th International Conference on Chemistry of Cement, Canada, 2007
[Zha 03] Zhang, M.H.; Tam, C.T.; Leow, M.P.: Effect of water-to-cementitious mate-rials ratio and silica fume on the autogenous shrinkage of concrete. In: Ce-ment and Concrete Research 33 (2003), pp. 1687-1694
[Zha 05] Zhang, J., Cusson, D., Mitchell, L., Hoogeveen, T., Margeson, J.: The matur-ity approach for predicting different properties of high-performance concrete. In: 7th International Symposium on the Utilization of High-Strength/High-

158
Performance Concrete. ACI Symposium Publication 228, 2005, pp. 135-154
[Zha 08] Zhang, J., Cusson, D., Monteiro, P., Harvey, J.: New perspectives on maturity method and approach for high performance concrete applications. In: Cement and Concrete Research 38 (2008), pp. 1438-1446
[Zhe 04] Zhen He, Xiangming Zhou, Zongjin, Li: New experimental method for study-ing early-age cracking of cement-based materials. ACI Materials Journal, 2004, 1, pp. 50-56
[Zhu 02] Zhutovsky, S., Kovler, K., Bentur, A.: Efficiency of lightweight aggregates for internal curing of high strength concrete to eliminate autogenous shrink-age. In: Materials and Structures 35 (2002) 246, pp. 97-101
[Zie 82] Ziegeldorf, S., Müller, H.S., Plöhn, J., Hilsdorf, H.K.: Autogenous shrinkage and crack formation in Young concrete. In: Colloque International sur le Be-ton Jeune, Ecole Nationale des Ponts et Chaussées, Paris, France, 1982, pp. 83-88

159
9 Annex

160
Table 9–1 Characteristic parameters of cements (A, B) and ground-granulated blast furnace slag (GGBFS)
Cements
A1) B3) Parameter Unit
1 2 32) 4 1 2
GGBFS 4)
Chemical analysis – loss-on-ignition-free
Loss on ignition 950 °C, Infrared
spectroscopy 1.19 1.22 1.17 0.85 1,08 0,65 0.1
SiO2 21.2 21.43 22.7 21.96 22.28 22.38 36.39
Al2O3 3.31 3.31 3.36 3.2 4.1 3.62 10.95
TiO2 0.23 0.22 n. d. 0.2 0.24 0.20 0.84
Fe2O3 5.21 4.92 5.5 5.53 1.39 1.15 0.28
MgO 0.73 0.74 0.68 0.65 0.92 0.96 11.72
CaO 65.15 64.8 67.4 64.97 65.65 67.09 37.64
SO3 2.01 2.19 2.2 2.25 3.5 3.55 0.03
Na2O-equivalent
X-ray fluorescence
analysis
0.5 0.54 0.44 0.44 0.52 0.58 0.84
C3S 71.02 68.37 65.76 62.87 61.03 69.14 -
C2S 8.12 10.75 15.47 15.78 18.55 12.11 -
C3A 0 0.46 0 0 8.59 7.65 -
C4AF 16.04 15.18 16 15.3 4.29 3.51 -
C2F
X-ray fluorescence
analysis, phase calculation
acc. to Bogue 0.06 0 0.43 0.9 0 0 -
Lime standard 96.12 95.02 92.69 92.7 93.47 96.60 -
Silica modulus 2.5 2.6 2.56 2.51 4.06 4.69 -
Alumina modulus
X-ray fluorescence
analysis 0.64 0.67 0.61 0.58 2.94 3.14 -
C3S 60.26 56.98 n. d. n. d. 62.41 n. d. -
C2S 17.39 22.32 n. d. n. d. 16.66 n. d. -
C3A 1.98 2.04 n. d. n. d. 8.4 n. d. -
C4AF
X-ray diffraction, refinement
acc. to Rietveld
M.-%
14.26 13.04 n. d. n. d. 2.7 n. d. -
Granulometric parameters
Density kg/dm³ 3.18 n. d. n. d. n. d. 3,12 n. d. 2.88
Blaine Fineness cm²/g 4650 n. d. 4950 4690 4710 n. d. 3890
Physical parameters according to EN 197-1
Water demand M.-% 28.5 29 28.5 29 30,5 n. d. -
Initial setting min 140 170 140 170 155 n. d. -
Final setting min 195 225 190 210 195 n. d. -
Compressive strength (2 d) MPa 30.6 35.1 36.3 32.5 39,8 n. d. -
Compressive strength (28 d) MPa 61.8 64.1 63.8 61.4 64,3 n. d. -
Heat of hydration J/g 320 n. d. n. d. n. d. 357 n. d. -
1) A: CEM I 52,5 R-HS/NA (HS: high sulfate resistance; NA: low alkali equivalent acc. to DIN 1164-10), batch 1 to 4 2) Data provided by cement manufacturer 3) B: CEM I 52,5 R, batch 1 and 2 4) Ground-granulated blast furnace slag n. d.: not determined
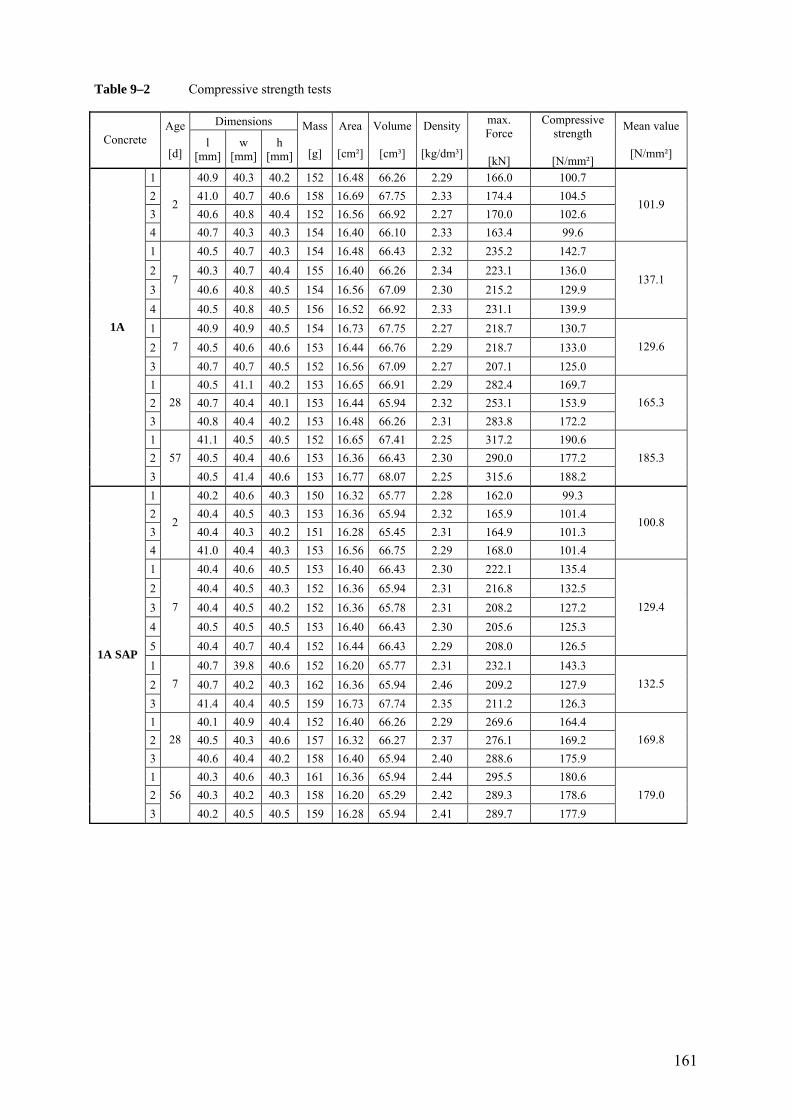
161
Table 9–2 Compressive strength tests
Dimensions
Concrete Age
[d]
l [mm]
w [mm]
h [mm]
Mass
[g]
Area
[cm²]
Volume
[cm³]
Density
[kg/dm³]
max. Force
[kN]
Compressive strength
[N/mm²]
Mean value
[N/mm²]
1 40.9 40.3 40.2 152 16.48 66.26 2.29 166.0 100.7
2 41.0 40.7 40.6 158 16.69 67.75 2.33 174.4 104.5
3 40.6 40.8 40.4 152 16.56 66.92 2.27 170.0 102.6
4
2
40.7 40.3 40.3 154 16.40 66.10 2.33 163.4 99.6
101.9
1 40.5 40.7 40.3 154 16.48 66.43 2.32 235.2 142.7
2 40.3 40.7 40.4 155 16.40 66.26 2.34 223.1 136.0
3 40.6 40.8 40.5 154 16.56 67.09 2.30 215.2 129.9
4
7
40.5 40.8 40.5 156 16.52 66.92 2.33 231.1 139.9
137.1
1 40.9 40.9 40.5 154 16.73 67.75 2.27 218.7 130.7
2 40.5 40.6 40.6 153 16.44 66.76 2.29 218.7 133.0
3
7
40.7 40.7 40.5 152 16.56 67.09 2.27 207.1 125.0
129.6
1 40.5 41.1 40.2 153 16.65 66.91 2.29 282.4 169.7
2 40.7 40.4 40.1 153 16.44 65.94 2.32 253.1 153.9
3
28
40.8 40.4 40.2 153 16.48 66.26 2.31 283.8 172.2
165.3
1 41.1 40.5 40.5 152 16.65 67.41 2.25 317.2 190.6
2 40.5 40.4 40.6 153 16.36 66.43 2.30 290.0 177.2
1A
3
57
40.5 41.4 40.6 153 16.77 68.07 2.25 315.6 188.2
185.3
1 40.2 40.6 40.3 150 16.32 65.77 2.28 162.0 99.3
2 40.4 40.5 40.3 153 16.36 65.94 2.32 165.9 101.4
3 40.4 40.3 40.2 151 16.28 65.45 2.31 164.9 101.3
4
2
41.0 40.4 40.3 153 16.56 66.75 2.29 168.0 101.4
100.8
1 40.4 40.6 40.5 153 16.40 66.43 2.30 222.1 135.4
2 40.4 40.5 40.3 152 16.36 65.94 2.31 216.8 132.5
3 40.4 40.5 40.2 152 16.36 65.78 2.31 208.2 127.2
4 40.5 40.5 40.5 153 16.40 66.43 2.30 205.6 125.3
5
7
40.4 40.7 40.4 152 16.44 66.43 2.29 208.0 126.5
129.4
1 40.7 39.8 40.6 152 16.20 65.77 2.31 232.1 143.3
2 40.7 40.2 40.3 162 16.36 65.94 2.46 209.2 127.9
3
7
41.4 40.4 40.5 159 16.73 67.74 2.35 211.2 126.3
132.5
1 40.1 40.9 40.4 152 16.40 66.26 2.29 269.6 164.4
2 40.5 40.3 40.6 157 16.32 66.27 2.37 276.1 169.2
3
28
40.6 40.4 40.2 158 16.40 65.94 2.40 288.6 175.9
169.8
1 40.3 40.6 40.3 161 16.36 65.94 2.44 295.5 180.6
2 40.3 40.2 40.3 158 16.20 65.29 2.42 289.3 178.6
1A SAP
3
56
40.2 40.5 40.5 159 16.28 65.94 2.41 289.7 177.9
179.0
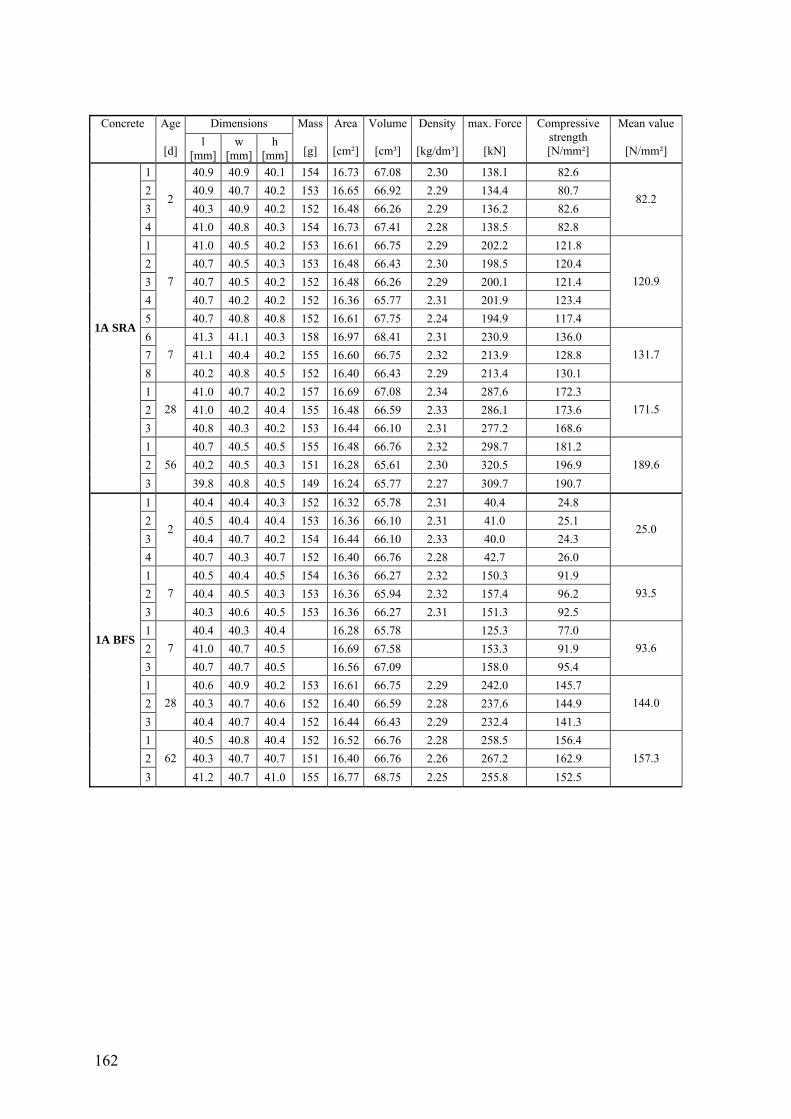
162
Dimensions Concrete Age
[d] l
[mm] w
[mm] h
[mm]
Mass
[g]
Area
[cm²]
Volume
[cm³]
Density
[kg/dm³]
max. Force
[kN]
Compressive strength [N/mm²]
Mean value
[N/mm²]
1 40.9 40.9 40.1 154 16.73 67.08 2.30 138.1 82.6
2 40.9 40.7 40.2 153 16.65 66.92 2.29 134.4 80.7
3 40.3 40.9 40.2 152 16.48 66.26 2.29 136.2 82.6
4
2
41.0 40.8 40.3 154 16.73 67.41 2.28 138.5 82.8
82.2
1 41.0 40.5 40.2 153 16.61 66.75 2.29 202.2 121.8
2 40.7 40.5 40.3 153 16.48 66.43 2.30 198.5 120.4
3 40.7 40.5 40.2 152 16.48 66.26 2.29 200.1 121.4
4 40.7 40.2 40.2 152 16.36 65.77 2.31 201.9 123.4
5
7
40.7 40.8 40.8 152 16.61 67.75 2.24 194.9 117.4
120.9
6 41.3 41.1 40.3 158 16.97 68.41 2.31 230.9 136.0
7 41.1 40.4 40.2 155 16.60 66.75 2.32 213.9 128.8
8
7
40.2 40.8 40.5 152 16.40 66.43 2.29 213.4 130.1
131.7
1 41.0 40.7 40.2 157 16.69 67.08 2.34 287.6 172.3
2 41.0 40.2 40.4 155 16.48 66.59 2.33 286.1 173.6
3
28
40.8 40.3 40.2 153 16.44 66.10 2.31 277.2 168.6
171.5
1 40.7 40.5 40.5 155 16.48 66.76 2.32 298.7 181.2
2 40.2 40.5 40.3 151 16.28 65.61 2.30 320.5 196.9
1A SRA
3
56
39.8 40.8 40.5 149 16.24 65.77 2.27 309.7 190.7
189.6
1 40.4 40.4 40.3 152 16.32 65.78 2.31 40.4 24.8
2 40.5 40.4 40.4 153 16.36 66.10 2.31 41.0 25.1
3 40.4 40.7 40.2 154 16.44 66.10 2.33 40.0 24.3
4
2
40.7 40.3 40.7 152 16.40 66.76 2.28 42.7 26.0
25.0
1 40.5 40.4 40.5 154 16.36 66.27 2.32 150.3 91.9
2 40.4 40.5 40.3 153 16.36 65.94 2.32 157.4 96.2
3
7
40.3 40.6 40.5 153 16.36 66.27 2.31 151.3 92.5
93.5
1 40.4 40.3 40.4 16.28 65.78 125.3 77.0
2 41.0 40.7 40.5 16.69 67.58 153.3 91.9
3
7
40.7 40.7 40.5 16.56 67.09 158.0 95.4
93.6
1 40.6 40.9 40.2 153 16.61 66.75 2.29 242.0 145.7
2 40.3 40.7 40.6 152 16.40 66.59 2.28 237.6 144.9
3
28
40.4 40.7 40.4 152 16.44 66.43 2.29 232.4 141.3
144.0
1 40.5 40.8 40.4 152 16.52 66.76 2.28 258.5 156.4
2 40.3 40.7 40.7 151 16.40 66.76 2.26 267.2 162.9
1A BFS
3
62
41.2 40.7 41.0 155 16.77 68.75 2.25 255.8 152.5
157.3

163
Figure 9–1 Splitting tension tests: filled mold (top), specimen preparation (centre) and testing (bottom)

164
Table 9–3 Splitting tensile strength tests. Rate of stress increase: 3.0 MPa/min Concrete Age
[h]
Diameter
[mm]
Height
[mm]
Mass
[g]
Area
[cm²]
Volume
[cm³]
Density
[kg/dm³]
max. Force
[kN]
Splitting tensile strength [N/mm²]
Mean value
[N/mm²]
1 37.0 45.5 112 10.75 48.92 2.29 0.739 0.28
2 36.8 44.9 108 10.64 47.76 2.26 0.673 0.26
3
9
37.0 50.9 124 10.75 54.73 2.27 0.864 0.29
0.28
1 37.0 50.5 125 10.75 54.30 2.30 1.494 0.51
2 36.8 50.7 124 10.64 53.93 2.30 1.54 0.53
3
10
36.8 51.2 126 10.64 54.46 2.31 1.542 0.52
0.52
1 36.6 50.0 126 10.52 52.60 2.40 4.77 1.66
2 36.9 50.0 125 10.69 53.47 2.34 4.63 1.60
3
13
36.9 50.0 127 10.69 53.47 2.38 6.83 2.36
1.63
1 37.0 49.2 121 10.75 52.90 2.29 12.21 4.27
2 36.7 50.2 123 10.58 53.10 2.32 12.18 4.21
3
16.5
36.6 50.6 122 10.52 53.24 2.29 11.14 3.83
4.10
1 37.0 51.3 126 10.75 55.16 2.28 18.62 6.25
2 36.7 50.5 125 10.58 53.42 2.34 16.84 5.78
3
19.5
37.0 49.9 125 10.75 53.65 2.33 18.73 6.46
6.16
1 36.7 50.7 123 10.58 53.63 2.29 20.24 6.92
2 36.7 51.3 127 10.58 54.27 2.34 20.47 6.92
3
22.5
37.0 50.4 125 10.75 54.19 2.31 17.72 6.05
6.63
1 36.9 49.8 123 10.69 53.26 2.31 25.72 8.91
2 36.9 49.9 124 10.69 53.36 2.32 29.84 10.32
1A
3
40
37.0 49.8 125 10.75 53.55 2.33 29.58 10.22
9.82
1 36.6 41.1 104 10.52 43.24 2.41 6.11 2.59
2 36.7 50.8 127 10.58 53.74 2.36 10.66 3.64
3
15.5
37.0 50.4 129 10.75 54.19 2.38 9.61 3.28
3.46
1 37.0 50.2 127 10.75 53.98 2.35 14.84 5.09
2 36.6 48.8 120 10.52 51.34 2.34 16.17 5.76
3
17.5
36.9 50.6 126 10.69 54.11 2.33 19.36 6.60
5.82
1 36.6 50.3 125 10.52 52.92 2.36 20.06 6.94
2 36.8 50.4 126 10.64 53.61 2.35 18.15 6.23
3
20.5
37.0 49.6 123 10.75 53.33 2.31 18.12 6.29
6.49
1 37.0 50.4 125 10.75 54.19 2.31 18.57 6.34
2 36.6 51.2 127 10.52 53.87 2.36 20.49 6.96
3
23.5
36.6 50.5 124 10.52 53.13 2.33 22.57 7.77
7.02
1 37.2 50.4 124 10.87 54.78 2.26 24.34 8.26
2 36.8 49.8 124 10.64 52.97 2.34 23.73 8.24
1A SAP
3
41
37.0 50.2 126 10.75 53.98 2.33 29.92 10.26
8.92

165
Concrete Age
[h]
Diameter
[mm]
Height
[mm]
Mass
[g]
Area
[cm²]
Volume
[cm³]
Density
[kg/dm³]
max. Force
[kN]
Splitting tensile strength [N/mm²]
Mean value
[N/mm²]
1 37.1 50.3 126 10.81 54.38 2.32 4.342 1.48 2 37.3 49.9 125 10.93 54.53 2.29 4.943 1.69 3
16
37.5 50.0 127 11.04 55.22 2.30 5.91 2.01
1.73
1 36.7 50.7 124 10.58 53.63 2.31 7.39 2.53 2 36.9 50.4 123 10.69 53.90 2.28 11.42 3.91 3
18.5h
37.0 50.3 124 10.75 54.08 2.29 10.29 3.52
3.71
1 36.7 50.0 124 10.58 52.89 2.34 12.68 4.40 2 36.8 50.1 123 10.64 53.29 2.31 10.37 3.58 3
20.5
37.0 50.0 126 10.75 53.76 2.34 13.36 4.60
4.19
1 36.6 50.4 123 10.52 53.03 2.32 12.22 4.22 2 37.0 49.7 123 10.75 53.44 2.30 13.21 4.57 3
21.5h
36.8 50.3 123 10.64 53.50 2.30 12.37 4.25
4.35
1 37.2 51.0 125 10.87 55.43 2.26 17.56 5.89 2 36.8 49.0 121 10.64 52.12 2.32 16.86 5.95 3
24
37.0 50.5 126 10.75 54.30 2.32 18.18 6.19
6.01
1 36.8 50.4 122 10.64 53.61 2.28 24.4 8.38 2 36.8 50.4 123 10.64 53.61 2.29 22.34 7.67 3 37.0 50.0 124 10.75 53.76 2.31 22.92 7.89 4 37.2 50.8 124 10.87 55.21 2.25 22.54 7.59 5 36.8 50.8 125 10.64 54.03 2.31 24.88 8.47
1A SRA
6
40.5h
37.0 49.4 122 10.75 53.12 2.30 19.82 6.90
7.82
1 37.0 50.8 124 10.75 54.62 2.27 0.876 0.30 2 37.0 50.1 121 10.75 53.87 2.25 0.653 0.22 3
18
37.0 50.4 122 10.75 54.19 2.25 0.643 0.22
0.25
1 36.6 50.6 125 10.52 53.24 2.35 1.265 0.43 2 37.0 49.5 124 10.75 53.22 2.33 1.485 0.52 3
20.5
36.8 50.8 126 10.64 54.03 2.33 1.613 0.55
0.50
1 36.6 50.6 123 10.52 53.24 2.31 1.736 0.60 2 37.0 49.9 125 10.75 53.65 2.33 2.115 0.73 3
22.5
36.8 50.8 125 10.64 54.03 2.31 2.006 0.68
0.67
1 36.8 50.2 125 10.64 53.39 2.34 2.646 0.91 2 36.6 50.6 123 10.52 53.24 2.31 2.728 0.94 3
25.5
37.0 49.3 123 10.75 53.01 2.32 2.702 0.94
0.93
1 37.0 50.7 124 10.75 54.51 2.27 5.086 1.73 2 36.8 50.0 125 10.64 53.18 2.35 6.667 2.31 3
39.5
37.0 51.7 130 10.75 55.59 2.34 7.001 2.33
2.12
1 36.6 50.4 124 10.52 53.03 2.34 7.066 2.44 2 36.6 50.3 124 10.52 52.92 2.34 5.773 2.00 3 36.8 50.0 124 10.64 53.18 2.33 7.23 2.50 4 36.6 51.3 128 10.52 53.97 2.37 7.004 2.37 5
47
36.6 50.5 127 10.52 53.13 2.39 8.069 2.78
2.42
1 36.6 50.7 126 10.52 53.34 2.36 9.89 3.39 2 36.8 50.5 124 10.64 53.71 2.31 10.55 3.61 3
65
37.2 50.4 126 10.87 54.78 2.30 11.47 3.89
3.63
1 36.8 49.5 122 10.64 52.65 2.32 24.99 8.73 2 36.8 50.0 125 10.64 53.18 2.35 18.58 6.43
1A BFS
3
163
37.0 49.0 123 10.75 52.69 2.33 21.21 7.45
7.54
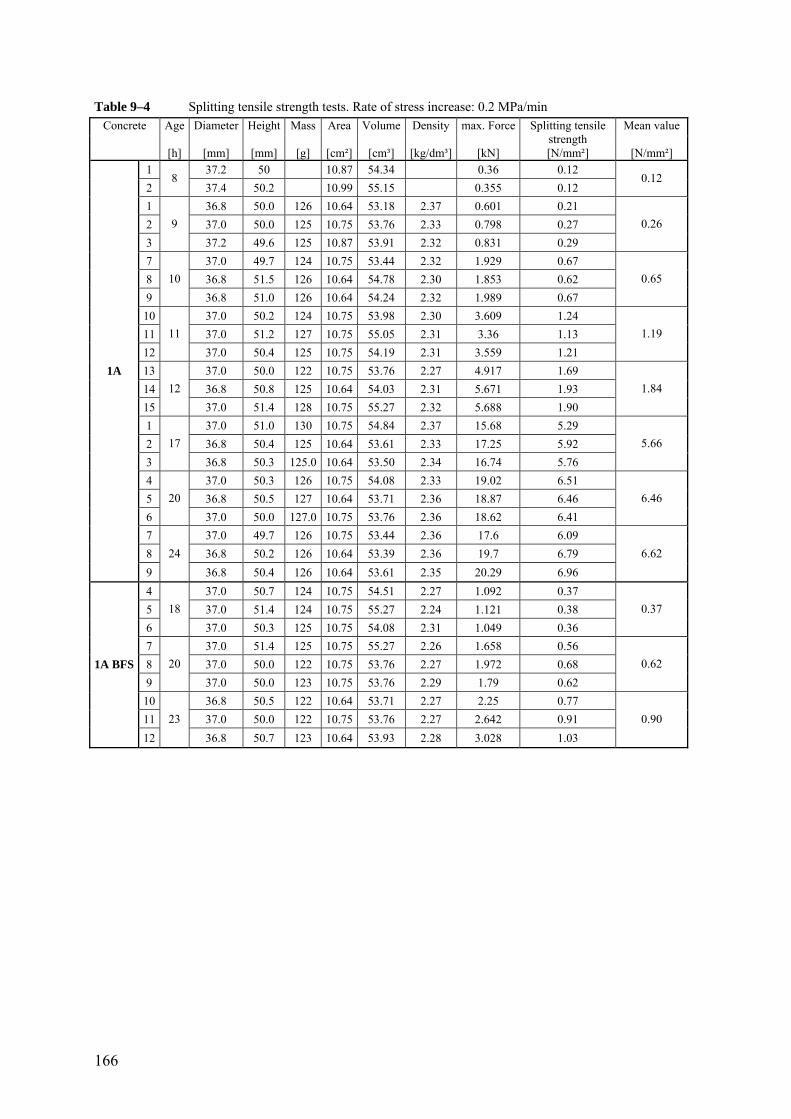
166
Table 9–4 Splitting tensile strength tests. Rate of stress increase: 0.2 MPa/min
Concrete Age
[h]
Diameter
[mm]
Height
[mm]
Mass
[g]
Area
[cm²]
Volume
[cm³]
Density
[kg/dm³]
max. Force
[kN]
Splitting tensile strength [N/mm²]
Mean value
[N/mm²]
1 37.2 50 10.87 54.34 0.36 0.12
2 8
37.4 50.2 10.99 55.15 0.355 0.12 0.12
1 36.8 50.0 126 10.64 53.18 2.37 0.601 0.21
2 37.0 50.0 125 10.75 53.76 2.33 0.798 0.27
3
9
37.2 49.6 125 10.87 53.91 2.32 0.831 0.29
0.26
7 37.0 49.7 124 10.75 53.44 2.32 1.929 0.67
8 36.8 51.5 126 10.64 54.78 2.30 1.853 0.62
9
10
36.8 51.0 126 10.64 54.24 2.32 1.989 0.67
0.65
10 37.0 50.2 124 10.75 53.98 2.30 3.609 1.24
11 37.0 51.2 127 10.75 55.05 2.31 3.36 1.13
12
11
37.0 50.4 125 10.75 54.19 2.31 3.559 1.21
1.19
13 37.0 50.0 122 10.75 53.76 2.27 4.917 1.69
14 36.8 50.8 125 10.64 54.03 2.31 5.671 1.93
15
12
37.0 51.4 128 10.75 55.27 2.32 5.688 1.90
1.84
1 37.0 51.0 130 10.75 54.84 2.37 15.68 5.29
2 36.8 50.4 125 10.64 53.61 2.33 17.25 5.92
3
17
36.8 50.3 125.0 10.64 53.50 2.34 16.74 5.76
5.66
4 37.0 50.3 126 10.75 54.08 2.33 19.02 6.51
5 36.8 50.5 127 10.64 53.71 2.36 18.87 6.46
6
20
37.0 50.0 127.0 10.75 53.76 2.36 18.62 6.41
6.46
7 37.0 49.7 126 10.75 53.44 2.36 17.6 6.09
8 36.8 50.2 126 10.64 53.39 2.36 19.7 6.79
1A
9
24
36.8 50.4 126 10.64 53.61 2.35 20.29 6.96
6.62
4 37.0 50.7 124 10.75 54.51 2.27 1.092 0.37
5 37.0 51.4 124 10.75 55.27 2.24 1.121 0.38
6
18
37.0 50.3 125 10.75 54.08 2.31 1.049 0.36
0.37
7 37.0 51.4 125 10.75 55.27 2.26 1.658 0.56
8 37.0 50.0 122 10.75 53.76 2.27 1.972 0.68
9
20
37.0 50.0 123 10.75 53.76 2.29 1.79 0.62
0.62
10 36.8 50.5 122 10.64 53.71 2.27 2.25 0.77
11 37.0 50.0 122 10.75 53.76 2.27 2.642 0.91
1A BFS
12
23
36.8 50.7 123 10.64 53.93 2.28 3.028 1.03
0.90
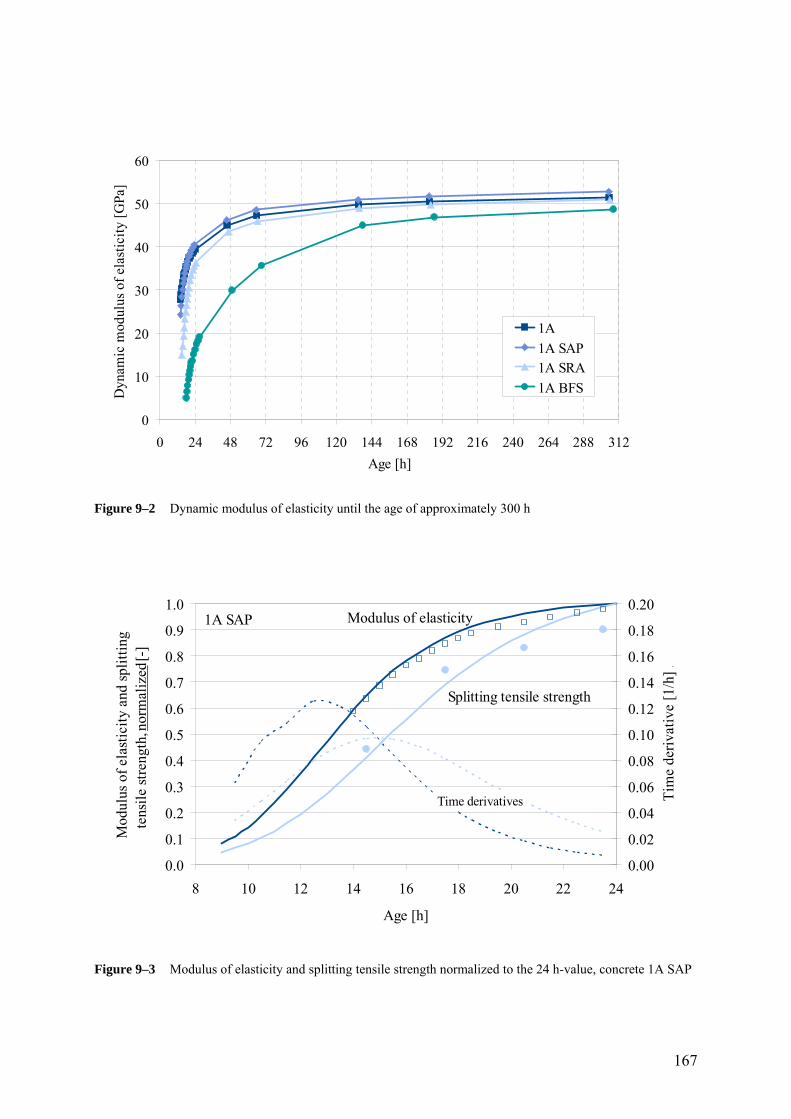
167
0
10
20
30
40
50
60
0 24 48 72 96 120 144 168 192 216 240 264 288 312
Age [h]
Dyn
amic
mod
ulus
of
elas
tici
ty [
GPa
] .
1A
1A SAP1A SRA
1A BFS
Figure 9–2 Dynamic modulus of elasticity until the age of approximately 300 h
0.0
0.1
0.2
0.3
0.4
0.5
0.6
0.7
0.8
0.9
1.0
8 10 12 14 16 18 20 22 24
Age [h]
Mod
ulus
of
elas
tici
ty a
nd s
plit
ting
te
nsil
e st
reng
th, n
orm
aliz
ed [
-] .
0.00
0.02
0.04
0.06
0.08
0.10
0.12
0.14
0.16
0.18
0.20
Tim
e de
riva
tive
[1/
h] .
Modulus of elasticity
Splitting tensile strength
Time derivatives
1A SAP
Figure 9–3 Modulus of elasticity and splitting tensile strength normalized to the 24 h-value, concrete 1A SAP

168
0.0
0.1
0.2
0.3
0.4
0.5
0.6
0.7
0.8
0.9
1.0
12 14 16 18 20 22 24
Age [h]
Mod
ulus
of
elas
tici
ty a
nd s
plit
ting
te
nsil
e st
reng
th, n
orm
aliz
ed [
-] .
0.00
0.02
0.04
0.06
0.08
0.10
0.12
0.14
0.16
0.18
0.20
Tim
e de
riva
tive
[1/
h] .
Modulus of elasticity
Splitting tensile strength
Time derivatives
1A SRA
Figure 9–4 Modulus of elasticity and splitting tensile strength normalized to the 24 h-value, concrete 1A SRA
0.0
0.1
0.2
0.3
0.4
0.5
0.6
0.7
0.8
0.9
1.0
15 16 17 18 19 20 21 22 23 24
Age [h]
Mod
ulus
of
elas
tici
ty a
nd s
plit
ting
te
nsil
e st
reng
th, n
orm
aliz
ed [
-] .
0.00
0.02
0.04
0.06
0.08
0.10
0.12
0.14
0.16
0.18
0.20
Tim
e de
riva
tive
[1/
h] .
Modulus of elasticity
Splitting tensile strength
Time derivatives
1A BFS
Figure 9–5 Modulus of elasticity and splitting tensile strength normalized to the 24 h-value, concrete 1A BFS

169
-2.5
-2.0
-1.5
-1.0
-0.5
0.0
0 4 8 12 16 20 24
Age [h]
Str
ain
[mm
/m]
Figure 9–6 Strain under sealed conditions evaluated from 1 h, measured by the shrinkage cone method (Lab 2), 2 tests with 2 shrinkage cone apparatus, concrete 1A, test 1
-2.5
-2.0
-1.5
-1.0
-0.5
0.0
0 4 8 12 16 20 24
Age [h]
Str
ain
[mm
/m]
Figure 9–7 Strain under sealed conditions evaluated from 1 h, measured by the shrinkage cone method (Lab 2), 2 tests with 2 shrinkage cone apparatus, concrete 1A, test 2
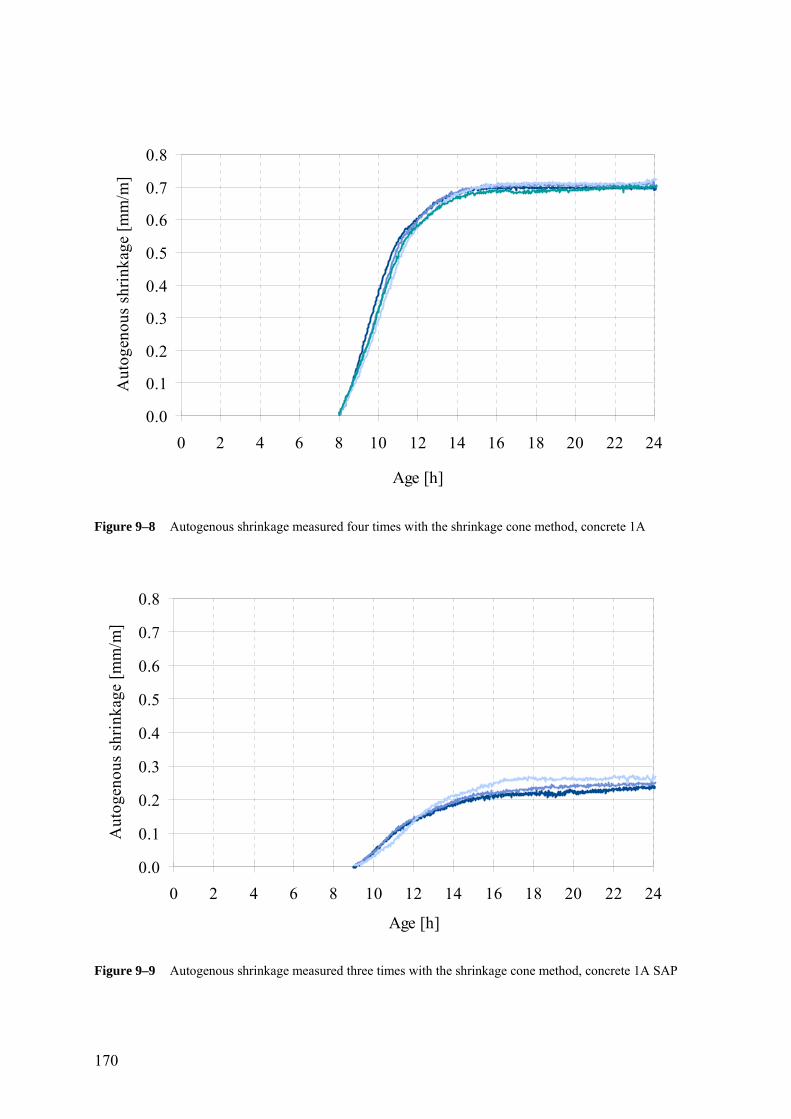
170
0.0
0.1
0.2
0.3
0.4
0.5
0.6
0.7
0.8
0 2 4 6 8 10 12 14 16 18 20 22 24
Age [h]
Aut
ogen
ous
shri
nkag
e [m
m/m
]
Figure 9–8 Autogenous shrinkage measured four times with the shrinkage cone method, concrete 1A
0.0
0.1
0.2
0.3
0.4
0.5
0.6
0.7
0.8
0 2 4 6 8 10 12 14 16 18 20 22 24
Age [h]
Aut
ogen
ous
shri
nkag
e [m
m/m
]
Figure 9–9 Autogenous shrinkage measured three times with the shrinkage cone method, concrete 1A SAP
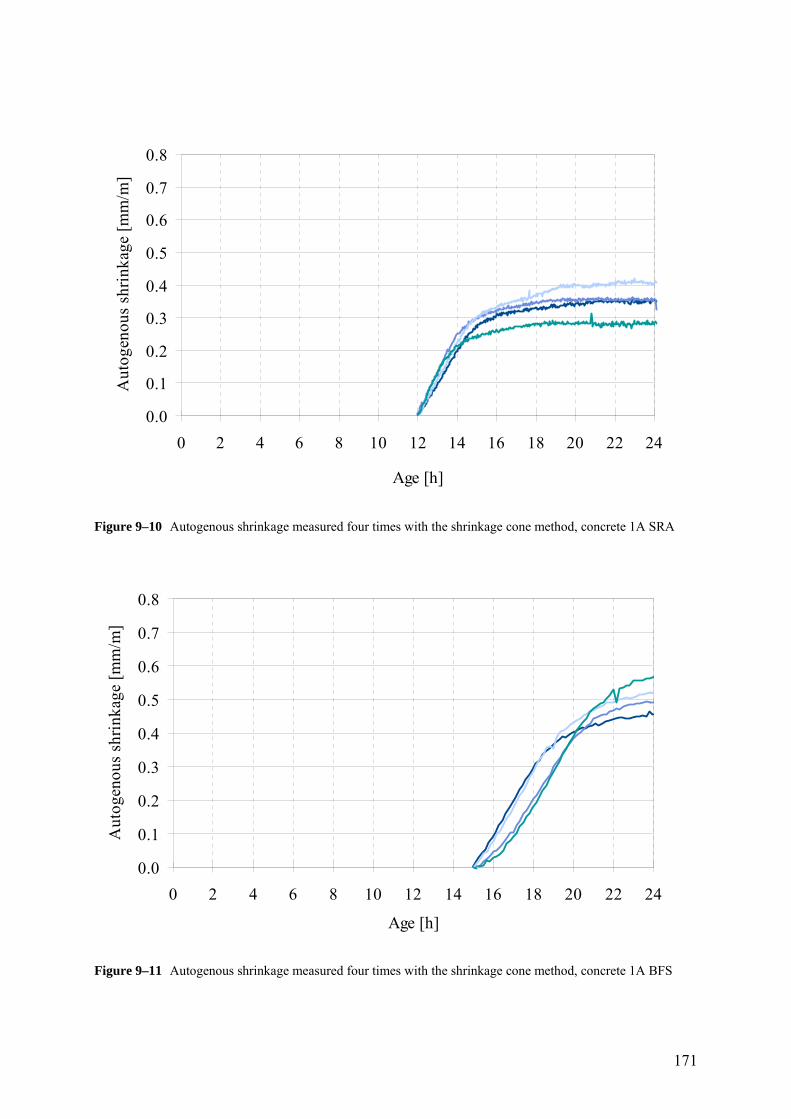
171
0.0
0.1
0.2
0.3
0.4
0.5
0.6
0.7
0.8
0 2 4 6 8 10 12 14 16 18 20 22 24
Age [h]
Aut
ogen
ous
shri
nkag
e [m
m/m
]
Figure 9–10 Autogenous shrinkage measured four times with the shrinkage cone method, concrete 1A SRA
0.0
0.1
0.2
0.3
0.4
0.5
0.6
0.7
0.8
0 2 4 6 8 10 12 14 16 18 20 22 24
Age [h]
Aut
ogen
ous
shri
nkag
e [m
m/m
]
Figure 9–11 Autogenous shrinkage measured four times with the shrinkage cone method, concrete 1A BFS

172
Figure 9–12 Movable measuring cabinet for restrained ring tests: 8 ring test setups, data acquisition system for strain gauges and resistance temperature detectors, computer for data storage and control of data acquisition system, uninterruptible power supply; left: front panel, centre: rear panel; right: air tight container for tests at low humidity with ventilation and heating unit (top: top view, bottom: front view)
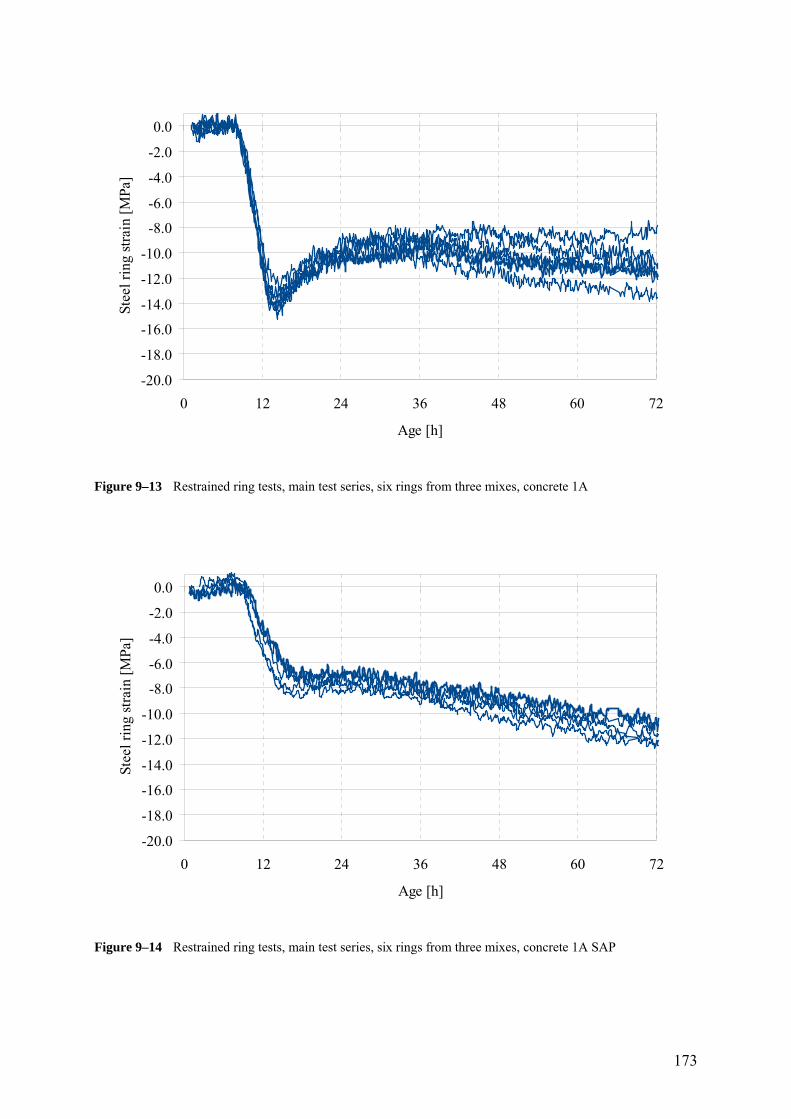
173
-20.0
-18.0
-16.0
-14.0
-12.0
-10.0
-8.0
-6.0
-4.0
-2.0
0.0
0 12 24 36 48 60 72
Age [h]
Stee
l rin
g st
rain
[M
Pa]
Figure 9–13 Restrained ring tests, main test series, six rings from three mixes, concrete 1A
-20.0
-18.0
-16.0
-14.0
-12.0
-10.0
-8.0
-6.0
-4.0
-2.0
0.0
0 12 24 36 48 60 72
Age [h]
Stee
l rin
g st
rain
[M
Pa]
Figure 9–14 Restrained ring tests, main test series, six rings from three mixes, concrete 1A SAP

174
-20.0
-18.0
-16.0
-14.0
-12.0
-10.0
-8.0
-6.0
-4.0
-2.0
0.0
0 12 24 36 48 60 72
Age [h]
Stee
l rin
g st
rain
[M
Pa]
Figure 9–15 Restrained ring tests, main test series, six rings from three mixes, concrete 1A SRA
-20.0
-18.0
-16.0
-14.0
-12.0
-10.0
-8.0
-6.0
-4.0
-2.0
0.0
0 12 24 36 48 60 72
Age [h]
Stee
l rin
g st
rain
[M
Pa]
Figure 9–16 Restrained ring tests, main test series, four rings from two mixes, concrete 1A BFS
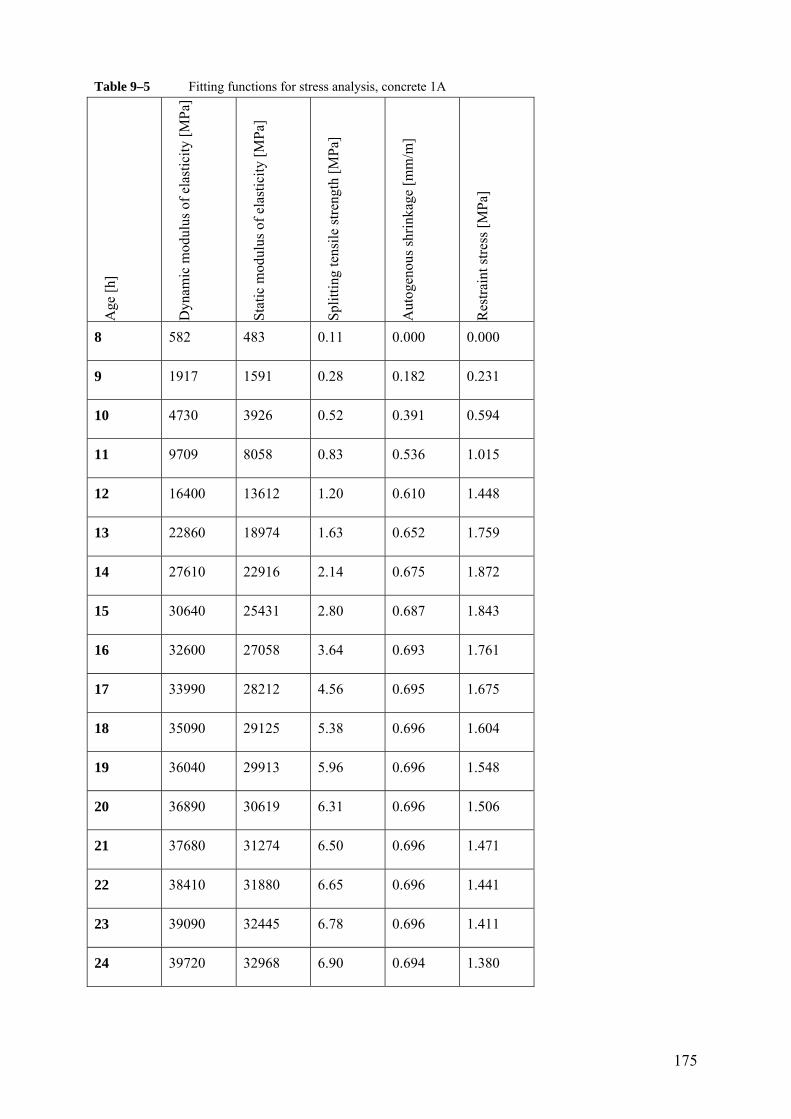
175
Table 9–5 Fitting functions for stress analysis, concrete 1A
Age
[h]
Dyn
amic
mod
ulus
of
elas
tici
ty [
MP
a]
Sta
tic
mod
ulus
of
elas
tici
ty [
MP
a]
Spl
itti
ng te
nsil
e st
reng
th [
MP
a]
Aut
ogen
ous
shri
nkag
e [m
m/m
]
Res
trai
nt s
tres
s [M
Pa]
8 582 483 0.11 0.000 0.000
9 1917 1591 0.28 0.182 0.231
10 4730 3926 0.52 0.391 0.594
11 9709 8058 0.83 0.536 1.015
12 16400 13612 1.20 0.610 1.448
13 22860 18974 1.63 0.652 1.759
14 27610 22916 2.14 0.675 1.872
15 30640 25431 2.80 0.687 1.843
16 32600 27058 3.64 0.693 1.761
17 33990 28212 4.56 0.695 1.675
18 35090 29125 5.38 0.696 1.604
19 36040 29913 5.96 0.696 1.548
20 36890 30619 6.31 0.696 1.506
21 37680 31274 6.50 0.696 1.471
22 38410 31880 6.65 0.696 1.441
23 39090 32445 6.78 0.696 1.411
24 39720 32968 6.90 0.694 1.380
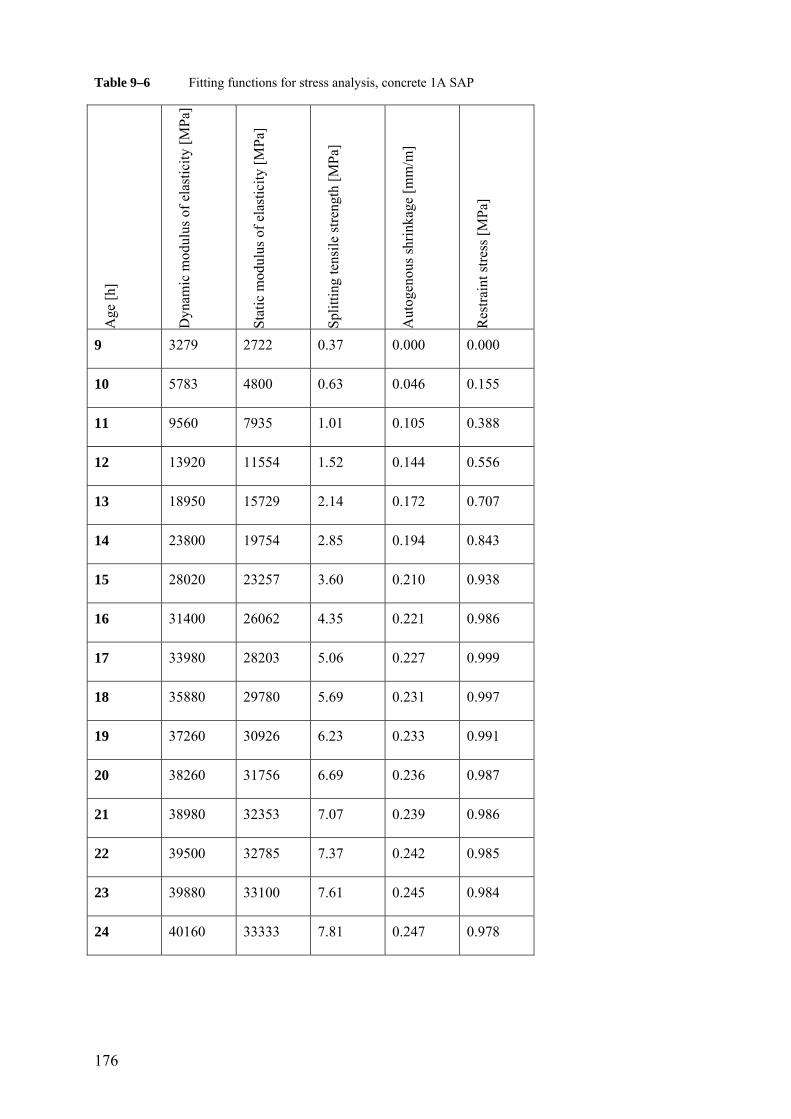
176
Table 9–6 Fitting functions for stress analysis, concrete 1A SAP
Age
[h]
Dyn
amic
mod
ulus
of
elas
tici
ty [
MP
a]
Sta
tic
mod
ulus
of
elas
tici
ty [
MP
a]
Spl
itti
ng te
nsil
e st
reng
th [
MP
a]
Aut
ogen
ous
shri
nkag
e [m
m/m
]
Res
trai
nt s
tres
s [M
Pa]
9 3279 2722 0.37 0.000 0.000
10 5783 4800 0.63 0.046 0.155
11 9560 7935 1.01 0.105 0.388
12 13920 11554 1.52 0.144 0.556
13 18950 15729 2.14 0.172 0.707
14 23800 19754 2.85 0.194 0.843
15 28020 23257 3.60 0.210 0.938
16 31400 26062 4.35 0.221 0.986
17 33980 28203 5.06 0.227 0.999
18 35880 29780 5.69 0.231 0.997
19 37260 30926 6.23 0.233 0.991
20 38260 31756 6.69 0.236 0.987
21 38980 32353 7.07 0.239 0.986
22 39500 32785 7.37 0.242 0.985
23 39880 33100 7.61 0.245 0.984
24 40160 33333 7.81 0.247 0.978

177
Table 9–7 Fitting functions for stress analysis, concrete 1A SRA
Age
[h]
Dyn
amic
mod
ulus
of
elas
tici
ty [
MP
a]
Sta
tic
mod
ulus
of
elas
tici
ty [
MP
a]
Spl
itti
ng te
nsil
e st
reng
th [
MP
a]
Aut
ogen
ous
shri
nkag
e [m
m/m
]
Res
trai
nt s
tres
s [M
Pa]
12 755 627 0.23 0.000 0.000
13 2707 2247 0.44 0.111 0.086
14 8179 6789 0.76 0.219 0.228
15 14600 12118 1.17 0.283 0.413
16 19400 16102 1.67 0.310 0.597
17 23220 19273 2.22 0.324 0.723
18 26480 21978 2.80 0.334 0.769
19 29210 24244 3.39 0.341 0.754
20 31390 26054 3.95 0.346 0.708
21 33070 27448 4.48 0.349 0.654
22 34310 28477 4.97 0.350 0.603
23 35200 29216 5.41 0.349 0.562
24 35840 29747 5.79 0.350 0.532

178
Table 9–8 Fitting functions for stress analysis, concrete 1A BFS
Age
[h]
Dyn
amic
mod
ulus
of
elas
tici
ty [
MP
a]
Sta
tic
mod
ulus
of
elas
tici
ty [
MP
a]
Spl
itti
ng te
nsil
e st
reng
th [
MP
a]
Aut
ogen
ous
shri
nkag
e [m
m/m
]
Res
trai
nt s
tres
s [M
Pa]
15 462 600 0.03 0.000 0.000
16 814 1200 0.08 0.052 0.042
17 2074 2350 0.16 0.113 0.129
18 4831 4010 0.24 0.190 0.241
19 7925 6578 0.34 0.271 0.352
20 10280 8532 0.44 0.343 0.448
21 12120 10060 0.54 0.405 0.526
22 13690 11363 0.64 0.455 0.588
23 15090 12525 0.73 0.492 0.636
24 16300 13529 0.81 0.518 0.670


![Prediction of autogenous shrinkage in concrete from ... · shrinkage increment follows the same point-wise law as the shrinkage due to external drying [21, 22]. However,modelsreflectingthisfact[6,23–30]require](https://static.fdocuments.net/doc/165x107/5e793775093ce1798b0543d7/prediction-of-autogenous-shrinkage-in-concrete-from-shrinkage-increment-follows.jpg)