ASSESSING PHYSICIAN SPECIALTY IMBALANCES: BACKGROUND AND ... · assessing physician specialty...
111
ASSESSING PHYSICIAN SPECIALTY IMBALANCES: BACKGROUND AND SHORT-TERM OPTIONS FOR THE COUNCIL ON GRADUATE MEDICAL EDUCATION
Transcript of ASSESSING PHYSICIAN SPECIALTY IMBALANCES: BACKGROUND AND ... · assessing physician specialty...

ASSESSING PHYSICIAN SPECIALTY IMBALANCES:
BACKGROUND AND SHORT-TERM OPTIONS FOR THE
COUNCIL ON GRADUATE MEDICAL EDUCATION

ASSESSING PHYSICIAN SPECIALTY IMBALANCES:
BACKGROUND AND SHORT-TERM OPTIONS FOR THE
COUNCIL ON GRADUATE MEDICAL EDUCATION
Discussion Paper
June 5, 1987
By
Louis P. Garrison, Jr. Peter J, Neumann
Julie A. Schoenman
Project HOPE Center for Health Affairs
Two Wisconsin Circle, Suite 500 Chevy Chase, Maryland 20815

PREFACE
This paper was prepared for the Council on Graduate Medical
Education under HRSA Order No. 87-318(P). The authors would like
to thank the Project Officer Jerald Katzoff for his guidance and
assistance in preparing this paper. Paul Schwab, Executive
Secretary of COGME, and Larry Clare, Director of the HRSA Office
of Graduate Medical Education and Data Analysis, also provided
many useful comments on an earlier draft. The authors are also
grateful the following individuals and organizations for the
information they provided: William Marder, American Medical
Association; L. Jack Carow III, council of Medical Specialty;
Paul Jolly, Association of American Medical Colleges; and John
Drabek, Bureau of Health Professions, Health Services and Resources
Administration. The views expressed here are solely those of the
authors.
ii

CONTENTS
Section
PREFACE. • • . . . • . . • • • • • • • • • • • • • • . . . . . • . . . . . . . . . . . .. . . . . . . . . . . . . ii
EXECUTIVE SUMMARY. • • . . . • . . . • . • . . . . • • • • • . . • • • • • . • • . • . • • . . . . . . v
l. INTRODUCTION •
1.1 Purpose........................................ 1-1 1. 2 organization of the Paper . .................... · 1-2
2. DEFINITIONS AND FUNDAMENTAL APPROACHES TO ASSESSING SPECIALTY IMBALANCES
2 .1 Introduction........................... . . . . . . . . 2-1
2.2 Definitions.................................... 2-2
2. 2 .1 Basic Economic Terminology.............. 2-2 2.2.2 Health Manpower Planning Terminology... 2-4
2.3 Classifying Approaches to Identifying Specialty Imbalances............................ 2-5
2.3.1 2.3.2 2.3.3
Needs-Based Approaches ................ . Demand-Based Approaches ............... . Market-Based.Signals ••.•.•.......•••••.
2-6 2-7 2-8
2.4 Geographic Distribution....................... 2-9
3. PREVIOUS APPROACHES TO ASSESSING SPECIALTY IMBALANCES
3 .1 Introduction............................. . . . . . . . .. 3-1
3.2 Demand-Based Requirements/Supply Comparisons.. 3-3
3.2.1 Bureau of Health Professions Modeling Efforts............................... . . . . 3-3
3.2.2 HMO-Based studies of Estimation of Requirements. • . • • . . • • . . • . • • . . • • . . . . . . . • 3-18
3.3 Needs-Based Requirements/Supply Comparisons... 3-21
3.3.1 3.3.2 3.3.3 3.3.4
overview ........ ~ ........................ . GMENAC' s Framework •.••....•....••.•..•• Criticisms and Limitations of GMENAC ••. GMENAC's Results and subsequent Modifications . ........................ .
iii
3-21 3-22 3-24
3-27

CONTENTS (Continued) Page
3.4 Market-signals Approach....................... 3-30
3.4.1 Analysis of Individual Physician Income. . . . . . . . . • • • . • • . . . . • • . . . . . . . . . . . . 3-32
3.4.2 Econometric Market Models.............. 3-34
3.5 Locational Distribution....................... 3-35
4. OTHER STUDIES AND DATA LIMITATIONS
4. 1 Introduction. . . . . . . . . . . . . . . . . . . . . . . . . . . . . . . . . . 4-1
4.2 Ongoing and Planned Studies................... 4-1
4.2.1 4.2.2 4.2.3
American Medical Association ••••••••.•• Council of Medical Specialty Societies. American Association of Medical
4-1 4-6
Colleges... . . . . . . . . . . . . . . . . . . . . . . . . . . . . 4-8
4. 3 Data Limitations . ............................. .
5. COGME'S SHORT-TERM OPTIONS FOR ASSESSING IMBALANCES
5.1 Identifying Short-Term Options ••.•• : .••••.•..•
5.2 Survey Professional Opinion ••••••••••••••.••.•
5.3 Synthesize Information from Market Signals and Indicators . ............................... .
5.4 Use BHPr's Requirements Projections .•.••••••••
5.5 Modify GMENAC Requirements Estimates ••••.•.•..
5.6 Use Specialty-to-Population Ratios from HMOs or Other Closed Populations ••••••••.••••••••...•.
5.7 Analyze Geographic Variability in Specialty-to-Population Ratios . ............................ .
6. POLICY QUESTIONS AND IMPLICATIONS FOR MODELING
4-10
5-1
5-4
5-6
5-8
5-10
5-11
5-13
6. 1 Introduc·tion. . .. . . . . . . . . . . . . . . . .. . .. .. . . . . . . . . . . .. . 6-1
6.2 Short-Term Modeling and Policy Issues......... 6-1
6.3 Implications for Long-Term Modeling........... 6-4
6.4 Other Policy Considerations................... 6-5
7 • REFERENCES
iv

EXECUTIVE SUMMARY
PURPOSE
The Council on Graduate Medical Education (COGME) is charg:eQ.__ . i ---~~-"
with examining "current and future shortages or excesses of '----------
physicians in medical and surgical specialties and subspecialties. 11
This discussion paper has been prepared for COGME's Subcommittee
on Physician Manpower. The two major objectives are to:
1) Provide background on recent, ongoing, and planned studies that assess physician specialty imbalances, and
2) Present COGME with short-term options for addressing questions concerning this issue.
Although COGME has been established for a ten-year period, its
first report is due July, 1988. The Subcommittee on Physician
Manpower must make recommendations on what can reasonably be
accomplished in time for the immediate report as well as what
should be the long-term approach to assessing specialty imbalances.
The focus of this paper is on the former objective, though the
implications for COGME's long-term plans are also discussed.
BASIC CONCEPTUAL APPROACHES
In Section 2 a distinction is drawn between two basic
approaches to assessing specialty imbalances: 1) comparison of
requirements and supply and 2) examination of market signals. In
addition, there is also an important distinction among approaches
falling into the first area--whether requirements are demand
based or needs-based. Comparisons of requirements and supply
examine quantities: the number of physicians reauired at a point
in time, as determined by either demand or need, compared to the
number available--the supply. The second approach examines
market signals, such as physician incomes and prices, and asks
whether the market is indicating, through relative income levels
v

or changes in income levels, that more or fewer physicians are
desired.
The comparison of requirements and supply has been the more
popular approach. The two approaches to estimating requirements
are best exemplified by the efforts of the Graduate Medical
Education National Advisory Committee (GMENAC)--a needs-based
approach--and the ongoing demand-based forecasting model of the
Bureau of Health Professions (BHPr). Both models·also have
ass.ociated supply projections; however, these are essentially
independent of the requirements projections. Economists have a
long history of studying physician incomes and calculating rates
of return to educational investments as indicators of whether there
is a long-term shortage or surplus of physicians. But such
calculations require a large amount of data, and have generally
not been applied with regard to the status of particular
specialties.
PREVIOUS ASSESSMENTS
Section 3 of the paper describes approaches which have been
employed in the past to assess physician imbalances. The most
comprehensive demand-based requirements model--developed and
maintained by the Bureau of Health Professions--is discussed in
Section 3.2 along with the BHPr methodology for projecting future
supply. The general weakness of demand-based requirements
estimates is that there is little explicit consideration of the
level of care which "ought to be" provided. Instead, past trends
in utilization are projected into the future with the implicit
assumption that these utilization patterns are the ones which
should be perpetuated. The BHPr supply model also employs a
sophisticated extrapolation of past trends in factors influencing
physician supply. Although the components of these models are
updated periodically, the use of the past to predict the future
may not be accurate if markets are changing over time.
vi

Of major importance for COGME is the fact that the BHPr
requirements model is not currently able to project requirements
on a detailed specialty level. In addition, BHPr staff have some
reservations about the feasibility of expanding the model to
encompass such detail. Another essentially demand-based approach
for estimating requirements is the use of standards derived from
studies of staffing patterns in closed health care systems such
as HMOs. Although the data requirements for the approach are
modest, the implied physician-to-population ratios are difficult
to interpret because they apply to unique populations.
Needs-based approaches to estimating requirements are
illustrated by the GMENAC effort, which is discussed in Section
3.3. The conceptual weakness of a pure needs-based approach is
that there is no consideration of the ability and willingness of
consumers to pay for the medical care that they need. As an
"adjusted" needs-based approach, GMENAC attempted to overcome this
shortcoming by considering the realities of the market. Still,
there is no assurance that the "needed" number of physicians
would be demanded. In contrast to the BHPr model, GMENAC did
project imbalances on a detailed specialty level.
GMENAC represents a substantial, one-time effort while BHPr
is ongoing. Both models have large data requirements but, since
both are empirical approaches, it would be feasible to adjust
certain model parameters so as to derive alternative estimates of
physician requirements and supply. Both models predict a surplus
in the aggregate number of physicians, with the GMENAC projections
being much larger. Supply estimates of both models are similar
but GMENAC projects much lower requirements estimates.
Section 3.4 discusses studies which have relied upon market
signals such as relative income levels or rates of return to
medical education as indicators of physician imbalances. These
vii
studies have found that many specialties have quite high returns
to specialization, indicating a shortage in these fields. In
general, the fact that real net physician income has remained
relatively constant over time (perhaps declining slightly in
recent years) has been interpreted by some analysts to mean that
there is not a surplus of physicians. Findings such as these are
in contrast to those of both GMENAC and BHPr.
In summary, the methods that have been used to assess
imbalances do not provide a consensus. In addition, even if
there were consensus concerning supply and demand at the national
level, the conclusions might be radically different for alternative
definitions of market areas such as nonmetropolitan areas.
ONGOING AND PLANNED STUDIES
Section 4 presents ongoing and proposed studies which are
being undertaken by the American Medical Association (AMA), the
council of Medical Specialty Societies (CMSS), and the
Association of American Medical Colleges (AAMC). The AMA is
currently developing a series of econometric models which, when
completed, will be able to project both supply and demand for
physician services. These models will use data from the AMA
Physician Masterfile and the Socioeconomic Monitoring System and
will consider 13 categories of specialties. Preliminary supply
projections have just been made available but the entire modeling
effort is not scheduled for completion until June 1989.
The CMSS is currently attempting to design a consistently
def ined minimum data base for the physician manpower data of its
member societies. This organization is also using a matrix
format by which to solicit projections of supply to the year 2010
from each of its specialty societies. CMSS is making this
information available to COGME. In addition to the organized
efforts of CMSS, a number of specialty societies have.undertaken
viii

their own assessments of their manpower situation. The studies
performed as of 1985 have been summarized in previous works in
this area (BHPr, 1986). COGME has requested that CMSS solicit
information from its members about recent, ongoing, or planned
studies which they are conducting concerning specialty imbalances.
This information will be made available to COGME in early June
1987.
The AAMC began collecting data on medical students in 1983,
and these data are currently being readied for use. They also
collect data on the graduate medical education process, and these
provide an excellent source of data for modeling specialty
choice. The AAMC's Task Force on Physician Manpower expects to
decide by November 1987 what (if any) modeling efforts it will
undertake in the future.
The final subsection of Section 4 considers issues of data
adequacy. Included there is a discussion of the relative merits
of AMA versus specialty society data for estimating existing
supplies of physicians and availability of physicians' services.
Data limitations for requirements estimates include the estimation
of physician productivity, utilization by specialty, and the
issue of substitution between particular specialties in the
provision of certain services. Finally, the limitations of
physician-to-population ratios as indicators of the amount of
"available services" to "needed services" are explored.
COGME 1 S SHORT-TERM OPTIONS FOR ASSESSING IMBALANCES
The major question addressed here is: in the time available
for analysis in preparing the first COGME report, what approach
or approaches are likely to be of most use in assessing specialty
imbalances? Obviously, the time constraint in and of itself
places a severe limitation on the amount of new or quantitative
modeling and estimation that can be undertaken. In any case, it
ix

would be technically difficult to construct any new models and
gather data for analysis in such a short period. Nonetheless,
there are some options building upon work of others that may help
COGME in the short-term.
The options vary along two dimensions and can be arrayed as
shown in Figure 1. The first dimension is level of specificity:
will the analysis examine all physicians, primary vs. non-primary
physicians, a more detailed breakdown of specialties, or selected
specialties? The second dimension is concerned with the amount
of qualitative and quantitative content and manipulation of data
that would be required. The six options listed in the figure are
not necessarily mutually exclusive.
The level of specificity has a major impact on what is
feasible in the short run. Finer specialty breakdowns will
require much more effort to develop and analyze. A major factor
in choosing the level of specialty chosen is the specific policy
questions that COGME wishes to address in its first report.
Briefly, the six basic alternative approaches are:
1. Survey professional opinion.
2. Synthesize information from market signals and indicators.
3. Use BHPr's requirements projections (not possible on a -specialty level).
4. Modify GMENAC requirements estimates.
5. compare specialty-to-population ratios from HMOs or other closed populations with supply.
6. Analyze geographic variability in specialty-to-population ratios.
x

; ~ ·~ -··,·
LEVEL OF SPECIFICITY
ALL ~ PHYSICIANS I-'·
- ~ PRIMARY VS. NON-PRIMARY
DETAILED SPECIAL TIES
SELECTED SPECIALTIES
FIGURE 1
ARRAY OF SHORT·TERM OPTIONS
I MORE MORE I QUALITATIVE~·-···················································,) QUANTITATIVE
~. ,3. 4-. I SURVEY I SYNTHESIZE I USE I MODIFY I USE I ANALYZE I PROFESSIONAL I MARKET I BHPr I GMENAC I HMO I GEOGRAPHIC ~ I SIGNALS I MODEL I MODEL I STANDARD I VARIABILITY
S.c.lvhd
I i "' i Ii""'
s..,µ 1i.;~~ 6'<- " w'- ------ llt~
W~§~ 1:1
l~r.JI'\
.J<A~o_ . A~
_.,.-•'

In this summary, we outline each of these options and list the
advantages and disadvantages. Section 5 provides discussion of
each.
1. Survey Professional Opinion
Approach: Use qualitative professional opinion to make judgments about requirements.
Method: Design short qualitative questionnaire to send to specialty societies or other experts to solicit their opinions about requirements and imbalances, especially regarding GMENAC. Alternatively, small panels of experts could be convened to provide their opinion or to review the results provided by the specialty societies.
Advantactes:
o Allows experts to make and explain judgments about these complex issues.
o Allows detailed specialty consideration.
o Well-designed questions would help to focus COGME's attention.
Disadvantages:
o Is not directly quantitative.
o May not achieve a consensus.
o Panelists may not have a good perspective on physician imbalances.
2. Synthesize Information from Market signals and Indicators
Approach: Use latest information from the market to gain a qualitative impression about how the requirements compare with supply.
Method: Gather and collate information by specialty on relative incomes, recent growth in supply, rate of return to education, and the demand and supply of residencies.
xii

Advantages:
o Provides good information on the current market situation.
o Allows some degree of specialty breakdown.
Disadvantages:
o Based on existing reimbursement arrangements and subsidies which are undergoing rapid change. May not be representative of the future or what is socially desirable.
o May be too uncertain to support any strong recommendations about specific specialties.
3. Use BHPr•s Requirements Projections
Approach: Compare existing BHPr demand-based requirements projections with supply. Do not attempt a finer specialty breakdown.
Method: Have BHPr produce the most up-to-date version of the projections. Use for addressing aggregate supply question and policy issues about primary vs. nonprimary imbalance.
Advantages:
o Builds upon the most comprehensive demand-based model and estimates ever constructed.
o Could be completed in short-term.
o Allows some questions about primary vs. nonprimary imbalances to be addressed.
o Is currently operational and could be used to examine alternative assumptions.
Disadvantages:
o Does not allow detailed or accurate specialty breakdown.
o Does not address concerns about accuracy of underlying data.
xiii

4. Modify GMENAC Requirements Estimates
Approach: For each of the specialties considered by GMENAC, identify major parameters that may have changed (such as productivity or new procedures) and calculate implications for requirements.
Method: Suggested adjustments to model parameters could be made by 2 or 3 experts in each specialty who would have to review GMENAC's detailed report. Calculations could be made by COGME staff. It would also be possible to work with a more qualitative method: the experts could be asked to draw a qualitative conclusion about the net change in requirements as a result of the adjustments.
Advantages:
o Builds upon the most comprehensive needs-based model and estimates ever constructed.
o Allows detailed specialty breakdown as well as primary vs. nonprimary care formulation.
Disadvantages:
o Does not address fundamental criticisms of GMENAC approach, such as the lack of a geographic dimension, the sensitivity of the results to a few parameters, and potential panel bias.
o Since most specialties were previousiy projected to be in or near oversupply, adjustments are likely to only make this greater.
s. Use Specialty-to-Population Rations from HMOs or Other Closed Populations
Approach: Compare latest information from HMOs or other closed populations on specialty-to-population ratios with national supply.
Method: Obtain information from closed populations about the numbers of specialists providing care to their population.
Advantages:
o Provides some sense of minimal requirements.
xiv
o Allows detailed specialty breakdown.
Disadvantages:
o May not be representative of U.S. population.
o May not be adequate standard of care.
o May not provide a reliable benchmark because of variability.
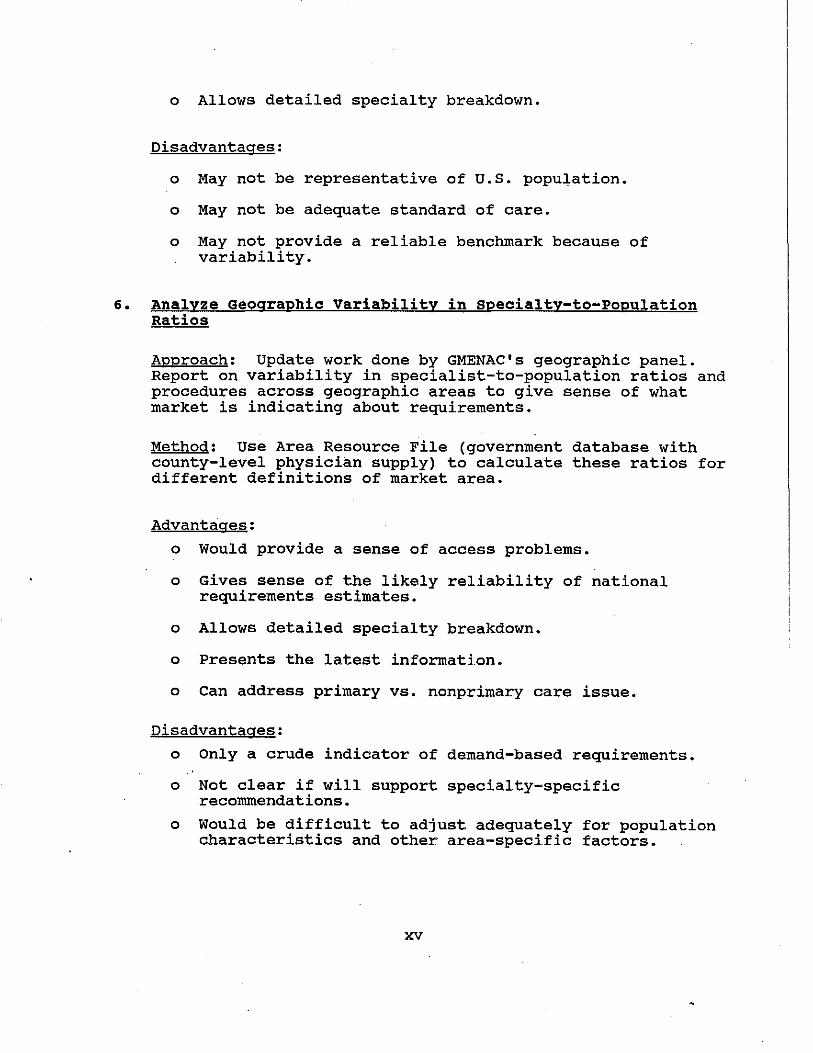
6. Analyze Geographic Variability in Specialty-to-Population Ratios
Approach: Update work done by GMENAC's geographic panel. Report on variability in specialist-to-population ratios and procedures across geographic areas to give sense of what market is indicating about requirements.
Method: Use Area Resource File (government database with county-level physician supply) to calculate these ratios for different definitions of market area.
Advantages:
o Would provide a sense of access problems.
o Gives sense of the likely reliability of national requirements estimates.
o Allows detailed specialty breakdown.
o Presents the latest information.
o Can address primary vs. nonprimary care issue.
Disadvantages:
o Only a crude indicator of demand-based requirements.
o Not clear if will support specialty-specific recommendations.
o Would be difficult to adjust adequately for population characteristics and other area-specific factors.
xv

POLICY QUESTIONS AND IMPLICATIONS FOR MODELING
Finally, Section 6 of the paper discusses implications of
short and long-term options and addresses broader policy issues
of concern to the council. While, in the limited time available,
it would be difficult for COGME to undertake any substantial
modeling, it seems feasible for the Council to engage in more
qualitative analyses and in data manipulation on a more modest
scale. A prudent approach in both the short and long run would
be to rely upon a combination of method and data sources. One
feasible and potentially productive short-run option would be a
systematic, targeted survey of specialty societies and other
experts.
Section 6 also highlights some of the broader issues that
COGME faces. in formulating its research agenda regarding
physician manpower studies.
policy options likely to be
It will be important to consider
considered by the Council and by
Congress. If, for example, the future agenda is likely to consider
questions about whether shortages of primary care physicians
still exist in some regions, it will be important to collect data
on that level (both in terms of geographic and specialty
breakdown).
Finally, the section considers the implications of over- and
undersupplies of physicians. Some have argued that the potential
costs to society of an undersupply of physicians are much greater
than the costs of an oversupply. Given the considerable
uncertainty about whether imbalances actually exist or lie ahead,
it is important to consider the future consequences to society of
the risks associated with alternative physician manpower policies.
xvi

l.l PURPOSE
SECTION l
INTRODUCTION
one important portion of the charge of the council on
Graduate Medical Education (COGME) is to examine "current and
future shortages or excesses of physicians in medical and surgical specialties and subspecialties 11 • To aid in the accomplishment of this task, this paper provides COGME's Subcommittee on Physician
Manpower with:
1) background on recent, ongoing, and planned studies assessing physician specialty imbalances, and
2) an analysis of short-term options for addressing questions concerning this issue.
COGME must produce its first report by July, 1988. However, the Council has been established for a ten-year period, and thus has the time to develop and implement long-term analytical projects. It is important that the first report address, as far as is
possible, immediate policy issues as well as establish a sound basis for the long-term activities of the Council. This paper aims to assist COGME in meeting this short-term goal by providing
background and options with regard to assessing specialty
imbalances.
During the March 1987 plenary meeting of COGME, the
Subcommittee on Physician Manpower heard several reports on various models and studies used to generate estimates of physician
requirements and supply as a means to assessing physician manpower
imbalances. In light of these presentations the Subcommittee recommended that a background paper be commissioned to identify and describe past, current, and planned studies of specialty
imbalances so as to synthesize current knowledge in this area.
The paper was intended to serve as a technical yet operational piece to assist the Council in determining its approach to
1-1

specialty assessments in a timely fashion. As such, the paper
would provide the Council with a starting point in the June
sessions for developing the Council's approach to specialty
assessment for its first report to the secretary of the Department
of Health and Human Services and to Congress.
Two general comments are in order at the outset. First,
there are no simple or obvious answers to the policy questions
that COGME is charged with addressing. In making judgments and
recommendations it will be necessary to synthesize a complex set
of information of varying character and quality. Second, this
paper has a narrow focus, examining only a small piece of the
puzzle. The question here is: in the brief time available for
short-term analyses (i.e., approximately'three months in order
for the Subcommittee to advance its recommendations to the full
Council by this fall), what approach or approaches are likely to
be of most use in assessing specialty imbalances?
1.2 ORGANIZATION OF THE PAPER
Section 2 presents a discussion of some basic conceptual
distinctions and some useful definitions. Section 3 describes
previous attempts to assess imbalances, outlining their methods,
data requirements, results, and limitations. Section 4 summarizes
the status of ongoing and planned activities by other
organizations and addresses the general issue of data adequacy.
Section 5 outlines a number of options available to COGME for the
short-term, while Section 6 considers longer-term options as well
as some fundamental questions which might help COGME determine
the most appropriate option(s) to undertake.
1-2

SECTION 2
DEFINITIONS AND FUNDAMENTAL APPROACHES TO ASSESSING SPECIALTY IMBALANCES
2.1 INTRODUCTION
Before examining previous approaches to assessing specialty
imbalances, it is useful to provide a broad overview on some of
the concepts and distinctions used in this paper. This section
presents a conceptual overview on three dimensions:
1) Defining terminology used in assessing specialty manpower imbalances.
2) Discussing three broadly-defined approaches used in assessing specialty imbalances:
o Needs-based approaches to requirements estimation.
o Demand-based approaches to requirements estimation.
o Market-signals approaches.
3) Noting the importance of considering the geographic distribution of specialists.
Section 2.2 presents a review of terminology which highlights
some important technical aspects of economic terms, especially
the differences between demand and need. The discussion in
section 2.3 makes the point that, although there are numerous
ways to classify approaches, a fundamental distinction can be
drawn among approaches that focus on the need for physicians,
those that focus on the demand for physicians, and those that are
based on market signals, such as physician incomes and the prices
of physician services. Section 2.4 underscores the importance of
addressing the issue of geographic distribution under any approach
to assessing imbalances.
It is important to note that these issues are complex and
require concepts that are somewhat technical at times. It is
also important to emphasize there are many ways in which to
2-1

,classify approaches to physician manpower studies. Three ways
are presented in Section 2.3 for clarity and organizational
purposes. However, there is a good deal of overlap among the several approaches.
2.2 DEFINITIONS
Before discussing the various approaches to assessing
specialty imbalances, it is useful to define some terminology that underlies some important conceptual distinctions. Debate on
this topic often becomes muddled because discussants are not
using the same terms or not defining their terms in the same way. Following general usage among health services researchers, we briefly review the following terms: supply, demand, equilibrium, surplus, shortage, need, requirements, oversupply, undersupply, and imbalance. The first five terms are economic terms that have specific technical meaning to economists. The last five terms are general terms whose meaning is less precise and less well
accepted. We discuss the economic terms first in order to provide a frame of reference.
2.2.1 Basic Economic Terminology
supply - The schedule that reflects the amount that the sellers of a good or service are willing to supply at different price levels.
It is important to note that the supply of physicians differs from the supply of physician services. The supply of physicians refers to the number of physicians in a market area, usually at a
given time. The supply of their services is the amount of service they would be willing to provide at varying price levels. When most analysts mention "physician supply" they explicitly
mean the number of physicians, though they are usually assuming a more or less fixed relationship to the total services available.
2-2

Demand - The schedule that reflects the amount that the buyers of a good or service are willing to buy at different price levels.
Demand and supply are economic concepts that provide the basis
for judging whether markets are in equilibrium or disequilibrium.
Markets are in equilibrium if the amount that buyers are willing
to buy at the prevailing price is equal to the amount that suppliers are willing to supply at that price. Markets that are
in disequilibrium can exhibit either a surplus or a shortage. In a surplus, the quantity supplied exceeds the quantity demanded at
the prevailing price. In a shortage, the .quantity demanded exceeds the quantity supplied at the prevailing price. A disequilibrium can create pressure for prices to change and for
demanders and suppliers to alter the amounts demanded or supplied. With regard to physician markets, the short-term is considered the period in which the number of physicians is more
or less fixed.
In medical manpower markets it is also useful to draw a distinction between a short-term and long-term surplus or shortage.
A market may exhibit a short-term shortage, for example, if demand exceeds supply at the current wage rate. Markets for
nurses frequently appear to exhibit such a short-term shortage: hospitals demand more nurses than are available at the prevailing wage. But whether there is a long-term shortage may be best indicated by the relative salary levels or "rates of return" to
the educational investment for a given profession. Simply
stated, the rate of return expresses the level of earnings accrued over one's lifetime compared to the level of investment spent on education and training. on· the surface, at least, if
salary levels for one profession are higher than those attainable in alternative professions (thus, implying higher rates of
return), then the market appears to be demanding the profession.
That is, there is a long-term shortage. It is this reasoning which forms the theoretical basis for the use of market indicators
2-3

as signals of either shortage or surplus. It is important to note that markets for physicians are affected to an unusual
extent by various subsidies for medical education and medical care consumption, and institutional arrangements such as insurance. In addition, factors other than monetary rates of
return, such as number of hours worked and the kind of work performed, are obviously important factors to consider when
interpreting market signals. As a result, the prevailing relative incomes--relative to other professions or relative among
specialties--are a less-than-perfect indication of relative
societal value.
2.2.2 Health Manpower Planning Terminology
Need - A measure of the amount and types of medical services that should be consumed by a population based on a normative medical judgment of what is appropriate.
Need differs from demand in that it ignores the ability and willingness of consumers to pay for care and it employs a higher
standard of knowledge--that of the medical expert rather than the consumer. Need may exceed demand for those who are poor, for
example. Or demand may exceed need if those with insurance consume care that is inappropriate. What is observed in the market is likely to be closer to demand than to need, since it reflects existing ability and desire to pay. still it may not be
a good indication of what consumers would demand if they had better information or incentives.
Requirements - The number of physicians required to fulfill some predetermined standard as to the amount of care needed or demanded.
This definition underscores the fact that requirements can be based either on needs or demand, or even on a blend of the two.
For example, GMENAC used an "adjusted needs-based" model that
2-4

attempted to adjust physician judgments about medical need for
institutional realities.
A comparison between supply and requirements can be made
that is similar to the economic comparison of supply and demand.
In this paper--to avoid confusion with economic terminology--we
ref er to any difference between supply and requirements as an
imbalance, or as an oversupply or undersupply, depending on the
direction of the imbalance. Obviously, an imbalance between
requirements and supply does not necessarily imply shortage or
surplus in an economic sense.
2,3 CLASSIFYING APPROACHES TO IDENTIFYING SPECIALTY IMBALANCES
The methods that have been used to identify specialty
imbalances could be classified in many ways. Some are more
qualitative, while others are more quantitative. Some use
disease-specific information; others aggregate across diseases.
Finally, some are descriptive, while others are normative. For
purposes of this paper, however, it is useful to categorize as
follows:
1) Comparisons of requirements and supply
a) Needs-based estimates of requirements b) Demand-based estimates of requirements
2) Examination of market signals.
The first broad approach examines quantities: approaches in this
category project the number of physicians available--the
supply--and compare it to the number required. The approaches
differ in how they view requirements. Needs-based approaches
consider how many physicians will be needed while demand-based
approach consider how many the market will demand. The second
broad approach looks at other market signals or indicators, such
as physician incomes and prices, asking whether the market. is
2-5

indicating, through relative income levels, for example, that
more specialists of a given type are desired. A more sophisticated
version of a market signals approach is the construction of
market-level econometric models that attempt to explain the
demand and supply for physicians.
Needs-based and demand-based requirements models have been
the most popular approaches because they are less complex and
because they require less data, though their data requirements
can be substantial. They are less complex in the manner in which
they handle feedback or interaction between the supply and demand
sides of the market. Models using market signals must incorporate
prices and incomes as mediating factors, so that there is a
feedback or loop: other demand and supply factors affect price,
which in turn affects the amount demanded and supplied. Prices
and incomes can be interpreted as indicators of the situation in
the market.
Needs-based and demand-based approaches typically do not model
any direct response of supply to requirements though these two
factors may be related through third factors, such as growth in the
elderly population. Also, factors on the demand/requirements
side, such as new technologies, can affect both the number of new
entrants and the rate of retirement, but these connections
generally are not modeled explicitly. on the other hand, the
market-signals approach examines specialty incomes, incorporates
both demand and supply factors, and, in theory at least, allow
for an immediate feedback or interaction between the two.
2.3.1 Needs-Based Approaches
As noted above, both needs-based and demand-based approaches
generally measure the supply of physicians. in the same way. The
supply side of these models tends to be a more or less
sophisticated form of extrapolation in which the current stock of
2-6

physicians is "aged" to the future, adding new graduates and
subtracting retirees and deaths. Individual estimates will, of course, differ depending on assumptions made about trends and on
the data sources used.
The two approaches differ, however, in the way in which they measure physician requirements. Needs-based models have a normative aspect, asking how much care a population should
receive in order to achieve a desirable state of health. By definition, needs-based models require some element of judgment about the medical "need" of a population and are not based solely
·on current data. An obvious conceptual problem with a needsbased requirements approach is that producing the number of physicians needed would carry no guarantee that they will be employed or distributed appropriately.
2.3.2 Demand-Based Approaches
Broadly speaking, demand-based models use recent data to estimate the interrelationship between current utilization and factors that might affect it. This statistical relationship and
trends in the relationship are the basis for extrapolation to the future. There is little or no consideration
might be the most appropriate level of care. of what, in fact,
A principal problem with a demand-based requirements approach is that extrapolating from existing patterns of demand assumes that the current situation
is an accurate reflection of true consumer demand. This assumption may not be valid in a market with substantial government
involvement. Government involvement may, of course, reflect valid societal concerns about equity. This last point underscores
a second problem with any demand-based approach: existing patterns of demand may not be a good starting point for estimating requirements because demand, even if it has been increased by
government intervention, may not reflect the medical "needs" of
the population.
2-7

It is important to recognize that the distinction between
needs- and demand-based models can become blurred. For example,
GMENAC used an "adjusted" needs-based approach. It did rely on
the expert judgment of physicians to forecast needs in 1990;
however, these experts were instructed not to think in terms of
an ideal world with no barriers to care. Also, a central Modeling
Panel adjusted some of the specialty-specific estimates so as to
better reflect realities concerning, for example, insurance
coverage and the availability of nonphysician providers.
similarly, models using either HMOs or closed populations to
derive requirements standards can be seen as falling between a
pure needs-based and a pure demand-based approach. While
physician-to-population ratios in an HMO would certainly reflect
the demands of the subscribing population, some advocates would
argue that HMOs have more incentive to provide the appropriate
amount of care. Thus, using them as a standard would have some
normative content as well.
In practice, there are other difficulties with both
approaches. These are best illustrated.by reviewing each approach
in detail, as is done in Sections 3.2 and 3.3.
2.3.3 Market-Based signals
Studies which employ market-based signals may be seen as
falling into two categories: studies that examine market signals
such as physician incomes and rates of return to medical training,
and those that attempt to construct market-level econometric
models of the demand for and supply of physicians.
Although economists have been calculating rates of return to
educational investments in medical training.for many decades, it
is not clear how seriously policymakers have taken them as
indicators of imbalance. While they are arguably the best
2-8

indicators of current market demands, they do not reflect an
unfettered market. Instead, it is a marketplace substantially affected by subsidies (through insurance) and regulated
interspecialty pricing patterns (through insurance fee screens).
Policymakers have reason to distrust the signals that the existing market provides. studies which have employed this approach are discussed in Section 3.4.
A major disadvantage of a market-signals approach is the amount of information required. A model that projects future
incomes and supply responses to this information is much more
difficult to estimate, especially for differing specialties and market areas. Because the data necessary for projecting specialty incomes in market areas are not generally available, these
approaches tend to make only current estimates at a more aggregate level (although some models have extrapolated trends in exogenous variables so as to make estimates of the future values of endogenous variables). Models forecasting incomes need to project future quantities as well as prices.
Market-level models sometimes attempt to use econometric tools to examine how the demand for and supply of physicians
responds to selected factors. For example, models have been constructed to address the question of whether the market is responsive to increases in the supply of physicians.
2.4 GEOGRAPHIC DISTRIBUTION
Both the comparison of supply and requirements estimates and the analysis of market-based indicators are assessment methods which are usually applied at a high level of aggregation (e.g.,
national or, in a few instances, states). In considering specialty
manpower studies, it is important to assess the degree to which
studies compare physician-to-population ratios across market areas or across different subsets of the population. The
2-9

discussion has thus far abstracted from the issue of geographic
distribution. Over- and undersupplies or surpluses or shortages
may exist for particular specialties in some local markets and
not others. Discussions at the national level concerning aggregate
imbalances must pay some attention to this distinction. Locational
approaches to assessing specialty imbalances are discussed in
Section 3.5.
2-10

SECTION 3
PREVIOUS APPROACHES TO ASSESSING SPECIALTY IMBALANCES
3.1 INTRODUCTION
sections 3 and 4 of the paper describe recent and ongoing
attempts to assess physician specialty imbalances; Section 3
focuses on previous approaches which studies have undertaken while
Section 4 describes projects currently underway. Section 4 also
includes a subsection on the adequacy of available data. Together,
these sections should provide a good overview of the current
state of the art in assessing specialty imbalances.
In this section we summarize the major alternative approaches
to assessing physician specialty imbalances and briefly discuss
the results and strengths and weaknesses of each approach.
Section 3.2 describes the model constructed by the Bureau of Health
Professions (BHPr) which is the most comprehensive demand-based
model ever developed for estimating requirements. studies which
derive requirements standards from HMOs are also essentially
demand-based models and these are discussed in a subsection of
Section 3.2. Section 3.3 discusses needs-based models as
exemplified by the efforts of the Graduate Medical Education
National Advisory Committee (GMENAC). section 3.4 considers
market-based studies, which are based upon the interaction of
supply and demand. Section 3.5 discusses approaches which
consider variations in physician-to-population ratios across
geographic regions or demographic groups. Table 3-1 summarizes
the main points of the approaches discussed in these sections.
3-1

Previous Approaches
Demand-Based
Needs-Based
Market-Based
Locational
TABLE 3-1 SUMMARY OF HIGHLIGHTS OF PAST APPROACHES
Name of Study
Bureau of Health Professions Model
HMO-based standards . Mason; Scitovsky and McCall
Lee-Jones GMENAC
Sloan; Fein and Weber; Lindsey; Leffler; Glandon and Werner; AMA; Noether; BHPr; Hixson and Mocniak; Hu and Yang; Dresch; Sloan and Schwartz; Frank; Brown and Reid
GMENAC Rand OTA
3-2
Conmen ts
Large data requirements Does not consider optimal
level of health care Can alter model parameters to
derive alternative projections Currently operational Periodically updated Not specialty specific
Data generally available Interpretations subject to
many caveats HMO population not representative
Large data requirements Does not consider demand
for health care Can alter model parameters to
derive alternative projections Specialty specific
Interaction of supply and demand at either individual doctor level or aggregate market level
Sometimes specialty specific
Consideration of doctor-topopulation ratios for subnational areas
Data generally available Interpretation of ratios
subject to many caveats

3.2 DEMAND-BASED REQUIREMENTS/SUPPLY COMPARISONS
3.2.1 Bureau of Health Professions Modeling Efforts
The Bureau of Health Professions (BHPr) has addressed the
question of future health manpower imbalances through its continued
modeling efforts in this area. The two major components of this
effort are a supply model which is able to predict the total
supply of active MDs and DOs up to the year 2010 and a demand
based requirements model which can predict the number of medical
personnel which will be required in any year in the future. The
BHPr then compares projections derived from these two components
in order to determine whether future supply is likely to be
greater or less than the number of medical personnel likely to be
demanded. It is important to note that the two components of the
BHPr modeling effort are essentially independent. One could
compare the BHPr supply projections with requirements estimates
derived from other than the BHPr requirements model and vice
versa. In fact, the two BHPr component models are quite
different in terms of the level of specialty detail which they
provide. As will be seen in the following sections, the BHPr
supply model is capable of projecting future supply by a very
detailed specialty breakdown (e.g., thoracic surgery), while the
BHPr requirements model considers only very aggregated:categories
of physicians (e.g., one category for all surgeons). The two
components are described below.
3.2.1.1 BHPr Physician Supply Model
The BHPr physician supply model is comprised of three
component submodels. The Aggregate Model projects the total
number of active physicians in the U.S. The Specialty Model
distributes the projected total supply according to 37 specialty
categories developed by the American Medical Association (see
Figure 3-1). The Subnational or State Model distributes the
3-3

FIGURE 3-1
THIRTY-SEVEN SPECIALTY CATEGORIES AS MAINTAINED BY THE AMA
General Practice General Practice Family Practice
Medical Specialities Allergy Cardiovascular Diseases Dermatology Gastroenterology Internal Medicine Pediatrics Pediatric Allergy Pediatric Cardiology Pulmonary Diseases
surgical specialties General surgery Neurological Surgery Obstetrics and Gynecology Ophthalmology orthopedic surgery Otolaryngology Plastic surgery Colon and Rectal Surgery Thoracic Surgery Urology
3-4
Other Specialties Aerospace Medicine Anesthesiology Child Psychiatry Diagnostic Radiology Forensic Pathology Neurology Occupational Medicine Psychiatry Pathology Physical Medicine
and Rehabilitation General Preventive
Medicine Public Health Radiology Therapeutic Radiology Other Specialty Unspecified

projected national supply according to expected practice locations.
All three of these submodels use data from the 1981 AMA Physician
Masterfile census of MDs as a starting point and project past
trends into the future.
In essence, the Aggregate Model projects the future supply
of physicians in a given year by adding new graduates and FMGs
for that year to the active supply and then subtracting separations
due to death, retirement, and emigration. The model begins with
1981 as the base year and proceeds in an iterative fashion to
produce supply estimates for each year through 2010. Three
series of projections are developed using alternative assumptions
about the number of first-year enrollees, student attrition
rates, and FMGs. The "basic" projections are considered to be
the most reliable; the high and low series give an upper and
lower bound for the basic estimates. The incoming cohort of
graduates is distributed in~o age groups by using the average age
distribution of graduates (a parameter of the model).
Age and gender-specific mortality and retirement rates derived
from studies of MDs are then used to reduce the active supply of
doctors by the expected number of deaths and retirements. The
resulting calculation represents a projection of the total active
physician supply in the U.S. for a given year in the future.
This aggregate number is classified into six cells based on
gender and country of origin (United states/Canadian Medical
Graduate, United States Foreign Medical Graduate, and Alien
Foreign Medical Graduate) and is then further categorized by
post-graduate year (PGY).
Projections of the supply of physicians by the 37 specialty
categories defined by the AMA are derived only after the total
number of physicians has been projected by gender, country of
medical training, and PGY for each year in the projection period.
Each of the six cells defined by the combinations of gender and
3-5

country of origin is associated with a series of PGY-specific
specialty distributions. These distributions were derived using
AMA data on first-year residencies. For early years of the
model, 1968, 1970-74, and 1976 data on first-year residencies by
specialty were extrapolated to produce specialty distributions up
through 1981. Certain specialties were adjusted for "leakages"
due to specialty switching and subspecialization which occur
after the first year of residency. For years after 1981, the
specialty distributions used for each PGY are those which were
observed in 1981.
The specialty distributions for early PGYs change primarily
due to trends away from the general specialties to the
subspecialties. Distributions begin to stabilize in later PGYs,
reflecting lower rates of specialty switching and subspecialization
as physicians move toward their final specialty of practice. The
stabilization point occurs at various PGYs, depending on specialty,
and all specialties are assumed to reach this point by ~GY 10. No
further specialty redistribution is allowed to occur after the
stabilization PGY has been reached.
In any given year of the projection period, the aggregate
number of physicians in each of the six cells is disaggregated
into the various specialties by applying the PGY-specific specialty
distributions. As a purely hypothetical example, intended only
to illustrate this process, imagine that the Aggregate Model had
projected a supply of 2000 male FMGs for the year 1990. Assume
further that 20 percent of the male FMGs who are in their first
post-graduate year (PGY 1) are expected to select family practice
as their specialty. This percentage might decline to say 15
percent by PGY 2, reflecting the trend toward increased
subspecialization. If 200 of the projected 2000 male FMGs in
1990 are in PGY 1 and another 100 are in PGY 2 then their
contribution to the total supply of family practitioners in 1990
would be 55 doctors (200*0.2 + 100*0.15). Similar calculations
3-6

-across all six cells and all PGYs yield the total projected
supplies of each specialty.
This specialty model is also capable of projecting physician
supply by the 82 specialty categories designated by the AMA.
However, as pointed out by Mr. James Cultice (of the Bureau of
Health Professions) in his presentation at the March 17, 1987
meeting of the Physician Manpower Subcommittee of COGME, these
detailed projections are nothing more than a redistribution of
the 37 specialty projections using the assumption that the 1981
distribution of the 82 categories is applicable to the future.
Thus, this methodology introduces the potential for bias if
younger cohorts of physicians are entering the various
subspecialties at different rates than did their older
predecessors.
The projected total supply of MDs can also be distributed
among the states in much the same way it. is distributed among
specialties. As above, the methodology employed assumes that
past trends will continue into the future. It allows state
distributions to vary during the first ten PGYs, with earlier PGYs
reflecting greater changes as physicians undertake residency
training and then move on to a practice location. The
distributions stabilize in later PGYs as doctors become established
in their chosen practice location. This methodology is capable of
producing estimates of state supply by major specialty group only
(i.e., primary care, other medical specialties, surgical
specialties, and other specialties) and cannot make detailed
specialty projections by state.
In sum, the BHPr supply model is a sophisticated extrapolation
of past trends into the future. There is no explicit modeling of
the influence of demand factors on the projections of physician
supply as would be the case in an integrated econometric model of
the market for physicians services. Instead, this feedback is
3-7

more implicit in that the past trends upon which the supply
projections are based already incorporate the influence of demand
factors. However, if the market is changing then an extrapolation
such as this will not capture these changes.
3.2.1.2 BHPr Physician Requirements Model
The BHPr methodology used to predict requirements for health
manpower assumes that recent and current patterns of health· care
utilization and health manpower employment and productivity will
continue into the future. Under this approach "requirements" is
defined as the number of personnel likely to be· necessary in the
future in order to provide the current pattern of health services.
The model is demand-based in that utilization .is used as a proxy
for demand and no attempt is made to define appropriate (or needed)
standards of care. Although this section discusses the model in
detail, it is important to note at the outset the model's present
inability to predict physician requirements on a detailed specialty
level.
Structure
The first major component of this model is a utilization
matrix. Forty population groups are defined based on family
income, age, and gender and twenty health care categories are
defined using various combinations of delivery setting (e.g.,
medical office) and form of care (e.g., psychiatric care). These
categories are displayed in Figure 3-2. Base-year per capita
utilization rates are specified for each care category and for
each population category (800 rates or cells in all). Note that
these utilization rates reflect the utilization of a particular
populaton category for a particular form of care rather than
their utilization of a particular type of doctor.·
3-8

Typically, these utilization rates have been actual rates,
based on past experience and estimated using primarily the Health
Interview Survey (HIS) and National Hospital Discharge survey data sets. However, the utilization rates are specified as
inputs to the model. As such, alternative assumptions regarding utilization can be employed and the BHPr model can provide alternative estimates of health manpower requirements. For example, one might hypothesize that the increased prevalence of AIDS will translate into higher utilization rates (for some forms
of care and/or population groups) in the future. Use of these updated rates wili yield requirements predictions which differ
from those based on historical utilization rates.
Given the per capita utilization rates (BOO cells) as inputs to the model, the next step is to project the growth of the population and its redistribution among the forty .population cells. Projections by the U.S. Census Bureau have shown a
population which is growing relatively older, with higher family incomes. For a given form of care, the baseline per capita utilization rates for each population category are combined with the projected population levels in each cell to derive the projected utilization level for that cell. Summing across all
forty population categories yields the total utilization for the
particular form of care which is predicted to be forthcoming due
to demographic factors alone. Utilization growth rates are derived for each form of care by dividing total predicted utilization by the actual baseline utilization.
To reflect the fact that utilization can also be affected by factors other than population, a utilization trend analysis is
employed in the BHPr model of requirements. In essence, this
analysis disaggregates past trends in utilization into the portion attributable to changes in the out-of-pocket price and
the portion attributable to nonprice factors, such as technological
3-9
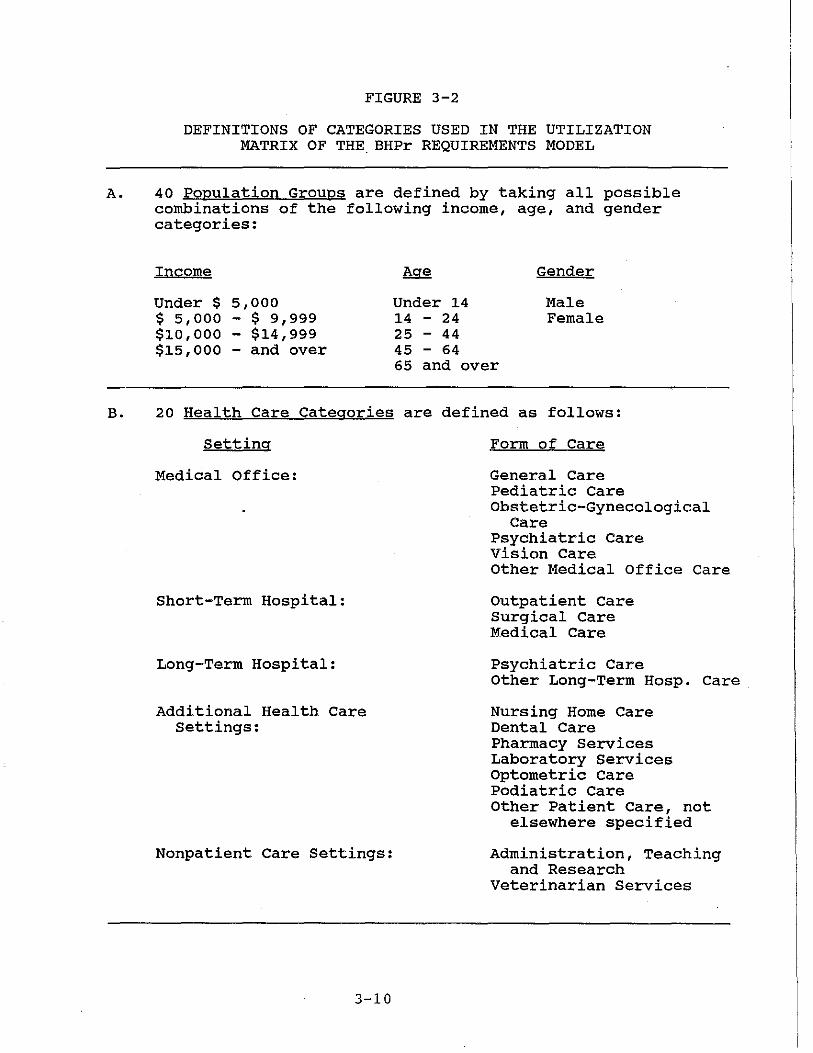
FIGURE 3-2
DEFINITIONS OF CATEGORIES USED IN THE UTILIZATION MATRIX OF THE. BHPr REQUIREMENTS MODEL
A. 40 Population Groups are defined by taking all possible combinations of the following income, age, and gender categories:
Income
Under $ 5,000 $ 5,000 - $ 9,999 $10,000 - $14,999 $15,000 - and over
Under 14 14 - 24 25 - 44 45 - 64 65 and over
Gender
Male Female
B. 20 Health Care Categories are defined as follows:
Setting
Medical Office:
Short-Term Hospital:
Long-Term Hospital:
Additional Health Care settings:
Nonpatient Care Settings:
3-10
Form of Care
General Care Pediatric care Obstetric-Gynecological
Care Psychiatric Care Vision Care Other Medical Off ice Care
outpatient care Surgical Care Medical Care
Psychiatric Care Other Long-Term Hosp. Care
Nursing Home Care Dental Care Pharmacy Services Laboratory services Optometric care Pediatric care Other Patient Care, not
elsewhere specified
Administration, Teaching and Research
Veterinarian Services
change or shifts in consumer preference. Utilization growth
factors related to price and nonprice components are developed
and used to adjust the utilization growth rates derived earlier
based on the analysis of demographic changes only.
The second major component of the BHPr requirements model is
a health personnel matrix which distributes members of twenty
eight different health personnel categories (see Figure 3-3)
according to the proportion engaged in providing each of the
twenty forms of health care designated in the utilization matrix.
For each form of care, the utilization growth rate derived from
the analysis of demographic changes and adjusted for price and
nonprice influences is applied uniformly to all personnel types
providing that care. For example, if the utilization of
psychiatric care in the office setting were projected to increase
by 25 percent then the requirements for each category of health
personnel currently providing that care would be 25 percent
greater than the current number of providers.
Future requirements for each of the twenty-eight types of
health personnel are then derived by summing the changes in
requirements needed to accommodate the changed utilization for
each category of care in which the provider is involved. Thus,
to continue the example begun above, since psychiatrists are
involved in the provision of psychiatric care in both the medical
office and long-term hospital setting (two categories of care),
the future requirements for psychiatrists will be the sum of the
number needed to provide the predicted utilization level for each
form of care.
The BHPr requirements model also contains a number of
"contingency" submodels designed to explore occurrences for which
trend data are not available. In addition to models predicting
the likely impact of National Health Insurance and task delegation
(e.g., the use of physician extenders, etc.), there is a submodel
3-11

•..
FIGURE 3-3
DEFINITIONS FOR HEALTH PERSONNEL CATEGORIES USED IN THE PERSONNEL MATRIX OF THE BHPr REQUIREMENTS MODEL
Estimated Supply in 1975
Physicians (MO}:
General 1
Pediatric Ob/Gyn Ophthalmology Psychiatry Slirgery2 Secondary Specialist3 Noncare Specialist4
Physicians (DO) Dentists optometrists Podiatrists Pharmacists Veterinarians Registered Nurses Physician Extenders
Allied Health Personnel:
Administrative Personnel Medical Library Personnel Medical Records Personnel Clinical Laboratory Personnel Dietary Services Personnel Radioloqic Services Personnel Therapy Personnel, not elsewhere
specified General Medical Personnels Nursing care Personnel (other than
RNs) Vision Care Personnel (other than
ophthalmoloqists and optometrists) Pharmacy Assistants and Aides Dental Hygienists, Assistants, and
Technicians
116,430 21,746 21,731 11,129 26,502 76,017 48,322 18 ,403
14,532 114,999
20,101 7,300
122,500 31,060
961,000 7,854
682,098 10,701 64,001
182,000 75,001
105,001
165,499 86,527
1,468,999
35,000 100,333
175,801
11ncludes general and family practice, internal medicine, and "specialty unspecified" (presumed to provide predominantly primary care) •
21ncludes general surgery, neuroloc;ical •urgery, orthopedic surgery, otolaryngology, plastic surgery, colon and rectal surgery, thoracic surgery, uroloqy, and anesthesiology.
3Includes allergy, cardiovascular diseases, dermatology, gastroenterology, pediatric allergy, pediatric cardiology, pulmonary diseases, radiology, diagnostic radiology, therapeutic radiology, neurology, physical medicine and rehabilitation, and 11 other specialties".
4Includes occupational medicine, general preventive medicine, public health, aerospace medicine, pathology, and forensic pathology.
5xncludes ambulance attendants, biomedical engineers and technicians, health educators, EKG and EEG technicians, orthotists, proatheti•ta, and surgical aide•o
3-12

which incorporates the influence of HMOs into predictions of
requirements. It is assumed that at least 6 percent of the U.S.
population will be enrolled in an HMO by 1990. The HMO population
is treated as separate from the U.S. population; HMO members are
assigned their own (usually lower) utilization rates and their
own personnel matrix (the categories of which reflect the sometimes
unique personnel requirements of HMOs). There is no price
adjustment in the HMO submodel since price does not generally
influence demand in the capitated setting. Otherwise, the
calculations for projections of personnel requirements for the
HMO population are analogous to those for the general population.
National requirements are the sum of the general and HMO
requirements.
3.2.l.3 BHPr Results and Limitations
In Table 3-2 the projections of the. BHPr supply and
requirements models are presented. The table indicates that an
oversupply is predicted for both 1990 and 2000. The numbers
given in the 1982 Report to the President and Congress on the
status of Health Personnel in the United States showed a predicted
oversupply of 21,000 physicians in 1990; this was predicted to
increase to 32,500 by the year 2000. Subsequent revisions to the
1982 estimates show oversupplies of ever increasing magnitudes
due to the continued downward revisions to predicted requirements.
The supply projections have not changed to an appreciable extent
over time.
The BHPr and its external contractors have conducted sev~ral
studies in the past to expand and update particular components of
the requirements model. For example, an attempt was made to
refine the utilization matrix by using categories based on health
status and race/ethnic origin in addition to the original age,
3-13

w I ..... ..,.
TABLE 3-2 COMPARISON OF BHPr SUPPLY AND REQUIREMENTS PROJECTIONS, 1990 ANO 2000
1990 2000
SUQE!:ly Reaui rements Oversuooly ~ Regui rements Oversupply 1982 Report-Basic Series
Low Series 591,200 570,200 High Series 589,000
609,200 1984 Report-Basic Series
Low Series 594,600 559,300 High Series 592,600
608,200
1986 Report-Basic Series Low Series 587,680 541,000 High Series 583,000
593, 700
Table includes all professionally active physicians CMDs and DOs).
21,000
35,300
46,680
704,700 693,500 754,300
706,500 695,800 749,900
696,550 674,800 722,380
672,200
654,700
618,800
The BHPr Supply Model provides three series of estimates based on alternative aSSUTf>tions about support to medical education, medical school enrollments, student attrition, and entry of FMGs. The Basic Series is regarded as being the most realistic while the Low and High series provide lower and upper bounds to the supply projections regarde
Source: The figures reported here were gathered from the 1982, 1984, and 1986 reports of the Bureau of Health Professions on the status of health personnel in the United States.
32,500
51,800
77, 750

gender, and income categories. This expanded the number of
population categories from 40 to 320. Estimates of utilization
rates for these population groups were obtained from 1978 HIS
data. However, the researchers involved in this effort noted
that these data were often inadequate for a reliable estimation of
utilization rates for population groups defined at this level of
detail. In addition to this attempt at refining the utilization
matrix, the personnel matrix has been updated several times: once
from the original 1970 base year to 1975 and, more recently, from
1975 to a 1980 base year. These periodic revisions help to
ensure that the BHPr requirements model produces relatively up
to-date estimates, given the model as it is structured.
Several other refinements to the BHPr models are either
underway or envisioned by BHPr staff. On the supply side, recent
efforts have attempted to make specialty projections more realistic
by considering recent trends in residency and early practice
choices. It is anticipated that efforts in this area will
continue and that additional attention will be paid to mid-
career specialty switches, specification of retirement and
mortality rates, and the FMG contribution to overall physician
supply.
On the requirements side, in addition to the studies outlined
above updating the utilization and personnel matrices, there has
also been some work attempting to account for the continued
growth in utilization by the elderly population.
Significantly, for the work of COGME, there has been no
effort to date to modify the model so as to produce requirements
estimates by either detailed specialty or by the primary/nonprimary
care distinction. BHPr staff believe that such an effort is
feasible but stress that it would require at least one year of
very intensive work and may be fraught with difficult conceptual
problems. For example, the development of a personnel matrix
3-15

with more specialty detail is difficult due to the fact that
different specialties are often close substitutes for one another in the provision of certain services.
specialties are not designated with a
In addition, physician
high degree of accuracy in HIS data, making the determination of utilization rates by specialty a difficult task. Before having BHPr undertake intensive
efforts in this direction, COGME must determine the level of
specialty detail which is necessary as a basis for its policy recommendations. In any event, it will be impossible to obtain
projections on detailed specialty imbalances from the BHPr before the deadline for COGME's first report to the Secretary of HHS and
to Congress.
It may be possible to use the BHPr models as they are currently structured to derive some very rough projections of imbalances for the primary/nonprimary care distinction. This
approach will be imperfect, however, due to the facts that: 1) the requirements and supply models make their projections at different levels of specialty disaggregation and ,2) requirements for some categories of physicians which one might wish to consider as primary care cannot be broken out of estimates for the broader groupings used in that model. Still, one might wish to consider
alternative definitions of primary care physicians and match
requirements estimates against supply projections. For example, the requirements model produces estimates for the MD categories of general, pediatric, obstetrics-gynecology, and surgery. The
"general" category is comprised mostly of primary care physicians. Health planners sometimes include pediatricians in the definition of primary care doctors. The pediatrician category of the BHPr
-requirements model excludes pediatric cardiologists and pediatric
allergists and, thus, is likely to be comprised mainly of primary care pediatricians. Obstetrician/gynecologists have been included
in past definitions of primary care and they could be included
here as well since they are treated as a separate model. The same is not true of general surgeons.
3-16
category in the
Although these

doctors are sometimes considered to be primary care doctors it will not be possible to do so with the BHPr model since they are aggregated into the broader category containing all surgeons.
The requirements projections derived for these alternative definitions of primary care physicians can be matched against the
BHPr supply projections by aggregating the supply estimates of the component specialties up to the level used in the requirements model. Separate supply estimates are available for general practitioners, family practitioners, internists, pediatricians, obstetrican/gynecologists and general surgeons. One problem with
this comparison is that the broad category of internal medicine contains many subspecialties which one may or may not wish to categorize as primary care. Since these cannot be disaggregated in the requirements model o.ne would have to be content to either
include or exclude all internists in the primary care definition.
In general, the major weakness of a demand-based approach is that there is no consideration of medical need; current utilization/demand patterns are implicitly assumed to be the ones
whi9h should exist in the future. For the BHPr modeling efforts in particular the inability to predict physician requirements on a detailed specialty level is the major (and insurmountable, in
the short term) weakness of this approach if COGME wishes to assess imbalances at this level of detail. As just discussed the comparison of requirements and supply at even the primary care
level of distinction may also be problematic.
On the positive_ side, the demand-based approach is empirical
and it is feasible to alter certain model parameters in order to simulate their expected effect on manpower requirements. The
discussion above emphasizes that the BHPr is continually updating both the supply and requirements models in an attempt to keep their
parameters consistent with reality. This and the fact that the models are currently operational suggest that COGME may wish to:
3-17

1) consider the existing model's latest predictions concerning
imbalances or 2) alter selected model parameters to derive
alternative predictions.
3.2.2 HMO-Based studies of Estimation of Requirements
Another approach to developing physician requirements is to
use as a standard the observed ratio from an HMO or some other
closed population (e.g., in a relatively self-contained geographic
service area) • Such an approach is essentially a demand-based
approach in that it examines the staffing requirements necessary
to provide all care demanded by the population enrolled in the
closed health care system. Several researchers have attempted to
develop requirements standards by calculating the ratio of
physicians or specialists per HMO enrollee (Mason, 1972; Scitovsky
and McCall, 1976; Ste~nwachs et al., 1986; Tarlov, 1986).
Tarlov and Steinwachs et al. have used HMO-derived standards
to adjust the GMENAC predictions for the growth in HMOs which
occurred after completion of that report. Mason compared
specialty-to-population ratios across six HMOs, while Scitovsky
and McCall attempted to extrapolate from HMO experiences to
develop new requirements estimates for the entire U.S. population.
Requirements estimates based on these standards are then compared
with actual or predicted supply to determine or project health
manpower imbalances. Table 3-3 which presents the requirements
ratios found by three of these studies shows that there is
disagreement as to the number of people that one physician can
optimally serve.
3-18

TABLE 3-3
COMPARISON OF OPTIMAL PHYSICIAN-TO-POPULATION RATIOS DERIVED FROM STUDIES USING THE HMO STANDARDS APPROACH
Mason - 1972 1:978 - 1:1,118
Scitovsky & McCall - 1976 1:676
Tarlov - 1986 1:833
The primary advantage of the HMO approach is that the
requisite data (the number of enrollees and the number of
physicians on staff) are readily available. However, the
interpretation of these staffing ratios is subject to many
caveats, including:
o HMO enrollees may not be representative of the general population
o HMO enrollees may seek care outside of the HMO setting
o HMOs vary greatly with regard to the services they provide
o HMOs use different combinations of specialists to provide the same package of services.
studies of HMOs generally reveal staffing ratios of many
fewer physicians per 100,000 population than occurs in the
general population. This may be due in part to the fact that
HMOs are not as self-contained as health care delivery systems as
one might think. For example, enrollees may call upon doctors
from outside of the HMO for services which are not covered by
their plan, implying that HMO staffing patterns may understate
true requirements.
Additionally, physician-to-population ratios may not be
3-19
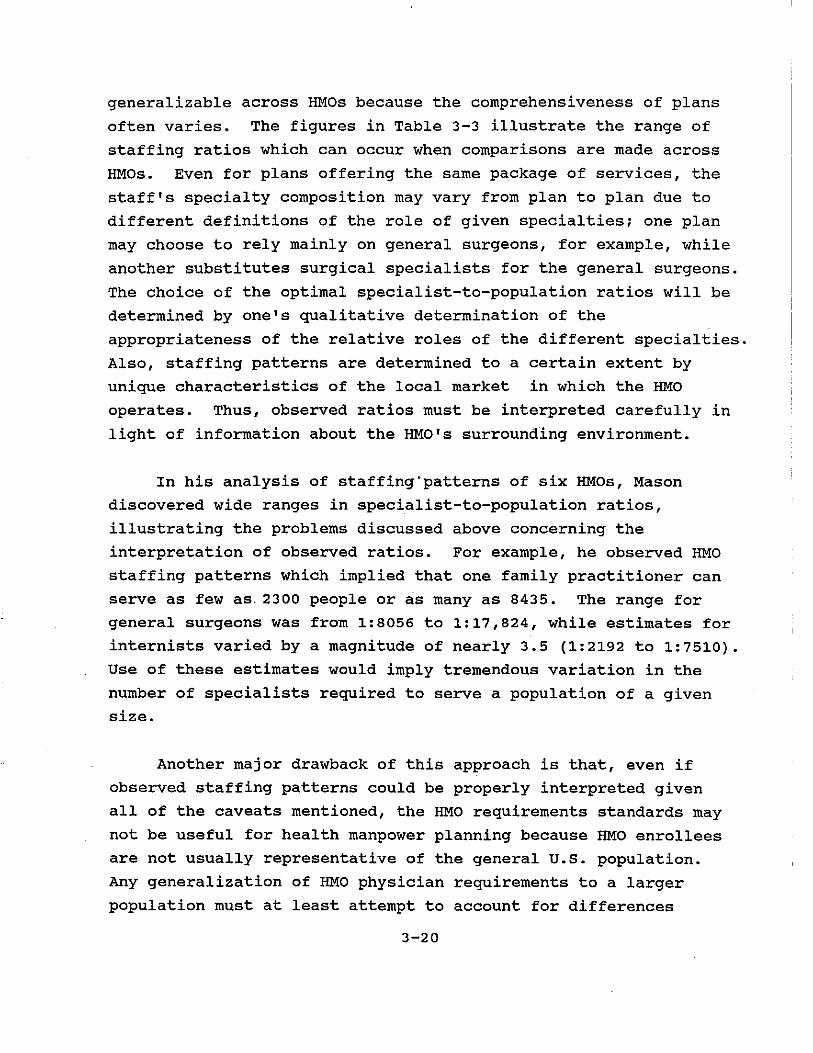
generalizable across HMOs because the comprehensiveness of plans
often varies. The figures in Table 3-3 illustrate the range of
staffing ratios which can occur when comparisons are made across
HMOs. Even for plans offering the same package of services, the
staff's specialty composition may vary from plan to plan due to
different definitions of the role of given specialties; one plan
may choose to rely mainly on general surgeons, for example, while
another substitutes surgical specialists for the general surgeons.
The choice of the optimal specialist-to-population ratios will be
determined by one's qualitative determination of the
appropriateness of the relative roles of the different specialties.
Also, staffing patterns are determined to a certain extent by
unique characteristics of the local market in which the HMO
operates. Thus, observed ratios must be interpreted carefully in
light of information about the HMO's surrounding environment.
In his analysis of staffing'patterns of six HMOs, Mason
discovered wide ranges in specialist-to-population ratios,
illustrating the problems discussed above concerning the
interpretation of observed ratios. For example, he observed HMO
staffing patterns which implied that one family practitioner can
serve as few as. 2300 people or as many as 8435. The range for
general surgeons was from 1:8056 to 1:17,824, while estimates for
internists varied by a magnitude of nearly 3.5 (1:2192 to 1:7510).
Use of these estimates would imply tremendous variation in the
number of specialists required to serve a population of a given
size.
Another major drawback of this approach is that, even if
observed staffing patterns could be properly interpreted given
all of the caveats mentioned, the HMO requirements standards may
not be useful for health manpower planning because HMO enrollees
are not usually representative of the general U.S. population.
Any generalization of HMO physician requirements to a larger
population must at least attempt to account for differences
3-20

between the two populations which might influence the utilization
of health services and, therefore, requirements.
In addition, to the extent that many of these studies using
this methodology have dealt mainly with the aggregate number of
physicians or the primary care specialties, they are somewhat
limited in their ability to help COGME address the issue of
detailed specialty imbalances.
These studies might, however, help COGME in addressing
whether or not there are imbalances at the primary and nonprimary
care level. steinwachs et al., for example, compared staffing
patterns in primary care specialties in these HMOs. The study
compared GMENAC projections with norms of care based on actual
practice in the HMOs in order to estimate physician requirements
in general pediatrics, general internal medicine, and family
practice. The study found that although there were a variety of
staffing patterns among the different plans, HMOs required fe~er
primary care physicians for both children and adults. This kind
of study could help the Council address both the appropriate
number of primary and nonprimary care physicians and existing
variations among different health care delivery systems and
across different geographic regions.
3.3 NEEDS-BASED REQUIREMENTS/SUPPLY COMPARISONS
3.3.1 overview
Needs-based approaches to estimating physician requirements
for comparison with supply have a long history, going back to the
classic Lee-Jones study (1933). A needs-based approach to
estimating requirements for physician specialties attempts to
answer the following question for some time in the future: for a
specific condition how much and what types of specialist care
should be used to provide the medically appropriate level of
3-21

care? In accordance with the definitions of need and demand
presented above, analysts have emphasized the conceptual
distinction that the needs-based models are normative--concerned
with what should be--and that the demand-based models are
descriptive or "positive"--concerned with what is or will be.
In practice, two other important features distinguish the
two approaches. First, needs-based approaches tend to focus on
diseases, relying upon epidemiological data and medical treatment
patterns, and specifying diseases and treatments in great detail.
In contrast, demand-based approaches typically focus on gross.
categories of care such as inpatient utilization, surgical
operations, and outpatient visits. Second, needs-based approaches
tend to rely to a much greater extent on professional judgment in
making estimates of parameters than do demand-based approaches,
which have typically used statistical relationships and trends
from empirical data. There is clearly a potential middle ground
between these two approaches. Demand-based approaches could be
disaggregated to a greater extent by disease and could
incorporate professional judgment, especially using consensus
techniques for the extrapolation of some trends. As yet, no one
has attempted to work in this complicated middle ground.
3.3.2 GMENAC•s Framework
The requirements/supply comparison of the Graduate Medical
Education National Advisory Committee {GMENAC) is the most recent
and the most comprehensive effort ever to take a needs-based
approach to measuring requirements/supply imbalances. Both the
supply and requirements sides of the model and the estimation
techniques have been described in detail elsewhere {McNutt, 1980;
JWK International, 1980; GMENAC Summary Report, 1980a) and will not
be repeated here. In essence, the supply side is a complex,
specialty-specific extrapolation model. The growth of each of
3-22
some 40 specialties was forecasted based upon the current supply,
expected additions, and expected losses due to retirement and
deaths.
GMENAC's approach to needs-based modeling was called
"adjusted" needs-based modeling for several reasons. First,
because the estimates were based on data from existing utilization
patterns, they reflected to an unknown extent existing constraints
and institutional realities. Second, the participating physicians
were instructed not to operate in the ideal world of providing all
efficacious care to all of those in need. In fact, the GMENAC
panels were generally asked the normative question of how much
specialty care "should" be provided for a given condition in
1990. To the extent their answers reflected what they thought was
likely to happen and societal constraints on the provision of
care, the estimates begin to approximate a demand-based approach.
In this case, the difference between GMENAC and the BHPr
requirements model becomes more a matter of estimation technique,
with the former relying more heavily upon consensus and
professional judgment. Third, GMENAC had a central Modeling
Panel that adjusted some of the estimates to better reflect
realities concerning, for example, insurance coverage and the
availability of nonphysician providers.
A simple example illustrates the essence of the requirements
side of the GMENAC model. Consider one of the 56 conditions
considered by the Delphi panel used for neurologists (Garrison,
Bowman, and Perrin, 1984). The neurology Delphi panel projected
that 250 persons per 100,000 population would have new cases of
migraine in 1990. They recommended that 100 percent of these
cases should see a physician and that 75% should see a neurologist.
In addition to an initial 50-minute visit to the neurologist, it
was estimated that they would average 4 additional visits with a
mean duration of 20 minutes. From this information it is possible
to calculate the amount of neurologist time needed to treat these
3-23

new cases in 1990. And gi~en the panel's estimates of the average
neurologist work year, the number of full-time equivalent
neurologists required could be calculated. The neurology panel
made these types of estimates for each of 56 disease conditions,
for both new and old cases separately.
The GMENAC requirements would require the estimation of
thousands of parameters. The new cases for migraine, for example,
required the estimation of six parameters by the panelists. If
the other specialty panels considered on the order of 30 conditions
directly, then they would be estimating 180 parameters, not to
mention the other parameters estimated for productivity, hours
worked, teaching, etc. Applied to 40 specialties, this means
that over 7200 parameters would be estimated; and this is only if
the top 30 conditions are considered. For surgical and other
specialties seeing many more conditions, adjustments to.the model
had to be made and sometimes many more parameters than this were
estimated.
If one reads the specialty-specific requirements reports of
GMENAC carefully, it can be seen that although GMENAC's generic
model provided a framework, each specialty Delphi Panel custom
tailored the model to fit the special conditions as well as the
quality of the available data. For example, the surgical
specialties did not make their estimates directly on a condition
basis. Instead, they worked with surgical procedure rates per
100,000 population and projected those to 1990. This is obviously
a modification to the needs-based framework that was necessitated
by the lack of background information linking surgical treatments
to disease conditions.
3.3.3 criticisms and Limitations of GMENAC
Although the ambitiousness and importance of the GMENAC
effort is widely recognized, there have also been many criticisms
3-24

of the process and estimates (see, for example, American College
of Surgeons, 1980; Reinhardt, 1981; Bowman and Walsh, 1982;
Harris, 1986). Critics have argued, for example, that considerable
uncertainty exists in these estimates (Reinhardt, 1981; Harris,
1986). GMENAC itself recognized this in its recommendation that
the process be institutionalized and carried out on an ongoing
basis. This was not done, perhaps, because GMENAC was an expensive
and labor-intensive effort. This could be one of the analytic
issues facing COGME in the long run: is there enough confidence
in the structure and reliability of estimates of a GMENAC-type
approach to institutionalize it?
It has been pointed out that uncertainty exists on both the
supply and demand sides of the equation. Reinhardt (1981) noted
that while it may seem relatively easy to project the future
supply of physicians with some accuracy, past efforts indicate
that this is not necessarily the case. It has proven difficult
to project physician immigration, physician decisions on
retirement, and their choice of professional activity.
Others have noted the difficulty of predicting future
requirements.
example, about
public health.
There is always considerable uncertainty, for
technological change and the desired level of
Harris (1986) pointed out that the GMENAC panels
could not foresee such changes as the increase in cesarean
sections, the rise in liver transplants, and cardiologists• use
of streptokinase to dissolve blood clots. While each individual
change in technology might have a small impact on the aggregate
requirement for physician services, the combined effect of
hundreds of changes could be substantial. Harris and others have
also noted that when GMENAC issued its report in 1980, the
existence of AIDS had not been reported. This will obviously
change existing physician requirements predictions (although the
extent of its impact on physician versus nonphysician requirements
could be much debated).
3-25

extent of its impact on physician versus nonphysician requirements
could be much debated).
As mentioned above, the major weakness of a pure needs-based
approach to requirements estimation is that even if the system
could somehow be influenced to produce the optimal number of
physicians, as defined by need, there is no guarantee that this
would coincide with the number actually demanded. Also, they
would not necessarily practice in the desired patterns or in the
appropriate locations, as a number of critics have emphasized in
the past.
The American College of Surgeons (1981) noted, for example,
that it was unreasonable for GMENAC panels to assume that there
will be greatly reduced financial barriers to care in 1990.
Reinhardt (1981) further pointed out that the future political
and economic climate will influence whether an individual's
perception of need for medical intervention actually translates
itself into effective demand. He notes that "it is always
effective demand, and not perceived need, that interacts with the
effective supply to determine the actual utilization of health
services and of health manpower."
There have been a number of other criticisms of GMENAC as
well. The American College of Surgeons (ACS, 1981) criticized
GMENAC for a number of perceived methodological flaws:
1) unrealistic assumptions, 2) unrepresentative panelists, and
3) ex-post manipulations of the estimates. ACS also noted that the
panels had few members and could easily be dominated by a single
member with strong views. ACS also pointed out that there were
little data on the supply and use of nonphysician providers. An
additional criticism was that there was little information about
the geographic distribution of physicians.
' 3-26

3.3.4 GMENAC•s Results and Subsequent Modifications
The final results for 1990 of the GMENAC effort are shown in
Table 3-4. In total there is projected to be an oversupply of
63,000 physicians or about 12 percent of requirements. The 40
specialties are sorted on the basis of the relative shortfall of
physicians. Recognizing the uncertainty in the estimates, GMENAC
used the rule of thumb that any difference of greater than 20
percent was significant.. The 17 special ties at the top of the
chart are considered to be in oversupply in 1990. There are 12
specialties that are considered to be in near balance. For only
9 specialti~s is there considered to be a significant undersupply.
It should be noted that if one applies the 20 percent criterion
at the aggregate level, for 1990, GMENAC does not forecast a
significant oversupply in physicians.
It is not clear how well either the individual Delphi panels
or the central Modeling Panel were able to make adjustments for
institutional realities and constraints or to predict new
developments. Since the final GMENAC estimates were produced, a
number of researchers have attempted to examine and adjust the
results in light of new developments observed in the 1980s. Most
notably, the chairman of GMENAC, Alvin R. Tarlov, has suggested
that the numbers be adjusted for
health maintenance organizations
overall physician-to-population
the increased participation in
(Tarlov, 1986). GMENAC's
ratio for
estimated to be 194 per 1·00, 000 in 1990.
requirements was
He notes that it is
conceivable that as many as 120 million of the projected 270
million Americans in the year 2000 could participate in prepaid
group.practices (HMOs). Assuming a staffing pattern in prepaid
group practices of 120 physicians per 100,000 subscribers, this
would imply a requirement of 144,000 physicians in 2000. With
supply projected at 629,000, this would imply that the physician
population ratio for those not in prepaid group practices would
be 323 per 100,000, substantially above the 194 per 100,000
3-27

TABLE 3·4 SUMMARY OF GMENAC SPECIALTY RESULTS
Total Percent Residents/ Total Oversupply/ Oversupply/
Physicians Fellows Supply Requirements Undersupp l y Undersuppl y
All physicians 504, 750 88,500 535, 750 473,000 62, 750 13
OVERSUPPLY ----------Pulmonary diseases 6,600 1,050 6,950 3,600 3,350 93 cardiology 14,250 1,900 14,900 7,750 7, 150 92
Neurosurgery 4,850 700 5, 100 2,650 2,450 92
Endocrinology 3,700 500 3,850 2,050 1,800 88 Rheumatology 2,850 500 3,000 1,700 1,300 76 Nephrology 4,600 700 4,850 2,750 2,100 76 General surgery 32, 100 9,200 35,300 23,500 11,800 50 Allergy and inmunology 3,000 150 3,050 2,050 1,000 49 Obstetrics-gynecology 32,300 6,200 34,450 24,000 10,450 44 Infectious diseases 3,050 500 3,250 2,250 1,000 44 Plastic surgery 3,700 600 3,900 2,700 1,200 44 Thoracic surgery 2,700 450 2,900 2,050 850 41 Ophthalmology 15,400 2,600 16,300 11,600 4,700 41 Radiology·-Diagnostic 24,400 3,500 25,650 19,200 6,450 34 Orthopedic surgery 19,000 3, 150 20, 100 15,100 5,000 33 General pediatrics 35,300 7,050 37, 750 30,250 7,500 25 Urology 8,800 1,600 9,350 • 7, 700 1,650 21
IN BALANCE ----------Gastroenterology 6,550 1,000 6,900 6,500 400 6 Pathology 16,000 2,450 16,850 15,900 950 6 Dermatology 7, 150 700 7,350 6,950 400 6 Otolaryngology 8,000 1,400 8,500 8,000 500 6 Osteopathic general practice . 23,050 2,300 23,850 22, 750 1, 150 5 General internal medicine 66,500 20,800 73,800 70,250 3,550 5 General-family practice 61,750 7,600 64,400 61,300 3; 100 5 Neurology 8,300 950 8,650 8,350 300 4 Emergency medicine 8,900 1,000 9,250 135,000 ·4,250 ·3 Hematology-oncology 7,850 1,300 8,300 9,000 ·700 ·8 Anesthesiology 18, 750 2,050 19,450 22, 150 -2,700 · 12 Pediatric card_iology 850 400 1,000 1, 150 -150 · 13
UNDERSUPPLY -----------Radiology-Therapeutic 2,050 300 2,150 2,500 ·350 ·14 Psychiatry (general) 29,250 3,550 30,500 38,500 ·8,000 ·21 Preventive medicine 5,550 NA 5,550 7,300 -1,750 ·24 Physical medicine and rehabili 2,350 150 2,400 4,050 · 1,650 ·41 Pediatric nephrology 200 NA 200 350 ·150 -43 Neonatology 700 NA 700 1,300 ·600 ·46 Child psychiatry 4,050 200 4, 100 9,000 ·4,900 ·54 Pediatric hematology-oncology 500 200 550 1,650 -1, 100 ·67 Pediatric endocrinology 250 NA 250 800 ·550 ·69 Pediatric allergy 750 450 900 900 NA NA Nuclear medicine NA NA NA 4,300 NA NA All other and unspecified 9,200 1,450 9, 700 NA NA NA
Source: Bowman et al., C1983)
3-28

needed. Thus, the lower physician requirements for HMOs and the
rise in the proportion of the population enrolled may have
exacerbated the projected trend toward an oversupply of physicians.
Steinwachs et al. (1986) compared data from three HMOs with
the physician-to-population ratio of GMENAC. They found that HMOs
needed only half as many general internists as family physicians
and two-thirds as many as pediatricians. When projected to the
nation, this suggests that 20 percent fewer primary care
physicians for children and 50 percent fewer for adults will be
needed in 1990 than predicted by GMENAC. While there was
considerable variation in the staffing patterns among the HMOs
and there are problems with projecting these results to the
national population (see Section 3.2), the study highlights the
fact that the GMENAC projections may already be well off base.
An article by Lanska et al. (1984) argued that the GMENAC
numbers should be adjusted to reflect the increased proportion of
female physicians.
tend to work fewer
see fewer patients
(Reinhardt, 1981).
some have reported that female physicians
hours per week and per year and also tend to
per hour than their male counterparts .
Bowman and Katzoff (1980) point out that, in
theory at least, the GMENAC studies did use sex-specific death
and retirement rates on the supply side and on the requirements
side instructed the Delphi panels to account for the impact of
female physicians when estimating the future productivity of
physicians. How well this was factored into the requirements
estimates is an implicit issue that is certainly open to debate.
Lanska et al. can be interpreted, at least, as arguing that
GMENAC did not sufficiently account for this impact in its
productivity calculations.
Since much of the data used by the panels were epidemiological
measures and utilization-based descriptions of medical practice,
it is not clear how much the resulting GMENAC estimates differ
3-29

from those derived from a utilization-based estimate such as the
BHPr model. In Table 3-5 we present a comparison of the aggregate
supply and requirements projections generated by the GMENAC and
the BHPr methodologies.
We see that when the GMENAC estimates are adjusted to value
residents and fellows as one full-time equivalent (FTE) doctor
instead of only 0.35 FTE, both the GMENAC and the BHPr models
predict essentially equivalent aggregate supplies of physicians
(MDs and DOs). The requirements estimates differ substantially,
however, implying predicted oversupplies of radically different
magnitudes. Previous researchers have suggested that this
difference is due in large part to the fact that the utilization
trend analysis of the BHPr requirements model results in the
forward extrapolation of a strong positive trend in utilization,
while the GMENAC methodology does not incorporate such a trend.
Finally, one notes that the BHPr requirements estimates have been
continually adjusted downward as the model has been updated and
revised. With supply estimates remaining approximately steady,
the oversupply predicted by the BHPr is growing larger and
converging to some extent with that predicted by GMENAC, although
substantial differences still exist.
3.4 MARKET-SIGNALS APPROACH
What we are calling a "market-signals" approach can be
differentiated from the requirements/supply comparisons discussed
in the two previous sections in two ways. First, and most
important, market-based approaches assume an interaction between
the supply and demand sides of the market. Second, market-based
approaches can examine other signals coming from the market such
as prices and incomes, instead of concentrating on quantities
alone. On the surface, a market-signals approach has considerable
appeal for forecasting the future patterns of prices, incomes,
supply, and quantity. However, the data requirements for a full
3-30

TABLE 3-5
COMPARISON OF SUPPLY AND REQUIREMENTS ESTIMATES GENERATED BY GMENAC AND BHPR FOR 1990
Supply Requirements oversupply
GMENAC 593,250* 473 ooo** I 120,200
BHPr***
*
**
***
1982 Report 591,200 570,200 21,000 1984 Report 594,600 559,300 35,300 1986 Report 587,680 541,000 46,680
Supply estimate is composed of 504,750 physicians and 88,500 residents and fellows. GMENAC's own supply estimate was only 535,750 because residents and fellows were treated as 0.35 FTEs. ·They are treated as 1.0 FTE in this table so that comparisons with BHPr estimates may be.made.
Requirements estimate is revised from the original estimate of 466,000 to reflect revised estimates of requirements for a number of subspecialties (see Bowman et al., 1983).
Supply forecasts are from the BHPr Supply Model basic series estimates.
3-31

econometric specification of a market model are substantial. In
fact, the data necessary to estimate a specialty-specific market
model, at either the national level or some more disaggregated
level (which would be more desirable) are not available. As a
result, market models have taken either one of two courses:
1) analysis of physician incomes and associated rates of return to
investments in medical training using individual physician data,
and 2) highly aggregated models of the relationship between
physician expenditures and physician supply. Each of these basic
types of models is now discussed in turn.
3.4.1 Analysis of Individual Physician Income
The calculation of rates of return to medical training has a
long history in economics (Friedman and Kuznets, 1945; Kessel,
1958). These early studies tended to support the argument that
the medical profession acted as a cartel, keeping the specialty
in a shortage, incomes artificially high, and yielding high
returns to medical training. However, the studies over the years
(Sloan, 1970; Fein and Weber, 1971; Lindsay, 1973, 1976; and
Leffler, 1978) have not yielded de~initive conclusions on this
issue. By and large, the studies have supported the general
consensus that, at least through the mid-1970s, there was a
shortage of physicians. More recent evidence suggests that
physician incomes have declined slightly (Glandon and Werner,
1979; AMA, 1986), and the most recent empirical analyses (Noether,
1986) suggest that the increasing supply of physicians is
associated with an increase in competition and a decline in their
incomes.
In general, many of these studies are of limited assistance
in assessing specialty imbalances since they tend to aggregate over
all physicians. In addition, since the rate of return is
calculated as the Private rate of return as opposed to the social
rate of return, they tend only to support the notion that market
3-32

forces play a role, without indicating the socially optimal level
of supply. A few recent studies (Dresch, 1978; Burstein and
Cromwell, 1985) have computed rates of return to investments in
specialty training. The results from both studies suggest that,
with the exception of pediatrics, specialization has been highly
profitable to physicians.
For the policymaker attempting to assess imbalances this
information may be of limited value. If one believes, for
example, that relative prices in the market overcompensate
specialists, then this result suggests only that specialization
will continue, not that it necessarily should. At the same time
such noted analysts as William Schwartz and Frank Sloan have
stated that income information supports the view that the U.S.
does not suffer from an oversupply of physicians in general.
They note that:
We don't think there is any compelling evidence that there is an appreciable physician surplus at this time. Increased competition has led to wider diffusion of physicians, and other changes, such as aging of the population and technological change, have also bolstered demand. ?n fact, during the period 1980-1984, supply and demand were in approximate balance as evidenced by the fact that net physician income remained virtually constant, as documented in Medical Economics. (Quoted in Iglehart, 1985.)
The relatively modest declines in physician incomes over the
past decade, in the face of substantial increases in the supply
of physicians, suggest that society continues to place a relatively
high value on the output of physicians. However, given perceived
rigidities and distortions in the relative compensation of
different specialties, most analysts would be uncomfortable with
using relative rates of return to different specialties alone to
make judgments about surplus or shortage, though they seem
comfortable in concluding that there is not a serious surplus of
physicians.
3-33

3.4.2 Econometric Market Models
There have also been attempts to develop and estimate
market-level models of the demand and supply for physicians and
to explain the pattern of physician expenditures. Hixson and
Mocniak (1980) developed an aggregate time series model of .the
demand and supply for physician and hospital services. They found
that the market is responsive to increases in the supply of
physicians in the conventional way, with an increased supply of
doctors associated with a decline in the price of physicians'
services. They suggest that there is an equilibrating mechanism
but do not make a judgment as to whether the market is in shortage
or surplus. Hu and Yang (1985) estimate a similar model taking
advantage of new econometric tools involving disequilibrium.
using time series data from 1950 to 1980, they find that the
market is in disequilibrium and that the price does not adjust as
rapidly as one might like. They suggest that in all likelihood
if the market were in a state of oversupply the resultant price
adjustment would be slow. In a sense, this argues that market
signals will have limitations as indicators of surplus or shortage.
Sloan and Schwartz (1983) examined expenditures for
physician's services over the decade of the 1970s and found that
only about one-fifth of the observed increase could be attributed
to the increased number of physicians. Based on their findings
from the 1970s, they predicted that the 1980s would witness a
very slight increase in gross income per doctor but that net
incomes would remain approximately unchanged or even fall as the
supply of doctors continued to rise. These authors conclude that
a large surplus of physicians is not likely. Of course, this
study did not consider potential imbalances on a specialty level.
Frank (1985) responded to the puzzling results of studies
which had found that increases in physicians' fees were associated
3-34

with more physicians per capita. He focused his efforts on the
pricing and location of physician services in one particular
specialty--psychiatry. His market model a·llowed the supply of
providers to adjust slowly to changes in demand and yielded
predictions which were more consistent with the predictions of the
competitive model. Brown and Reid (1981) also concentrated on
one particular specialty when they modeled the market for general
practitioners. These researchers also concluded that the
competitive market model seems to be applicable since their
results showed that GPs tended to distribute themselves into new
markets as a result of demand shifts. If, indeed, the markets
for particular specialties are characterized by the standard
competitive market model, then the analysis of market signals
such as income can yield some insight into the question of
manpower imbalances. However, for these studies to be of help to
COGME they need to be performed for each specialty individually,
or, at least, they should make the distinction between primary
and nonprimary care physicians, rather than for all physicians in
the aggregate.
Finally, it should be noted that the BHPr has developed its
own eight-equation simultaneous model (BHPr, 1986) which models
both the supply and demand for various forms of health services
and which focuses on the interrelatedness of the principal
factors. The model is estimated with national time-series data
and is used to forecast health care prices and expenditures under
a variety of likely scenarios about the future. At present, the
approach is being used to assess the impact of an increased
supply of doctors but it is not forecasting on a subnational level.
3. 5 LOCATIONAL D.ISTRIBUTION
One of the obvious problems with national-level comparisons
of requirements and supply is that they are by definition national
averages over a diversity of local market areas with very
3-35

different demands and needs for as well as supplies of physicians.
The optimal local supply will depend upon local area market size,
composition of the population, and population density. It is
obvious that even if the national level of supply were at
appropriate levels, a geographic or locational maldistribution
could result with some areas being overserved and others being
underserved.
Figure 3-4 provides an indication of the variation in
physician-to-population ratios by state. Of course, there is
probably more variation within states as well. Table 3-6, from
the GMENAC report, provides an indication of the variation which
existed by county in 1975. Recent county-wide specialist-to
population ratios can be constructed using data from the Area
Resource file (ARF) and might be useful for COGME to consider in
the future. Projections of future physician-to-population ratios
have been generated by the BHPr model on a regional basis for
four broad categories of specialization. These data are of more
limited use for addressing regional variation in specialty
availability since they are aggregated to a larger degree.
Researchers in the past have analyzed the geographic
distribution of physicians in a number of ways. In a separate
volume of their final report, GMENAC (1980) presented selected
data on the distribution of physicians by county for 18 specialty
classifications. The data indicated substantial differences in
the physician-to-population ratios across geographic regions.
Large differences were present in each of the specialties examined.
As the report noted, however, physician-to-population ratios
should be interpreted cautiously.
First, the presence of a physician in a market area does not
necessarily mean that the physician practices in that area.
Similarly, the fact that patients will often cross into a market
area other than their one of residence to receive care means that
3-36

w I w _,
> ~, ,f~ ;J)"
RATIO
Q) .. -:~
•
FIGURE 3-4 NONFEDERAL PHYSICIANS
PER I 00,000 CIVILIAN POPULATION 1983
I I UNDER 165 L-=i 165 -- 210
SOURCE: PHYSICIAN CHARACTERISTICS ANO DISTRIBUTION IN THE U.S., 1984 (AMA)
~
=---2
-------".
""" '""DVER2!0

TABLE 3-6
SEL!CTl!D PHYSICIAN DISTRIBUTION STATISTICS BY SPECIALTY, 1975
Physicians_. __ Number of----···-·-- County Ratios per 100,000 Population Number of per 100,000 Counties Percent of Physician& Population Without All Countiee 50th 90th lOOtb
Specialty in U.S. in U.S. Physician (3084) Percentile Perc;entile Percentile
All Specialties 307,155 144.2 167 5.4% 52.8 122.8 1299.4 Adult Medicine 109,615 51.4 180 5.8% 32.9 57.6 485.9
General Practice/ Family Practice 49,521 23.2 208 6.7% 25.2 47.4 136.4 Internal Medicine 48,459 22.7 1633 53.0% 0.0 15.7 180.1 Cardiovaecular Dise••e• 6,381 3.0 2377 77.1% 0.0 J.O 28.2 Gaatroenterology 1,945 .9 2730 88.5% o.o .5 25.0 Pulmonary Disease 1,885 .9 2700 87.5% o.o . 7 43.5 Allergy 1,424 .7 2703 87.6% o.o .6 55.6
w General Surgery :H,640 14.8 1202 39.0% 5.8 16. l 108.5 1. w Obetetrica 21,177 9.9 1881 61.1% 0.0 10. l 55.9 00
Pediatrics 20,399 9.5 1978 64.1% 0.0 8.2 86.0 Poychiatry 19,525 9.1 2144 69.5% 0.0 6.8 104.2 Orthopedic
Surgery 10,666 5.0 2218 71.9% o.o 6. 1 74.6 Ophthalmology 8,952 4.2 2079 67.4% 0.0 5.2 53.0 Urology 6,092 2.8 2256 73.2% o.o 3.7 35.1 Otolaryngology 4,791 2.2 2366 76.7% 0.0 2.7 51.1 Dermatology 3,372 1.5 2504 81.2% o.o 1. 7 52.9 Neurosurgery 2,886 1.3 2675 86. 7% 0.0 1. 2 2l.5 Plastic Surgery 2,066 .9 2750 89.2% 0.0 .6 44.4 Thoracic Surgery 2,044 .9 2668 86.5% 0.0 .9 19.6
Source: GMENAC Report to the Secretary, Department of Health and Human Services, Volume III, 1980.

use of only the resident population to construct physician-to
population ratios for the market area will artificially inflate
the ratio. Second, as pointed out above, market areas differ
considerably by size and by characteristics of the population.
GMENAC noted that service requirements are determined not only by
population size, but also by age, sex, race, income, education,
willingness to travel, and proximity to another large community.
Thus, the geographic distribution of physician-to-population
ratios can be expected to be uneven. Utilization of physician
services can also differ because of differences in professional
judgments concerning the value of specific treatments. And as
noted in Section 3.3, physician-to-population ratios can differ
markedly depending on the way the health services are organized.
Despite these caveats however, it is still important to monitor
variations and consider how to determine whether imbalances exist
in certain regions.
GMENAC recommended that small area population-based data on
the availability, requirements for and utilization of physician
services be collected, analyzed, and used in manpower planning
policies. GMENAC also recommended that specific standards be
established for defining health manpower shortage areas as well
as minimum time/access standards to various physician services.
GMENAC recommended, for example, that five basic types of health
care services should be available with these maximum travel
times: 30 minutes for emergency medical care; 30 minutes for
adult medical care; 30 minutes for child medical care; 45 minutes
for obstetrical care; and 90 minutes for surgical care services
for 95 percent of the population in 1990. The report further
recommended that 50 percent of the specialty-to-population ratios
suggested by the GMENAC Modeling Panel be established as the
minimum acceptable ratio for all areas.
An important empirical question for policymakers is to what
degree increases in the supply of physicians help to alleviate
3-39

the problem of underserved areas. The topic has been addressed
in a number of studies, most notably those conducted by
researchers at Rand. Newhouse et al. (1982) reported that as the
supply of physicians increased during the 1970s the medical and
surgical specialties diffused into smaller and smaller communities.
In fact, by 1979 "nearly every town with a population of 2500 had
ready access to a physician." They further noted that only a small
percentage of towns with a population of more than 20,000 were
without the services of an internist, obstetrician-gynecologist,
pediatrician and radiologist and that even orthopedists,
ophthalmologists, and urologists were present in all such
communities. In a related study reporting on the time that it
takes to get to physicians (Williams et al., 1983), they found
that for both 1970 and 1979, approximately 80 percent of residents
in towns of less than 25,000 outside metropolitan areas lived
within 10 miles driving distance of some physician and 98 percent
lived within 25 miles. The study noted, however, that during the
1970s, the distance to medical and surgical specialists decreased
substantially as the geographic distribution of specialists
became more even.
In the past, the U.S. Government has developed a criteria to
identify health.manpower shortage areas (HMSAs) as a basis for
addressing underserved areas. In general, the Government has
determined HMSAs by choosing specific physician-to-population
ratios for different regions as cutoff points to determine
whether an area is eligible for aid. Government aid includes
assistance such as staffing by the National Health Services
Corps. The ratio is also adjusted for indices of medical need.
The 1976 Health Professions Educational Assistance Act designated
that shortage areas include population groups and institutional
settings as well as geographic areas (OTA, 1980). Population
groups include Native Americans, migrant workers, and the aged,
while institutional settings include locations such as hospitals,
3-40

state mental health facilities, long-term care facilities,
migrant health centers, and Federal and state prisons.
Only primary care physicians are included in the physician
to-population ratios used to determine HSMAs. For this purpose,
primary care physicians include general practitioners, family
practitioners, obstetrician-gynecologists, pediatricians, and
internists. Psychiatrists are also included in the definition· of
primary care physicians in mental health facilities.
For nonmetropolitan areas, the government has determined
that a HMSA exists if there is a primary care physician-to
population ratio of 1:3,500 or higher (fewer physicians). This
means that only those areas meeting this criterion are eligible
for government aid. Once designated as an HMSA and selected for
staffing by the National Health Service Corps, physipians are
provided until a ratio of 1:2,000 is reached. When measured by
county, most metropolitan areas have an adequate number of
primary care physicians. However, since this ratio may mask
needs in certain sub-county urban areas (such as inner cities), the
government measures the need for physicians in these areas by
examining the needs of low-income populations. In order to be
eligible for designation, the population must also have a
physician-to-population ratio of 1:3500.
Examining geographic variation is an important issue that
COGME may want to address. Options for including this level of
specificity in the analysis are included in more detail in
Section 5. For example, COGME could update the county data on the
distribution of specialist-to-population ratios as reported by
GMENAC. As noted, data could also be obtained from the Area
Resource File and used to calculate these ratios for different
definitions of market areas.
3-41

SECTION 4
OTHER STUDIES AND DATA LIMITATIONS
4.1 INTRODUCTION
In addition to the recently completed studies discussed in
the previous section, a number of medical and specialty societies
are currently carrying out or preparing to ·carry out studies
related to the issue of physician/specialty manpower. This
section, combined with the background provided in the preceding
section, is intended to present the reader with a summary of the
state of the art in efforts to assess specialty imbalances.
Research projects and data collection efforts of the American
Medical Association, the Council of Medical Specialty Societies,
and the Association of American Medical Colleges are discussed
below. The information provided is based upon discussions with
research staff at each of these organizations. Table 4-1
summarizes the studies discussed in Section 4.2.
Section 4.3 considers data limitations which may hamper
attempts to assess specialty imbalances. It is important that
COGME members and policymakers have a good understanding of not
only the general approaches to determining specialty manpower
imbalances but also the data shortcomings which make each approach
less than ideal. With this understanding, COGME members will be
better equipped to make recommendations about the approach(es) they
believe will be most amenable to use in the short term.
4.2 ONGOING AND PLANNED STUDIES
4.2.l American Medical Association
The AMA has collected data and analyzed issues concerning
physician manpower for many years. In the past, the AMA has not
made recommendations about how to arrive at an optimal number of
4-1

"" I N
Organization
American Medical Association
Council on Medical Special Societies
Association of American Medical Colleges
*See text for detailed discussion.
TABLE 4-1
ONGOING ATTEMPTS TO STUDY PHYSICIAN SPECIALTY MANPOllER ISSUES
Scope of Anatrsis*
Data Source Specialty Geographic
AMA Physician Masterfile 13 specialties NA SMS
Matrix Distributed to Specialty Societies
surveys of Medical Students and Residents
24 specialties NA
NA NA
Projected
Date of Completion
May 1986 - June 1989 Preliminary results
available, May 1987
Preliminary data in June 1987
Data collected since 1983 Currently being readied for use

-physicians and has emphasized a reliance on market forces to
determine the number of physicians in the United States. More
recently, though, the AMA has begun developing computer models in
order to make projections about the future demand for, and supply
of, physicians in the U.S. The projections are intended to aid
the Association in considering manpower policies in the future.
The AMA has expressed its willingness to share results with COGME.
Projections by the AMA will rely on new computer models
using updated forms of existing databases. The AMA has two data
sources which contain a wealth of information on physicians in
the United States:
1) AMA Physician Masterfile: This file contains information on numbers of physicians by specialty, major professional activity., location, sex, age, medical education, hospital affiliation, type of employment, and board certification. In addition, there are geographical data by state, county, and metropolitan area.
2) Socioeconomic Monitoring System (SMSl: This file contains information on hours worked by physicians, patient visits, hospital utilization, fees, expenses, and income. The information is broken down by specialty group, census division, age, type of practice, urban vs. rural location, and employment status.
The AMA has used this data in recent years for a· number of
studies on physician manpower. Summary data from the Physician
Masterfile are published periodically, most recently in Physician
Characteristics and Distribution in the U.S. 1986. Most recent
results from the annual SMS survey are published in Socioeconomic
Characteristics of Medical Practice 1986. On occasions, the AMA
also receives additional information from telephone and mail
surveys.
4-3

In the future, the AMA plans to provide projections
regarding the market for physician services in the United states.
The Association has already commenced its effort and intends to
develop its models over the next several years, gradually adding
layers of sophistication about patterns of health care consumption
by the public and about the changing demographics of the physician
population. The AMA envisions gathering the information over a
period of approximately three years.
In the first year, which ended in May 1987, the AMA developed
the capability to project the supply of physicians under various
scenarios regarding the number of future U.S. medical school
enrollees and foreign medical school graduates. Preliminary
projections were recently published in The Demographics of
Physician Supply: Trends and Projections. These projections use
a new computer model called the AMA Demographic Model of the
Physician Population (DMPP). The model is based on the Physician
Masterfile and includes functions on physician retirement,
mortality, and accession. The model includes information on 10
specialties from the SMS file.
In the second and third years (June 1987 to May 1989), the
AMA plans to develop a model to project the future demand for
physician services. There are also plans to continue developing
the supply model. The demand model will use data from the 1980
National Medical Care Utilization ·Expenditure Survey (NMCUES),
the 1980 and 1985 Health Interview Survey (HIS), and the 1981 and
1985 National Ambulatory Medical Care survey (NAMCS). The model
will use population projections and trends in utilization
patterns to project the growth in the demand for physician
services.
The more sophisticated supply model to be developed during
the second and third years of the AMA effort will incorporate
information about physician productivity and the rate of return
4-4

to training investments in different physician specialties. In
analyzing the number of hours worked by physicians, for example,
the AMA will adjust for differences between U.S. and foreign
medical graduates and between male and female physicians. There
will not be information on differences between HMO and fee-for
service physicians.
Currently, there are also plans to break down both the
supply and demand models into physician specialty categories.
For the supply model, the AMA plans to expand the 10 specialty
categories currently listed in the SMS file into 13 categories:
general/family practice; general internal medicine; internal
medicine subspecialties; general surgery; surgical subspecialties;
pediatrics; obstetrics/gynecology; radiology; psychiatry;
anesthesiology; pathology; emergency medicine; and an "other"
category. On the demand side, the AMA hopes to break down the
specialties in more or less the same way though it is uncertain
whether or not data will be available on radiologists,
anesthesiologists, and pathologists.
To some extent, however, the supply and demand models taken
together should eventually be able to provide some projections on
the entire market for particular physician specialties. This will
enable the AMA to project future over- and undersupplies under a
number of different assumptions. The AMA hopes to analyze
several specific areas in the future. Among these are: changes
in patterns of health care consumption in the United states;
changes in jobs of other health professions; changes in health
care technology; changes in individual physician practice patterns.
Research to model physician supply and demand by subnational
geographic areas is currently ongoing and the AMA hopes to
eventually integrate these plans into its other studies. However,
this research has a lower priority and there will probably not be
any results for at least two to three years.
4-5

,
There are several ways in which COGME could use the AMA data
both in the short and long term. As noted, the AMA already has
the capability to run its supply model under different assumptions.
COGME could, in the short term, provide the AMA with its own
assumptions or sets of assumptions regarding the number of future
U.S. medical school graduates or foreign medical graduates and
have the AMA run the model. The obvious limitation is that this
would only provide estimates of the future supply of physicians.
The AMA hopes to have preliminary estimates on the demand side by
late spring 1988, and thus it may be possible for COGME to use
some initial results on both demand and supply in its July 1988
report. However, given the short time frame and the newness of
the AMA demand model, it is highly unlikely that these numbers will
be ready in time for the COGME publication.
4.2.2 council of Medical Specialty societies
The Council of Medical Specialty Societies (CMSS) is a
federation of 24 national medical specialty societies. The
Council was established to provide a forum to enable the various
medical specialty societies to meet together and participate in
issues of concern to specialized medicine. CMSS is organized
into several committees including a Health Manpower Committee
whose role is to identify, study, and make recommendations on
relevant national physician manpower studies as well as on
legislation affecting specialized medicine. CMSS can thus serve
as a useful source of information and as a conduit to inform
COGME about physician manpower studies undertaken by various
specialty societies. CMSS reported to COGME in March 1987 that
it could best serve COGME by coordinating information and requests
for manpower data between COGME and the specialty societies.
CMSS is currently involved in two activities which should
eventually provide some useful information on the supply of
4-6

physicians in various specialties. The CMSS Health Manpower
Committee is currently designing a consistently defined minimum
data base for physician manpower for its members. This effort is
intended to provide a means by which the various societies'
databases can be matched by provider identification number
thereby facilitating more comprehensive analysis of this data in
the future. Presently, it is not known however, when this effort
will be completed.
CMSS is also currently coordinating the completion of a
matrix by its members which will provide physician supply
projections from specialty society data. The matrix is intended
to provide past and present data on the supply of specialists as
well as estimates of physician supply from 1987 to 2010. The
matrix is scheduled to be available in June of this year and
should be of some use to COGME. Members of CMSS have been asked
to make annual projections of the future supply of specialists
from 1987 to 2010 based on several factors: the supply of
specialists at the start of each year; the annual residency
program output; annual specialist immigration; and estimated
annual deaths and retirements.
While this matrix should be helpful for COGME as an additional
source of information on projected physician supply by specialty,
a number of likely limitations should be mentioned. First, there
may be substantial differences in the ability of different
specialty societies to provide data. Second, the matrix provided
by CMSS to its members asks only about the projected supply of
specialists. Since there will be no information about the demand
for these specialists, or about other factors which affect the
market such as rates of return to education, the data will not by
themselves speak to the issue of specialty imbalances. Third,
the matrix requests that members project the supply of specialists
for all years 1987 to 2010; obviously, there will be a great deal
4-7

of uncertainty in projections made for years so far into the
future.
Despite the limitations of these data, the information
provided by the specialty societies could be useful as a starting
point for examining the supply side of future physician specialty
imbalances. The data could also be used in the short term as
background information in surveys of physicians attempting to
assess physician specialty imbalances. This type of policy
option is discussed in more detail in Section 5.
In the past, various specialty societies have conducted
studies of future imbalances in their particular specialties.
The American College of Radiology and the American Thoracic
Society, for example, have projected the future supply of
radiologists and thoracic surgeons respectively. studies completed
as of 1985 are described in A Review of Health Professions
Requirements Studies (BHPr, 1986). COGME has requested that CMSS
coordinate the gathering of any specialty society studies
undertaken in the recent past. Any additional information that
the societies can provide is expected to be available in early
June 1987.
4.2.3 Association of American Medical Colleges
The Association of American Medical Colleges (AAMC) represents
all accredited M.D. degree-granting medical schools in the United
states. In 1983 the Association began collecting comprehensive
data on all students involved in either undergraduate or graduate
medical education in its member institutions. On the undergraduate
medical education level, a file is begun on every student taking
the MCAT exam and information is subsequently collected on that
student's application to medical school and his/her progress
through school (for those admitted and attending school).
Information about graduate medical education (GME) is collected
.4-8

by means of the AAMC's Graduation Questionnaire, a survey
administered annually to all senior medical students enrolled in
the AAMC member institutions. Information available from this
source can be classified into the following four categories: GME
plans; career plans; medical school experiences and curriculum;
and demographic and financial data. In addition, the AAMC and
the National Residency Matching Program collect annual data on
physicians in residency positions. All of these types of data are
particularly well-suited for studies of specialty choice, specialty
switching, and the demand for the number of first year medical
school positions and residencies. These data could be utilized
by the Bureau of Health Professions if they attempt to refine
their model of specialty supply so as to better reflect recent
trends in specialty choice ..
The data collection efforts begun in 1983 are continuing on
an annual basis and the resultant files are currently being
edited and readied for use. As of this writing, the AAMC has not
yet undertaken any research activities to model either the supply
of or demand for medical manpower. However, the AAMC's own Task
Force on Physician Manpower is charged with tasks similar to
those of COGME, and its decisions about what modeling efforts will
be undertaken by the AAMC in the future (if any) are expected in
the next three to six months (i.e., by November 1987). Given the
relative strengths of the AAMC data, it is anticipated that areas
in which research efforts are most likely to be concentrated
include: 1) modeling determinants of the number of first-year
places in medical schools; 2) modeling determinants of the number
of residency positions available in particular specialties;
3) modeling physicians' choice of specialty; and 4) modeling
determinants of specialty switching and branching over a
physician's career. Although demand for physician manpower is
likely to play a part in the modeling of residency positions and
specialty choice, the findings of these research efforts are more
likely to yield insight into the issue of physician/specialty
4-9

supply rather than requirements. Assessment of specialty
imbalances would require the coupling of these findings for
specialty supply with estimates of specialty demand.
Specialty switching is an important phenomenon to study
because it provides some indication of the potential flexibility
of physicians in responding to imbalances at a specialty-specific
level. Even if predictions are off the mark, the market may be
moved toward equilibrium by physicians switching into the
specialties where they are needed. The AAMC feels that it can be
of use in helping the medical manpower market work more efficiently
by providing timely information about the various specialties to
prospective medical students and to medical students contemplating
residency choices.
4.3 DATA LIMITATIONS
Before deciding upon policy options for short-term analysis,
it is important to understand the limitations of existing data.
Many of these limitations were discussed in Section 3.
Data on current physician manpower are available from
several sources, most notably the AMA Physician Masterfile and the
AMA Socioeconomic Monitoring System. These files contain
comprehensive data on the demographics and professional activity
of all physicians in the United states. As such, these data have
several distinct advantages over data collected by the specialty
societies and others. First, membership lists of specialty
societies generally contain only board-certified doctors, thereby
undercounting the total supply of physicians (MDs and DOs). The
1980 OTA report, Forecasts of Physician Supply and Requirements
(OTA, 1980), estimates that board-certification data exclude
nearly 50 percent of the MD supply reported by the AMA and 80
percent of the DO supply reported by the AOA. However, the
proportion of physicians who are board certified is growing,
4-10

indicating that this potential for undercounting may become less
of a problem in the future. Second, a physician may be certified
in more than one specialty, implying double or even triple
counting when aggregating across the membership lists of various
specialty societies. Third, specialty society membership does
not necessarily reflect the physician's current area of practice.
Of course, the AMA Masterfile is not problem free. In particular,
the self-designation of specialty leads to an overstatement of
specialty manpower and an understatement of general practitioner
supply. Also, the consideration of only the primary specialty
designation provides no information on the time devoted to other
specialty areas and activities, making the calculation of full
time equivalent manpower difficult (OTA, 1980). Thus, the
specialty society data may actually provide better information on
the availability of specialty services.
In modeling projections of specialty supply there is only
limited data on the specialty choice decision. The BHPr model
extrapolates from past trends in first-year residency patterns,
but this approach is not ideal because of the specialty switching
and branching which takes place during subsequent years of the
residency training period. Though the model attempts to correct
for this to some extent, it would be better to use final-year
residency patters. Unfortunately, such data are not available
from the AMA (OTA, 1980). The forthcoming data base of the AAMC
may hold more promise for addressing this issue and may allow the
BHPr to make specialty choice a response variable in their supply
model.
There is also the problem of mid-career specialty switching
which is often not adequately accounted for in models of specialty
supply and which casts some doubt on supply estimates by specialty.
Little could be done in the short term to remedy this, but a
longer term recommendation might be to undertake studies of this
phenomenon (or to synthesize past studies in this area) and to
4-11

incorporate their findings into models of specialty supply. In addition, the AMA plans to improve their capability of measuring
specialty switching. The projection of the future is further
complicated by the uncertainty surrounding the expected contribution of FMGs; extrapolation of past trends may not be helpful since the situation is subject to change, depending on
Federal immigration legislation.
Projections of physician requirements, particularly by specialty, are also subject to data limitations. With needs
based models such as GMENAC, even if epidemiological data were
perfect and allowed an accurate prediction of the future need for physician services, the translation into the need for physicians requires data on physician productivity. This parameter can be
expected to vary by specialty and to be influenced by a number of factors which must themselves be predicted into the future. Examples of such factors include the extent to which physician
extenders will be used and the number of female physicians. Poor predictions of future physician productivity are translated directly into poor predictions of the future requirements for physicians.
Demand-based models for projecting requirements are also
subject to data limitations. We have already noted in Section
3.2 that BHPr's attempt to expand the utilization matrix to include 320 population groups instead of 40 taxed the Health Interview Survey (HIS) data to its limits. Furthermore, any
attempt to expand the personnel matrix of the BHPr requirements model to include a more detailed specialty breakdown must deal with two conceptual issues related to data availability: 1) .the degree to which individual specialties are substitutes for one
another is largely unknown, and 2) HIS data do not allow a good determination of utilization rates by specialty. It is likely
that both the National Ambulatory Medical Care Survey (NAMCS) and
the National Medical Care Utilization and Expenditure Survey
4-12

(NMCUES) would provide more accurate data on utilization rates by
specialty. NAMCS is a physician-based survey so the specialty
designation is reliable, and the longitudinal nature of NMCUES
allowed for more careful checking of the doctor's specialty (as
reported by the patient) than was possible with the HIS.
In addition to the absolute numbers of specialists, the
supply relative to population is also given much consideration in
the literature and by policymakers. However, data limitations
make the interpretation of physician-to-population ratios subject
to many caveats. First, the data are generally available for
geopolitical areas such as counties, SMSAs, and· states; and these
levels will rarely correspond with a relevant health care market
area. Patients receive care in areas other than the one in which
they live, and doctors treat patients in areas outside their area
of residence. Such bordercrossing makes the definition of a
market area problematic.
Second, an area's physician-to-population ratio for a
particular specialty must be interpreted'in light of the specialty
mix which exists in the area. Since specialties overlap in the
provision of some services, an area which appears to have a
shortage of a given specialty still may not be adversely affected
if another specialty is providing the needed services.
Third, and perhaps most important, individual market areas
are unique and physician-to-population ratios may not give an
accurate portrayal of the relationship of "available services" to
"needed services" (BHPr, 1982 Report). The amount of physician
services available from a given number of.physicians is
influenced by a multitude of factors, including the practice
organization and reimbursement mechanisms (e.g., solo, fee-for
service practitioners versus salaried doctors in group practices)
and the utilization of physician extenders. Likewise, the
serv'ices needed by a population of a given size are influenced by
4-13

such factors as the proportion of the population enrolled in
HMos, the proximity to regional medical centers, and the
population's socioeconomic characteristics and demographics.
These important factors are not adequately reflected in the
calculation of physician-to-population ratios from the available
data.
4-14

SECTION S
COGME'S SHORT-TERM OPTIONS FOR ASSESSING IMBALANCES
S.1 IDENTIFYING SHORT-TERM OPTIONS
The major question addressed here is: in the time available
for analysis in preparing the first COGME report, what approach
or approaches are likely to be of most use in assessing specialty
imbalances? Obviously, the time constraint in and of itself
places a severe limitation on the amount of new or quantitative
modeling and estimation that can be undertaken. The limitations
are also·budgetary, operational, and technical. COGME has a
small internal staff and limited budget for external projects.
However, even if substantial funds were available, it would be
technically difficult to construct any new models and gather data
for analysis over this period. Nonetheless, there are some
options building upon work of others that may help COGME in the
short-term.
The options vary along two dimensions and can be arrayed as
shown in Figure 5-1. The first dimension is the level of
specificity: will the analysis examine all physicians, primary
vs. non-primary physicians, a more detailed breakdown of
specialties or selected specialties? The second dimension is
concerned with the amount of qualitative and quantitative content
and manipulation of data that would be required. Rankings along
this dimension are somewhat arbitrary since the use of any
information by COGME will have a qualitative or judgmental
aspect. Additionally, the six options listed in the figure are
no~ necessarily mutually exclusive. One or more of them could be
undertaken to provide COGME with short-term background information.
5-1

lJ1 I
N
LEVEL OF SPECIFICITY
ALL PHYSICIANS
PRIMARY VS. NON-PRIMARY
DETAILED SPECIALTIES
SELECTED SPECIALTIES
FIGURE 5-1
ARRAY OF SHORT-TERM OPTIONS
I MORE MORE I QUALITATIVE(;---- - - ---- --- --- ---- -- - ---- - ----- - - ----- - ----- - - - - --} QUANTITATIVE
I SURVEY I SYNTHESIZE I PROFESSIONAL I MARKET I OPINION I SIGNALS
I USE I BHPr I MOOEL
I MOOJFY I GMENAC I MOOEL
USE I ANALYZE HMO I GEOGRAPHIC STANDARD I VARIABILITY

The level of specificity has a major impact on what is
feasible in the short run. Finer specialty breakdowns will
require much more effort to develop and analyze. The level of
specialty chosen should be influenced by the policy questions
that COGME wishes to address in its first report. Questions of
the adequacy of aggregate supply and FMG policies, for example,
or of encouraging primary care training may not require as
detailed a specialty breakdown in the analysis. Conversely,
COGME may choose to let the availability of information limit the
scope of the policy questions it addresses in its first report.
Briefly, the six basic alternative approaches are:
1. Survey professional opinion.
2. Synthesize information from market signals and indicators.
3. Use BHPr's requirements projections (not possible on a specialty level).
4. Modify GMENAC requirements estimates.
5. Compare specialty-to-population ratios from HMOs or other closed populations with supply.
6. Analyze geographic variability in specialty-to-population ratios.
These options were identified
approaches discussed in Sections 3
might be feasible in the short run.
example, that in the short term, it
by considering, for each of
and 4 of this paper, what
It was recognized, for
is feasible to survey
the
professional opinion and to build upon existing databases. Small
panels of experts could be convened over a period of two to three
months, though the scope of the effort would necessarily be
limited. Alternatively, COGME could survey professional opinion
by sending a focused questionnaire to the various specialty
societies, and perhaps other experts, to obtain information.
5-3

Any data generated or used in the short term could come from
existing databases and/or build upon existing models such as the
BHPr's requirements model or the AMA Demographic Model of the
Physician Population (DMPP) which could provide supply projections.
Data could also be obtained from projections made in the recent
past such as those made by GMENAC. COGME may decide that any
combination of any these approaches would be superior to choosing
a single option. An approach might consider, for example,
gathering existing data and presenting it, along with a
questionnaire, to small panels of experts in order to predict
whether and to what extent future imbalances are likely. As
noted above, an important question that COGME must address early
is what level of specificity the effort will entail in terms of
both physician specialty and geographic variation.
We now outline each of these options in more detail and list
the advantages and disadvantages of each. It is important to ·
remember, again, that they are not mutually exclusive and that
COGME will most likely have to make its judgments based on the
weight of evidence presented from one or more of these types of
approaches.
5.2 SURVEY PROFESSIONAL OPINION
Approach: Use qualitative professional opinion to make judgments about requirements.
Method: Design short qualitative questionnaire to send to specialty societies or other experts to solicit their opinions about requirements and imbalances, especially regarding GMENAC. Alternatively, small panels of experts could be convened to provide their opinion or to review the results provided by the specialty societies.
First, any attempt to gather information by professional
opinion in the short run is more likely to succeed if it involves
a small number of professionals responding to targeted questions.
5-4

Conducting a large scale opinion survey, such as the one used by
sossus (1978) to ask physicians about local area imbalances would
not be feasible in the short run. For SOSSUS, questionnaires
were sent to some 10,000 federal and nonfederal physicians having
a surgical specialty as one of their three listed specialties.
Apart from the logistical considerations, the reliability of the
sossus effort has also been questioned (Moore et al., 1978).
A related but more feasible approach may be to prepare a
short, targeted questionnaire to ask specialty societies about
their perception of the state of balance in their specialty. The
CMSS has already indicated its support in canvassing specialty
societies, which is in process. COGME has already scheduled
public meetings where professional societies will be invited to
testify and present their views about imbalances. The questions
should certainly cite GMENAC or other quantitative data and ask
the specialty societies to respond within a certain page length
(presumably they would be invited to submit supporting materials
as they desire). Small panels could be convened as an alternative
to or in conjunction with these surveys. However, the size and
scope of the panels would need to be limited considerably in the
short term.
Advantages:
o Allows experts to explain judgments about these complex issues.
o Allows detailed specialty consideration.
o Well-designed questions would help to focus COGME's attention.
Disadvantages:
o Is not directly quantitative.
o May not achieve a consensus.
5-5

o Panelists may not have a good perspective on physician imbalances.
Given the difficulties in making quantitative estimates,
COGME might be well served by asking experts to make qualitative
judgments about the state of their specialty and the important
policy issues. Expert judgment may be the best means of
synthesizing information on such complex matters. Targeting the
questions would allow COGME to focus the analysis to the level of
specificity desired.
One disadvantage of this approach is that it would be based
upon the qualitative judgments of a relatively small number of
individuals. This could be rectified to some extent by focusing
the questions and by presenting quantitative material as background
information. Another problem is that surveying professional
opinion may not achieve.a consensus. Sending questionnaires can
be problematic because participants do not have a chance to
interact and discuss the many complex issues involved. Convening
small panels can be problematic because judgments can be swayed
by the opinions of a particular member.
5.3 SYNTHESIZE INFORMATION FROM MARKET SIGNALS AND INDICATORS
Approach: Use latest information from the market to gain a qualitative impression about how the requirements compare with supply.
Method: Gather and collate information by specialty on relative incom~s, recent growth in supply, rate of return to education, and the demand and supply of residencies.
A second option is to assemble and synthesize the studies
that have been conducted regarding rates of return to specialty
medical training and other market signals of long-term surplus or
shortage. There is no definitive study of this issue so COGME
might benefit from a paper which attempts to synthesize the
5-6

sometimes discordant results in the literature. Of course, a fundamental question remains about the extent to which COGME
wants to use market indicators as signals of societal needs and preferences. Sections 2.2 and 3.4 indicated some severe
limitations in using such signals for judging over- and
undersupplies from a societal standpoint.
Advantages:
o Provides good information on the current market situation.
o Allows some degree of specialty breakdown.
Disadvantages:
o Based on existing reimbursement arrangements and subsidies which are undergoing rapid change. May not be representative of the future or what is socially desirable.
o May be too uncertain to support any strong recommendations about specific specialties.
As discussed previously, market signals can provide good indications about consumers' ability and willingness to pay for
medical care and about physicians• choice of specialty and location. It must be noted, of course, that these signals
reflect already existing market distortions such as various government interventions. A question that COGME may want to address explicitly at some point is whether and to what extent it
wants to make recommendations based upon the medical need of the population. As noted in Section 2, market signals may provide
little information about the medical care that society believes
is actually necessary.
An additional problem with market signals is that previous
patterns may not be representative of what is likely to occur in
5-7

the future. changes in health care delivery systems and in
medical technology, increases in the number of female physicians,
and a large number of cost containment initiatives being
implemented in the private and public sectors, for example, are
rapidly changing the market. Simply looking at past market
trends would not adequately capture these changes.
5.4 USE BHPr•s REQUIREMENTS PROJECTIONS
Approach: Compare existing BHPr demand-based requirements projections with supply. Do not attempt a finer specialty breakdown.
Method: Have BHPr produce the most up-to-date version of the projections. Use for addressing aggregate supply question and policy issues about primary vs. non-primary imbalance.
A third option is to attempt to use the Bureau of Health
Professions {BHPr) models of supply and requirements to make
judgments about future supply relative to future demand. The
structure and limitations of these models was discussed above.
In addition to considering predictions about future imbalances of
primary and nonprimary care physicians, the specialty estimates
of the BHPr supply model could be compared with specialty
requirements from a number of sources, such as HMO-derived
standards or the opinions of specialty societies.
Advantages:
o Builds upon the most comprehensive demand-based model and estimates ever constructed.
o Could be completed in short-term.
o Allows some questions about primary vs. nonprimary care ambulatory to be addressed.
o Is currently operational and could be used to examine alternative assumptions.
5-8

Disadvantages:
o Does not allow detailed or accurate specialty breakdown.
o Does not address concerns about accuracy of underlying data.
one major advantage of the BHPr model is that it is currently
operational. BHPr has also made attempts to update some of the
model's parameters so as to bring them in line with recent
developments. Thus, a feasible short-term option would be to have
BHPr generate the most up-to-date estimates using the latest model
parameters. Alternatively, COGME might wish to specify different
model parameters (such as to account for the expected increase in
utilization due to AIDS) and have BHPr generate estimates based
on these parameters. The model lends itself well to making a
series of alternative predictions
about the underlying parameters.
of parameters could be derived by
based upon various hypotheses
The alternative specifications
surveying both the literature
and selected health care experts as to recent and anticipated
developments in the health care arena which might influence
manpower requirements and supply in the future.
However, the BHPr requirements model holds no promise for
the short-term tasks facing COGME if the Council wishes to assess
manpower imbalances on a detailed specialty level. Although the
supply model projects specialty distribution, the requirements
model operates at a higher level of aggregation, permitting at
best a useful distinction between primary and nonprimary care
physicians. The BHPr staff has already indicated to COGME the
data limitations inhibiting an attempt at specialty-specific
modeling. In addition, staff have indicated great concerns about
the reliability of the data used to construct the model. It is
essential that COGME determine the level of specialty detail it
wishes before recommending that BHPr undertake the long-term
efforts to use these models to predict specialty imbalances.
5-9

S.S MODIFY GMENAC REQUIREMENTS ESTIMATES
Approach: For each of the specialties considered by GMENAC, identify major parameters that may have changed (such as productivity or new procedures) and calculate implications for requirements.
Method: suggested adjustments to model parameters could be made by 2 or 3 experts in each specialty who would have to review GMENAC's detailed report. Calculations could be made by COGME staff. It would also be possible to work with a more qualitative method: the experts could be asked to draw a qualitative conclusion about the net change in requirements as a result of the adjustments.
Modifying the supply and requirements data from the GMENAC
effort represents a fourth option. In principle, it would be
possible to change specific parameters in the model (such as the
expected number of persons with migraine) and calculate the
additional manpower requirements generated given the published
estimates on other related parameters. Indeed, since GMENAC was
released, several others have attempted such minor adjustments
for the increasing number of women physicians and the movement of
populations into health maintenance organizations (HMOs). It
might be considered, for example, to hire an individual consultant
in each of the specialties to review the earlier report and
suggest any changes in the parameters due to technological
changes or new diseases, etc. occurring since 1980. COGME staff
are sufficiently familiar with the model to calculate the
implications of any such changes. The resultant new requirements
estimates could be compared with supply estimates from GMENAC,
the BHPr model, or the AMA.
Advantages:
o Builds upon the most comprehensive needs-based model and estimates ever constructed.
5-10

o Allows detailed specialty breakdown as well as primary versus nonprimary care formulation.
Disadvantages:
o Does not address fundamental criticisms of GMENAC approach, such as the lack of a geographic dimension, the sensitivity of the results to a few parameters, and potential panel bias.
o Since most specialties were previously projected to be in or near oversupply, adjustments are likely to.only make this greater.
The advantages and disadvantages of the GMENAC approach were
considered in detail in Section 3.5. It would obviously not be
possible to repeat that effort in the short term, and many
observers have expressed reservations about undertaking such an
effort in the longer term as well. Nonetheless; GMENAC still
stands as the most comprehensive needs-based study ever conducted
and represents a good benchmark and a starting point for thinking
about future physician specialty imbalances. GMENAC made
projections of imbalances by specialty for the year 1990 and in
the aggregate for 2000. One possible option is for COGME to
simply use those projections in making future policy
recommendations. Another approach would acknowledge limitations
of that study and would consider changes which have occurred
since those projections were made. This approach could also be
used with other options noted in this section. For example,
GMENAC projections could be presented, along with other data, to
medical experts in order to formulate judgments about impending
imbalances.
5.6 USE SPECIALTY-TO-POPULATION RATIOS FROM HMOS OR OTHER CLOSED POPULATIONS
Approach: Compare latest information from HMOs or other closed populations on specialty-to-population ratios with national supply.
5-11

Method: Obtain information from closed populations about the numbers of specialists providing care to their population.
A fifth approach would be to survey the literature or other
sources to obtain standards of physician specialty-to-population
standards based on either HMO experience or ratios in particular
market areas that appear to be in balance or appropriate. If such
standards could be found, then they could be compared to forecasts
of supply from either GMENAC, the BHPr model, or the AMA.
Advantages:
o Provides some sense of minimal requirements.
o Allows detailed specialty breakdown.
Disadvantages:
o May not be representative of U.S. population.
o May not be adequate standard of care.
o May not provide a reliable benchmark because of variability.
studies of this kind were considered in more detail in
Section 3.2.2. One advantage to this approach is that the data
needed for even a detailed specialty assessment are generally
available. There are some important limitations to consider in
using this data, however. Overall physician-to-population ratios
may vary across HMOs, for example, because plans differ in the
package of services they offer. Specialist-to-population ratios
may vary because the relative roles of various specialties differ
across HMOs. Also, enrollees in these plans are often not
representative of the national population. For these reasons,
this option is probably most useful when used in conjunction with
other approaches mentioned. For example, medical experts might
review studies of closed populations as well as requirements
5-12
numbers generated for the general U.S. population when making
judgments.
5.7 ANALYZE GEOGRAPHIC VARIABILITY IN SPECIALTY-TO-POPULATION RATIOS
Approach: Update work done by GMENAC's geographic panel. Report on variability in specialist-to-population ratios and procedures across geographic areas to give sense of what market is indicating about requirements.
Method: Use Area Resource File (government database with county-level physician supply) to calculate these ratios for different definitions of market area.
A sixth approach, related to the previous one, would be to
study variability in specialty-to-population ratios across
different types of geographic areas. In a sense this would be an
update of the type of work done earlier by GMENAC's Geographic
Panel. Comparing the actual variability in physician-to-population
ratios with predicted ratios would give COGME a better sense of
the amount of uncertainty involved in assessing specialty
imbalances.
Advantages:
o Gives sense of the likely reliability of national requirements estimates.
o Allows detailed specialty breakdown.
o Presents the latest information.
o Can address primary vs. nonprimary care issue.
Disadvantages:
o Only a crude indicator of demand-based requirements.
o Not clear if will support specialty-specific recommendations.
5-13

o Would be difficult to adjust adequately for population characteristics and other area-specific factors.
As noted in Section 3.5, there is a great deal of geographic
variation in specialty-to-population ratios in the United States.
Even if there is general agreement that there is an oversupply in
a particular specialty, certain regions or populations may suffer
from a shortage. COGME will have to grapple with this question
in considering both short and long term options. County-level
data are available on the specialty-to-population ratios and could
provide a starting point for addressing the question of specialty
imbalances.
A considerable problem though is that these ratios provide
only a limited amount of information. Ratios can be expected to
vary across geographic regions and population groups because of
differences in the demographics of populations. In addition,
even if ratios were adjusted to take into account demographic
variations, other considerations--such as the proximity of
regional hospitals--would have to be noted. It is also difficult
to define accurately the relevant market area, given the tendency
for patients to seek care in areas other than their community of
residence; rarely will the aggregation levels of available data
correspond to meaningful health care market area definitions. In
addition, there is disagreement about the types of physicians
needed to treat certain illnesses. The Council may want to limit
this kind of analysis to ratios of primary care physicians-to
popula tion in order to identify the problem on a more aggregate
level.
5-14

SECTION 6
POLICY QUESTIONS AND IMPLICATIONS FOR MODELING
6.1 INTRODUCTION
In this section, we discuss implications of short- and long
term options for COGME's research agenda and address broader
policy issues of concern to the Coundil. Highlighting some of
these broader issues may also assist in formulating an effective
research agenda.
Section 6.2 discusses policy issues in light of the short-term
options presented in Section 5. Section 6.3 discusses implications
for longer-term options. Finally, Section 6.4 provides a
discµssion of broader issues that are raised in the debate about
physician specialty imbalances.
6.2 SHORT-TERM MODELING AND POLICY ISSUES
Section 5 identified several short-term options and discussed
their advantages and disadvantages. Clearly, in the limited time
available, it would be difficult for COGME to undertake any
substantial quantitative modeling. It is feasible, however, for
COGME to engage in more qualitative analyses and in data
manipulation on a more modest scale using existing sources. One
productive strategy may be to survey professional opinion using a
set of specific questions. Such a targeted effort could help in
identifying particular problem areas. COGME could, for example,
ask specialty societies to provide information in response to
focused questions about whether an imbalance exists in their
particular specialty. Alternatively, the Council could have
experts review existing data and projects, and answer targeted
questions provided by the Council.
6-1
Also, COGME could analyze county-wide variations in
specialty availability by examining the Area Resource File (a
government database with county-level physician supply
information). These data could be used to make qualitative
judgments about whether geographic differences require policy
intervention. In addition, one of the ways that COGME can deal
with the constraints it faces in the short run is to narrow the
analysis to focus on either major specialty breaks, such as
primary versus nonprimary care specialties, or on selected
specialties that are believed to represent particular problem
areas. However, it would probably not be advisable to attempt to
apply any of the six methods to all of the 40 specialties
considered by GMENAC. Furthermore, given the limitations of the
GMENAC methodology and the changes physician markets since GMENAC
(Luft and Arno, 1986), GMENAC's projected over- and undersupplies
would not be seen as reliable. More importantly, unless the
specific policy questions that COGME wishes to address in its
first report are defined soon, it will be difficult to gather any
systematic information that will be of assistance.
There are a number of ways that COGME can update and revise
previous studies which examined physician specialty imbalances.
The two most comprehensive efforts to date are the GMENAC study
and the model developed by the Bureau of Health Professions
(BHPr). These remain the state-of-the-art efforts in needs-based
and demand-based studies. Since these studies are the results of
extensive efforts to analyze many of the issues that COGME is
charged with addressing, the Council could gain a good deal of
information from them without exhausting many of its own resources.
Both efforts have been described in detail in this paper. It
would be feasible to have experts revise and update GMENAC
projections taking into account problems with that study and
changes which have taken place since those projections were made.
The BHPr model could be useful because the model is up to date
and because it would be possible for the Council to modify
6-2

assumptions made in the model according to meet its own unique
specifications. However, there are limitations to using both
studies, particularly in regard to obtaining information about
geographic maldistribution. In addition, the BHPr requirements
model does not provide information about specialty breakdowns.
Our survey of ongoing and planned studies by professional
societies suggests that these offer little in the way of systematic
modeling results that can assist COGME in the short run. However,
AMA, AAMC, and CMSS all have or can provide some useful
descriptive information from previous or ongoing surveys they
have conducted. For example, the AMA is the best source of
information on the current supply of physicians, as well as
changes in physician incomes over time. If COGME chooses to
undertake some long-term quantitative modeling, then it will be
necessary to investigate the data available from the sources.
Alternatively, given that the AMA is embarking upon a long-term
project to improve its ability to forecast supply and
requirements, COGME may wish to use this information in some
manner.
Given the limitations of the methodologies discussed above,
a prudent approach in both the short and long run is to rely upon
a combination of methods and data sources. It would appear to be
most reasonable to have experts synthesize and review existing
data sources in order to make qualitative judgments about whether
and to what extent physician specialty imbalances exist. Given
this approach, there are two aspects for the Council to consider:
1) what data to use, and 2) what level of review would be most
effective given the time and resource constraints.
In addition to the information it can obtain from the
existing and ongoing studies discussed above, COGME should not
underestimate its ability to obtain useful information from other
interested parties. Specialty societies and many elements in tpe
6-3

research community are interested in the questions the Council is
addressing and are engaged in ongoing efforts to collect and
interpret further information. The key will be for COGME to
solicit the views and information from these sources in a manner
that is targeted at the questions that COGME wishes to address.
If COGME only asks people to discuss their ongoing research, then
the result is likely to be a compendium of information, much of
which is irrelevant for COGME's charge.
6.3 IMPLICATIONS FOR LONG-TERM MODELING
COGME has several options with regard to long-term
quantitative modeling:
1) Develop its own modeling framework and estimation of parameters of the model.
2) Work with the Bureau of Health Professions to modify and expand its modeling capabilities, especially in the requirements area.
3) Adopt the GMENAC framework and use experts and data to re-estimate parameters of the model.
4) Rely on outside organizations such as the AMA and other researchers, to provide projections of requirements supply and future market conditions for physicians.
A prior question to this is, of course, whether or not COGME
thinks the benefits of a single large-scale modeling effort
outweigh the substantial costs. This review has highlighted any
number of limitations of each of the approaches tried in the
past. A major failing of all of them is the inadequate attention
that has been given to issues of locational distribution or, in
other words, geographic maldistribution. In many ways, then,
debate over longer term options resembles the discussion about
the pros and cons of short term options though on a larger scale.
6-4

In any case, while data can assist in analyzing policies, it
is important to carefully consider potential policy issues prior
to collecting and manipulating data. There should be a careful
consideration of the interaction between the data and modeling
efforts pursued and the policy questions to be addressed. Given
the limited time and resources available, it will be important to
select and use only those data that are pertinent.
6.4 OTHER POLICY CONSIDERATIONS
There are two general policy questions that the Council may
want to consider in choosing short- or long-term options for data
analysis.
1) What kinds of policy options would likely be considered by the Council and by Congress?
2) What are the implications of over and undersupplies of physicians?
coordination of the research agenda and the policy questions
addressed here is of the utmost importance. Even if sound
projections could be made at the national level, for example, the
data may not be useful if COGME is interested in examining whether
certain geographic areas or specific populations still have an
undersupply of primary care physicians. This kind of issue
underscores the importance of considering the above questions
before making recommendations about undertaking a short term
study. For example, if the Council, and Congress for that
matter, are primarily interested in whether shortages of primary
care physicians still exist in some geographic regions, it will be
important to collect data on that level (both in terms of the
geographic and specialty breakdown). If, on the other hand, the
Council is more interested in whether imbalances exist in certain
specialties, the data must be collected accordingly.
6-5

Second, it is important to analyze the implications of an
under- or oversupply of physicians. Recently, Harris (1986) makes
the points that 1) considerable uncertainty surrounds any
projection of under- or oversupply and 2) policymakers, in
assessing specialty imbalances, should consider the relative cost
of an oversupply versus an undersupply. He argues that while an
oversupply, almost by definition, tends to increase the cost of
health care, it may be beneficial in terms of improving
geographic access and promoting more efficient delivery systems,
as well as improving financial access through lower prices. The
cost of an oversupply is that the lack of work may tend to
frustrate physicians, lead to greater number of unnecessary
procedures, and reduce work loads to the point where skills of
surgeons, for example, might suffer. He argues that the costs to
society of an undersupply are much greater because it can lead to
problems such as geographic maldistribution and.specific shortages
in the face of unforeseen demands (for example, AIDS) on the
current physician stock. While oversupplies of physicians may
contribute to problems, such as unnecessary care, Harris argues
that benefits of an upside error go to the consumer in the form
of higher quality care, lower prices, and a better geographic
distribution of physicians.
Much ink has been spilled over the question of whether or
not physicians are influenced by market forces. Stated at this
broad level, enough evidence has surely been accumulated to argue
that indeed market forces are a factor. However, perhaps a more
relevant question is the extent to which market forces and
institutions are likely to respond to imbalances in ways that
will signal and promote desirable adjustments. For example, is
there enough flexibility in physician pricing so that falling
incomes in a given specialties will serve as a signal· of sufficient
supply? Indeed, one of the arguments for substantial modeling
efforts such as GMENAC's is that these signals work imperfectly,
at be.st, and that the general information provided by a GMENAC-
6-6

type study is a useful way to influence both individual decisions
about specialty choice and institutional decisions concerning the
size of residency programs. The extent to which existing markets
and institutions are self-correcting is no doubt an issue that
COGME will grapple with over the coming years.
6-7

SECTION 7
REFERENCES
American College of Surgeons. The Dark Side of GMENAC.
Socio-Economic Issues in Surgery -1981.
Applied Management sciences. Refinement of the Health Professions Reauirements Model. Technical Memorandum #4. March 31, 1983.
Applied Management Sciences, Inc. Refinement of the Health Professions Reqµirements Model - Report on Health Manpower Matrix. February 1, 1983.
Bowman, MA; Katzoff, JM; Garrison, LP; et al. "Estimates of Physician Requirements for 1990 for the Specialties of Neurology, Anesthesiology, Nuclear Medicine, Pathology, Physical Medicine and Rehabilitation, and Radiology." Journal of the American Medical Association 250(19):2623-27; November 18, 1983.
Bowman, MA and Walsh, WB, Jr. "Perspectives on the GMENAC Repot:"t. 11 Health Affairs 1(4):55-66; Fall 1982.
Brown, J. and Reid, J. "Are the Manpower Markets for General Practitioners Working? Implications of New Evidence for Geographic Distribution." DHAP Report No. 81-13, Hyattsville, MD. 1981.
Burstein, PL and Cromwell, J. "Relative Incomes and Rates of Return for U.S. Physicians." Journal of Health Economics 4: 63-78; 1985.
Congress of the United States. Office of Technology Assessment. Forecasts of Physician supply and Reqµirements. April 1980.
Dresch, SP. "Marginal Wage Rates, Hours of Work and Returns to Physician Specialization." In Nancy Greenspan, ed., Issues in Physician Reimbursement: Health Care Financing Conference Proceedings. DHHS Publication No. (HCFA) 03121 (Washington, DC: Department of Health and Human Services), 165-200.
Evens, RG; Riemenschneider, PA; and Deffebach, RR. "The Supply of Radiologists: Planning for the Future." Radiology 151(4):253-254; April 1984.
Fein, R and Weber GI. Financing Medical Education: An Analysis of Alternative Policies and Mechanisms (New York:Carnegie Commission on Higher Education; Commonwealth Fund - McGraw Hill). 1971.
7-1

Fein, R. DC:
The Doctor Shortage: An Economic Diagnosis (Washington, Brookings Institution); 1967.
Frank, RG. "Pricing and Location of Physician Services in Mental Health." Economic Inquiry 23(1) :115-133; January 1985.
Friedman, M and Kuznets, s. Income from Independent Professional Practice (New York:National Bureau of Economic Research). 1945.
Glandon, GL and Werner, JL. "Physicians' Practice Experience During the Decade of the 1970s." Journal of the American Medical Association 244:2514-2518; 1980.
Harris, J. "How Many Doctors Are Enough?" Health Affairs 5(4):73-83; Winter 1986.
Hu, T and Yang, BM. "The Demand for and Supply of Physician Services in the U.S.: A Disequilibrium Analysis." Paper presented at the American Economic Association meetings (New York), December 28-30, 1985.
Hixson, J and Mocniak, N. "The Aggregate Supplies and Demands of Physician and Dental Services." The Target Income Hypothesis and Related Issues in Health Manpower Policy. DHEW Publication No. (HRA) 80-27, Hyattsville, MD. 1980.
Iglehart, JK. "How Many Doctors Do We Need?" Journal of the American Medical Association 254 (13) : 1785-88; October 4, 1985.
Iglehart, JK. "Trends in Health Personnel." Health Affairs 5(4):128-137; Winter 1986.
Iglehart, JK. "The Future Supply of Physicians." New England Journal of Medicine 314(13) :860-864; March 27, 1986.
Kessel, R. "Price Discrimination in Medicine." Journal of Law and Economics 1:20-53; October 1958.
Kurtzke, JF; Bennett, DR; Berg, BO; et al. "On National Needs for Neurologists in the United states." Neurology 36(3):383-388; March 1986.
Lanska, MJ; Lanska, DJ; and Rimm, AA. "Effect of Rising Percentage of Female Physicians on Projections of Physician Supply." Journal of Medical Education 59((11 Pt 1):849-855; November 1984.
Lee, RI and Jones, LW. The Fundamentals of Good Medical Care (Chicago:University of Chicago Press). 1933.
7-2

Leffler, KB. "Physician American Medicine." Spring 1978.
Licensure: Competition and Monopoly in Journal of Law and Economics 21:165-186;
Leffler, KB and Education: Journal of
Lindsay, CM. "Markets for Medical An Integrated Long-Run Structural
Human Resources 16(1) :20-40; 1979.
Care and Medical Approach. " The
LeRoy, L; Iglehart, JK; and Ellwood, DA. "Trends in Health Manpower." Health Affairs 4(4):77-90; 1985.
Lindsay, CM. "Real Returns to Medical Education." Journal of Human Resources 8:331-348; summer 1973.
Lindsay, CM. "More Real Returns toMedical Education." Journal of Human Resources 11:127-130; Winter 1976.
Lomas, J; Stoddart, GL; and Barer, ML. "Supply Projections as Planning: A Critical Review of Forecasting Net Physician Requirements in Canada." Social Science and Medicine 20(4):411-424; 1985.
Luft, HS and Arno, P. "Impact Scenario for the Future." 1986.
of Increasing Physician Supply: A Health Affairs 5(4):31-62; Winter
Mason, HR. "Manpower Needs by Specialty." Journal of the =A=m=e=r=i=c=a=n~=M=e=d=i=c=a=l~A~s=s=o=c=i=a=t=i='=o=n 219(12):1621-1626; March 20, 1972.
McNutt, DR. "GMENAC: Its Manpower Forecasting Framework." =A=m=e=r=i=c=a=n~=J=o=u=r=n=a=l~=o=f~P~u=b=l=i=·c~=H=e=a=l=t~h 71(10):1116-1124; October 1981.
Mick, SS and Worobey, JL. "Foreign Medical Graduates in the 1980s: Trends in Specialization." American Journal of Public Health 74(7):698-703; July 1984.
Misek, G. "Longitudinal Study of Surgical Residents, 1985-86. 11
Published by the American College of Surgeons. 1986.
Newhouse, JP; Williams, AP; Bennett, BW; et al. the Doctors Gone?" Journal of the American Association 247(17):2392-2396; May 7, 1982.
Noether, M. "The Growing Supply of Physicians: Become More competitive?" Journal of Labor 4(4):503-537; 1986.
"Where Have All Medical
Has the Market Economics
O'Doherty, OS. "National Need for Neurologists: Commentary on the GMENAC Report." Neurology 34(9) :1228-30; September 1984.
7-3

Reinhardt, UE. "The GMENAC Forecast: An Alternative View." American Journal of Public Health 71:1149-57; 1981.
scitovsky, AA and McCall, N. "A Method of Estimating Physician Requirements." Milbank Memorial Fund Quarterly 54(3):299-320; Summer 1976.
Sloan, FA and Schwartz, WB. "More Doctors: What Will They Cost? Physician Income as Supply Expands." Journal of the American Medical Association 249(6) :766-769; February 11, 1983.
Sloan, FA. "Real Returns to Medical Education: A comment." Journal of Human Resources 11:118-126; Winter 1976.
Steinwachs, DM; Weiner, JP; Shapiro, S; et al. "A Comparison of the Requirements for Primary Care Physicians in HMOs with Projections Made by the GMENAC. 11 New England Journal of Medicine 314(4):217-222; January 1986.
Tarlov, AR. "HMO Enrollment Growth and Physicians: The Third Compartment." Health Affairs 5(1) :23-35; Spring 1986.
U.S. Department of Health and Human Services. Bureau of Health Professions. A Review of Health Professions Requirements Studies. March 1986.
u.s. Department of Health and Human Services. Health Resources Administration. The Health Professions Requirements Model -Structure and Application. DHHS Publication No. (HRA} 81-15.
U.S. Department of Health and Human Services. Health Resources and Services Administration. Fifth Report to the President and Congress on the Status of Health Personnel in the United states. March 1986.
U.S. Department of Health and Human Services. Health Resources and Services Administration. Report to the President and Congress on the status of Health Personnel in the United States. DHHS Publication No. HRS-P-OD 84-4. May 1984.
u.s. Department of Health and Human Services. Health Resources Administration. Bureau of Health Professions. Third Reoort to the President & Congress on the Status of Health Professions Personnel in the United States. DHHS Publication No. (HRA} 82-2. January 1982.
U.S. Department of Health and Human Services. ·Health Resources Administration. Bureau of Health Professions. Implications of the Proiected Doctor "Surplus": summary of Important Findings from Four Recent Studies. March 27, 1981.
7-4

U.S. Department of Health and Human Services. Health Resources Administration. Summary Report of the Graduate Medical Education National Advisory Committee to the Secretary. Department of Health and Human Services. Vol. I. September 30, 1980.
U.S. Department of Health and Human Services. Health Resources Administration. Report of the Graduate Medical Education National Advisory Committee to the Secretary. Department of Health and Human Services. Volume III - Geographic Distribution Technical Panel. DHHS Publication No. (HRA) 81-653. 1980.
U.S. Department of Health, Education and Welfare. Health Resources Administration. Policy Analysis for Physician Manpower Planning. DHEW Publication No. (HRA) 78-2. May 1977.
Weiner, JP; steinwachs, DM; and Williamson, JW. "Nurse Practitioner and Physician Assistant Practices in Three HMOs: Implications for Future us Health Manpower Needs." American Journal of Public Health 76(5):507-511; May 1986.
Williams AP; Schwartz WB; Newhouse JP; et al. "How Many Miles to the Doctor?" The New England Journal of Medicine 309(16):958-963; October 20, 1983.
Williams, DC. "Surgery and the GMENAC Report: A Reality Test." Surgery 95(3) :347-352; March 1984.
7-5