Assessing Parameters for Computations in Rock Mechanics
17
Assessing Parameters for Computations in Rock Mechanics P.J.N Pells Pells Sullivan Meynink Pty Ltd, Australia Abstract Estimation of rock mass stiffness and shear strength parameters is fundamental to the validity of most applied mechanics calculations for rock mechanics design pur poses. Estimation of such parameters is very difficult and has to be based on rock mass characterisation. Currently the Hoek–Brown approach u sing GSI is widely used for assess ing stiffness and shear strength parameters. However, there appear to be few test data to support the parameters determined using this method. This paper presents case studies for both roc k mass modulus and rock mass shear strength in an attempt to assess the validity of the approach of using GSI and the Hoek–Brown criterion. It is concluded that for some rock mas ses the method w orks well, but in other cases can give very misleading assessments of stiffness and shear strength parameters. It is also concluded that further work is required in collecting and analysing good case studies in order to provide guidelines for the profession. 1 Introduction In a paper presented earlier this year to the Sixth International Symposium on Ground Support in Mining and Civil Engineering Construction, the author presented his reservations in respect to the direction being taken by practitioners in rock mechanics and engineering geology (Pells, 2008). The gist of the paper is summarise d by its abstract which is as follows: “A good thing is becoming a bad thing. Rock mass classification syst ems, that are so excellent for communications between engineers and geologists, and that can be valuable in categorising project experience, are emasculating engine ering geology and rock mechan ics. Some engineering geologists have been sucked in to thinking that Q and RMR values are all that is needed for engineering purposes, and seem to have put aside what can be learned from structural geology and geomorphology. Many roc k mechanics engineers see m to have forgotten the scientific method. This paper attempts to redress the situation by showing how mechanics can be used in rock engineering to design with a similar rigor to that used in the fields of structural engineering, hydraulics and soil mechanics. It also attempts to remind practitioners of what can be achieved by skilled engineering geology.” Along a similar vein, Palmstrom and Broch presented a paper in 2006 expressing certain reservations regarding the use of rock mass classification syste ms (Palmstrom and Broc h, 2006). Arising out of that paper Pells and Bertuzzi (2008) submitted a discussion based on factual data from 13 major tunnels and caverns, ten of which are in Sydney, two in Melbourne and one in Brisbane. The conclusion from those case studies is encapsulated in the following paragraph from the published discussion: “Over the past 15 years we have collected data from many of the major civil engineering tunnel and cavern projects in Australia. This information has caused us concern in r egard to the application of Barton’s Q-system and Bieniawski’s RMR system in support design, because there is clear evidence that the support deduced from the classification system may be substantially non -conservative. In this discussion we provided the factual information that has lead to our concern and to our recommendations that these classification systems should not be used for anything other than feasibility level assessments.” Not everyone agrees with the above views, but from the feedback that has come in from several parts of the world, and from a reading of Dick Goodman’s Riedmüller Memorial Lecture (2007), it is clear that the author is not alone in his concerns. It is appropriate to turn from criticism to doing someth ing positive about these concerns. This paper is a small step in that direction.
-
Upload
hugojameswood -
Category
Documents
-
view
223 -
download
0
Transcript of Assessing Parameters for Computations in Rock Mechanics
8/12/2019 Assessing Parameters for Computations in Rock Mechanics
http://slidepdf.com/reader/full/assessing-parameters-for-computations-in-rock-mechanics 1/17
Assessing Parameters for Computations in Rock Mechanics
P.J.N Pells Pells Sullivan Meynink Pty Ltd, Australia
Abstract
Estimation of rock mass stiffness and shear strength parameters is fundamental to the validity of most
applied mechanics calculations for rock mechanics design purposes. Estimation of such parameters is very
difficult and has to be based on rock mass characterisation. Currently the Hoek–Brown approach using GSI
is widely used for assessing stiffness and shear strength parameters. However, there appear to be few test
data to support the parameters determined using this method. This paper presents case studies for both rock
mass modulus and rock mass shear strength in an attempt to assess the validity of the approach of using GSI
and the Hoek–Brown criterion. It is concluded that for some rock masses the method works well, but in
other cases can give very misleading assessments of stiffness and shear strength parameters. It is also
concluded that further work is required in collecting and analysing good case studies in order to provideguidelines for the profession.
1 Introduction
In a paper presented earlier this year to the Sixth International Symposium on Ground Support in Mining andCivil Engineering Construction, the author presented his reservations in respect to the direction being taken
by practitioners in rock mechanics and engineering geology (Pells, 2008). The gist of the paper is
summarised by its abstract which is as follows:
“A good thing is becoming a bad thing. Rock mass classification systems, that are so excellent for
communications between engineers and geologists, and that can be valuable in categorising project
experience, are emasculating engineering geology and rock mechanics. Some engineering geologists
have been sucked in to thinking that Q and RMR values are all that is needed for engineering purposes, and seem to have put aside what can be learned from structural geology and
geomorphology. Many rock mechanics engineers seem to have forgotten the scientific method. This
paper attempts to redress the situation by showing how mechanics can be used in rock engineering to
design with a similar rigor to that used in the fields of structural engineering, hydraulics and soil
mechanics. It also attempts to remind practitioners of what can be achieved by skilled engineering
geology.”
Along a similar vein, Palmstrom and Broch presented a paper in 2006 expressing certain reservationsregarding the use of rock mass classification systems (Palmstrom and Broch, 2006). Arising out of that paper Pells and Bertuzzi (2008) submitted a discussion based on factual data from 13 major tunnels andcaverns, ten of which are in Sydney, two in Melbourne and one in Brisbane. The conclusion from those case
studies is encapsulated in the following paragraph from the published discussion:
“Over the past 15 years we have collected data from many of the major civil engineering tunnel and
cavern projects in Australia. This information has caused us concern in regard to the application of
Barton’s Q-system and Bieniawski’s RMR system in support design, because there is clear evidence
that the support deduced from the classification system may be substantially non-conservative. In this
discussion we provided the factual information that has lead to our concern and to our
recommendations that these classification systems should not be used for anything other than
feasibility level assessments.”
Not everyone agrees with the above views, but from the feedback that has come in from several parts of theworld, and from a reading of Dick Goodman’s Riedmüller Memorial Lecture (2007), it is clear that theauthor is not alone in his concerns.
It is appropriate to turn from criticism to doing something positive about these concerns. This paper is asmall step in that direction.
8/12/2019 Assessing Parameters for Computations in Rock Mechanics
http://slidepdf.com/reader/full/assessing-parameters-for-computations-in-rock-mechanics 2/17
It is unlikely that the author will be convinced that proper design can be done directly using rock massclassification systems. However, assessment of engineering parameters for analytical design has to be basedon some form of rock mass categorisation. Therefore this paper addresses predictions of modulus andstrength using rock mass classification as per the Hock–Brown approach. These parameters are required forapplied mechanics design and analysis, of which there are many examples in the literature going back to the pioneering work of people like Muller, Jaeger, Cook, Hoek and Brown. Several examples of design methodsusing proper applied mechanics are given in the earlier paper this year (Pells, 2008). Notwithstanding thefact that it is a bad principle to repeat material that has already been published, one section from that paper isrepeated in Section 2, below, because it represents material which was published some years ago but with
errors in some of the equations subsequently picked up by Carter (2003). It is important that this material be properly disseminated in its correct form.
2 Mechanics of support design in horizontal bedded strata
2.1 Scope of application
In many parts of the world there occur near horizontally bedded strata of sandstones and shales wherein, to
depths of several hundred metres, the natural horizontal stresses are higher than overburden pressure.Examples include the Karoo beds of South Africa, the Bunter Sandstone of the UK and the Triassic strata of
the Sydney region.
2.2 Fundamentals
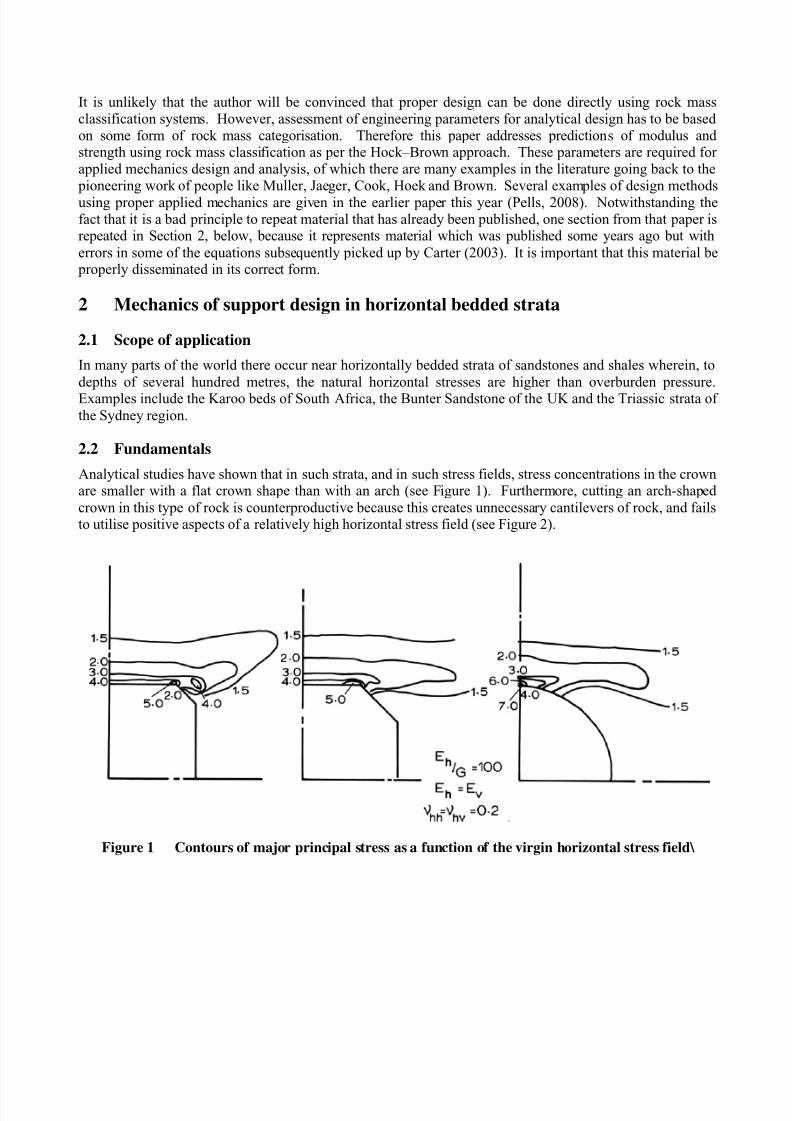
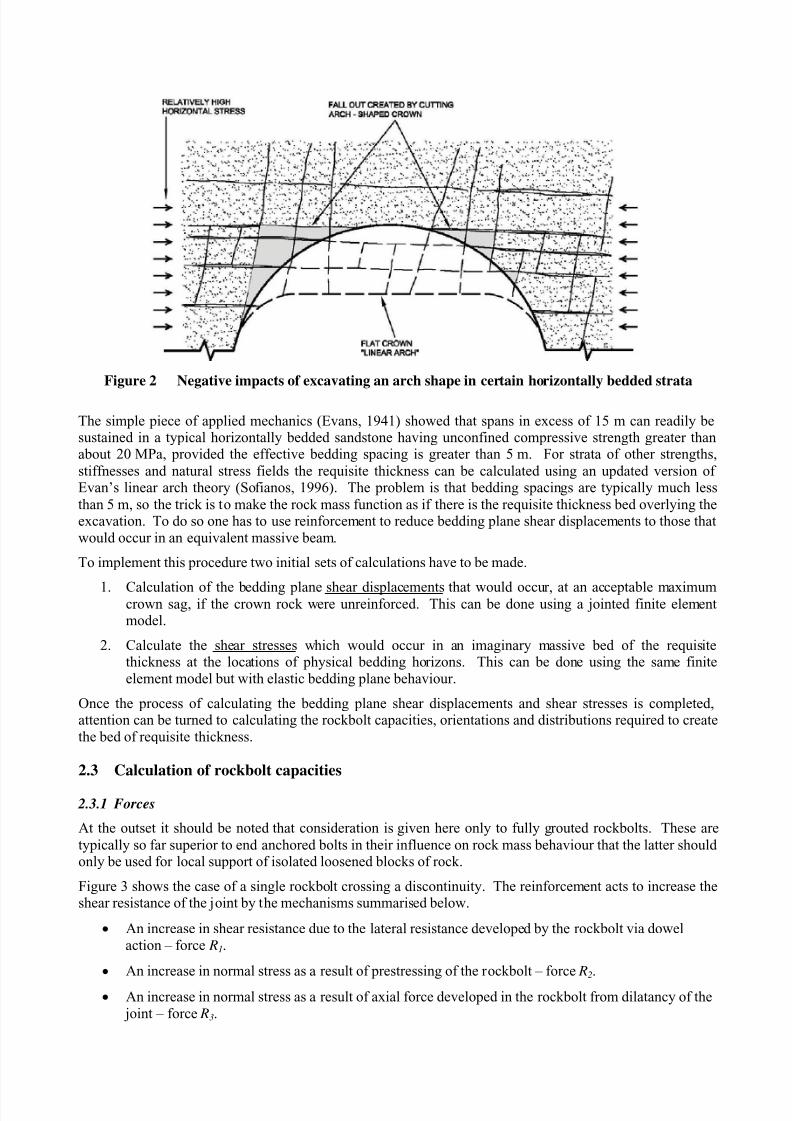
Analytical studies have shown that in such strata, and in such stress fields, stress concentrations in the crownare smaller with a flat crown shape than with an arch (see Figure 1). Furthermore, cutting an arch-shaped
crown in this type of rock is counterproductive because this creates unnecessary cantilevers of rock, and failsto utilise positive aspects of a relatively high horizontal stress field (see Figure 2).
Figure 1 Contours of major principal stress as a function of the virgin horizontal stress field\
8/12/2019 Assessing Parameters for Computations in Rock Mechanics
http://slidepdf.com/reader/full/assessing-parameters-for-computations-in-rock-mechanics 3/17
Figure 2 Negative impacts of excavating an arch shape in certain horizontally bedded strata
The simple piece of applied mechanics (Evans, 1941) showed that spans in excess of 15 m can readily besustained in a typical horizontally bedded sandstone having unconfined compressive strength greater thanabout 20 MPa, provided the effective bedding spacing is greater than 5 m. For strata of other strengths,
stiffnesses and natural stress fields the requisite thickness can be calculated using an updated version ofEvan’s linear arch theory (Sofianos, 1996). The problem is that bedding spacings are typically much less
than 5 m, so the trick is to make the rock mass function as if there is the requisite thickness bed overlying theexcavation. To do so one has to use reinforcement to reduce bedding plane shear displacements to those thatwould occur in an equivalent massive beam.
To implement this procedure two initial sets of calculations have to be made.
1. Calculation of the bedding plane shear displacements that would occur, at an acceptable maximumcrown sag, if the crown rock were unreinforced. This can be done using a jointed finite elementmodel.
2. Calculate the shear stresses which would occur in an imaginary massive bed of the requisitethickness at the locations of physical bedding horizons. This can be done using the same finiteelement model but with elastic bedding plane behaviour.
Once the process of calculating the bedding plane shear displacements and shear stresses is completed,attention can be turned to calculating the rockbolt capacities, orientations and distributions required to createthe bed of requisite thickness.
2.3 Calculation of rockbolt capacities
2.3.1 Forces
At the outset it should be noted that consideration is given here only to fully grouted rockbolts. These are
typically so far superior to end anchored bolts in their influence on rock mass behaviour that the latter shouldonly be used for local support of isolated loosened blocks of rock.
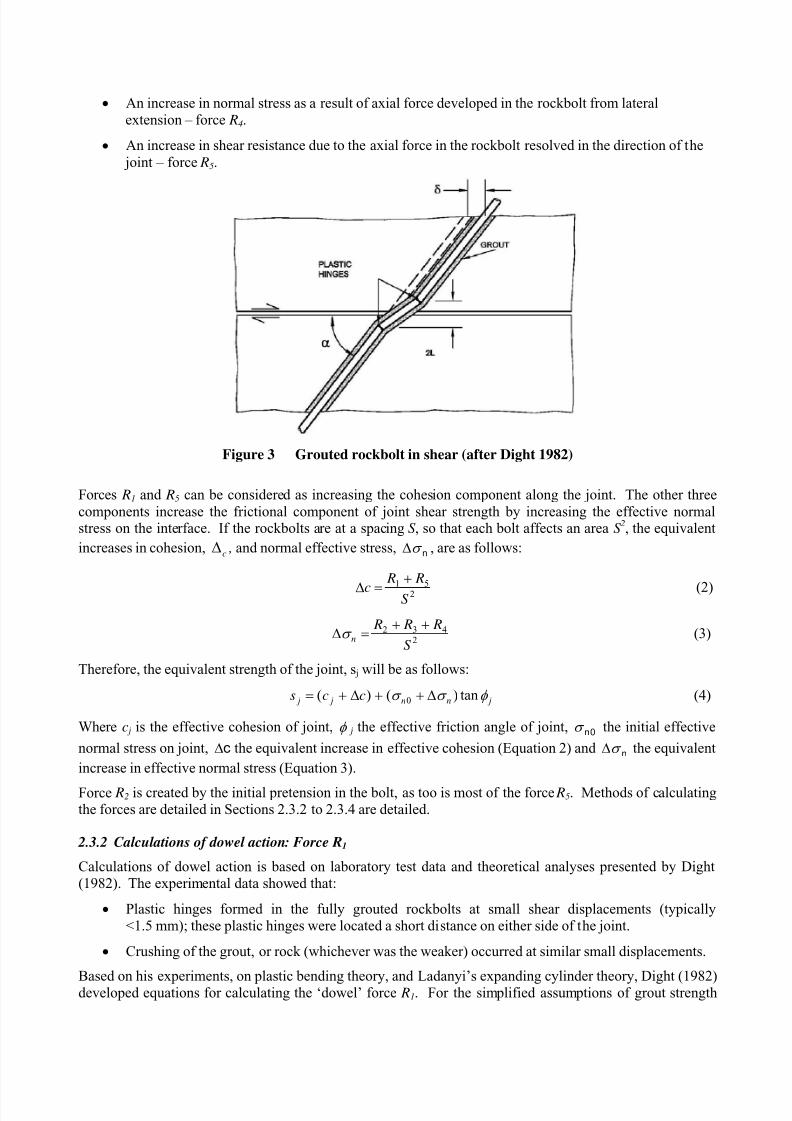
Figure 3 shows the case of a single rockbolt crossing a discontinuity. The reinforcement acts to increase theshear resistance of the joint by the mechanisms summarised below.
• An increase in shear resistance due to the lateral resistance developed by the rockbolt via dowelaction – force R1.
• An increase in normal stress as a result of prestressing of the rockbolt – force R2.
• An increase in normal stress as a result of axial force developed in the rockbolt from dilatancy of the joint – force R3.
8/12/2019 Assessing Parameters for Computations in Rock Mechanics
http://slidepdf.com/reader/full/assessing-parameters-for-computations-in-rock-mechanics 4/17
• An increase in normal stress as a result of axial force developed in the rockbolt from lateralextension – force R4.
• An increase in shear resistance due to the axial force in the rockbolt resolved in the direction of the
joint – force R5.
Figure 3 Grouted rockbolt in shear (after Dight 1982)
Forces R1 and R5 can be considered as increasing the cohesion component along the joint. The other three
components increase the frictional component of joint shear strength by increasing the effective normalstress on the interface. If the rockbolts are at a spacing S , so that each bolt affects an area S 2, the equivalent
increases in cohesion, c∆ , and normal effective stress, nσ ∆ , are as follows:
251
S
R R
c
+
=∆ (2)
2432
S
R R Rn
++=∆σ (3)
Therefore, the equivalent strength of the joint, s j will be as follows:
jnn j j ccs φ σ σ tan)()( 0 ∆++∆+= (4)
Where c j is the effective cohesion of joint, φ j the effective friction angle of joint,0nσ the initial effective
normal stress on joint, c∆ the equivalent increase in effective cohesion (Equation 2) and nσ ∆ the equivalent
increase in effective normal stress (Equation 3).
Force R2 is created by the initial pretension in the bolt, as too is most of the force R5. Methods of calculatingthe forces are detailed in Sections 2.3.2 to 2.3.4 are detailed.
2.3.2 Calculations of dowel action: Force R1
Calculations of dowel action is based on laboratory test data and theoretical analyses presented by Dight(1982). The experimental data showed that:
• Plastic hinges formed in the fully grouted rockbolts at small shear displacements (typically<1.5 mm); these plastic hinges were located a short distance on either side of the joint.
• Crushing of the grout, or rock (whichever was the weaker) occurred at similar small displacements.
Based on his experiments, on plastic bending theory, and Ladanyi’s expanding cylinder theory, Dight (1982)developed equations for calculating the ‘dowel’ force R1. For the simplified assumptions of grout strength
8/12/2019 Assessing Parameters for Computations in Rock Mechanics
http://slidepdf.com/reader/full/assessing-parameters-for-computations-in-rock-mechanics 5/17
equal to or less than the rock, and for the joint having no infill, the equations, with corrections by Carter(2003), are:
−=
2
y
uy
2
1T
T1πP1.7σ
4
DR (5)
where
( )
2A
cu2δπDK
δσP
+= (6)
φ
φ
sin1
sin2
+= A (7)
( )
−−
−+
−
−=
E
P
P p E
vK t t o
t
c
t o
cc
σ σ ν
σ
σ
σ
σ σ
2
22ln
1
0
2
(8)
and where
y y T ,σ = yield stress and yield force in the bolt
cσ = unconfined compressive strength of the rock
t σ = tensile strength of the rock
φ = internal angle of friction of the rock
E ,ν = elastic constraints of the rock
P0 = initial stress in the rock in the plane
δ = shear displacement of the joint
T = initial bolt pretension
The term in the square brackets in Equation 5 allows for the effect on the plastic moment of the tensile forcein the bar.
2.3.3 Calculation of axial forces due to joint dilation (R 3 ) and due to bolt extension caused by shearing
(R 4 )
If the assumption is made that in a fully grouted rockbolt the incremental axial strain in the bolt isdominantly between the two plastic hinges (see Figure 7) then the normal force generated by dilation is:
α δ π 3
2
3 sin
2
tan
4
=
L
i E D R
s (9)
Where:
α = angle between bolt and bedding plane
i = dilation angle
The axial force due to lengthening is:
1cos2
sintan
2
4 −
+
=γ
α δ α
L
L
R (10)
8/12/2019 Assessing Parameters for Computations in Rock Mechanics
http://slidepdf.com/reader/full/assessing-parameters-for-computations-in-rock-mechanics 6/17
+= −
α δ
α γ
tan2
tan2tan 1
L
L (11)
2.3.4 Components due to bolt prestressing: forces R 2 and R 5
If a bolt is prestressed to a force Pst prior to grouting then the normal force on the joint is:
R2 = Pst sin
− −
L2tan 1 δ α (12)
and the force along the joint is
R5 = Pst cos
− −
L2tan
1 δ α (13)
Strictly R2 should be modified by R3 and R4 but this is a second order effect.
Equations 9 to 13 presume that rockbolts are inclined so that movements on bedding planes increase their
effectiveness.
2.3.5 Relative Importance of the forces R1 to R 5
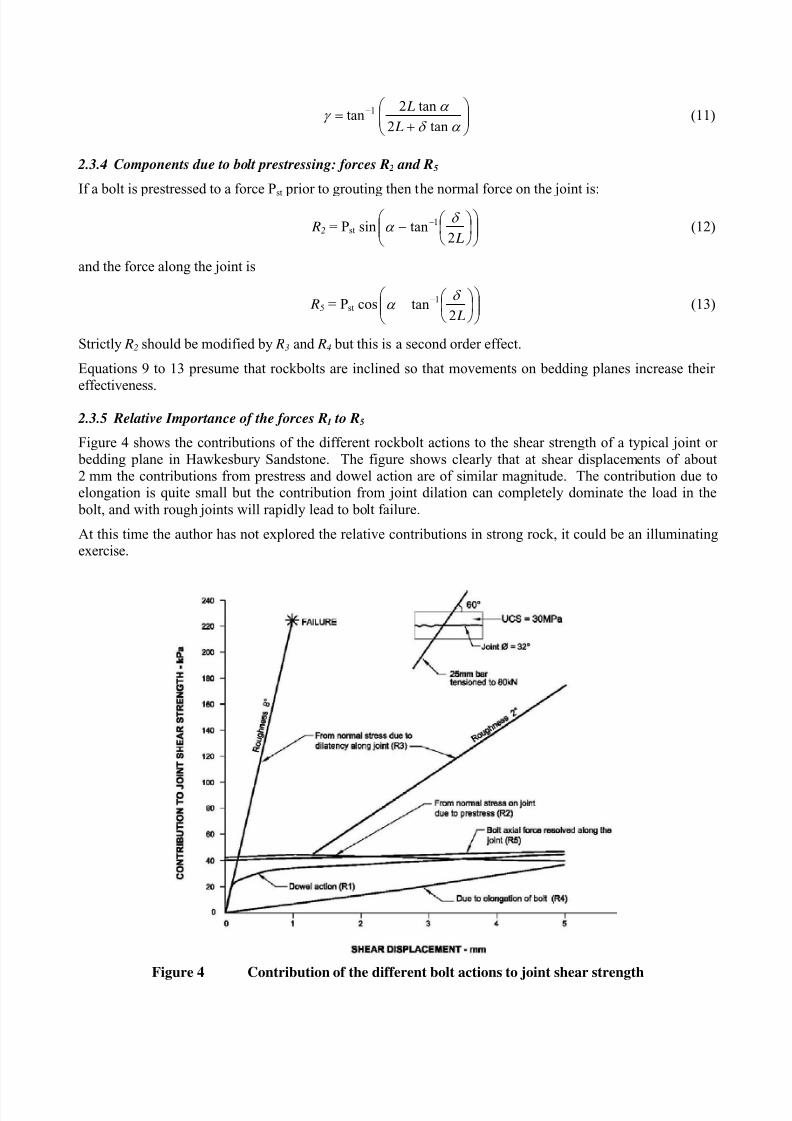
Figure 4 shows the contributions of the different rockbolt actions to the shear strength of a typical joint or bedding plane in Hawkesbury Sandstone. The figure shows clearly that at shear displacements of about2 mm the contributions from prestress and dowel action are of similar magnitude. The contribution due toelongation is quite small but the contribution from joint dilation can completely dominate the load in the
bolt, and with rough joints will rapidly lead to bolt failure.
At this time the author has not explored the relative contributions in strong rock, it could be an illuminatingexercise.
Figure 4 Contribution of the different bolt actions to joint shear strength
8/12/2019 Assessing Parameters for Computations in Rock Mechanics
http://slidepdf.com/reader/full/assessing-parameters-for-computations-in-rock-mechanics 7/17
2.4 Design of rockbolt layout to create the requisite linear arch
2.4.1 Rockbolt length
The bolt length is usually taken as the required linear arch thickness plus 1 m. This presumes there to be a physical bedding plane just below the upper surface of the nominated linear arch and is intended to allow
sufficient bond length for mobilisation of bolt capacity at this postulated plane.
2.4.2 Rockbolt density
The design process is iterative because of the following variables in regard to the bolts alone:
• Bolt capacity – a function of diameter and bolting material (typically either 400 MPa reinforcingsteel, or 950 MPa steel associated with Macalloy/VSL/Diwidag bars).
• Bolt inclination.
• Bolt spacing across and along the tunnel.
Typically, for tunnels of spans up to about 12 m, use is made of standard rockbolt steel (nominally
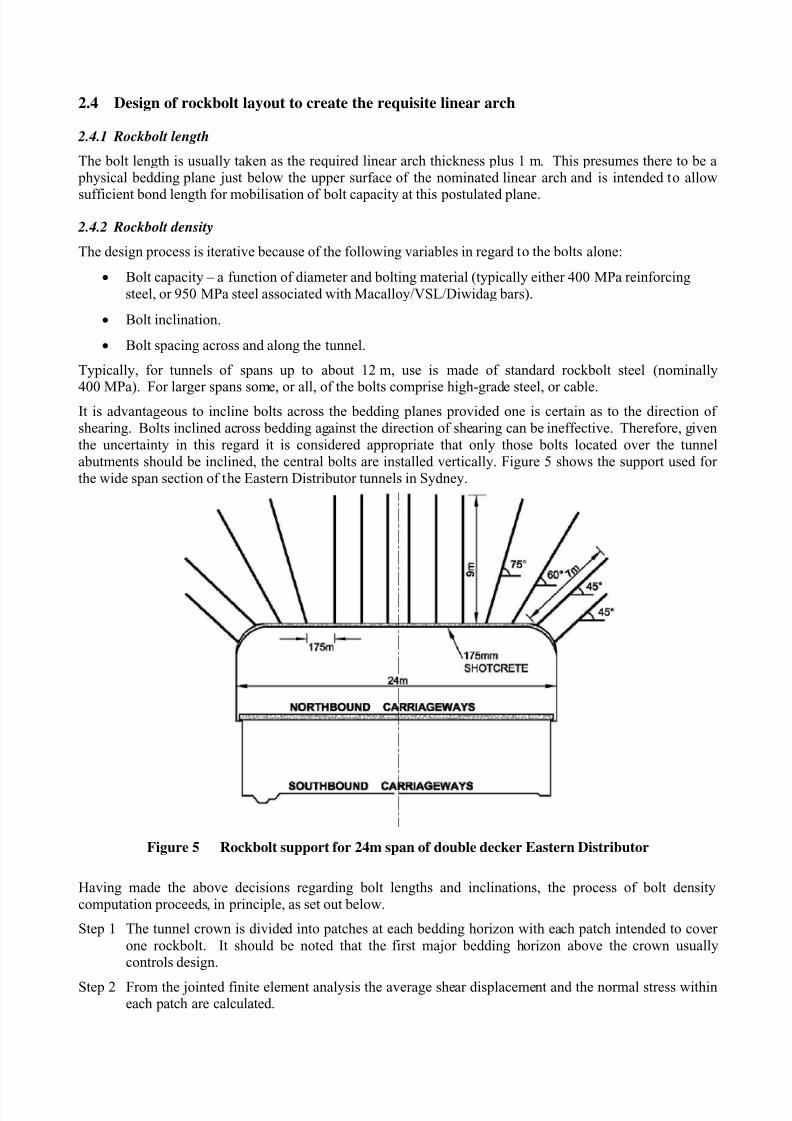
400 MPa). For larger spans some, or all, of the bolts comprise high-grade steel, or cable.It is advantageous to incline bolts across the bedding planes provided one is certain as to the direction ofshearing. Bolts inclined across bedding against the direction of shearing can be ineffective. Therefore, giventhe uncertainty in this regard it is considered appropriate that only those bolts located over the tunnelabutments should be inclined, the central bolts are installed vertically. Figure 5 shows the support used forthe wide span section of the Eastern Distributor tunnels in Sydney.
Figure 5 Rockbolt support for 24m span of double decker Eastern Distributor
Having made the above decisions regarding bolt lengths and inclinations, the process of bolt densitycomputation proceeds, in principle, as set out below.
Step 1 The tunnel crown is divided into patches at each bedding horizon with each patch intended to cover
one rockbolt. It should be noted that the first major bedding horizon above the crown usuallycontrols design.
Step 2 From the jointed finite element analysis the average shear displacement and the normal stress withineach patch are calculated.
8/12/2019 Assessing Parameters for Computations in Rock Mechanics
http://slidepdf.com/reader/full/assessing-parameters-for-computations-in-rock-mechanics 8/17
Step 3 A rockbolt type (diameter, material, inclination) is selected for a patch and the forces R1 to R5 arecalculated as per the equations given earlier.
Step 4 Using the values of R1 to R5 and the normal stress from Step 2, the shear strength of the bolted patch
is calculated ( strengthτ ).
Step 5 The average shear stress ( appliedτ ) in the same patch is computed from the elastic finite elementanalyses.
Step 6 The “factor of safety” against shearing within each patch is defined as:
FOS = appliedstrength τ τ /
It is required that each patch have a FOS≥ 1.2 although it may be found that one or two patches on some joints have lower factors of safety.
3 Estimating rock mass modulus
3.1 Validity of predictions based on classification
Assessment of rock mass modulus values is critical to the analytical method presented above, and in any problem where an attempt is being made to predict displacements.
In the early years of rock mechanics, prior to 1980, many large-scale, project specific, in situ tests wereconducted to measure modulus values. These included pressure chamber tests and large scale plate loadingtests. It was also realised, early on, that modulus and in situ stress values could be back figured from tunnel
monitoring data (Pells et al., 1981).
Many of these test data were used by Deere and his co-workers to formulate a modulus reduction factor(ratio of mass modulus to substance modulus) as a function of RQD (see Bieniawski, 1984).
Nowadays, very many engineers who need a mass modulus value, fire up the free program RocLAB on their
computer, assess a GSI value, and accept the computed mass modulus value. The question has to be asked;how reliable are the RocLAB predictions?
To assist in answering this question test results have been collated from direct experience where the author
has the raw data and is confident as to the approximately correct mass modulus values. These are comparedwith values computed from RocLAB.
3.2 Comparison on measured and predicted values in Hawkesbury Sandstone
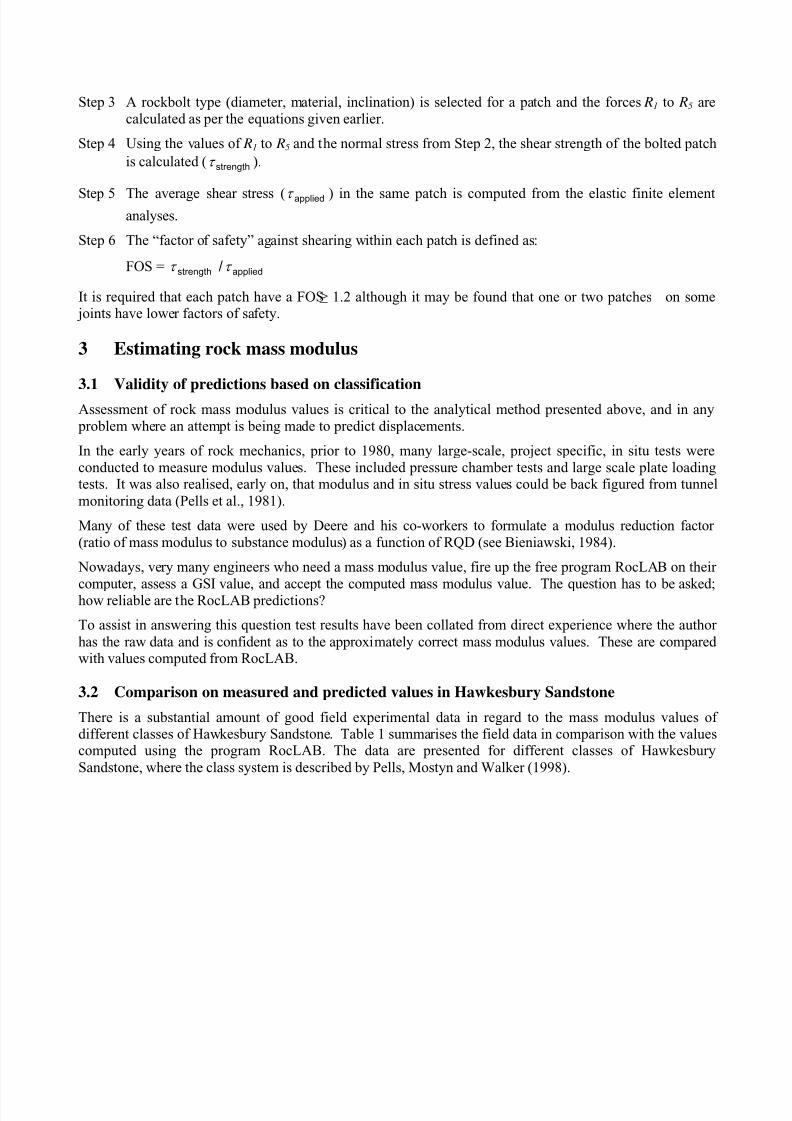
There is a substantial amount of good field experimental data in regard to the mass modulus values ofdifferent classes of Hawkesbury Sandstone. Table 1 summarises the field data in comparison with the valuescomputed using the program RocLAB. The data are presented for different classes of Hawkesbury
Sandstone, where the class system is described by Pells, Mostyn and Walker (1998).
8/12/2019 Assessing Parameters for Computations in Rock Mechanics
http://slidepdf.com/reader/full/assessing-parameters-for-computations-in-rock-mechanics 9/17
Table 1 Field mass modulus values for Hawkesbury Sandstone
Class GSI Measured Field
Values MPa
RocLAB Prediction
MPa
I ≈ 75 1500–2500 21,000
II ≈ 65 1000–1500 12,000
III ≈ 55 500–1000 6500
Note: Measured field values from:
Poulos, Best and Pells (1993) Australian Geomechanics Journal, 24, p97
Clarke and Pells (2004) 9th Aust-NZ Geomechanics Conference, Auckland
Pells, Rowe and Turner (1980) Structural Foundations on Rock, Balkema
Pells (1990) 7th Australian Tunnelling Conference, IE Aust, Sydney
It can be seen from the results in Table 1 that the rock mass modulus values for Hawkesbury Sandstone,
predicted using RocLab, are too high by about an order of magnitude.
3.3 Test data from other rock types
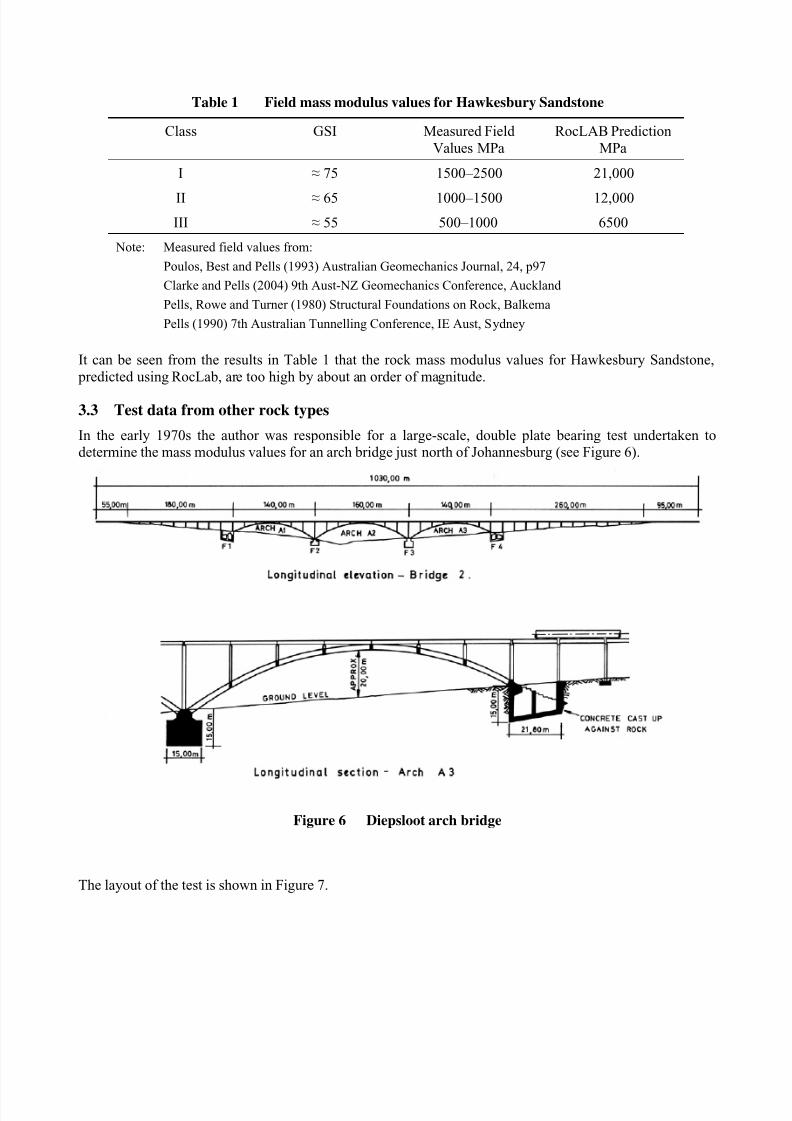
In the early 1970s the author was responsible for a large-scale, double plate bearing test undertaken todetermine the mass modulus values for an arch bridge just north of Johannesburg (see Figure 6).
Figure 6 Diepsloot arch bridge
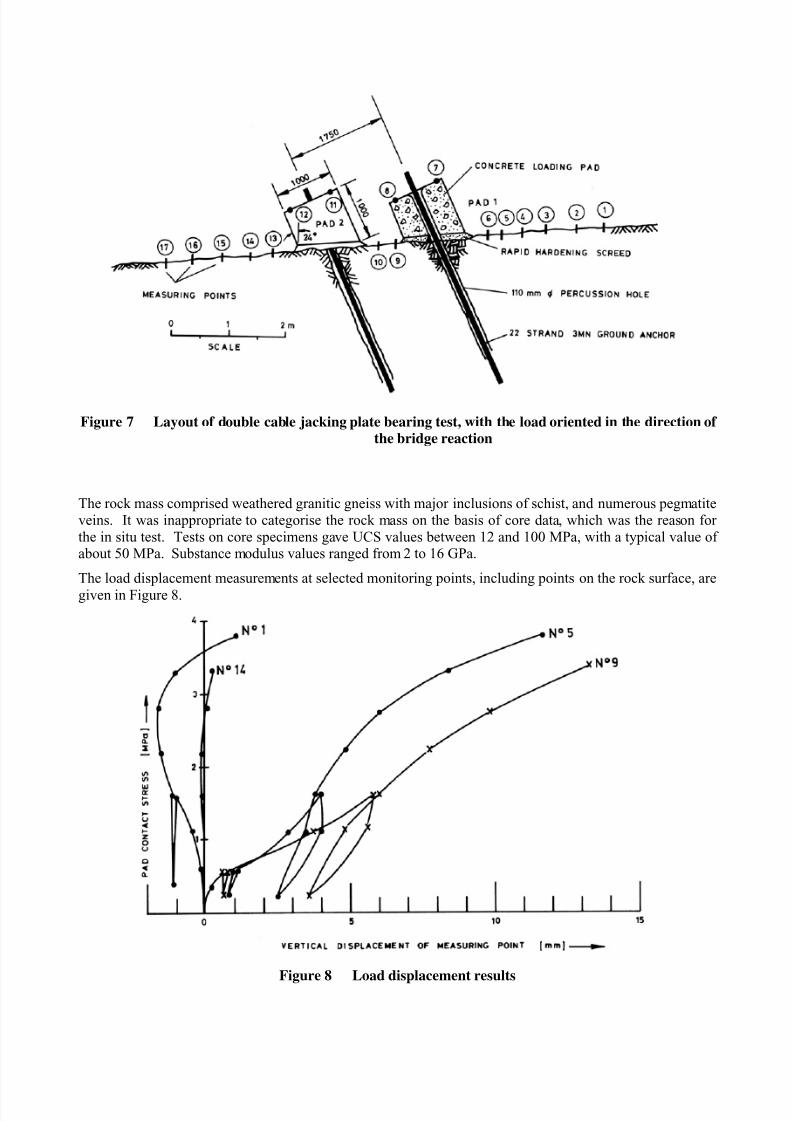
The layout of the test is shown in Figure 7.
8/12/2019 Assessing Parameters for Computations in Rock Mechanics
http://slidepdf.com/reader/full/assessing-parameters-for-computations-in-rock-mechanics 10/17
Figure 7 Layout of double cable jacking plate bearing test, with the load oriented in the direction of
the bridge reaction
The rock mass comprised weathered granitic gneiss with major inclusions of schist, and numerous pegmatiteveins. It was inappropriate to categorise the rock mass on the basis of core data, which was the reason forthe in situ test. Tests on core specimens gave UCS values between 12 and 100 MPa, with a typical value ofabout 50 MPa. Substance modulus values ranged from 2 to 16 GPa.
The load displacement measurements at selected monitoring points, including points on the rock surface, are
given in Figure 8.
Figure 8 Load displacement results
8/12/2019 Assessing Parameters for Computations in Rock Mechanics
http://slidepdf.com/reader/full/assessing-parameters-for-computations-in-rock-mechanics 11/17
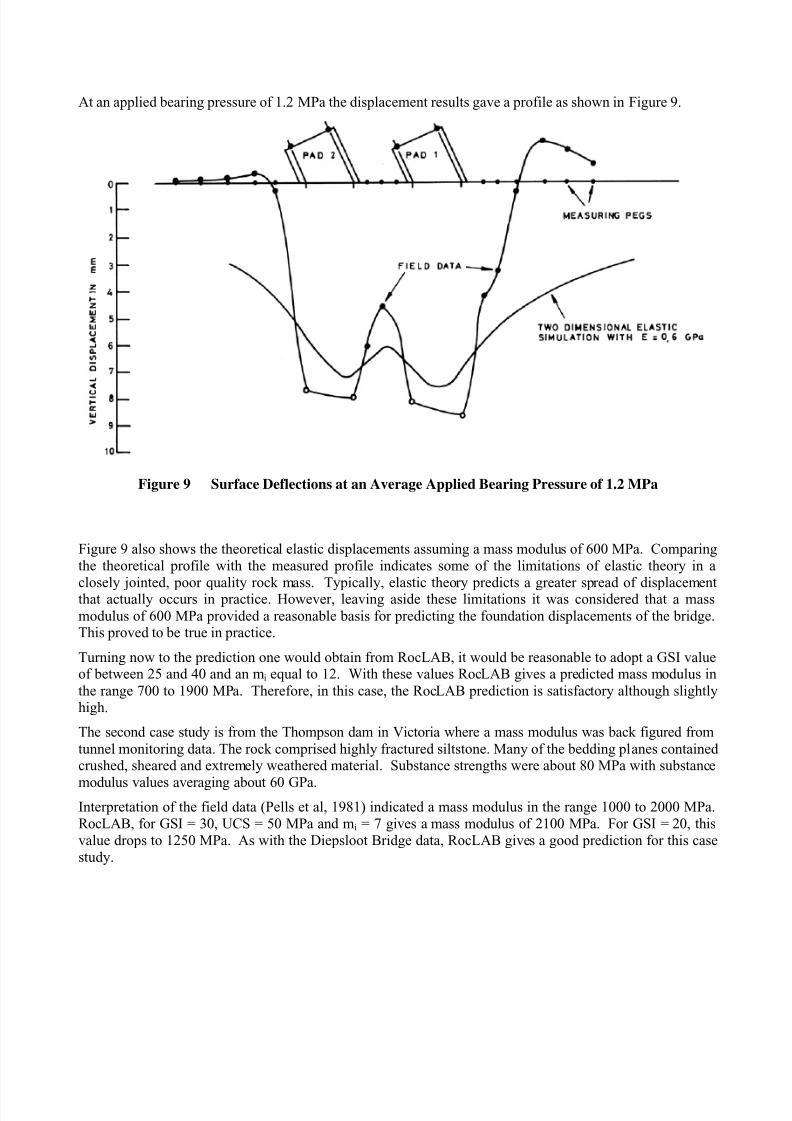
At an applied bearing pressure of 1.2 MPa the displacement results gave a profile as shown in Figure 9.
Figure 9 Surface Deflections at an Average Applied Bearing Pressure of 1.2 MPa
Figure 9 also shows the theoretical elastic displacements assuming a mass modulus of 600 MPa. Comparingthe theoretical profile with the measured profile indicates some of the limitations of elastic theory in a
closely jointed, poor quality rock mass. Typically, elastic theory predicts a greater spread of displacementthat actually occurs in practice. However, leaving aside these limitations it was considered that a mass
modulus of 600 MPa provided a reasonable basis for predicting the foundation displacements of the bridge.This proved to be true in practice.
Turning now to the prediction one would obtain from RocLAB, it would be reasonable to adopt a GSI valueof between 25 and 40 and an mi equal to 12. With these values RocLAB gives a predicted mass modulus in
the range 700 to 1900 MPa. Therefore, in this case, the RocLAB prediction is satisfactory although slightlyhigh.
The second case study is from the Thompson dam in Victoria where a mass modulus was back figured from
tunnel monitoring data. The rock comprised highly fractured siltstone. Many of the bedding planes containedcrushed, sheared and extremely weathered material. Substance strengths were about 80 MPa with substance
modulus values averaging about 60 GPa.Interpretation of the field data (Pells et al, 1981) indicated a mass modulus in the range 1000 to 2000 MPa.RocLAB, for GSI = 30, UCS = 50 MPa and mi = 7 gives a mass modulus of 2100 MPa. For GSI = 20, thisvalue drops to 1250 MPa. As with the Diepsloot Bridge data, RocLAB gives a good prediction for this casestudy.
8/12/2019 Assessing Parameters for Computations in Rock Mechanics
http://slidepdf.com/reader/full/assessing-parameters-for-computations-in-rock-mechanics 12/17
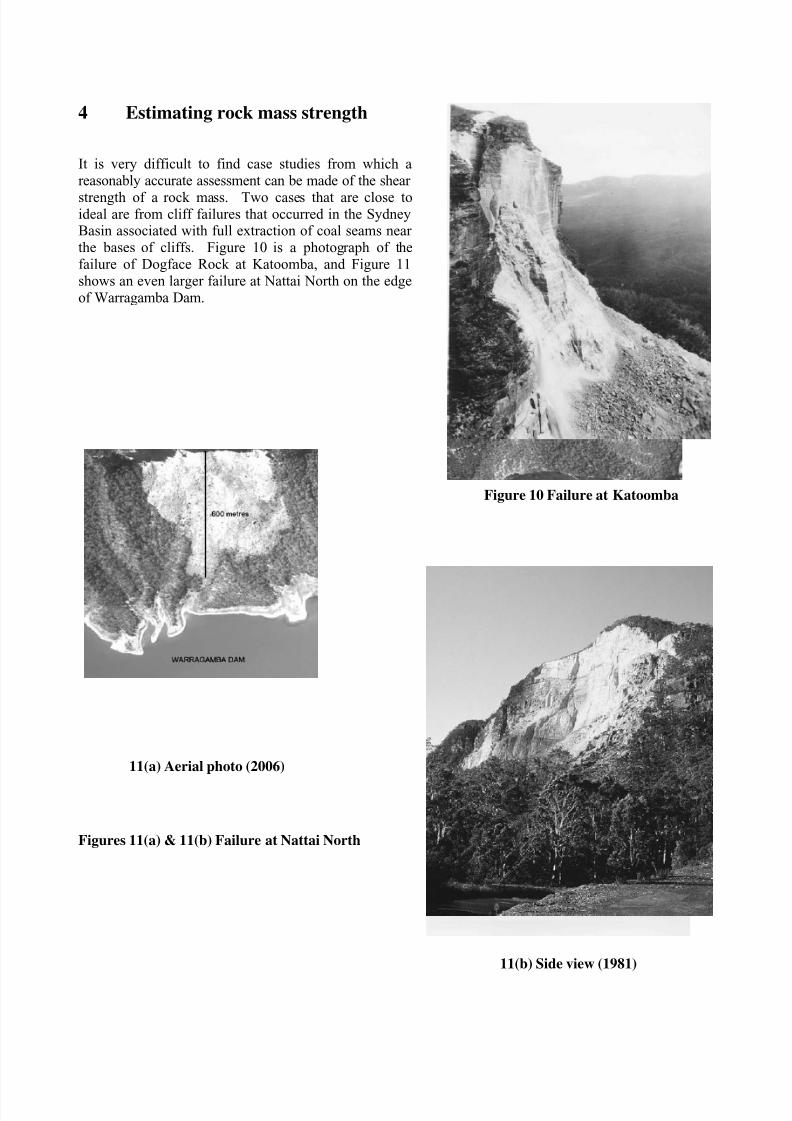
4 Estimating rock mass strength
It is very difficult to find case studies from which areasonably accurate assessment can be made of the shear
strength of a rock mass. Two cases that are close toideal are from cliff failures that occurred in the SydneyBasin associated with full extraction of coal seams nearthe bases of cliffs. Figure 10 is a photograph of thefailure of Dogface Rock at Katoomba, and Figure 11shows an even larger failure at Nattai North on the edgeof Warragamba Dam.
Figure 10 Failure at Katoomba
11(a) Aerial photo (2006)
Figures 11(a) & 11(b) Failure at Nattai North
11(b) Side view (1981)
600m
8/12/2019 Assessing Parameters for Computations in Rock Mechanics
http://slidepdf.com/reader/full/assessing-parameters-for-computations-in-rock-mechanics 13/17
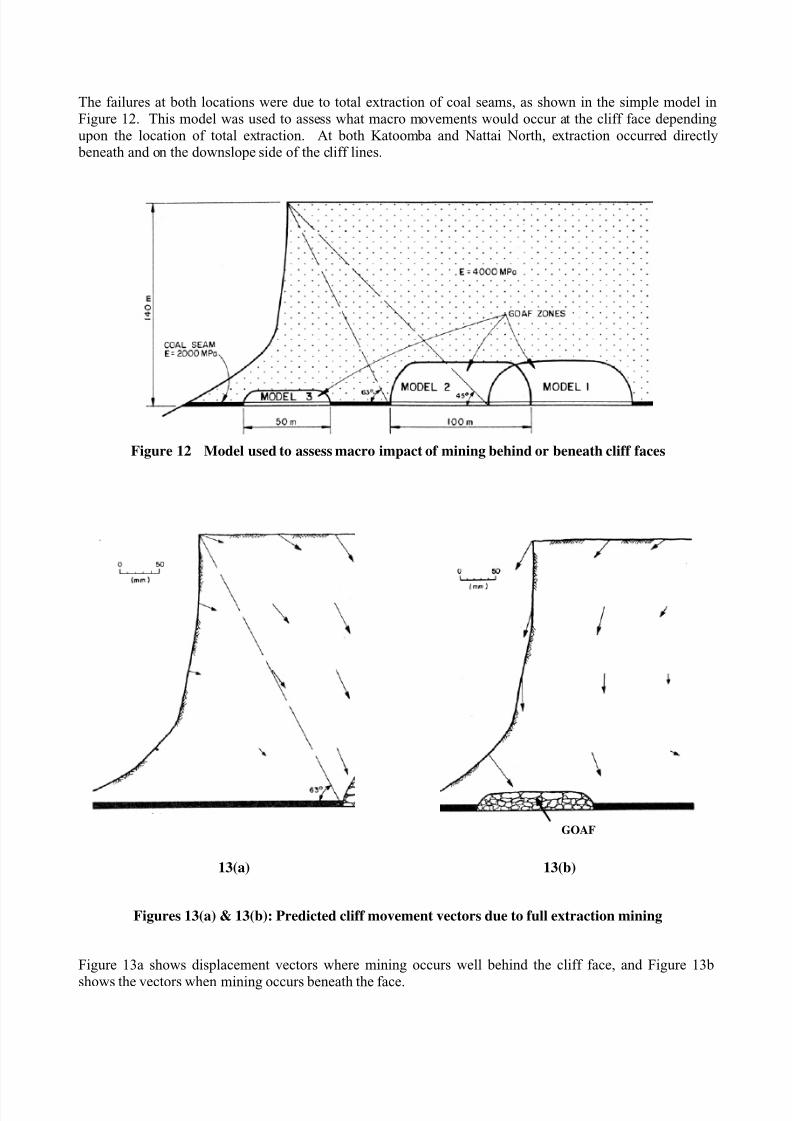
The failures at both locations were due to total extraction of coal seams, as shown in the simple model inFigure 12. This model was used to assess what macro movements would occur at the cliff face dependingupon the location of total extraction. At both Katoomba and Nattai North, extraction occurred directly beneath and on the downslope side of the cliff lines.
Figure 12 Model used to assess macro impact of mining behind or beneath cliff faces
13(a) 13(b)
Figures 13(a) & 13(b): Predicted cliff movement vectors due to full extraction mining
Figure 13a shows displacement vectors where mining occurs well behind the cliff face, and Figure 13b
shows the vectors when mining occurs beneath the face.
GOAF
8/12/2019 Assessing Parameters for Computations in Rock Mechanics
http://slidepdf.com/reader/full/assessing-parameters-for-computations-in-rock-mechanics 14/17
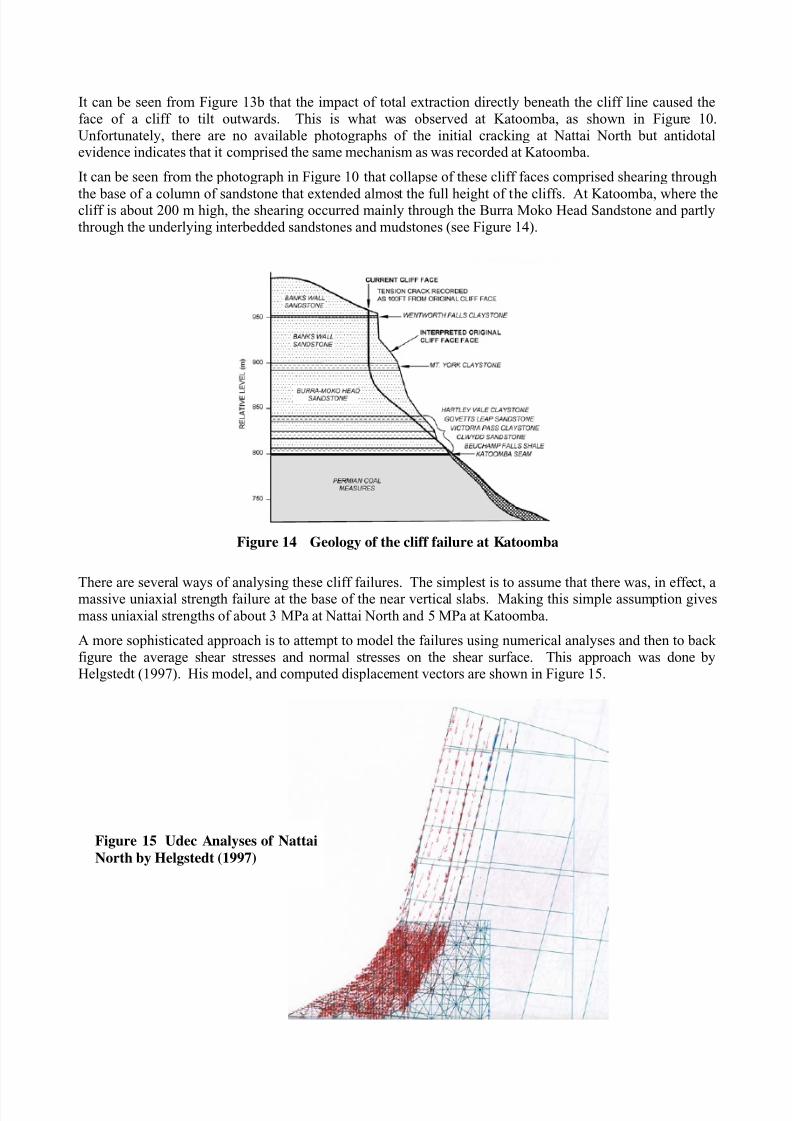
It can be seen from Figure 13b that the impact of total extraction directly beneath the cliff line caused theface of a cliff to tilt outwards. This is what was observed at Katoomba, as shown in Figure 10.Unfortunately, there are no available photographs of the initial cracking at Nattai North but antidotalevidence indicates that it comprised the same mechanism as was recorded at Katoomba.
It can be seen from the photograph in Figure 10 that collapse of these cliff faces comprised shearing through
the base of a column of sandstone that extended almost the full height of the cliffs. At Katoomba, where thecliff is about 200 m high, the shearing occurred mainly through the Burra Moko Head Sandstone and partlythrough the underlying interbedded sandstones and mudstones (see Figure 14).
Figure 14 Geology of the cliff failure at Katoomba
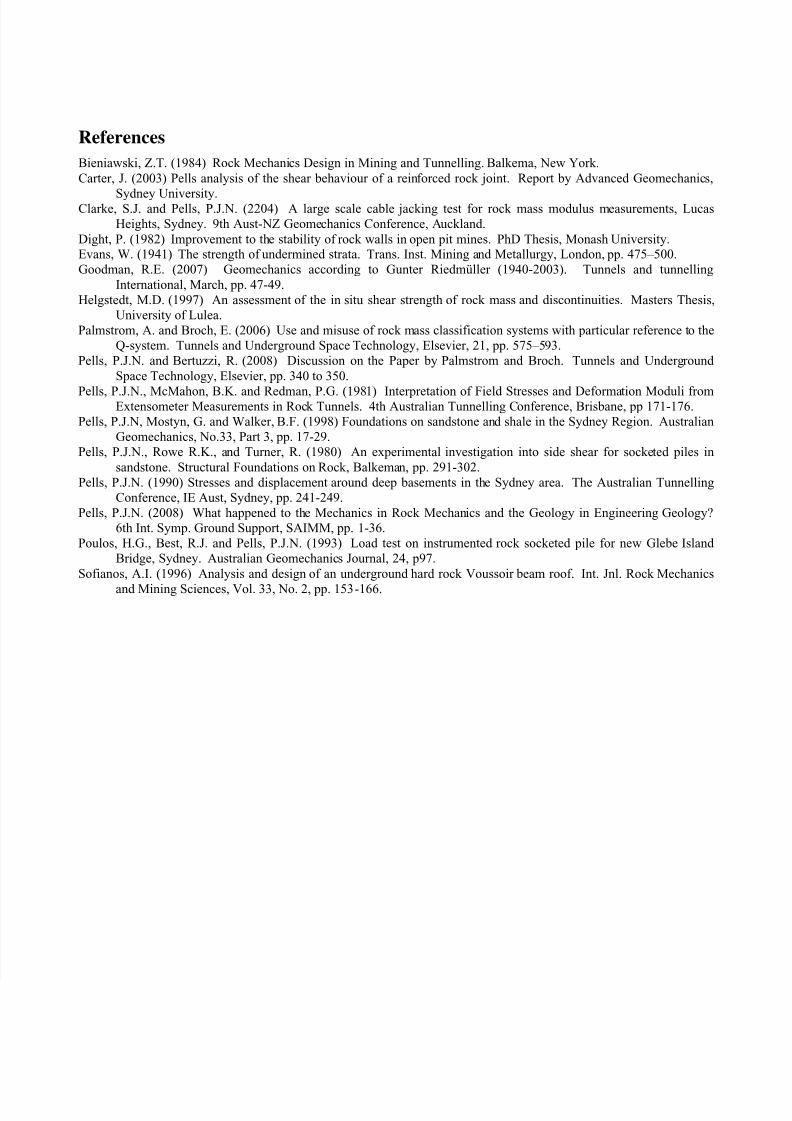
There are several ways of analysing these cliff failures. The simplest is to assume that there was, in effect, amassive uniaxial strength failure at the base of the near vertical slabs. Making this simple assumption gives
mass uniaxial strengths of about 3 MPa at Nattai North and 5 MPa at Katoomba.
A more sophisticated approach is to attempt to model the failures using numerical analyses and then to backfigure the average shear stresses and normal stresses on the shear surface. This approach was done byHelgstedt (1997). His model, and computed displacement vectors are shown in Figure 15.
Figure 15 Udec Analyses of Nattai
North by Helgstedt (1997)
8/12/2019 Assessing Parameters for Computations in Rock Mechanics
http://slidepdf.com/reader/full/assessing-parameters-for-computations-in-rock-mechanics 15/17
Based on these analyses, Helgstedt computed:
• Average normal stress equals 2.7 MPa.
• Average shear stress equals 2.9 MPa.
These values are equivalent to a UCS = 2.7 MPa, which is almost exactly that determined by the trivial
hand calculation given earlier.
A third approach is to give cognisance to the fact that within the geological profile at both sites are mudstonehorizons of lower shear strength than the massive sandstones. It is possible that the failure mechanism
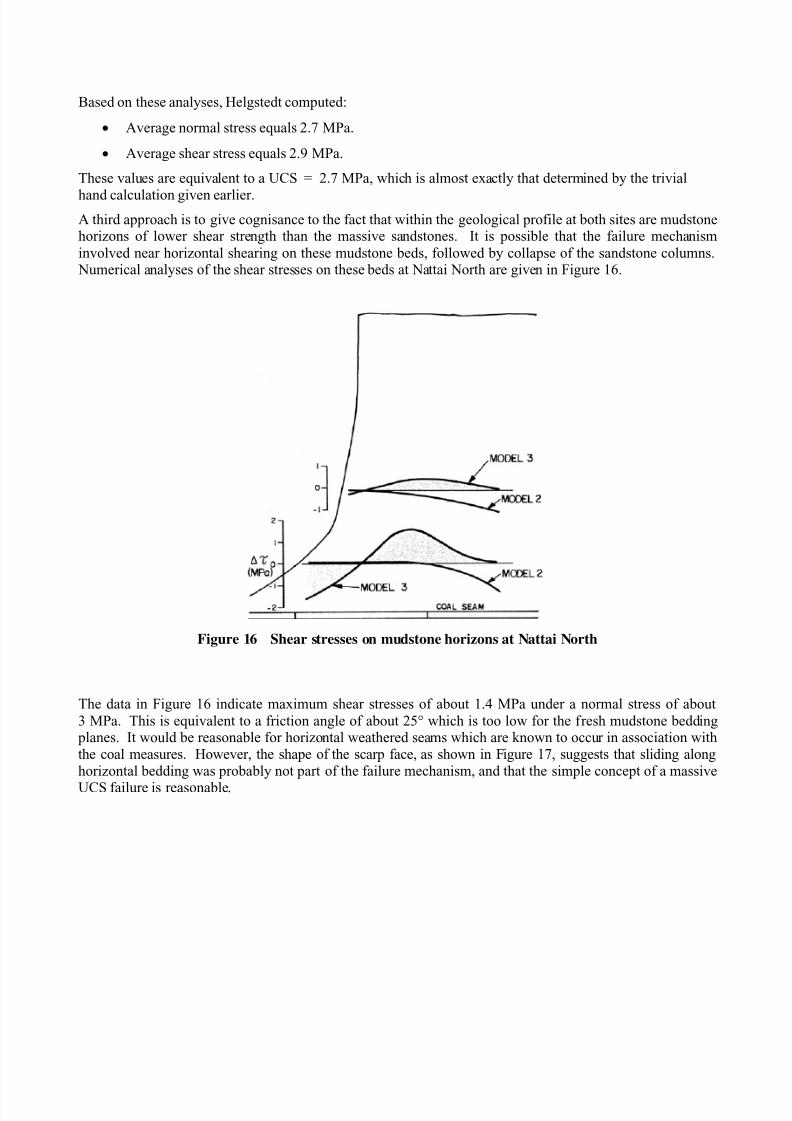
involved near horizontal shearing on these mudstone beds, followed by collapse of the sandstone columns. Numerical analyses of the shear stresses on these beds at Nattai North are given in Figure 16.
Figure 16 Shear stresses on mudstone horizons at Nattai North
The data in Figure 16 indicate maximum shear stresses of about 1.4 MPa under a normal stress of about
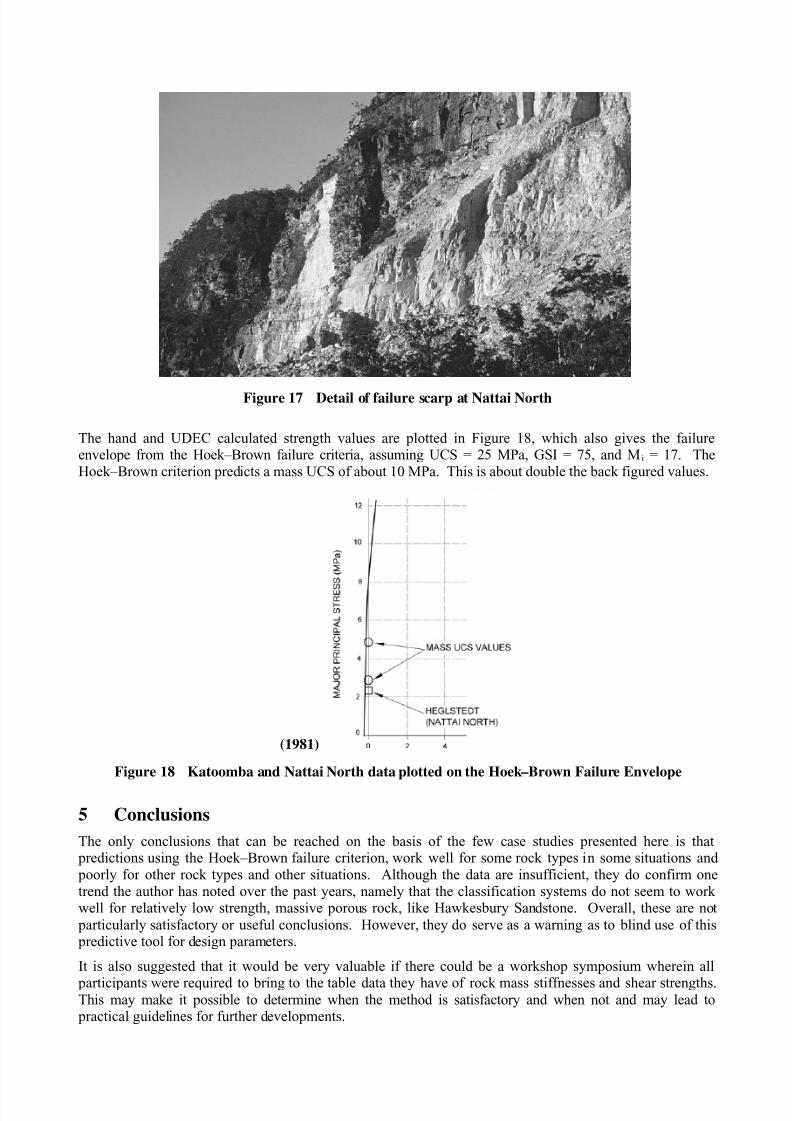
3 MPa. This is equivalent to a friction angle of about 25° which is too low for the fresh mudstone bedding planes. It would be reasonable for horizontal weathered seams which are known to occur in association withthe coal measures. However, the shape of the scarp face, as shown in Figure 17, suggests that sliding alonghorizontal bedding was probably not part of the failure mechanism, and that the simple concept of a massive
UCS failure is reasonable.
8/12/2019 Assessing Parameters for Computations in Rock Mechanics
http://slidepdf.com/reader/full/assessing-parameters-for-computations-in-rock-mechanics 16/17
8/12/2019 Assessing Parameters for Computations in Rock Mechanics
http://slidepdf.com/reader/full/assessing-parameters-for-computations-in-rock-mechanics 17/17
References
Bieniawski, Z.T. (1984) Rock Mechanics Design in Mining and Tunnelling. Balkema, New York.
Carter, J. (2003) Pells analysis of the shear behaviour of a reinforced rock joint. Report by Advanced Geomechanics,
Sydney University.Clarke, S.J. and Pells, P.J.N. (2204) A large scale cable jacking test for rock mass modulus measurements, Lucas
Heights, Sydney. 9th Aust-NZ Geomechanics Conference, Auckland.
Dight, P. (1982) Improvement to the stability of rock walls in open pit mines. PhD Thesis, Monash University.Evans, W. (1941) The strength of undermined strata. Trans. Inst. Mining and Metallurgy, London, pp. 475–500.
Goodman, R.E. (2007) Geomechanics according to Gunter Riedmüller (1940-2003). Tunnels and tunnelling
International, March, pp. 47-49.
Helgstedt, M.D. (1997) An assessment of the in situ shear strength of rock mass and discontinuities. Masters Thesis,
University of Lulea.
Palmstrom, A. and Broch, E. (2006) Use and misuse of rock mass classification systems with particular reference to the
Q-system. Tunnels and Underground Space Technology, Elsevier, 21, pp. 575–593.
Pells, P.J.N. and Bertuzzi, R. (2008) Discussion on the Paper by Palmstrom and Broch. Tunnels and Underground
Space Technology, Elsevier, pp. 340 to 350.
Pells, P.J.N., McMahon, B.K. and Redman, P.G. (1981) Interpretation of Field Stresses and Deformation Moduli fromExtensometer Measurements in Rock Tunnels. 4th Australian Tunnelling Conference, Brisbane, pp 171-176.
Pells, P.J.N, Mostyn, G. and Walker, B.F. (1998) Foundations on sandstone and shale in the Sydney Region. Australian
Geomechanics, No.33, Part 3, pp. 17-29.
Pells, P.J.N., Rowe R.K., and Turner, R. (1980) An experimental investigation into side shear for socketed piles in
sandstone. Structural Foundations on Rock, Balkeman, pp. 291-302.
Pells, P.J.N. (1990) Stresses and displacement around deep basements in the Sydney area. The Australian Tunnelling
Conference, IE Aust, Sydney, pp. 241-249.
Pells, P.J.N. (2008) What happened to the Mechanics in Rock Mechanics and the Geology in Engineering Geology?
6th Int. Symp. Ground Support, SAIMM, pp. 1-36.
Poulos, H.G., Best, R.J. and Pells, P.J.N. (1993) Load test on instrumented rock socketed pile for new Glebe Island
Bridge, Sydney. Australian Geomechanics Journal, 24, p97.
Sofianos, A.I. (1996) Analysis and design of an underground hard rock Voussoir beam roof. Int. Jnl. Rock Mechanics
and Mining Sciences, Vol. 33, No. 2, pp. 153-166.