
Assessing Market Expectations on Exchange Rates and ...
28
THE WILLIAM DAVIDSON INSTITUTE AT THE UNIVERSITY OF MICHIGAN BUSINESS SCHOOL Assessing Market Expectations on Exchange Rates and Inflation: A Pilot Forecasting System for Bulgaria By: Michael Berlemann, Kalina Dimitrova, and Nikolay Nenovsky William Davidson Institute Working Paper Number 759 March 2005
Transcript of Assessing Market Expectations on Exchange Rates and ...

THE WILLIAM DAVIDSON INSTITUTE AT THE UNIVERSITY OF MICHIGAN BUSINESS SCHOOL
Assessing Market Expectations on Exchange Rates and Inflation:
A Pilot Forecasting System for Bulgaria
By: Michael Berlemann, Kalina Dimitrova, and Nikolay Nenovsky
William Davidson Institute Working Paper Number 759 March 2005

Assessing Market Expectations on
Exchange Rates and Inflation:
A Pilot Forecasting System for Bulgaria
Michael Berlemann1
Kalina Dimitrova2
Nikolay Nenovsky3
Abstract: Econometric forecasting models typically perform bad in volatile environments as they are often present in economies in transition. Since forecasts of key macroeconomic variable are inevitable as guidelines for economic policy, one might alternatively make attempts at measuring market participants’ expectations or conduct surveys. However, often financial markets are underdeveloped and regular surveys are unavailable in transition countries. In this paper we propose to conduct experimental stock markets to reveal market participants’ expectations. Wе present the results frоm a series of pilot markets conducted in Bulgaria throughout 2002 indicating that the method could be useful especially for transition countries. Keywords: forecasting, macroeconomics, inflation, exchange rates, experimental stock markets. JEL Codes: C93 and E37
1 Ifo Institute Economic Research, Einsteinstraße 3, D-01069 Dresden, e-mail: [email protected] 2 Economic Research and Projections Directorate, Bulgarian National Bank, Bulgaria, e-mail: [email protected] 3 Member of the Managing Board of the Bulgarian National Bank, University of National and World Economy Sofia, Bulgaria, University of Orleans, France.

1
1 Introduction
In the beginning of the 1990’s most Central and Eastern European countries started to
change their economic systems from centrally planned to market economies. These countries
faced significant turbulences during their processes of transition. As a consequence of the deep
structural changes, all macroeconomic indicators behaved very volatile and are thus difficult to
forecast. Conventional forecasting techniques like Phillip’s curve models, VARs and large
macroeconomic models typically perform bad under these circumstances and therefore
contribute little to serve as guidelines for economic policy. Moreover, they provide no reliable
information for foreign investors who are interested in the region. Hence, the lack of reliable
forecasts of macroeconomic key indicators is likely to have contributed to the comparatively low
foreign direct investments in several Eastern European countries like Bulgaria.
An alternative to suing macroeconomic key indicators as guidelines for economic policy
decisions is to measure expectations of market participants. Foe example, when inflation
expectations are high this might indicate a too loose monetary policy and indicate more
monetary tightness. However, as a “young” market economy, Bulgaria does not have a long
history in market expectations evaluation, if any. The only market expectations survey is the so-
called “consumer survey” conducted by the National Statistic Institute. While it indicates various
key macroeconomic key variables, the survey is conducted as a tendency survey, thereby not
allowing to construct numerical predictions without making additional assumptions. Moreover,
statistical practices in non-EU member countries lack both local public and foreign confidence.
Thus, as in many other transition – or less developed countries there is an urgent need of
forecasts of reliable macroeconomic variables available at low costs. A forecasting technique
which might fill this gap has recently been proposed by Berlemann (2002) who argues that
conducting well-defined experimental forecasting markets should deliver reasonable forecasts pf
macroeconomic variable. While this expectation was initially driven by the great success of
political stock markets in predicting electoral outcomes, pilot experiments conducted in
Germany indicate that the forecasts constructed form these markets are quite valuable (see
Berlemann and Nelson (2005)).

2
In the following we report and analyze the results of experimental forecasting markets
conducted in Bulgaria throughout 2002.
2. Experimental Forecasting Markets
The first electronic forecasting markets was a political stock markets designed by
Forsythe, Nelson, Neumann and Wright on the occasion of the 1988 presidential election in the
U.S. The Iowa Political Stock Market (IPSM) not only delivered interesting data on individual
market behaviour in a comparatively realistic market setting, it also turned out to be highly
successful in predicting the election outcome (Forsythe et al. (1992)). Motivated by the success
of this first field experiment, the Iowa Electronic Markets4 (IEM) were founded to conduct field
experiments, most prominent among them political stock markets, regularly. Initiated and
strongly supported by members of IEM, political stock markets were also organized outside the
U.S. While in many countries (Australia, Canada,5 Czech Republic,6 Denmark, France, Italy,
Korea, the Netherlands,7 Norway, Mexico, Sweden,8 Taiwan and Turkey) political stock markets
were organized only occasionally, in Austria9 and Germany10 political stock markets were
conducted quite regularly. Altogether, forecast accuracy of political stock markets has been quite
impressive (see Berg, Forsythe and Reitz (1997) and Berlemann and Schmidt (2001)).
In the light of the success of political stock markets in predicting political events the
question evolves in how far the idea of using electronic markets as a forecasting device can be
transferred to genuine economic events. In Berlemann (2002) the design of a prototype market
for forecasting inflation is developed which, in principle, can be applied to any (macroeconomic)
variable to be forecasted11. Berlemann and Nelson (2005) show that short-term forecasts
generated by 4 different German inflation forecasting markets are efficient predictors of future
4 For more information on the Iowa Electronic Markets compare the IEM Internet pages under: http://www.biz.uiowa.edu/iem/. 5 Forsythe, Frank, Krishnamurthy and Ross (1995). 6 Cahlik, Gersl, Hlavacek and Berlemann (2002). 7 Jacobsen et al. (2000). 8 Bohm and Sonnegard (1999). 9 For more information see the Austrian Electronic Markets (AEM) Internet page under: http://ebweb.tuwien.ac.at/apsm/. 10 A large group of political stock market research was organized by the members of German Electronic Markets Workgroup (GEMW), a cooperation of several German universities and research institutions. 11 Dresden Electronic Markets conduct electronic forecasting markets regularly under: http://www.tu-dresden.de/wwvwlgkw/DEM/Dresden\%20Electronic\%20Markets.htm.
3
inflation. Similar results apply for a related German market which was constructed to forecast
the ECB main refinancing rate (see Berlemann and Nelson (2005)). However, the design of an
macroeconomic inflation forecasting market differs considerably form the one of political stock
markets. In the following we give a brief outline of the prototype design of an inflation
forecasting market which can principally also be used for forecasting other macroeconomic
variables of interest12.
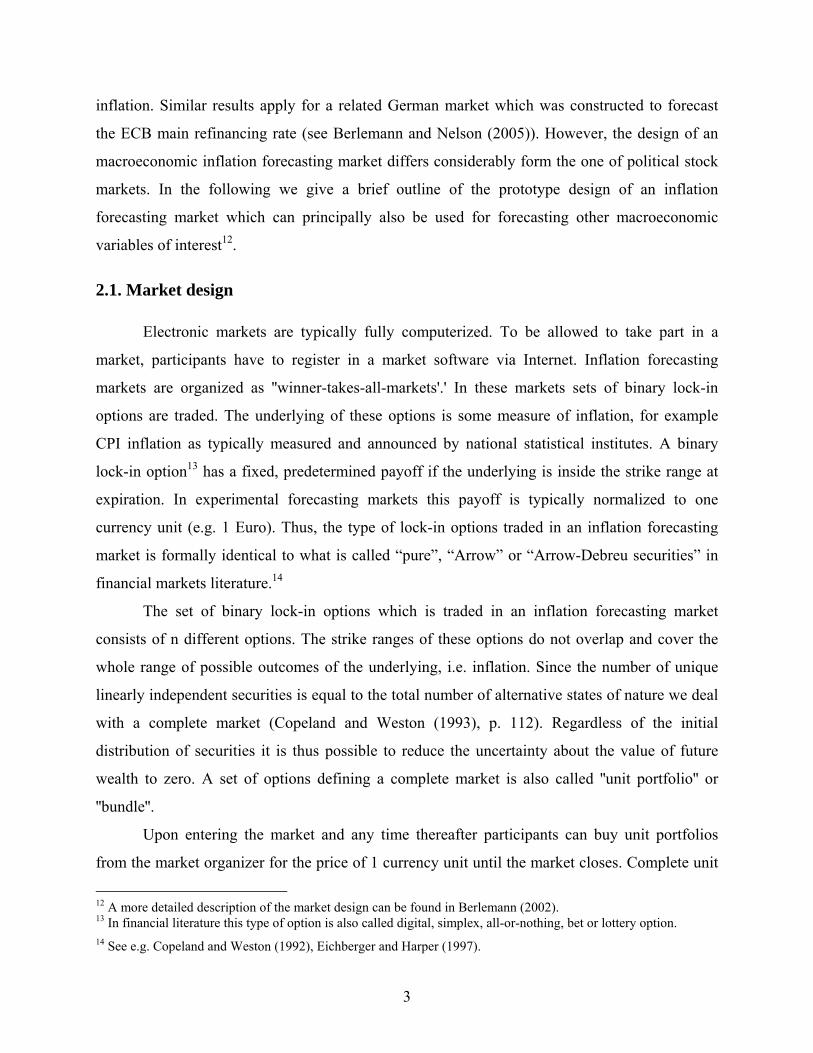
2.1. Market design
Electronic markets are typically fully computerized. To be allowed to take part in a
market, participants have to register in a market software via Internet. Inflation forecasting
markets are organized as ''winner-takes-all-markets'.' In these markets sets of binary lock-in
options are traded. The underlying of these options is some measure of inflation, for example
CPI inflation as typically measured and announced by national statistical institutes. A binary
lock-in option13 has a fixed, predetermined payoff if the underlying is inside the strike range at
expiration. In experimental forecasting markets this payoff is typically normalized to one
currency unit (e.g. 1 Euro). Thus, the type of lock-in options traded in an inflation forecasting
market is formally identical to what is called “pure”, “Arrow” or “Arrow-Debreu securities” in
financial markets literature.14
The set of binary lock-in options which is traded in an inflation forecasting market
consists of n different options. The strike ranges of these options do not overlap and cover the
whole range of possible outcomes of the underlying, i.e. inflation. Since the number of unique
linearly independent securities is equal to the total number of alternative states of nature we deal
with a complete market (Copeland and Weston (1993), p. 112). Regardless of the initial
distribution of securities it is thus possible to reduce the uncertainty about the value of future
wealth to zero. A set of options defining a complete market is also called ''unit portfolio'' or
''bundle''.
Upon entering the market and any time thereafter participants can buy unit portfolios
from the market organizer for the price of 1 currency unit until the market closes. Complete unit
12 A more detailed description of the market design can be found in Berlemann (2002). 13 In financial literature this type of option is also called digital, simplex, all-or-nothing, bet or lottery option. 14 See e.g. Copeland and Weston (1992), Eichberger and Harper (1997).

4
portfolios can also be sold back to the market organizer during the market period for the price of
1 currency unit each. Selling and buying unit portfolios from or to the market organizer are
primary market transactions. Together with the earlier described payoff structure of the binary
lock-in options the pricing of the unit portfolios guarantees that the market is a zero-sum-game
for the market organizer.
On the secondary market participants can buy or sell contracts from or to other
participants. The secondary market is organized as a so-called ''double auction market''. All
primary and secondary market transactions are organized via a market software. Besides serving
as a market platform the software provides several facilities for the traders to obtain information
on the market. Different from real stock markets, short sales and purchases on margin are
typically disallowed to secure the zero sum-game character of experimental forecasting markets.
In addition, there are typically no transaction costs levied by the market organizer for both,
primary and secondary market transactions. The forecasting markets get liquidated as soon as the
realization of the underlying is known, i.e. the inflation rate is announced by the responsible
institution. The individual payoff of each participant consists of (i) the money the trader held on
his market account when the market closed and (ii) the liquidation value of the portfolio of
contracts the trader held at the end of the market.15
2.2. Density and mean forecasts
As it is shown in Berlemann (2002) the prices of the pure securities traded in an inflation
market are perfect predictors of the probabilities, market participants attach to the different states
of nature. While an experimental inflation forecasting market thus directly generates a density
forecast of inflation it does not automatically deliver some form of mean inflation forecast.
Whenever we are in need of mean forecasts we have to make some simplifying assumptions on
the distribution of inflation expectations within the intervals as marked by the strike ranges of
the option contracts. For sufficiently small intervals it seems to be reasonable to assume that the
market participants expect all realizations of inflation within this interval to be equally likely. In
this case the interval can be represented by its class middle. However, a complete set of options
includes two options with infinitely large strike ranges. To deal with this problem one might use

5
the (upper respectively the lower) bounds of these infinitely large intervals instead of the class
middle. We can then calculate the mean market inflation forecast by multiplying the last
observed normalized market prices with the class middles (respective the bounds of the lowest
and the highest interval) and adding up for all traded contracts (LTP forecast). Alternatively, one
could also used normalized average trading prices as observed on the last trading day (ATP
forecast). It should be underlined that electronic markets allow constructing forecasts at any
point in time during the market period.
3. Designing a Regular Forecasting System for Bulgaria
In the following we report and analyze the results of a series of electronic forecasting
markets which were conducted in Bulgaria throughout 2002. Similar to the inflation forecasting
markets conducted in Germany, the Bulgarian markets had the character of pilot experiments.
Although we already had some experiences with German inflation forecasting markets we were
aware of the fact that applying the method to a transition country like Bulgaria would far from
being easy and would also require substantial adjustments. The fact that - at least up to our
knowledge - no experimental market was conducted in Bulgaria or other countries in transition
made it even impossible to learn from earlier work.
The focus of the Bulgarian markets was somewhat different from the inflation markets
conducted in Germany. Our primary objective of organizing these markets was to study the
possibilities to build up some regular forecasting system of macroeconomic variables allowing to
construct (inflation) forecasts even at longer forecast horizons than 3 months. We also had
several additional questions in mind when planning the Bulgarian markets. For example, we
were interested in the performance of market forecasts in a less stable environment than it is
given in Germany. We also wondered in how far electronic markets would be capable of
forecasting macroeconomic variables different from inflation. In the following we first give a
description of the Bulgarian markets. We then turn analysis of the market forecasts and their
accuracy. Finally, we make an attempt at evaluating the possibilities to build up some regular
forecasting system of macroeconomic variables in the future.
15 The liquidation value of a single contract is one currency unit (typically 1 Euro) provided that the factual inflation rate falls into the strike range of the simplex-option and zero otherwise.

6
3.1 Market descriptions
The major problem to be solved when running markets for long-term forecasting horizons
is to motivate participants to engage in these markets though the liquidation of the markets can
not be done before the event is realized. We decided to tackle this problem by choosing a
considerably different market design as it has been previously used in German inflation
forecasting markets. While the German markets were organized occasionally and irregularly, the
Bulgarian markets were intended as a prototype system of a regular forecasting system. We
therefore decided to conduct forecasting markets in Bulgaria with a fixed and publicly
preannounced time-table. We also decided to restrict the test-period to one year. All Bulgarian
markets we report on in the following were conducted throughout the year 2002. Since it was our
objective to liquidate all markets in this period the longest possible forecast horizon was roughly
a year. After a discussion with Bulgarian economists, it turned out that inflation and the BGN-
USD exchange rate are the variables of primary interest.16
Table 1: Year-on-year CPI-inflation forecasting markets in Bulgaria
Market Forecasted variable Forecast horizon Market date Liquidation date
InfBul1 Inflation March 2002 1 quarter ahead January 2002 April 2002
InfBul2 Inflation December 2002 1 year ahead January 2002 January 2003
InfBul3 Inflation June 2002 1 quarter ahead March 2002 July 2002
InfBul4 Inflation December 2002 9 months ahead March 2002 January 2003
InfBul5 Inflation September 2002 1 quarter ahead June 2002 October 2002
InfBul6 Inflation December 2002 6 months ahead June 2002 January 2003
InfBul7 Inflation December 2002 3 months ahead September 2002 January 2003
16 A guest lecture was organized at the Bulgarian National Bank in July 2001 to which representatives of the central bank, several government institutions, universities, private banks and journalists were invited.

7
Table 2: BGN-USD exchange rate markets in Bulgaria
Market Forecasted variable Forecast horizon Market date Liquidation date
ExBul1 Exch.-rate 1st Feb. 2002 2 weeks ahead January 2002 February 2002
ExBul2 Exch.-rate 1st Jan. 2003 1 year ahead January 2002 January 2003
ExBul3 Exch.-rate 1st Jul. 2002 1 quarter ahead March 2002 July 2002
ExBul4 Exch.-rate 1st Jan. 2003 9 months ahead March 2002 January 2003
ExBul5 Exch.-rate 1st Oct. 2002 1 quarter ahead June 2002 October 2002
ExBul6 Exch.-rate 1st Jan. 2003 6 months ahead June 2002 January 2003
ExBul7 Exch.-rate 1st Jan. 2003 3 months ahead September 2002 January 2003
As it was discussed earlier, it is not easy to motivate traders to take part in markets which
are liquidated at some time far in the future. Our primary solution to this problem was to
combine markets with a short-term forecast horizon with medium-term ones. In order to do so
we planned a staggered system of forecasting markets as it is summarized in the tables 1 and 2.
Different from the German markets, we decided to open up the various markets only for quite
short periods of time (roughly about two weeks). We did so because we felt that monitoring the
markets during the whole year would have caused too much transaction costs for the
participants. We also concentrated the markets on certain periods, typically the last weeks of
every quarter to induce some regularity into the procedures.17
During the first market period in January 2002 (7.1.-22.1.03) four different markets were
conducted: two inflation and two exchange rate markets. While the contracts in market InfBul1
were tied to the March 2002 inflation rate, the market InfBul2 was intended to forecast inflation
in December 2002. Thus, while both markets were conducted at the same time they had
considerably different forecast horizons. Similarly, the ExBul1 market had a short forecast
horizon (BGN-USD exchange rate on 1st February 2002) while the contracts in market ExBul2,
also conducted in January, were tied to the BGN-USD exchange rate on 1st January 2003.
During both the second market period (4th to 19th March 2002) and the third one (3rd June to
18th June 2002) again two short-term markets and two medium-term markets were conducted.
During the last market period in September we only conducted one market per forecast variable
17 The first series of markets was conducted in January 2002 in stead of December 2001 due to technical problems.

8
with a forecast horizon of 3-months-ahead. The staggered system of markets ensured that at least
fifty percent of all markets were liquidated a quarter after it was conducted. Our expectation was
that at least some of the traders engaging in the short-term markets would also trade in the
medium-term markets.
In general, electronic markets are organized as real-money markets, i.e. all transactions in
the market are based on real money. However, when planning the Bulgarian markets serious
doubts evolved in how far it would be possible to organize the markets as real-money markets.
First, we found no way of quickly monitoring transfers of liquidity to the bank account of the
market.18 Second, bank transfers in Bulgaria have comparatively high transaction costs thereby
decreasing the incentives to take part in the markets. Third, Bulgaria is a comparatively poor
country and we were somewhat sceptic of the possibilities to motivate a large number of people
to invest considerable sums of money in our markets. Fourth, the long period of time between
the conduct of the first markets and their liquidation dates is not unproblematic. While the
traders could principally be compensated for their temporary loss of liquidity by paying them
some interest on their initial investments we also had to deal with a credibility problem in
Bulgaria. Some credible institutional background guaranteeing the proper liquidation of the
markets would have been necessary. While some of the problems could have been solved we
finally decided to organize the markets in Bulgaria on a virtual money basis. Thus, the
participants had not to invest their own money in the markets. Instead, the traders were endowed
with 100 virtual Euro in the beginning of every single market. These funds could be used for
organizing trades on the primary and secondary market.
When running virtual money markets the question evolves how traders can be motivated
for participation and, even more important, for reasonable behaviour. In the most previous
virtual money markets this problem was solved by rewarding the most successful traders.
However, since the traders have nothing to loose in such a setting it is quite likely that a large
number of uninformed traders shows up in the market. This might lead to a severe erosion of the
market's forecast accuracy. The problem could be even worse when dealing with markets with a
high degree of uncertainty as we do in the case of Bulgaria, a transition country which suffered a
18 When we started planning the Bulgarian markets in mid 2001 Internet banking opportunities in Bulgaria were not available.

9
severe currency and banking crisis in 1996/199719. We therefore decided to run the Bulgarian
markets as experts markets in which participation was restricted to professional forecasters, i.e.
people who are themselves engaged in forecasting or at least for which forecasts are an
important part of their professional activity. Altogether, 25 professional traders took part in the
Bulgarian markets.
The reward system for the Bulgarian markets consisted of rewards for the three most
successful traders and an additional reward for the most successful participating group of traders.
The most successful individual traders were determined by the average return on investment they
reached in all markets they participated in, provided they took part in at least half of all markets.
The most successful trader was rewarded with 100 Euro, the second with 50 Euro and the third
with 25 Euro. Every single trader was assigned to a certain group according to the institution he
belongs to. The most successful group (again determined by the average rate of return on
investment) was rewarded with 100 Euro plus two subscriptions of a Bulgarian Financial
Journal. To increase the incentives for participation we decided to cooperate closely with a
media partner, the Bulgarian financial journal "Banks, Investments, Money". The markets were
announced in the print version of the journal as well as on the Internet pages. Soon after
liquidation of every single market a press release was prepared and published in the journal. This
press release did not only contain information on the market forecasts but also on the three most
successful traders in the referring market. Our expectation was that the publicity of being
announced as one of the best forecasters significantly increased the incentives for participation.20
The design of the Bulgarian markets was quite similar to the German markets reported
earlier. For all 7 Bulgarian inflation markets we used the same set of 8 different contracts for
alternative inflation scenarios. The complete set of contracts in the inflation markets and the
referring payoff rules are shown in table 3.
19 More details about the crisis could be found in BNB annual reports (1996, 1997, 1998, 1999, 2000), OECD (1997, 1999), Balyozov (1999), Enoch et al. (2002) and Berlemann and Nenovsky (2003).

10
Table 3: Traded contracts in Bulgarian inflation forecasting markets InfBul 1-7
Contract number Contract name Interval middle/limit Pays off 1 Euro, if 1 Π(5.0-) 5.0 Π<5.0 2 Π(5.0-7.0) 6.0 5.0≤π≤7.0 3 Π(7.0-8.0) 7.5 7.0≤π≤8.0 4 Π(8.0-9.0) 8.5 8.0≤π≤9.0 5 Π(9.0-10.0) 9.5 9.0≤π≤10.0 6 Π(10.0-11.0) 10.5 10.0≤π≤11.0 7 Π(11.0-12.0) 11.5 11.0≤π≤12.0 8 Π(12.0+) 12 12.0<π
The exchange rate markets in Bulgaria were designed in analogy to the inflation markets. While
the set of contracts traded in the Bulgarian exchange rate markets was unchanged in the first 6
markets, we decided to alter the unit portfolio slightly in the last market conducted in September
2002, because the BGN-USD exchange rate decreased sharply and remained persistently below 2
in June 2002. The complete sets of contracts in the exchange rate markets and the referring
payoff rules are shown in table 4 and 5.
Table 4: Traded contracts in Bulgarian exchange rate markets ExBul 1-6
Contract number Contract name Interval middle/limit Pays off 1 Euro, if 1 ex(2.00-) 2.000 ex<2.00 2 ex(2.00-2.05) 2.025 2.00≤ex≤2.05 3 ex(2.05-2.10) 2.075 2.05≤ex≤2.10 4 ex(2.10-2.15) 2.125 2.10≤ex≤2.15 5 ex(2.15-2.20) 2.175 2.15≤ex≤2.20 6 ex(2.20-2.25) 2.225 2.20≤ex≤2.25 7 ex(2.25-2.30) 2.275 2.25≤ex≤2.30 8 ex(2.30-2.35) 2.325 2.30≤ex≤2.35 9 ex(2.35-2.40) 2.375 2.35≤ex≤2.40 10 ex(2.40+) 2.400 2.40<ex
20 Our expectation was later confirmed by the fact that the winning team, the Agency of Economic Analyses and Forecasting (AEAF) spontaneously held a reception to praise its victory.

11
Table 5: Traded contracts in Bulgarian exchange rate market ExBul7
Contract number Contract name Interval middle/limit Pays off 1 Euro, if 1 ex(1.95-) 1.950 ex<1.95 2 ex(1.95-2.00) 1.975 1.95≤ex≤2.00 3 ex(2.00-2.05) 2.025 2.00≤ex≤2.05 4 ex(2.05-2.10) 2.075 2.05≤ex≤2.10 5 ex(2.10-2.15) 2.125 2.10≤ex≤2.15 6 ex(2.15-2.20) 2.175 2.15≤ex≤2.20 7 ex(2.20-2.25) 2.225 2.20≤ex≤2.25 8 ex(2.25-2.30) 2.275 2.25≤ex≤2.30 9 ex(2.30-2.35) 2.325 2.30≤ex≤2.35 10 ex(2.35+) 2.350 2.35<ex
All markets were conducted with the Dresden Electronic Markets software.
4. Forecast accuracy of mean forecasts
The market periods of the Bulgarian inflation and exchange rate markets were
considerably short (about two weeks). Thus, the time series of fixed event forecasts constructed
from the Bulgarian market data are too short to be analyzed for efficiency. We also have no
competing forecasts at hand which would allow us to evaluate the accuracy of the forecasts21.
Thus, we have to rely on a comparison of the market and naive forecasts22. In table 6 we show
the results of a comparison of the market inflation forecasts and the referring naïve forecasts.
Obviously, the markets performed quite poor in forecasting Bulgarian CPI inflation. In only 1
out of 7 cases, the market forecasts outperformed the naive forecast.
21 According to the survey only 24% participants had information on official inflation forecasts. Nevertheless, at teh time teh markets were conducted there were no publicly available short- to medium-term inflation forecasts for Bulgaria.

12
Table 6: Comparison of Bulgarian inflation forecasting markets and naive forecasts
Forecast variable
Forecast horizon
Market period
LTP forecast
ATP forecast
Naive forecast
Actual inflation
Π03/2002 2 months ahead 7.1.02-22.1.02 6.1 6.0 4.8 9.2 Π12/2002 11 months ahead 7.1.02-22.1.02 8.6 8.6 4.8 3.8 Π06/2002 3 months ahead 4.3.02-19.03.02 8.9 9.3 8.4 5.2 Π12/2002 9 months ahead 4.3.02-19.03.02 9.2 9.3 8.4 3.8 Π09/2002 3 months ahead 3.6.02-18.06.02 7.8 7.8 6.9 4.0 Π12/2002 6 months ahead 3.6.02-18.06.02 7.2 7.3 6.9 3.8 Π12/2002 3 months ahead 15.09.02-30.09.02 6.6 6.6 5.5 3.8
To study the final inflation forecasts in more details23 we distinguish between two
perspectives. On one hand, we analyze short-term forecasts (see figure 1), i.e. the forecasts with
a 3-month horizon. On the other hand, we study the four different forecasts for December 2002
inflation (see figure2) which are constructed at different dates and thus different horizons.
Figure 1 Short-term final inflation forecasts (InfBul1, InfBul3, InfBul5 and InfBul7)
22 Naive forecasts assume that the target variable stays on the same level as it was when last observed. 23 For inflation markets we chose the last day average traded prices forecast to be the final forecast.
2.0
3.0
4.0
5.0
6.0
7.0
8.0
9.0
10.0
Dec-01 Jan-02 Feb-02 Mar-02 Apr-02 May-02 June-02 July-02 Aug-02 Sep-02 Oct-02 Nov-02 Dec-02
y-o-
y in
flatio
n (%
)
y-o-y inflation InfBul1 InfBul3 InfBul5 InfBul7

13
As figure 1 shows, all short-term forecasts imply increasing inflation expectations over
the three month ahead horizon. Thus, we deal with the case of persistent short-term inflationary
expectations. However, the prediction of an increasing inflation rate turned out to be correct only
in the 3-month-ahead market InfBul1. Compared to the actual values of the forecasted variables,
three out of four markets overstate realized inflation rates. In fact, there was a sharp increase of
inflation in the first quarter of the year reaching 9.2% and a sudden and continuing fall to a level
of about 4%. It might be suspected that the underestimation of March inflation by 3.1% have
resulted in strongly increasing inflation expectations in the following three sessions (by 3.6% on
average) as a response and adjustment to the failure in the first forecast. In their efforts to correct
their expectations according to the previous results of the first forecast, the successive three
markets failed to predict the future development of inflation. We might interpret this finding as
indication for adaptively formed inflation expectations.
Figure 2 Medium- and short-term final inflation forecasts for December 2002 (InfBul2,
InfBul4, InfBul6 and InfBul7)
2.0
3.0
4.0
5.0
6.0
7.0
8.0
9.0
10.0
Dec-01 Jan-02 Feb-02 Mar-02 Apr-02 May-02 June-02 July-02 Aug-02 Sep-02 Oct-02 Nov-02 Dec-02
y-o-
y in
flatio
n (%
)
y-o-y inflation InfBul2 InfBul4 InfBul6 InfBul7
14
The second group of inflation forecasts consists of forecasts of December 2002 y-o-y
inflation rate 1-year, 9-months, 6-months and 3-months ahead. After plotting the four forecasts
in one figure it is easy to see that the first two of them point at one inflation rate and the second
two point at a another, lower value. All of them have a positive slope thereby revealing persistent
inflation expectations throughout the year in comparison with the latest available data. The
highest difference between predictions and realized values was generated by the market InfBul4
(5.5%), which was conducted immediately after the sharp rise of prices in the first quarter while
the relative decline of the inflation rate after April might be the reason for the decreased
forecasts in the second half of the year. This development of the forecasts indicates the strong
influence of the current economic situation and of the information of the near past on traders’
inflation expectations.
One might speculate that the high inflation expectations might have been due to low
credibility of the currency board arrangement. However, this is hardly the case. Before any
market session, participants were asked to fill in surveys as a condition to be allowed to take part
in the markets. In this survey the participants were also asked to guess how likely it is that the
LEV will still remain pegged to the EURO by the end of the year 2002. The average guess of all
25 respondents turned out to be roughly 95 percent indicating that the market participants did not
consider the abolishment of the currency board arrangement to be a likely scenario.
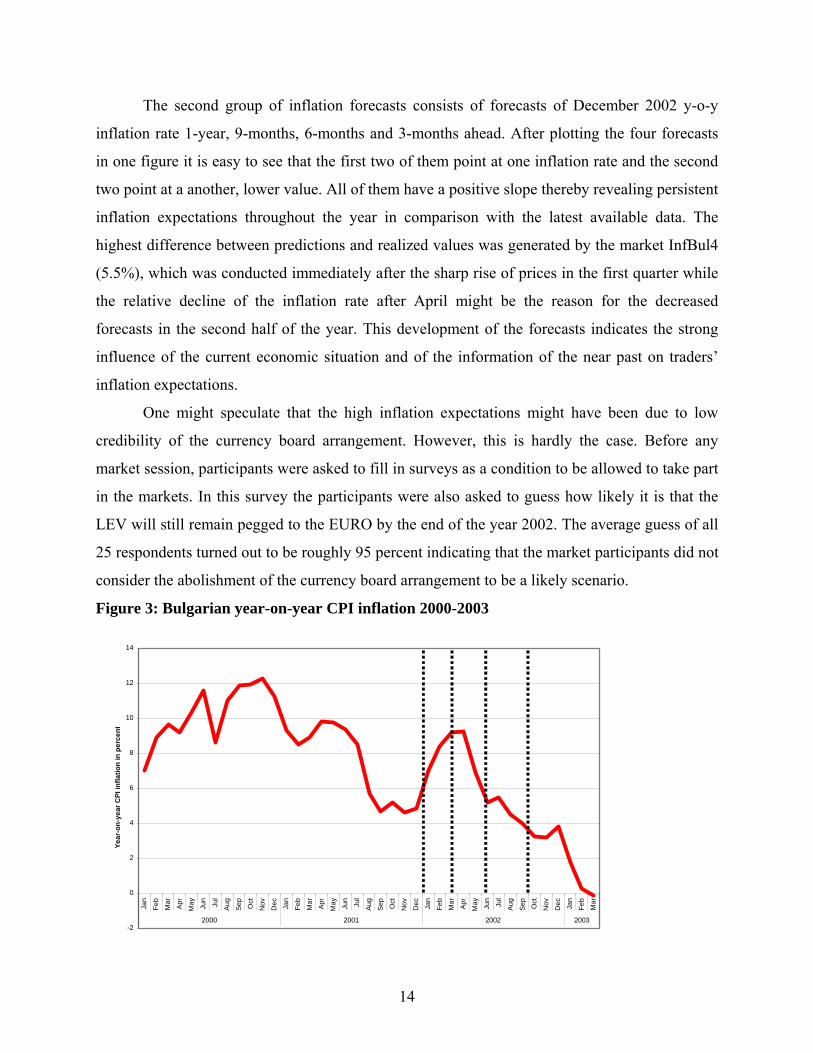
Figure 3: Bulgarian year-on-year CPI inflation 2000-2003
-2
0
2
4
6
8
10
12
14
Jan
Feb
Mar
Apr
May Jun
Jul
Aug
Sep
Oct
Nov
Dec Jan
Feb
Mar
Apr
May Jun
Jul
Aug
Sep
Oct
Nov
Dec Jan
Feb
Mar
Apr
May Jun
Jul
Aug
Sep
Oct
Nov
Dec Jan
Feb
Mar
2000 2001 2002 2003
Year
-on-
year
CPI
infla
tion
in p
erce
nt

15
Most probably, due to the high inflation rates since the beginning of the transition period
which culminated in hyperinflation in the beginning of 1997, participants had nevertheless
persistently positive inflation expectations. Although the currency board is being operated for the
5th year running and inflation rates are somewhat curbed in comparison with the time before
annual (y-o-y) inflation rates are still relatively high (see figure 3). Moreover, they seem not to
reflect money growth but rather to be a function of other exogenous factors. In recent work of
Beck, Miller and Saad (2003) on the price level determination process in Bulgaria changes in
government credit are found to affect inflation significantly.
It is worth noting that in the first version of the survey there was a question asking how
the government/central bank is doing its job in fighting inflation, and the distribution of answers
was: 60% "good", 32% "on average" and 8% - "excellent". In the second version of the survey
the respondents were asked to distinguish between the performance of the central bank and the
one of the government. The results indicate that the government was judged to perform worse
than the central bank. Hence, our results could just support the fiscal theory of price
determination (Woodford, 1995, 2001, Komilainen and Pirtilla, 2000) which argues that fiscal
variables have a direct impact on price levels.
It is well possible that the systematically positive inflation expectations are due to
intensive relative price changes, which are typically accompanying transition periods. This is
especially true for a special group of consumer goods and services which are the administratively
managed or also known as controlled prices (heating, electricity, water supply, phone and post
services, etc.). The prices of these services are (said to be ) under their cost-recovery level and
are corrected at certain times with or without a preliminary announcement, thus contributing to
the variability of y-o-y inflation rates.24 Another very volatile group of goods that causes much
of the variability of annual inflation rates is the group of agricultural products which have
significant share in the consumer basket (7%) and suffers form huge seasonal amplitudes. We
should also mention fuels as their price change is determined by a combination of international
oil market prices and the BGN-USD exchange rate. That is why higher inflation expectations
could reflect the general view that there is a positive correlation between relative price
variability and the level of aggregate inflation (Cukierman (1982)). Transition countries are a
24 Blanchard (1998) asks whether governments should decide to bring relative administered prices to their correct level before or after disinflation.

16
special case of this hypothesis providing empirical evidence in favour of the argument that
higher relative price variability might give incentives to price makers (in circumstances of costly
price changes) to price comparatively high in response to temporarily increasing inflation when
relative prices uncertainty is high.
Last but not least, if we compare the market forecasts, actual inflation and the traded
contracts (tables 3 and 6), it is interesting to note that 5 out 7 actual inflation rates are out of the
preliminary set range, while forecasts are inside it, pointing to its low boundary. In previous
inflation markets (run for Germany), the market forecast and the actual inflation rates are in the
middle of the contracts’ range. This simple comparison of several markets suggests that the
preliminary design of the inflation forecasting markets could have also contributed to the higher
inflation expectations, which are formulated for the first time in Bulgaria in this experimental
form.
The forecasts for the BGN-USD exchange rate are constructed analogously to the
inflation forecasts. Since we have no comparable forecasts of the BGN-USD exchange rate at
hand we again have to rely on a comparison of the market exchange rate forecasts25 and the
referring naive forecasts. The results are shown in table 7, where we could see that markets
outperform the naive forecasts in 4 out of 7 cases. While the January and the March markets
performed better than the naive forecasts, the June and September markets failed to outperform
the naive forecast.
Table 7: Comparison of Bulgarian exchange rate forecasting markets and naive forecasts
Forecast variable
Forecast horizon
Market period
LTP forecast
ATP forecast
Naive forecast
Actual ex. rate
Ex01/02/02 2 weeks ahead 7.1.02-22.1.02 2.235 2.218 2.219 2.264 Ex01/01/03 11 months ahead 7.1.02-22.1.02 2.162 2.163 2.219 1.885 Ex01/07/02 3 months ahead 4.3.02-19.03.02 2.197 2.197 2.261 1.961 Ex01/01/03 9 months ahead 4.3.02-19.03.02 2.178 2.205 2.261 1.885 Ex01/10/02 3 months ahead 3.6.02-18.06.02 2.136 2.140 2.084 1.984 Ex01/01/03 6 months ahead 3.6.02-18.06.02 2.174 2.175 2.084 1.885 Ex01/01/03 3 months ahead 15.09.02-30.09.02 1.995 1.995 1.989 1.885
Short-term exchange rate forecasts are 3-month ahead forecasts and a 2-week forecast for
the BGN-USD exchange rate for the 1st working day of February 2002. Different from the
17
inflation forecasts, exchange rate expectations are quite diverse with respect to the expected
direction of future exchange rates (see figure 4).
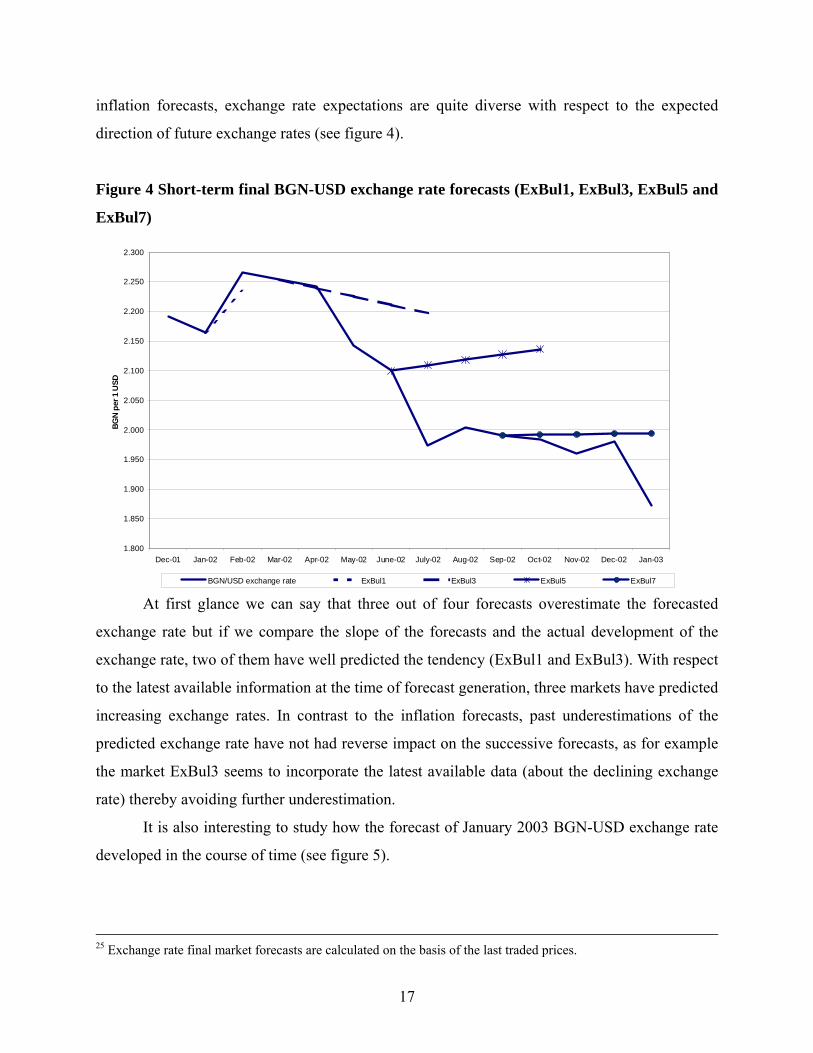
Figure 4 Short-term final BGN-USD exchange rate forecasts (ExBul1, ExBul3, ExBul5 and
ExBul7)
At first glance we can say that three out of four forecasts overestimate the forecasted
exchange rate but if we compare the slope of the forecasts and the actual development of the
exchange rate, two of them have well predicted the tendency (ExBul1 and ExBul3). With respect
to the latest available information at the time of forecast generation, three markets have predicted
increasing exchange rates. In contrast to the inflation forecasts, past underestimations of the
predicted exchange rate have not had reverse impact on the successive forecasts, as for example
the market ExBul3 seems to incorporate the latest available data (about the declining exchange
rate) thereby avoiding further underestimation.
It is also interesting to study how the forecast of January 2003 BGN-USD exchange rate
developed in the course of time (see figure 5).
25 Exchange rate final market forecasts are calculated on the basis of the last traded prices.
1.800
1.850
1.900
1.950
2.000
2.050
2.100
2.150
2.200
2.250
2.300
Dec-01 Jan-02 Feb-02 Mar-02 Apr-02 May-02 June-02 July-02 Aug-02 Sep-02 Oct-02 Nov-02 Dec-02 Jan-03
BGN
per 1
USD
BGN/USD exchange rate ExBul1 ExBul3 ExBul5 ExBul7

18
Figure 5 Medium- and short-term final BGN-USD exchange rate forecasts (ExBul2,
ExBul4, ExBul6 and ExBul7)
All four markets overestimate the actual value of the exchange rate, although not all of
them revealed expectations for an increasing exchange rate (for instance the ExBul4 market
forecast has a downward slope). In spite of the fact that these expectations seem quite persistent
since the first signals of the decline of the BGN-USD exchange rate appeared in March 2002,
ExBul6 predicts a higher than the current exchange rate due to the high volatility of the foreign
exchange markets and the unexpectedly abrupt, great and continuing depreciation of the USD
against the EUR. With shortening of the forecasting horizon, the markets generate much more
accurate forecasts while still overestimating the exchange rate.
Altogether, naive forecasts do not outperform the experimental forecasting markets like
in the inflation forecasting markets. However, similar to them, there seems to be a strong long-
term belief (of EUR (respectively BGN) devaluations against USD) guiding trader’s behaviour.
This belief is likely to be induced by the historical development of the BGN-USD exchange rate
(see figure 6), i.e. some from of backward-looking behaviour. Fro the last two years the BGN-
USD exchange rate has been above the level of 2 levs per single USD and this level might be
some form of psychological level which is unlikely to be undershot. This is most probably the
1.800
1.850
1.900
1.950
2.000
2.050
2.100
2.150
2.200
2.250
2.300
Dec-01 Jan-02 Feb-02 Mar-02 Apr-02 May-02 June-02 July-02 Aug-02 Sep-02 Oct-02 Nov-02 Dec-02 Jan-03
BGN
per 1
USD
BGN/USD exchange rate ExBul1 ExBul3 ExBul5 ExBul7

19
reason why market forecasts overestimate the actual development even after the first drastic
decline of the BGN-USD exchange rate in March 2002.
Figure 6 BGN-USD exchange rate 2000-2003
1.7
1.8
1.9
2.0
2.1
2.2
2.3
2.4
2.5
Jan
Feb
Mar
Apr
May Jun
Jul
Aug
Sep
Oct
Nov
Dec Jan
Feb
Mar
Apr
May Jun
Jul
Aug
Sep
Oct
Nov
Dec Jan
Feb
Mar
Apr
May Jun
Jul
Aug
Sep
Oct
Nov
Dec Jan
Feb
Mar
2000 2001 2002 2003
BGN-
USD
exch
ange
rate
5. Conclusions
Altogether, the forecasting success of the Bulgarian markets was not overwhelming. This
is especially true for the inflation markets which performed very poorly. The exchange rate
forecasts were of better quality but did also not outperform the naive forecasts systematically.
The number of markets we conducted in Bulgaria throughout 2002 is obviously too small to be
able to run any kind of statistical tests which would allow to judge the accuracy of the market
forecasts. Nevertheless, the experiences with the Bulgarian pilot markets are valuable since they

20
indicate that the chosen design might have its deficiencies. There are several possible reasons
which might have contributed to the relatively low quality of the mean forecasts generated by the
experimental markets in Bulgaria. We will discuss them in the following.
First, the number of traders which participated in the markets was quite low. While the
earlier reported results from political stock markets indicate that the number of traders in general
has no significant influence on electronic markets' forecasting abilities,26 it seems reasonable to
suspect that there is a minimum number of active traders which is necessary to generate
reasonable forecasts. Since in all political stock markets in Germany the number of active traders
was well above 25 traders the empirical finding that the number of active traders is no significant
factor in determining electronic markets' accuracy is not contradicting this argument. In fact, this
empirical finding might be taken as an indication that the gain in forecast accuracy quickly
diminishes with an increasing number of traders well above a minimum number of informed
traders. It is interesting to note that the early markets performed better than the later ones. Since
the number of active traders was considerably higher in the first conducted markets the suspicion
of a too low number of informed and active traders is somewhat substantiated. Thus, one might
argue that conducting experts markets is a step into the wrong direction.27 However, one might
also argue that the market would have performed better if a larger number of experts would have
taken part. We tend to the latter view: experts markets might be a useful solution whenever a
significant number of experts takes part.
Second, the market periods might have been too short to allow all information in the
market to be revealed by market prices. While, as we argued earlier, we can not study efficiency
properties of the Bulgarian markets due to the short market periods, it might be suspected that
the market participants would have needed some more time to learn about the market features.
Most of the participants in the German markets reported earlier were students. The number of
logins of the active traders in these markets was considerably higher than in the Bulgarian
experts markets. This finding is not too surprising since experts typically have to economize on
26 See Berlemann and Schmidt (2001). 27 There is an interesting parallel to the studies of the relative performance of inflation surveys of amateur and professional forecasters which were reported earlier. Several studies found surveys of experts to perform worse than those of households due to the fact that most of them still use some econometric forecasting systems, and there are studies (Lamont (2001)) reporting that the older and more established the professional forecasters become, the more radical and inaccurate forecasts they produce.

21
their time. Easier access to the Internet (or lower transaction costs) might also be an important
factor of the number of logins (and transactions).
Third, it is possible that the incentive system was distorting thereby contributing to the
low accuracy of the market forecasts. One might argue that incentive structures as the one we
used in the Bulgarian markets might induce risk-seeking behaviour of the participants. Since
only the three most successful traders were rewarded and their trading success published the
final rank of a trader did not matter when not belonging the three most successful ones. Thus, the
more traders are involved into the markets the more risky a strategy has to be chosen in order to
rank among the best participants28. One might suspect that the prices will therefore be biased in a
way that objectively unlikely events are overvalued and vice versa. While this potential effect is
somewhat mitigated by the additional reward for the groups one might still argue that the
incentives are somewhat distorted since some traders might feel that their individual return will
have only a marginal impact on the group return when groups are large.
One possibility to overcome the incentive problem is to pay rewards to all or at least a
larger number of participants. However, in order to be able to do so, the market organizer has to
provide the necessary funds. An alternative way to create non-distorting non-monetary
incentives in experts markets is to publish not only the results of the best performing traders but
all individual returns on investment. In this case it still makes a difference whether one ends up
on the fourth or on the last rank. While we initially preferred this method for the Bulgarian
markets we finally decided against it since publishing all results might have prevented many
experts from taking part. The question whether publishing all individual results is more useful
has to be left open for future research.
One might suspect that the choice of the contract portfolio, which is traded in
experimental markets, has some influence on traders’ behaviour and expectations. This might be
particularly true when dealing with comparatively volatile environment as is the case in Bulgaria
and other transition countries. Hesitating about the future value of an indicator, a trader might
prefer to bet in the middle of the range, thereby underestimating the possibility that the variable
to be forecasted falls into or out of one of the boundaries. Hence, we have a serious suggestion
28 The results of the surveys show that 36% of all participants describe themselves as risk loving, 40% - as risk neutral and hardly 24% were risk averse.

22
that this happened in the Bulgarian inflation markets, supported by the fact that the experimental
forecasting markets were an extremely new forecasting environment for all participants.
One of the reasons to establish the pilot forecasting system was the fact that (inflation)
forecasts were hardly available in Bulgaria al least at the time when the project was in its initial
stage. Only 24% of the participants had information on official forecasts. Describing their
sources of information, it turns out that most of them are international institutions’ forecasts
(IMF, WB, Deutsche Bundesbank, and the Economist). Although some sources are local
(Bulgarian National Bank, Agency for Economic Analysis and Forecasts, Ministry of Finance),
it is worth noting that only a comparatively small number of participants had access to these
forecasts. Hence there is a need of high quality and publicly available forecasts of key
macroeconomic variables in Bulgaria. Since conventional forecasting methods do not perform
well in very dynamic environments like the one in transition countries, the pilot experimental
forecasting system offers an alternative approach with forecasts of various horizons at
comparatively low costs.
However, while the Bulgarian markets might have suffered from some inefficiencies they
also showed that the problem to generate medium-term forecasts of macroeconomic variables
can be solved by a staggered system of forecasting markets. Almost all traders which were
engaged in the short-term markets also took part in the medium-term markets. Running forecast
markets with different time horizons also allows us to make projections of inflation in the form
of fan charts. Since the Bank of England introduced this form of presenting inflation projections
in their inflation reports fan charts have become a standard way of figuring out the uncertainty
surrounding the mean forecasts. In figure 7 we show such a fan chart for the two inflation
markets conducted in January 2002. To construct the fan chart we assumed a normally
distributed market forecast.29
29 For reasons of simplicity the uncertainty bands were constructed via linear interpolation of the two observations of means and standard deviations at hand.

23
Fanchart year-on-year CPI inflation Bulgaria 2002.
0
2
4
6
8
10
12
Jan01
Feb01
Mrz01
Apr01
Mai01
Jun01
Jul01
Aug01
Sep01
Okt01
Nov01
Dez01
Jan02
Feb02
Mrz02
Apr02
Mai02
Jun02
Jul02
Aug02
Sep02
Okt02
Nov02
Dez02
Infla
tion
rate
in p
erce
nt
yoy CPI change Mean Market Forecast Upper Bound 50%-Quantile Lower Bound 50%-Quantile
Upper Bound 75%-Quantile Lower Bound 75%-Quantile Upper Bound 95%-Quantile Lower Bound 95%-Quantile

24
References Balyozov, Z. (1999), “The Bulgarian Financial Crisis of 1996-1997”, Discussion Paper
Discussion Paper No.7, Bulgarian National Bank.
Beck, S., J. Miller and M. Saad (2003), “Inflation and the Bulgarian Currency Board”, BNB
Discussion Paper No. 31, Bulgarian National Bank.
Berg, J., F. Nelson and T. Rietz (1997), “What Makes Markets Predict Well? Evidence from the
Iowa Electronic Markets”, in: W. Alberts et al. (Eds.), Understanding Strategic Interaction. Essays in
Honour of Reinhard Selten, Berlin, pp. 444-463.
Berlemann, M. (2002), “Forecasting Inflation via Electronic Markets Results from a Prototype
Experiment”, BNB Discussion Paper No. 20, Bulgarian National Bank.
Berlemann, M and F. Nelson (2005), “Forecasting Inflation via Experimental Stock Markets.
Some Results form Pilot Markets”, Working Paper, Dresden University of Technology and Tippie
College of Business.
Berlemann, M. and N. Nenovsky (2003), “Lending of First versus Lending of Last Resort: The
Bulgarian Financial Crisis 1996/1997”, Comparative Economic Studies (forthcoming).
Berlemann, M. and C. Schmidt (2001), „Predictive Accuracy of Political Stock Markets.
Empirical Evidence from an European Perspective”, Dresden Discussion Papers in Economics No. 5,
Dresden University of Technology.
Blanchard, O. (1998), “The Optimal Speed of Disinflation: The Case of Hungary”; in C.
Cottarelli and G. Szapary (Eds.), “Moderate Inflation: The Experience of Transition Countries”,
Washington D.C., IMF – NBH.
Bohm, P. and J. Sonnegard (1999), “Political Stock Markets and Unreliable Rolls”, Scandinavian
Journal of Economics, Vol. 101, pp. 2005-222.
Bulgarian National Bank (1996, 1997, 1998, 1999, 2000), Annual Report, Bulgarian National
Bank.
Cahlik, T., A. Gersl, M. Hlavacek and M. Berlemann (2002), “Use of Experimental Markets for
Predictions”, Merit Research Working Paper No.6.
Coorey, S., M. Mecagni and E. Offerdal (1998), “Disinflation in Transition Countries: The Role
of Relative Price Adjustment”; in C. Cottarelli and G. Szapary (Eds.), “Moderate Inflation: The
Experience of Transition Countries”, Washington D.C., IMF – NBH.
Copeland, T. and J. Weston (1992), “Financial Theory and Corporate Policy”, 3rd edition,
Reading/Mass.

25
Cukierman, A. (1982), “Relative Price Variability, Inflation and the Allocative Efficiency of the
Price System”, Journal of Monetary Economics, Vol. 9, pp. 131-162.
Eichberger, J. and I. Harper (1997), “Financial Economics”, Oxford.
Enoch, C., A.-M. Gulde, and D. Hardy, (2002), “Banking Crises and Bank Resolution:
Experiences in Some Transition Countries”, IMF Working Paper No. 56, International Monetary Fund,
Washington D.C.
Forsythe, R. F. Nelson, G. R. Neumann and J. Wright (1992), “Anatomy of an Experimental
Stock Market”, American Economic Review, Vol. 82, p. 1142-1161.
Forsythe, R., M. Frank, V. Krishnamurthy and T. Ross (1995), “Using Market Prices to Predict
Election Results: The 1993 UBC Election stock Market”, Canadian Journal of Economics, Vol. 28, pp.
739-770.
Jacobsen, B., J. Potters, A. Schram, F. van Winden and J. Wit (2000), “(In)accuracy of a
European Political Stock Market: The Influence of Common Value Structures”, European Economic
Review, Vol. 44, pp. 205-230.
Komulainen, T. and J. Pirttila (2000), “Fiscal Explanation for Inflation: Any Evidence for
Transition Countries?”, BOFIT Discussion Paper no.11, Bank of Finland, Helsinki.
Lamont, O. (2002), “Macroeconomic Forecasts and Microeconomic Forecasters”, Journal of
Economic Behaviour and Organization, Vol. 48, pp. 265-280.
OECD (1997, 1999), Economic Survey of Bulgaria, Paris.
Pujol, T. and M. Griffiths (1998), “Moderate Inflation in Poland: A Real Story”, in C. Cottarelli
and G. Szapary (Eds.), “Moderate Inflation: The Experience of Transition Countries”, Washington D.C.,
IMF – NBH.
Woodford, M. (1995), “Price Level Determinacy without Control of a Monetary Aggregate”,
Carnegie-Rochester Conference Series on Public Policy 43 (December 1995), p. 1-46.
Woodford, M. (2001), “Fiscal Requirements for Price Stability”, Journal of Money, Credit and
Banking, Vol. 33, p. 669-728.

DAVIDSON INSTITUTE WORKING PAPER SERIES - Most Recent Papers The entire Working Paper Series may be downloaded free of charge at: www.wdi.bus.umich.edu
CURRENT AS OF 5/20/05 Publication Authors Date No. 775: Is The Link Between Reforms And Growth Spurious? A Comment
Tomasz Mickiewicz May 2005
No. 774: The Risk Aversion of Banks in Emerging Credit markets: Evidence from India
Sumon Kumar Bhaumik and Jenifer Piesse
May 2005
No. 773: Organized Labor and Restructuring: Coal Mines in the Czech Republic and Romania
Jan Bruha, Delia Ionascu, and Byeongju Jeong
May 2005
No. 772: Is Political Risk Company-Specific? The Market Side of the Yukos Affair
Alexei Goriaev and Konstantin Sonin
May 2005
No. 771: Non-Linear Exchange Rate Dynamics in Target Zones: A Bumpy Road Towards A Honeymoon
Jesús Crespo-Cuaresma, Balázs Égert, and Ronald MacDonald
May 2005
No. 770: Equilibrium Exchange Rates in Southeastern Europe, Russia, Ukraine and Turkey: Healthy or (Dutch) Diseased?
Balázs Égert May 2005
No. 769: Equilibrium Exchange Rates in Central and Eastern Europe: A Meta-Regression Analysis
Balázs Égert and László Halpern
May 2005
No. 768: Testing for inflation convergence between the Euro Zone and its CEE partners
Imed Drine and Christophe Rault Apr. 2005
No. 767: Labor Mobility during Transition: Evidence from the Czech Republic
Jan Fidrmuc Apr. 2005
No. 766: Formation of social capital in Central and Eastern Europe: Understanding the gap vis-à-vis developed countries
Jan Fidrmuc and Klarita Gërxhani Apr. 2005
No. 765: Do Regional Integration Agreements Increase Business-Cycle Convergence? Evidence From APEC and NAFTA
Viviana Fernandez and Ali M. Kutan
Apr. 2005
No. 764: State Regulations, Job Search and Wage Bargaining: A Study in the Economics of the Informal Sector
Maxim Bouev Apr. 2005
No. 763: The Feldstein-Horioka Puzzle Revisited: An “European-Regional” Perspective
Jérôme Hericourt and Mathilde Maurel
Apr. 2005
No. 762: Transatlantic Differences in Labour Markets Changes in Wage and Non-Employment Structures in the 1980s and the 1990s
Patrick A. Puhani Mar. 2005
No. 761: Resolution, Recovery and Survival: The Evolution of Payment Disputes in Post-Socialist Europe
William Pyle Mar. 2005
No. 760: Official Foreign Exchange Interventions in the Czech Republic: Did They Matter?
Balázs Égert and Luboš Komárek Mar. 2005
No. 759: Assessing Market Expectations on Exchange Rates and Inflation: A Pilot Forecasting System for Bulgaria
Michael Berlemann, Kalina Dimitrova, & Nikolay Nenovsky
Mar. 2005
No. 758: Attitudes and Performance: An Analysis of Russian Workers Susan J. Linz and Anastasia Semykina
Mar. 2005
No. 757: Barter, Credit, and Welfare: A theoretical inquiry into the barter phenomenon in Russia
José Noguera and Susan J. Linz
Mar. 2005
No. 756: Sorting, Selection, and Transformation of the Return to College Education In China
Belton M. Fleisher, Haizheng Li, Shi Li, and Xiaojun Wang
Mar. 2005
No. 755: Foreign Exchange Interventions in Emerging Europe: Should We Give a Damn? The Case of Croatia and Turkey
Balázs Égert and Maroje Lang
Mar. 2005
No. 754: Targeting Relative Inflation Forecast as Monetary Policy Framework for Adopting Euro
Lucjan T. Orlowski Feb. 2005
No. 753: Internet Entrepreneurship: Networks and Performance of Internet Ventures In China
Bat Batjargal Feb. 2005
No. 752: Network Triads: Transitivity, Referral and Venture Capital Decisions in China and Russia
Bat Batjargal Feb. 2005
No. 751: Software Entrepreneurship: Knowledge Networks and Performance Of Software Ventures In China and Russia
Bat Batjargal Feb. 2005
No. 750: Retained State Shareholding in Chinese PLCs: Does Government Ownership Reduce Corporate Value?
Lihui Tian and Saul Estrin Feb. 2005
No. 749: Financial Development and Technology Solomon Tadesse Feb. 2005


