Assessing labour market shortages - GOV UK · Assessing labour market shortages-A methodology...
34
Assessing labour market shortages Migration Advisory Committee January 2017 A methodology update
Transcript of Assessing labour market shortages - GOV UK · Assessing labour market shortages-A methodology...

Assessing labour market shortages
Migration Advisory Committee
January 2017
A methodology update

Migration Advisory Committee, 3rd Floor, Seacole Building, 2 Marsham Street, London, SW1P 4DF. www.gov.uk/government/organisations/migration-advisory-committee Email: [email protected] Twitter: @MACindependent

Assessing labour market shortages- A methodology update
Migration Advisory Committee
January 2017

Contents
Chairman’s Foreword ........................................................................................... 1
1.1 Introduction .................................................................................... 5
1.2 History of the MAC shortage methodology .................................... 5
1.2.1 Identifying shortage indicators ....................................................... 5
1.2.2 Reaching an overall assessment of shortage ................................ 8
1.2.3 Subsequent changes to the methodology ...................................... 9
1.3 Why review the MAC’s shortage methodology now? ................... 10
1.3.1 Changing availability of data ........................................................ 11
1.3.2 Benchmarking .............................................................................. 11
1.4 MAC internal review of the methodology ..................................... 11
1.4.1 Conceptual approach ................................................................... 12
1.4.2 Labour turnover measures ........................................................... 12
1.5 Changes in data availability ......................................................... 15
1.5.1 Web-scraped vacancy data ......................................................... 15
1.5.2 Employer Skills Survey ................................................................ 18
1.6 The decision to re-benchmark ..................................................... 20
1.6.1 Updating the benchmarks ............................................................ 23
1.7 Moving forward ............................................................................ 26
Annex A MAC shortage methodology from spring 2016 ....................... 27
References ..................................................................................................... 29
Contents

Chairman’s Foreword
Since its beginning, one of the roles played by the MAC has been to decide which occupations should be placed on the Shortage Occupation List (SOL). Being on the SOL conveys certain advantages when it comes to hiring migrants. There is no requirement to pass the Resident Labour Market Test, migrants do not have to meet the £35,000 earnings minimum for permanent settlement and are given priority if the monthly quota for Tier 2 general migrants is met. In deciding which occupations to place on the SOL, the MAC has always used three criteria – is the job skilled, is it in shortage and is it sensible to fill those shortages using migrant labour. This review is not about the skilled and sensible parts of this process, only the shortage part. In assessing shortage the MAC uses a set of top-down indicators as well as bottom-up intelligence from partners and other sources. We might expect a labour market in shortage to show evidence of high vacancy rates, rising employment and upward pressure on wages and the top-down indicators are designed to measure these outcomes. Periodically, the top-down indicators have been revised and this report represents the latest incarnation of this process. The need for a new set of indicators is partly forced on us by discontinuation of the occupation-level vacancy statistics from the Department for Work and Pensions on which we used to rely. But this represents an opportunity as well as a problem as, increasingly, fewer vacancies are advertised through job centres, especially for the graduate-level occupations that are the only ones allowed under Tier 2. In place of these vacancy statistics we are now using data from Burning Glass, which scrapes job advertisements off the web. This data has only been collected for a few years and the methodology is continually improving so that our current use should be thought of as experimental rather than definitive. But we do think this type of data source for vacancies offers the prospect of being more reliable and available both at a finer-grained level and in real time. We have also reviewed the indicators used to check they were working as intended. And for those we decided do have continued value we assessed the thresholds we use to decide whether an occupation is in shortage or not. Our last revision was in the depths of a very severe recession and, as the labour market evolves, some benchmarks seem less sensible than they once did. It should be emphasized that the top-down indicators have never been used in a mechanical way to determine whether an occupation is in shortage. But they
Chairman’s Foreword

Chairman’s Foreword
2
always have and continue to provide important background information on occupational labour markets. One important source of occupational vacancy statistics is the ESS which was conducted by UKCES, a body that no longer exists. The ESS provides a valuable source of data to us and we understand and hope that it will continue in something like its present form. This is unlikely to be the last ever review of our indicators – we are always open to revising our methodology to provide the best possible set of indicators.
Professor Alan Manning

The Migration Advisory Committee (MAC) is a non-statutory, non-time limited, non-departmental public body (NDPB) which was established in 2007 and is funded by the Home Office. The MAC is comprised of economists and migration experts who are publicly appointed in line with guidance published by the Office of the Commissioner for Public Appointments; along with a representative from the Home Office.
Chair Members Home Office
representative
Professor Alan Manning from March 2015
Dr Jennifer Smith from November 2012
Professor Jackline Wahba from November 2012
Paul Regan
Madeleine Sumption from July 2016
The secretariat
Alessandra Caroni; Maria Del Castillo; Stephen Earl; Paul Garner; Tim Harrison; Christopher Haynes; Baljit Khinder; Christine Stone; Yasmine Stoner; Josephine Thomas.
The Migration Advisory Committee and Secretariat


1.1 Introduction
1.1 The MAC has been assessing labour market shortages and recommending occupations and job titles for inclusion on the UK’s Shortage Occupation List since 2008. When the MAC first set out to assess shortage, we spent some time developing a methodology which we laid out in our first report recommending shortage occupations (Migration Advisory Committee, 2008).
1.2 Since then, the MAC has continued to apply this methodology, introducing a set of revisions in 2010 to help factor in the impact of the recession while assessing shortage (Migration Advisory Committee, 2010).
1.3 This paper sets out the results of an internal methodology review carried out by the MAC during 2016. Such a review was necessary as a result of emerging issues with the availability and quality of data considered later in this report. This review considers only the MAC approach to shortage, as the methodology for the skill and sensible criteria remain unchanged.
1.4 First, we revisit the rationale for the approach adopted in 2008 and revised in 2010 to include benchmarking our shortage indicators to the pre-recession period. Second, we explain the rationale for considering updates to the methodology at this juncture. Third, we set out the work we undertook to review the methodology. Finally, we set out the revised methodology which will be adopted by the MAC in future reviews of labour market shortage in the UK.
1.2 History of the MAC shortage methodology
1.5 When the MAC set out to establish a methodology for assessing labour market shortages, we came across an immediate problem. There was no universal definition or measure of skill or labour shortage at the time. Veneri (1999) states that: “no single empirical measure of occupational shortages exists, nor does it appear that one can easily be developed” while Green (1998) states that “there remains substantial ambiguity about what a skill shortage amounts to”. Bosworth (1993) describes measuring skill shortage as “a ‘notoriously difficult’ task" and says that "there is no one ‘best way’ to do it".
1.6 Since the original methodology was established, the literature around occupational skill shortages has continued to lack a clear definition or means of measurement. The National Institute of Labour Studies, Australia (2007) stated that “There is no simple reliable measure of the existence of a skill shortage”, further stating that “It is necessary to draw on a range of indicators”. Clearly, the establishment of a methodology for assessing shortage would unavoidably involve some element of judgement and pragmatism.
1.2.1 Identifying shortage indicators
1.7 Recognising these limitations, we identified four basic sets of indicators which, when considered together, provide the best data based on a ‘top-

Assessing labour market shortages-A methodology update
6
down’ assessment of shortage. The four sets test for the different ways in which a labour market shortage may be manifested and cover employer-based, price-based and volume-based indicators as well as indicators of labour market imbalance (Table 1). Though, it should be noted that while each of the methods listed below is used to indicate shortage, they may instead be a result of other scenarios such as an overall expansion of that occupation.
Table 1: Sets of shortage methodology indicators
Indicator set Description
Employer-based indicators
Employer-based indicators are derived from surveys that ask employers direct questions about their demand for workers and their ability to recruit. Rising vacancy rates may suggest that employers are finding it hard to fill jobs. This data provides a valuable employer perspective however is limited by only providing what employers choose to report.
Price-based indicators
In the case of a labour shortage, market pressure should increase wages, helping to raise supply and reduce demand, thus restoring labour market equilibrium. On this basis, rising wages within an occupation can be considered to provide an indication of shortage.
Volume-based indicators
Increases in employment or increases in average hours worked may indicate rising demand and greater utilisation of the existing workforce, which could indicate shortage. Low or falling unemployment among people previously employed in, or seeking work in, an occupation may also indicate shortage (conversely high unemployment amongst people seeking work in a particular occupation is an indicator than an occupation is not in shortage).
Indicators of imbalance
Indicators of imbalance focus directly on the vacancy levels within an occupation. A high vacancy/unemployment ratio within an occupation suggests that employers are having particular difficulty filling vacancies given the supply of workers available. Similarly an increase in the average vacancy duration also indicates that employers are finding it more difficult to fill vacancies.

Assessing labour market shortages-A methodology update
7
1.8 Within these four broad areas, we undertook extensive research and testing to choose specific indicators. After assessing a range of potential indicators against the criteria of validity, robustness, distribution of observations and other data limitations, we chose three employer-based indicators, three price-based indicators, four volume-based indicators and two indicators of imbalance. These indicators are listed in Table 2.
Table 2: Our existing twelve indicators of occupational shortage Indicator Frequency
available Source used
Employer based indicators
E1: Skill shortage vacancies as a share of employment
Biennially ESS and LFS
E2: Skill shortage vacancies as a share of all vacancies
Biennially ESS
E3: Skill shortage vacancies as a share of all hard to fill vacancies
Biennially ESS
Price-based indicators
P1: Percentage change in median hourly pay for all employees (one year)
Annually ASHE
P2: Percentage change in median hourly pay for all employees (three years)
Annually ASHE
P3: Relative premium to a skilled occupation, controlling for region and age.
Quarterly LFS
Volume-based indicators
V1: Annual percentage change in claimant count by sought occupation
Monthly NOMIS
V2: Annual percentage change in hours worked for full-time employees
Annually ASHE
V3: Annual percentage change in employment
Quarterly LFS
V4: Absolute change in proportion of workers in occupation less than 1 year
Quarterly LFS
Indicators of imbalance based on administrative data
I1: Absolute change in median vacancy duration*
N/A NOMIS
I2: Stock of vacancies/claimant count by sought occupation*
N/A NOMIS
Notes: * Dictates data sources that are no longer available. ESS refers to the Employer Skills Survey, LFS refers to the Labour Force survey and ASHE refers to the Annual Survey of Hours and Earnings
1.9 Having identified our shortage indicators, the next step was to determine the level or threshold at which we considered an indicator to demonstrate shortage. By necessity, this introduced an element of judgement. As highlighted above, there is no convenient economic theory or rule of thumb around which we could base our indicator thresholds. There was little to guide us as to what proportion of occupations might reasonably be considered to be in shortage at any one time making it impossible to know whether a threshold is well calibrated. Instead we developed an approach,

Assessing labour market shortages-A methodology update
8
which in our judgement gave us the best opportunity of making a reasonable assessment of shortage.
1.10 The main consideration was whether it was better to set an ‘absolute’ or a ‘relative’ threshold. A relative threshold identifies occupations that exhibit properties of shortage relative to their counterparts while an absolute threshold requires an objective assessment of what constitutes shortage for each indicator.
1.11 We concluded that it is theoretically appealing to strive for an absolute threshold, because it allows the number of occupations passing a threshold to vary according to labour market conditions.
1.12 The median value across the distribution - plus 50 per cent - was used as the preferred basis for choosing the threshold value for each indicator as, for a given period, it works towards being an ‘absolute’ threshold as it does not automatically identify any particular number of occupations as being in shortage. However, this choice of threshold is very dependent on the magnitude of the value of the median. For example:
If the median is close to zero, then the median plus 50 per cent will also be close to zero even if the spread of the distribution is very large;
It is possible for the median plus 50 per cent to far exceed the maximum value of the distribution.
1.13 Therefore, in cases where the median plus 50 per cent was not an appropriate fit for the distribution of values for a particular indicator (for example where the V2 indicator was clustered around 0), we used the top quartile to set the threshold.
1.2.2 Reaching an overall assessment of shortage
1.14 In using these indicators to assess occupational shortage, we concluded that the appropriate test is not whether an occupation is indicating shortage across the full range of indicators. Equally, an occupation might indicate shortage on a small number of indicators without being in shortage – pay might rise faster than average in an occupation because of above average increases in productivity in that occupation, without being in shortage.
1.15 Instead, a reasonable test is that, across the range of indicators, the evidence broadly points towards shortage. This reflects that not all labour markets will respond to shortage in the same way.
1.16 For example, pay might rise more slowly in response to shortage in a public sector labour market than in the private sector. Moreover, when a shortage initially arises, hours might increase to reflect shortage but if a shortage has been in place for several years there may be limited capacity to increase overtime. In this example an hours indicator would not show shortage but the pay and employer-based indicators would be expected to show the sustained shortage.

Assessing labour market shortages-A methodology update
9
1.17 We therefore decided to adopt an approach where an occupation was deemed to be in shortage, on the basis of ’top-down’ analysis, if a majority of indicators were pointing to shortage.
1.18 In addition, given the limitations in the data, we also recognised the importance of stakeholder views in assessing shortage. The gathering of ‘bottom-up’ evidence from partners continues to play a fundamental role in our assessment of shortage as it provides a granular picture which brings issues to light that are not clear from an examination of the ‘top-down’ data alone.
1.19 There is no conclusive measure of shortage and this methodology was not intended as such. Our ‘top-down’ assessment has been combined with a ‘bottom-up’ perspective in order to inform our recommendations to government as to which occupations and job titles should be placed on the shortage occupation list.
1.2.3 Subsequent changes to the methodology
1.20 In the years following the creation of the original methodology, a number of amendments were made by the MAC which were subsequently peer reviewed in a report commissioned out to Frontier Economics1. This included some changes to the original indicators:
The first two price-based indicators were revised to the percentage change in median real pay over one and three years respectively;
The change in employment was assessed over three years instead of one;
The fourth volume-based indicator was replaced with an indicator examining the change in new hires, sourced from ASHE.
1.21 In addition, Frontier Economics were commissioned by the MAC in 2010 to examine whether the current approach to determine thresholds was likely to be robust in the face of changes in the economic cycle: in other words, whether the approach to date exhibited any automatic stabiliser properties. They noted that, consistent with both theoretical and empirical observations, indicators with an automatic stabiliser property should identify more occupations in shortage during a boom and fewer during a recession.
1.22 In order to ensure the indicators did build in some automatic stabiliser properties, we decided to fix the thresholds to autumn 2008 data, rather than allowing them to be determined each time the analysis was run.
1.23 The rationale behind this approach is to fix the threshold for an indicator to its value in a particular period close to the peak of the economic cycle. Therefore, if for a given indicator, the distribution of values shifts downwards in response to changes in economic conditions then fewer occupations will be identified as in shortage, and vice versa. Benchmarking provides a
1 Further details of these, and other, changes can be found in MAC (2012)

Assessing labour market shortages-A methodology update
10
method of setting an ‘absolute’ threshold for each indicator over time and, as a result, provides them with an ‘automatic stabiliser’ property. A hypothetical example of this can be seen in Box 1.
1.3 Why review the MAC’s shortage methodology now?
1.24 Since the last major revision to our shortage methodology in 2010, there have been a number of developments in data sources available to assess occupational shortage. In addition, the MAC considered it timely to review the general approach to ensure it remains fit for purpose.
Box 1: Benchmarking the shortage indicators
The diagram below demonstrates how fixing the threshold for an indicator to a particular value gives it an ‘automatic stabiliser’ property over time. The diagram shows a stylised example of the distribution of an indicator over time. Periods A and C are times of economic growth and period B recession.
As the median changes with the economic cycle so too does the ‘median plus 50 per cent’ threshold. The number of occupations identified in shortage is illustrated by the distribution captured between the median plus 50 per cent and the occupation with the highest value in the distribution. In period B, under a ‘median plus 50 percent’ approach a similar number of occupations are deemed to be in shortage compared to periods A and C because the threshold moves with the median of the indicator.
Under the proposed benchmarking approach, we fix the threshold to a period in the economic cycle. For illustrative purposes, we fix this threshold to the value in period A. The number of occupations identified in shortage is now shown by the distribution above the red benchmark line and below the occupation with the highest value. Again, in periods A and C a positive number of occupations are identified in shortage. However, in period B no occupations are identified as in shortage. Therefore benchmarking provides the indicator with an ‘automatic stabiliser’ property over time.
Benchmark Fix Threshold
Max
Median + 50%
Median
Time
C B A
Short
age I
ndic
ato
r

Assessing labour market shortages-A methodology update
11
1.3.1 Changing availability of data
1.25 Two of the 12 current indicators (stock of vacancies / claimant count by sought occupation and absolute change in mean vacancy duration) relied on NOMIS occupational vacancy statistics which were discontinued by the Department for Work and Pensions in November 2012. This has meant that the number of available shortage indicators has been reduced to ten for the last three MAC reviews of shortage.
1.26 Furthermore, three of the remaining shortage indicators are sourced from the Employer Skills Survey (ESS). To date, this survey has been carried out biennially by the UK Commission for Employment and Skills. However, the survey faces an uncertain future due to the disbanding of UKCES, with responsibility for the survey being transferred to the Department for Education.
1.27 These data challenges meant that it was sensible to consider alternative data sources.
1.28 On the other hand, the recent development of new timely datasets populated by web-scraping vacancy information from online job postings provided an opportunity to potentially incorporate a more detailed analysis of the specific skills that are in shortage. It could be used to help bridge a gap that currently exists between our top-down quantitative approach (using 4-digit SOC) and the bottom-up, mostly qualitative approach which can be finer-grained to consider specific job titles.
1.29 As the data is provided in real time, it is possible to provide far more up-to-date information on any occupation than the annual or biennial data that is currently used for Pay and the ESS respectively.
1.30 As well as using this data to more granularly consider issues relating to specific job titles within an occupation, the higher level 4 digit SOC data can be used as an alternative for the NOMIS occupational vacancy statistics that are no longer produced which we discuss later in the report.
1.3.2 Benchmarking
1.31 The current benchmarks were set in 2010 using data from 2008. The intention being that during the recession and subsequent recovery, shortage would be assessed against a previous period of labour market tightness. Since the UK labour market is currently at record high employment and participation rates, and a great deal will have changed over the eight year period regardless, the MAC considered it appropriate to consider updating these benchmarks so they better reflect current labour market conditions.
1.4 MAC internal review of the methodology
1.32 We carried out an internal review of our shortage methodology, focusing on the following issues:

Assessing labour market shortages-A methodology update
12
Whether the conceptual approach to assessing shortage remained fit for purpose;
Whether the changes in data availability had any implications for our shortage methodology; and
Whether the benchmarking approach had worked as expected during the recession and whether it was now appropriate to update the thresholds.
1.33 For this review, we will be using data only for years where the MAC has published a report on shortage and therefore where the data is readily available. This means that we will be using the data as it was when the report was written, regardless of subsequent revisions and means no data will be available for 2013 or 2014.
1.4.1 Conceptual approach
1.34 As the first step in our review, we considered whether the broad conceptual framework for assessing shortage was correct. There were a number of potential indicators that were considered for inclusion in the original 2008 methodology including changes in staff turnover and evidence of widespread outsourcing to other countries. These indicators were originally rejected in 2008 either due to methodological or data issues and revisiting these, we saw no reason to take a different view on this now.
1.35 We concluded that the broad conceptual approach in terms of assessing shortage using indicators grouped into the four sets described in Table 1 remains the best way to think about detecting shortages where they exist.
1.36 However, we were keen to explore potential new indicators including graduate outcome surveys and a new measure of labour turnover. We decided to take forward a labour turnover measure, considering flows into and out of occupations. More detail on this measure, and the reasoning for its inclusion are explored in further detail below.
1.4.2 Labour turnover measures
1.37 Examining entry and exit rates into and out of occupations could provide useful insights into labour market shortages as they develop. Similar employment dynamics indicators are produced by the US Census Bureau – see Hyatt and McEntarfer (2012)2 (although these are not currently focused on shortage, and currently published data tend to be disaggregated by industry rather than occupation).
1.38 Using the panel nature of the Annual Survey of Hours and Earnings (ASHE) microdata, it is possible to calculate both the entry and exit rates for an occupation, using the total employment in the initial period as the
2 Hyatt & McEntarfer (2012). Job-to-Job Flows in the Great Recession† American Economic
Review: Papers & Proceedings 2012, 102(3): 580–583

Assessing labour market shortages-A methodology update
13
denominator to create the rates for both entry and exit to and from that occupation (Box 2).
1.39 Entry rates include both those switching into the given occupation from a separate distinct occupation, along with those moving into the occupation from unemployment or inactivity. Similarly, the exit rate includes both those exiting the occupation to other occupations and those moving into unemployment or inactivity.
1.40 A net inflow measure equivalent to the change in employment can be calculated as the difference between the entry and exit rate. While the methodology already considers the net change in employment, this extension allows use to consider each of the components individually.
Box 2: Determining the entry and exit rate
We assume that there are three labour market states: two occupations A and B and non-employment U, over two periods, t and t+1 (however in reality, B represents all other occupations that are not A). These states are depicted in the diagram below:
Within this framework, four distinct flows are possible:
A1
A2 represents individuals retained within an occupation A1
B2 or B1
A2 represents individuals in employment switching occupation
A1
U2 or B1
U2 represents individuals exiting the labour market due to non-employment, death or migration U1
A2 or U1
B2 represents individuals entering the labour market from non-
employment (including full-time education) or migration.
In this example, we can use these flows to calculate both the entry and exit rate to and from occupation A, using employment in the initial time period t as a common denominator.
Entry rate =
=
Exit rate =
=

Assessing labour market shortages-A methodology update
14
1.41 There are several hypothesise that can be used to draw conclusions from the net inflow into an occupation. The interpretation of the measure depends on what is happening in the occupation or the industry at the time, the point in the economic cycle and issues specific to the occupation in question. As a result, it is necessary to consider each occupation on a case-by-case basis.
1.42 One hypothesis is that wages in a shortage occupation are bid up by monopsonistic employers facing higher hiring costs as a result of shortage. This would be the case in a private sector occupation such as IT professionals or Brokers in a tight labour market with flexibility to increase wages.
1.43 In this scenario, we would expect to see that:
The entry rate will rise:
High wages in shortage occupations will attract workers from other occupations and the non-employed (but there will not be an increase in within-occupation job-to-job flows since all wages in shortage occupations are bid up).
The exit rate will fall:
High wages in shortage occupations relative to other occupations and to non-employment benefits/utility will raise the payoff to staying in the current job for workers in shortage occupations, thereby reducing exits to other occupations and to non-employment.
1.44 As a result, the measure would rise in line with shortage. If, therefore, the net inflows were notably higher than in previous years, or for the average of all skilled occupations, we would consider this to be evidence of the occupation experiencing shortage.
1.45 It is important, too, to consider this measure alongside the other indicators of shortage, and evidence presented by partners. For example, if the relevant indicator were to show a fall in real wages, this may indicate that there was in fact simply a surplus of supply for the occupation, and not indicative of shortage.
1.46 Other hypothesis could apply to particular occupational subsets. For example, an unusually large net outflow from an occupation with an inability to set wage levels, such as is the case in a number of public sector occupations, alongside partner evidence suggesting retention was a factor in occupational shortage could lead to a totally different interpretation of the measure.
1.47 Separately, there is also value in separately assessing the net occupational switching rate. That is, ignoring flows into and out of the occupation to non-employment, to examine only switching to and from other occupations.

Assessing labour market shortages-A methodology update
15
1.48 When an occupation is in shortage, the net occupational switching rate may be expected to increase as wage growth induces individuals to switch occupations or due to employers accepting a lower quality skills match. While the overall entry and exit rates will be affected by a range of factors including demographics, the occupational switching rates could be considered to be a more focused indicator of shortage. Though, again, this measure needs to be considered alongside the other indicators to isolate the elements of shortage from other non-shortage occupational growth.
1.49 We considered how best to use these measures and, while in our view this information adds to our understanding of shortage, the level of detail to which these measures must be explained in order to draw conclusions, means that they are not suited to a pass/fail indicator style.
1.50 However, we will continue to calculate these employment dynamics and to report them alongside our indicators of shortage. Each of these measures will therefore be included alongside the standard MAC indicator grid and will be analysed alongside our ‘top-down’ analysis and ‘bottom-up’ evidence from partners in order to draw conclusions regarding shortage.
1.5 Changes in data availability
1.5.1 Web-scraped vacancy data
1.51 In recent years the rapid expansion in big data has led to the development of vacancy datasets that are populated by daily scraping of job postings on recruitment portals and employer websites. Compared to traditional data sources based on surveys and limited JCP administrative data, they offer the advantage of timeliness and do not suffer from the constraint of sample sizes or issues of whether graduate level vacancies are most likely to be filled via the JCP. In addition, developments in artificial intelligence means that a large proportion of the data contained in a job advert can be extracted, cleaned and codified for data analysis. Clearly then, this data has rich potential to contribute to the MAC’s assessment of labour market shortages.
1.52 The data does, however, exhibit a number of drawbacks. For one, Burning Glass only trawls through free to access jobsites which could lead to a bias to particular job occupations and professions. In addition, we are not able to conduct any lengthy time series analysis as the data collected by Burning Glass starts from January 2012 and improvements made to collection methods even over that period produces variations in the quality of data.
1.53 Burning Glass collect information directly from job adverts posted on the internet daily, including job title and occupation, location (city, local authority, travel to work area etc), technical skills, education requirement, employers and pay. By using a robust algorithm to avoid double counting of

Assessing labour market shortages-A methodology update
16
vacancies, it gives a detailed insight into the UK labour market for a particular industry, occupation and job title, dating back to January 2012.
1.54 The data provided by Burning Glass gives the gross number of new online job postings in a given time period. Previously, to estimate the shortage indicator I2, we used the stock of live unfilled vacancies from NOMIS, which is not the same. Burning Glass data is the flow of new job postings in a given period, as compared to the stock of live vacancies previously provided by NOMIS. Therefore using the Burning Glass postings data is not a like for like substitution. In addition, the data scraping algorithm has changed and improved in the years since its inception in 2012 making an accurate time-series comparison difficult.
1.55 Finally, Burning Glass measure the number of vacancies as the total number of advertised job postings and does not account for the number of roles one job advert may include. Burning Glass recognises this risk of under-counting however and has said that multi-roles in one job advert occur in an estimated 1 per cent of all postings.
1.56 In addition, Burning Glass trawls job websites in real time which allows for a very up-to-date analysis of the labour market. This, combined with the robust de-duplication algorithm which removes duplicates by scanning new posts against an existing list of unique posts kept for 60 days, makes Burning Glass a potentially important complementary source of data to enhance our understanding of labour demand
1.57 We have concluded that, at the very least, it is desirable to use the Burning Glass data on job postings as a substitute for the discontinued NOMIS occupational vacancy data to enable us to re-introduce a measure of occupational imbalance. This will measure, for each occupation, the ratio of vacancies to employment.
1.58 Figure 1 shows the distribution of indicator values for this indicator in 2015, using the Burning Glass data to capture postings in a 12 month period and dividing it by the employment for the same year period. We discuss the calculation of indicator thresholds across the full range of indicators in the following section. However, following the original MAC methodology, since the median + 50% threshold is appropriate in this instance, we set this as the threshold, benchmarked to 2015.

Assessing labour market shortages-A methodology update
17
Figure 1: Distribution of the new I2 (vacancy / employment) indicator - 2015
Source: Burning Glass Technologies: Labour Insight (2017).
1.59 Unfortunately, the Burning Glass data does not yet include an estimate of vacancy duration and so we are unable to use their data to reintroduce our I1 indicator which tracks changes in mean vacancy duration.
1.60 The level of detail offered by the Burning Glass data allows for a detailed, bespoke analysis of the demand for skills and specific job titles within an occupation. This will allow us to get a much more detailed picture of where demand is strongest and which particular job-titles are in shortage. However, because of data limitations in other sources, our top-down analysis is necessarily limited to four-digit occupations under the standard occupation classification (SOC) framework. Therefore we have concluded that the Burning Glass data is best suited as a complement to our top-down analysis, rather than being developed as an additional indicator or suite of indicators.
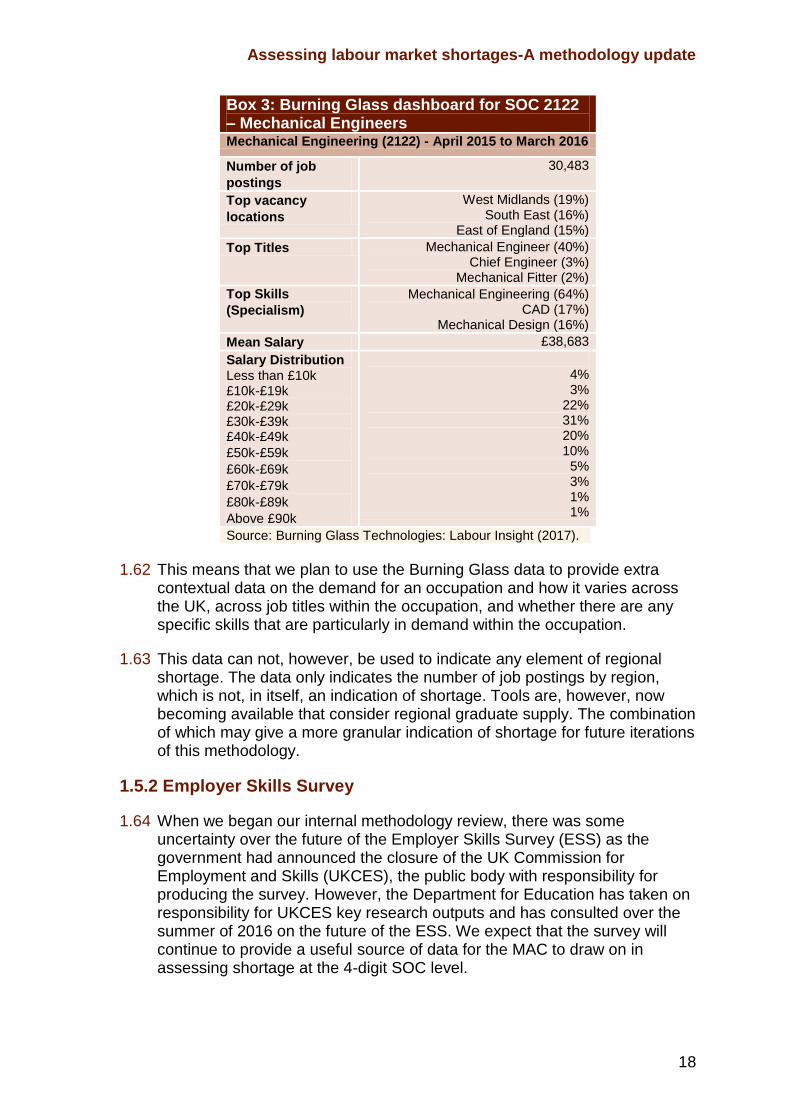
1.61 Box 3 provides an illustration of how we might use the Burning Glass data, applied to job postings for SOC 2122, mechanical engineers, in 2015/16.
0
2
4
6
8
10
12
14
16
0 0.1 0.2 0.3 0.4 0.5 0.6 0.7 0.8 0.9 1 1.1 1.2 1.3 1.4 1.5 1.6 1.7 1.8
Fre
qu
en
cy
Indicator Value
Assessing labour market shortages-A methodology update
18
Box 3: Burning Glass dashboard for SOC 2122 – Mechanical Engineers Mechanical Engineering (2122) - April 2015 to March 2016
Number of job
postings
30,483
Top vacancy
locations
West Midlands (19%) South East (16%)
East of England (15%)
Top Titles Mechanical Engineer (40%) Chief Engineer (3%)
Mechanical Fitter (2%)
Top Skills
(Specialism)
Mechanical Engineering (64%) CAD (17%)
Mechanical Design (16%)
Mean Salary £38,683
Salary Distribution
Less than £10k £10k-£19k £20k-£29k £30k-£39k £40k-£49k
£50k-£59k
£60k-£69k
£70k-£79k
£80k-£89k
Above £90k
4% 3%
22% 31% 20% 10%
5% 3% 1% 1%
Source: Burning Glass Technologies: Labour Insight (2017).
1.62 This means that we plan to use the Burning Glass data to provide extra contextual data on the demand for an occupation and how it varies across the UK, across job titles within the occupation, and whether there are any specific skills that are particularly in demand within the occupation.
1.63 This data can not, however, be used to indicate any element of regional shortage. The data only indicates the number of job postings by region, which is not, in itself, an indication of shortage. Tools are, however, now becoming available that consider regional graduate supply. The combination of which may give a more granular indication of shortage for future iterations of this methodology.
1.5.2 Employer Skills Survey
1.64 When we began our internal methodology review, there was some uncertainty over the future of the Employer Skills Survey (ESS) as the government had announced the closure of the UK Commission for Employment and Skills (UKCES), the public body with responsibility for producing the survey. However, the Department for Education has taken on responsibility for UKCES key research outputs and has consulted over the summer of 2016 on the future of the ESS. We expect that the survey will continue to provide a useful source of data for the MAC to draw on in assessing shortage at the 4-digit SOC level.

Assessing labour market shortages-A methodology update
19
1.65 As part of our review we examined each individual indicator to check how the distributions had evolved over the various iterations of MAC reviews of shortage. Major issues usually arise when the distribution clusters around either extreme. When we examined the three indicators sourced from the Employer Skills Survey (ESS) we found that there was a very significant skew in their distributions towards the maximum values.
1.66 Figure 2 below illustrates this issue. The graph shows the distribution of indicator values for E2 which measures, for each occupation, skill shortage vacancies as a fraction of total vacancies. 3 The data is so clustered around the maximum value of 100 that any interpretation of the data above the threshold is impossible.
Figure 2: Distribution of the E2 (Skill Shortage Vacancies / Total Vacancies) indicator - 2016
Source: Employer Skill Survey (2016)
1.67 Part of the issue with the data stems from the fact that we only consider skill shortage vacancies (SSV) for a restricted sample of only skilled occupations. This was less of an issue when the methodology was originally set out when we considered all NQF3+ (A-level equivalent) occupations, not just NQF6+ (graduate level) occupations.
1.68 A further concern was that using the ESS to generate three indicators may be placing too much weight on a single source, especially since the three ESS indicators do not measure entirely different concepts. In recent years when only 10 indicators have been available to the MAC, the ESS has generated 3 of 10 or 30 per cent of the indicators.
1.69 Whilst we checked the correlation across the three ESS indicators and did not find them to be strongly correlated, we did feel that a better balance would be achieved by reducing the ESS to one indicator. We decided that it was most appropriate to use the ESS to generate an employer reported
3 Skills shortage vacancies are defined in the ESS as those vacancies which employers report as
being hard to fill because of a shortage of available skills.

Assessing labour market shortages-A methodology update
20
vacancy rate, calculated by simply dividing ESS vacancies by employment in that occupation.
1.70 This generates an indicator which tracks overall vacancy rates as reported by employers and as Figure 3 below shows, results in an indicator that is better distributed. Therefore we retain an important measure of changes in the recruitment environment experienced by employers, but achieve better balance in terms of the weight placed on the ESS and in terms of an indicator that is well distributed.
1.71 Whilst this indicator is nominally similar to the new indicator of imbalance, the differing nature of the survey and web-scraped approach result in indicators that are sufficiently correlated to give weight to both results but differ sufficiently to avoid duplication.
Figure 3: Distribution of the new E1 (vacancies / employment) indicator - 2016
Source: Employer Skill Survey (2016)
1.6 The decision to re-benchmark
1.72 Benchmarking has been a key element of the MAC’s approach to assessing shortage to date. As part of this review, we wanted to assess whether benchmarking had worked as intended. In other words, to check whether the benchmarking has indeed delivered the ‘automatic stabiliser’ property we had expected by reporting fewer occupations to be in shortage during the 2009/10 recession.
1.73 Figure 4 below provides an overview of the MAC’s reviews of shortage since 2008. It shows how the proportion of indicators being passed has altered over the years.
0
1
2
3
4
5
6
7
8
9
0.0
02
0.0
04
0.0
06
0.0
08
0.0
1
0.0
12
0.0
14
0.0
16
0.0
18
0.0
2
0.0
22
0.0
24
0.0
26
0.0
28
0.0
3
0.0
32
0.0
34
0.0
36
0.0
38
0.0
4
0.0
42
0.0
44
0.0
46
More
Freq
uen
cy
Median + 50% Top Quartile

Assessing labour market shortages-A methodology update
21
Figure 4: Proportion of occupations passing a given proportion of indicators, 2008 - 2016
Notes: Points on this distribution reflect published MAC shortage reviews. As such, no data is available for 2013 or 2014. Source: MAC internal analysis (2016)
1.74 The number of occupations deemed to be in shortage on 50 per cent or more of the available indicators has varied considerably over time. We assume that, given lags in both the data sources and in the labour market reacting to macroeconomic conditions, the 2010, 2011 and 2012 data were the points at which the recession effect was most strongly felt.
1.75 As we would expect, the proportion of occupations passing 50 per cent of indicators rose in 2009 before falling in 2010, 2011 and to a low in 2012. This is an indication that the benchmarks did successfully account for the recession effect and exhibit an automatic stabiliser property. Therefore we concluded that benchmarking to a period of relative labour market tightness was a successful approach.
1.76 We then considered whether it was now appropriate to re-benchmark to reflect the time elapsed since the previous benchmarks were set and reflecting that the labour market had reached a period of relative tightness by September 2016.
1.77 Employment has grown substantially in recent years. This is mainly due to population growth, but also partly as a result of rising levels of participation in the labour market amongst working age population. As a result, the employment rate, the proportion of working age people in employment has risen to 74.5 per cent, the highest level since comparable records began in 1971 (ONS, 2016). Unemployment has fallen to 4.9 per cent and, not withstanding any fallout from the EU referendum, is not expected to fall significantly further (Office for Budget Responsibility, 2016).
0%
10%
20%
30%
40%
50%
60%
70%
80%
90%
100%
100 95 90 85 80 75 70 65 60 55 50 45 40 35 30 25 20 15 10 5 0
Pro
port
ion o
f occupations
Proportion of indicators passed (%)
2008 (Benchmark)
2009
2010
2011
2012
2015
2016
Fewer occupations passing fewer indicators (Expected in a recession)
More occupations passing more indicators (Expected in a recovery/boom)

Assessing labour market shortages-A methodology update
22
1.78 Whilst clearly the quantity side of the labour market has recovered from the recession and has surpassed previous peaks, the pay situation is slightly different. Between 2002 and 2007, whole economy average weekly earnings grew on average by 4.2 per cent annually (just under 2 per cent real wage growth). Since 2008, pay growth has been more subdued, averaging between 1 and 3 per cent nominally, and has been negative in real terms up until late 2014 (Bank of England, 2016).
1.79 Fundamental changes to the labour market over the last eight years, such as a slower rate of pay growth across the economy, led us to conclude that there is a strong rationale to update the benchmarks. We have therefore decided to re-benchmark using 2015 data. We choose 2015 as it is the latest calendar year for which we have full data and therefore we can be most certain about the labour market conditions than if we used data for 2016 to date.
1.80 Figure 5 below shows, as an example, how the distribution of indicator values has varied over time, for our indicator P1 which tracks the percentage change in median real pay over one year. The figure highlights how the distribution between the 90th and 10th percentiles shifted across the period from 2008 to 2016. While real pay growth was exceptionally strong in 2010 as a result of negative inflation, there was a significant shift downwards between 2010 and 2012, before increasing again in 2015 and 2016.
Figure 5: Distribution of the P1 (Percentage change of median real pay over 1 year) indicator, 2008-2016
Notes: The benchmark was adjusted in 2012 to reflect the change in skill requirements (see MAC 2012) and points on this distribution reflect published MAC shortage reviews. As such, no data is available for 2013 or 2014. Source: MAC internal analysis (2016)
1.81 Examining more closely the distributions for each of the individual indicators reinforced our earlier conclusions, that the automatic stabiliser property had correctly identified fewer occupations in shortage during the recession
-10
-8
-6
-4
-2
0
2
4
6
8
10
2008 2009 2010 2011 2012 2015 2016
90% 80% 70%
60% Median 40%
30% 20% Benchmark Threshold

Assessing labour market shortages-A methodology update
23
period. We also found that, by 2015, the underlying distribution for many indicators looked quite similar to that in 2008.
1.6.1 Updating the benchmarks
1.82 To set the new benchmarks, we reviewed the 2015 distributions of each of our indicators. To set the original benchmarks we had used either a threshold set at the median plus 50 per cent; or, where that was impractical, we used the top quartile.
1.83 However, this time we have adopted a slightly modified approach. Reviewing the individual indicator distributions, it became clear that some indicators lent themselves to an alternative threshold based on a common sense judgement about what might reasonably be interpreted as indicating shortage. Our initial preference remains for a threshold based on the median plus 50 per cent or the top-quartile, but in cases where these thresholds do not pass a common-sense test, or where there is a clear practical alternative for a particular indicator, we take a more flexible approach.
1.84 We undertook robust analysis of each of our indicators, including both the new Burning Glass vacancy indicator and aggregated ESS indicator to determine where the benchmark would best be set using the 2015 data.
1.85 Table 3 outlines the final indicators alongside the threshold that has to be met for an occupation to be considered in shortage. We adopt a common sense approach for four of the nine indicators.

Assessing labour market shortages-A methodology update
24
Table 3: Benchmarked threshold for the nine shortage indicators
Indicator Threshold type Updated Benchmark
P1 - Percentage change of median real pay over 1 year
Common Sense Approach
Reflects the OBR’s expectation of ‘normal’ real wage growth at around 1.7% to 2017 plus an add factor to judge that an occupation is experiencing shortage.
1.9%
P2 - Percentage change of median real pay over 3 years
Common Sense Approach
Reflects the OBR’s expectation of ‘normal’ real wage growth at around 1.7% to 2017 plus an add factor to judge that an occupation is experiencing shortage.
1.9%
P3 - Return to occupation
Median+ 50%
No change from the previous methodology.
Non-benchmarked
I1 – (New) Vacancies / Employment
Median + 50%
The same benchmarking rule is applied to the new Burning Glass data as the old NOMIS data, and as such, the first choice – Median + 50% - was appropriate
0.32
V1 - Percentage change of claimant count
Common Sense Approach
This was the most complex of the indicators to consider – as it experiences the greatest change during a recession and is the one indicator which must be below the threshold to pass.
Given the large fluctuations in the distribution, a benchmarked approach was not working, as too many (or too few) occupations would always pass.
However, this indicator can not be considered to indicate shortage if the change in claimant count is positive. As such, there should be a hard upper bound threshold of 0 for this occupation.
This leads to a decision rule for the threshold: A non-benchmarked threshold of whichever is lower of the two between 0 and the bottom quartile for any given year.
Non-benchmarked
V2 - Percentage change of employment
Top Quartile (Benchmark averaged over 3 years)
Small sample sizes in the LFS produce volatile employment estimates from year to year, obscuring true changes in employment at the occupational level.
By calculating the benchmark value averaged across three years, we can dampen this volatility. Indicator values will still be calculated based on employment change over one year to ensure the indicator remains relevant over the short term.
6.3%
V3 – Percentage change of hours worked over 3 years
Top Quartile with a Common Sense Approach
Top Quartile with an add factor of 0.25% if the Top Quartile is equal to 0 to account for the fact that in a labour market in shortage we would expect that hours worked would be increasing.
0.25%
V4 - Absolute change of new hires
Top Quartile
No change from the previous methodology.
1.89
E1 - (New) Vacancies / Employment
Top Quartile
Median + 50% was too close to 0 to be a viable threshold, therefore in line with the methodology, the Top Quartile was chosen
0.03

Assessing labour market shortages-A methodology update
25
1.86 The two pay indicators measure the percentage change in pay over one and three years. Based on the existing methodology, neither setting the threshold at the Median +50% or the Top Quartile is substantial enough to be indicative of shortage,
1.87 As a result, based on the hypothesis that higher than average pay growth is indicative of a shortage, we concluded that it was sensible to place the threshold above that which is independently considered normal by the Office for Budget Responsibility.
1.88 To propose an alternative approach, we hypothesise that higher than average pay should be indicative of shortage. As a result we set the threshold at 0.2 per cent above that which is independently estimated to be normal productivity per hour growth in the short term – in this case to 2017 - by the OBR (Office for Budget Responsibility, 2016a).
1.89 The rationale for the threshold set for the new indicator of imbalance is discussed earlier in this report. However, it is worth repeating that the distribution is suitable for the threshold to be set at the default Median + 50%, which is benchmarked like the other indicators to 2015.
1.90 The volume based indicator, which measures the percentage change in the claimant count, is negatively correlated with shortage. The MAC analysis of this indicator has shown that the underlying data highly fluctuates from year-to year. As a result, any benchmark is likely to be inappropriate over a prolonged period of time as the entire distribution shifts above or below the benchmarked value. As such, this indicator will now be un-benchmarked.
1.91 Furthermore, an occupation should not be considered in shortage if there is a positive percentage change in the claimant count (i.e when there is an increase in the number of people claiming welfare benefits for unemployment reasons). As a result, there should be an absolute maximum threshold of zero. This leads to a finalised indicator that retains the original methodology of selecting the bottom quartile; so long as this is a value strictly lower than zero.
1.92 As the second volume based indicator, the percentage in employment, is estimated using the sample-based nature of the LFS, increased volatility in occupations with a relatively low employment volume were artificially inflating the threshold. This meant that larger occupations were not being considered in shortage even if the employment increase was significant.
1.93 By averaging employment change over three years, as opposed to one year, we can dampen the volatility in lower-employment occupations and create a more realistic threshold. We can then continue to use the one-year change to measure the indicator as previously.
1.94 The third volume based indicator, measuring the change in hours worked has a heavily clustered distribution around zero, to the extent that both the Median 50% and Top Quartile are equal to zero. As an occupation must be equal to or greater than the threshold to be considered in shortage, this

Assessing labour market shortages-A methodology update
26
leads to a far greater portion of the distribution being classified in this way than intended. By adding , 0.25, to the Top Quartile value, we can more accurately identify occupations that indicate shortage in this way
1.95 Finally, the new indicator based on the Employer Skills Survey measuring vacancies as a proportion of total employment in the occupation follows the original methodology. As the median value is close to zero in the distribution, the Top Quartile is the most appropriate threshold.
1.7 Moving forward
1.96 Our 2016 review of teaching shortages will be the single point of crossover between the new and old shortage methodologies (MAC, 2016). In that review, we base our analysis and conclusions on the new methodology but also present results based on the previous methodology for comparison.
1.97 For future reviews of shortage, we intend to implement the new methodology as outlined in this paper. Unless stated otherwise, this paper should be considered the official MAC shortage methodology.
1.98 The MAC remains open to reassessment and changes to the methodology in the future as a result of any changes to the available data, or as a result of any significant change in the UK labour market. Any significant changes in approach will be highlighted either in an updated methodology document or within a MAC review of labour market shortages.

Annex A MAC shortage methodology from spring 2016
Table A1: Current MAC methodology
Indicator Data source
Rationale
Price based indicators
P1: Percentage change of median real pay (1 year)
ASHE In the case of a labour shortage, market pressure should increase wages, helping to raise supply and reduce demand, thus restoring labour market equilibrium. On this basis, rising wages within an occupation may then be an indication of shortage. The measure of percentage change in median pay is taken over 1 year and 3 years in order to moderate the impact of year-to-year fluctuations. The third price-based indicator is a measure of the relative premium to working in a certain occupation for an individual with the appropriate qualification, after controlling for characteristics such as age and region. The MAC expect that the higher the observed relative premium to an occupation, the more likely there is to be a shortage in that occupation. This is because if there were a shortage of skilled labour we would expect some firms to pay more to obtain skilled employees in certain occupations.
P2: Percentage change of median real pay (3 years)
ASHE
P3: Return to occupation
LFS
Employer based indicators
E1: Vacancies / Employment:
ESS Employer-based indicators are derived from surveys that ask employers direct questions about their businesses. High vacancy levels, or rising vacancy rates, may suggest that employers are finding it hard to fill jobs.
This new indicator, measures the difficulty to recruit based on an employer survey as a proportion of the total employment in that occupation

Annex A: Shortage methodology from spring 2016
28
Table A1: Current MAC methodology
Volume based indicators
V1: Percentage change of claimant count (1 year)
NOMIS Low or falling unemployment among people previously employed in, or seeking work in, an occupation may indicate shortage. Rising employment may indicate rising demand, which may exist alongside labour shortage. The MAC considered the use of several possible volume-based indicators and assessed the data available to measure them. Examples of possible employers’ responses include: increasing overtime, increasing hours worked, increasing subcontracting, recruiting staff at a lower-level standard, retaining existing staff, altering production methods to reduce the need for the skill in short supply, and increasing the level of training. The MAC decided that the most appropriate indicators to consider, given the available data at the 4-digit SOC level, were changes in employment, unemployment, hours worked, and the proportion of new hires coming into an occupation.
V2: Percentage change of employment level (1 year)
LFS
V3: Percentage change of median paid hours worked (3 years)
ASHE
V4: Change in new hires (1 year)
LFS
Other indicators of imbalance
I2: Vacancy postings / Unemployment by sought occupation
Burning Glass and NOMIS
Indicators of imbalance focus directly on the vacancy levels within an occupation. A high vacancy/unemployment ratio within an occupation suggests that employers are having particular difficulty filling vacancies given the supply of workers available while the absolute change in the median time that vacancies are advertised indicates that these issues have been pervasive over a substantial period of time.
Notes: ESS refers to the Employer Skills Survey, LFS refers to the Labour Force survey and ASHE refers to the Annual Survey of Hours and Earnings
Annex A: Shortage methodology from spring 2016
29
References
Bank of England (2016). Inflation Report – August 2016. London: Bank of England
Burning Glass Technologies (2017), “Labour Insight Real-Time Labour Market Information Tool,” available at http://wwww.burning-glass.com
Migration Advisory Committee (2008). Skilled, Shortage, Sensible: The recommended shortage occupation lists for the UK and Scotland. London: Migration Advisory Committee.
Migration Advisory Committee (2010). Skilled, Shortage, Sensible: Review of Methodology. London: Migration Advisory Committee.
Migration Advisory Committee (2017). Partial review of the Shortage Occupation List: Review of teachers. London: Migration Advisory Committee.
Frontier economics (2009), Refining the top-down methodology to identify shortages in skilled occupations. (SRG/08/041)
Office for Budget Responsibility (2016a). Economic and Fiscal Outlook, March 2016. London: Office for Budget Responsibility.
Office for National Statistics (2016b). UK Labour Market: August 2016. Newport: Office for National Statistics.
References

Migration Advisory Committee Report ww.gov.uk/government/organisations/migration-advisory-committee © Crown copyright.
ISBN: 978-1-78655-328-7