Donald Kline, Jr.; Emily Redmond; Kaitlyn Ruhl, Vikram Patwardhan.
Upload
egbert-sheltonCategory
view
215download
0
Assessing Impacts as Changes in Economic
Output
Anand PatwardhanUpasna Sharma

Stock Vs. Flow Conventionally impacts of cyclones (or other climate
hazards) measured as changes in stocks of human, social and economic capital.
Alternatively, they may be measured as changes in flow of goods and services, (typically economic output).
Motivation for assessing impacts in terms of changes in flow variables
Provides information about length of recovery period Relief vs. recovery debate in disaster mitigation.
Could be used to establish the validity or explanatory power of measures of adaptive capacity (generic or specific adaptation)
Distinguish between loss of capital assets vs. loss of income for affected communities

Natural Hazard – Tropical Cyclones
Why tropical cyclones is a good starting point for exploring the concept:
Bounded in space and time (unlike droughts).
Impact large enough to disrupt economic activity over an area, and for a duration long enough that it may be resolved / detected
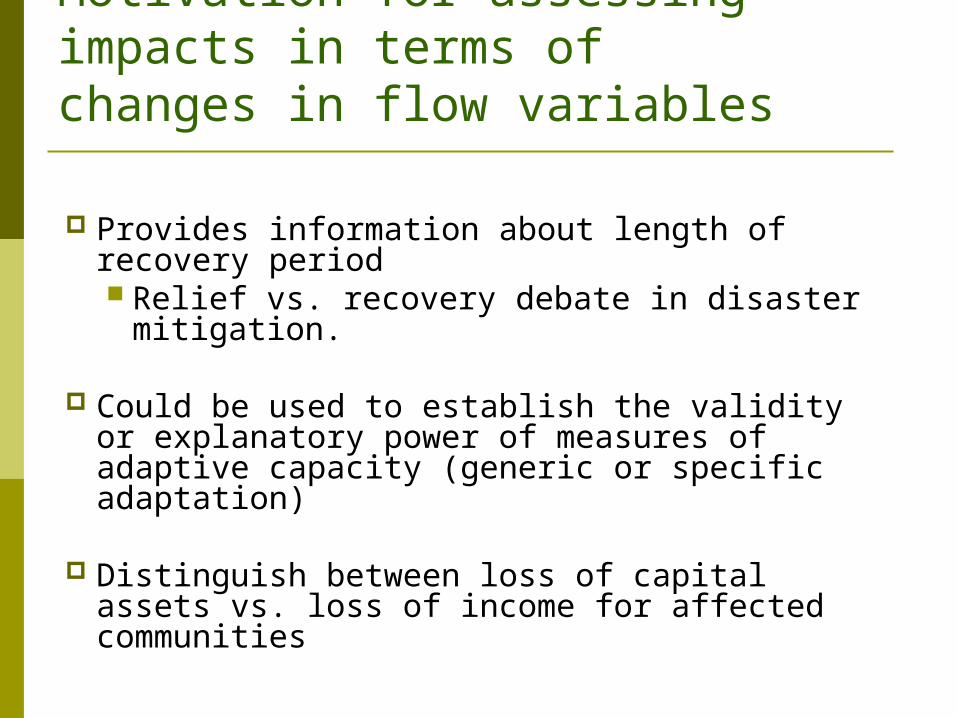
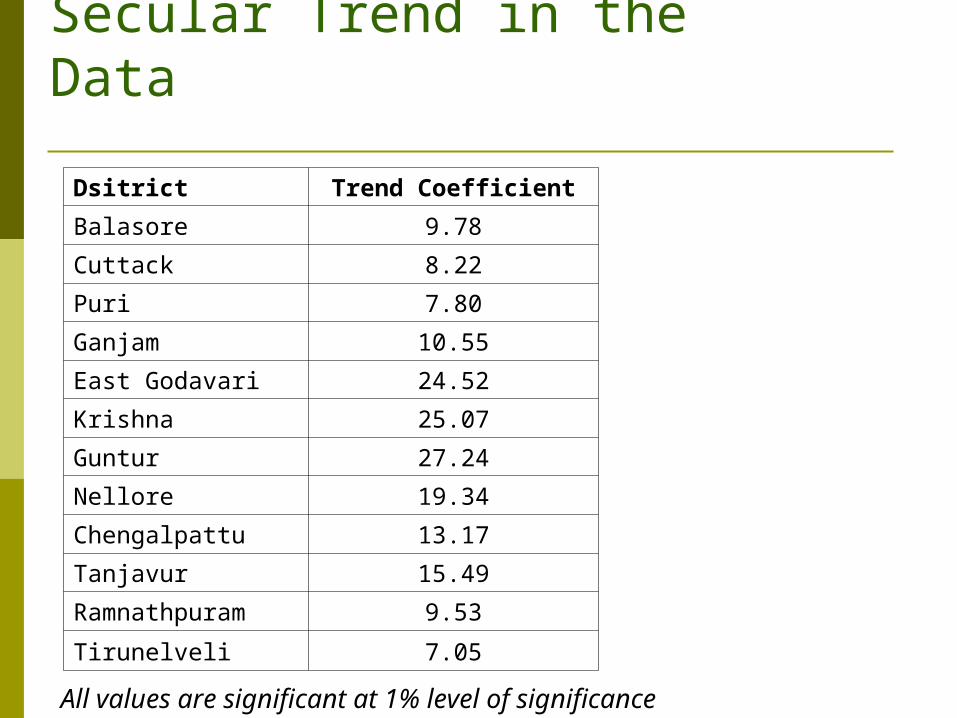
What do we expect the data to reveal? We expect a drop in the output of the affected economic
sector as a consequence of the event in relation to the baseline Event year output should differ from non-event year output
We expect to observe gradual recovery in the period following the event
Confounding factors: Secular change Other, non-event related disturbances Variability (signal to noise ratio problem)

Output variables being studied
Variable Specific Variable
Spatial resolution
Temporal resolution
Length of the record
Sample of Districts
Agricultural production
Paddy output (‘000 tons)
District Annual 1966 - 1994 (8 districts)
1966 - 2001 (4 districts)
12 districts on the East coast of India
Fish catch Marine fish catch (tons)
District Monthly 1978 to 1996 8 coastal districts of Tamil Nadu
Electricity consumption
Units of electricity consumed by different categories of users
Sub-district (for one district)
Monthly 1988 to 2000 Nellore (Andhra Pradesh)

Linkage between spatial extent and administrative units for reporting of data
States The country divided into 28 states and 7 union territories.
Districts The district is the principal subdivision within the state. There were 593 districts in India according to Census, 2001. The districts vary in size and population. The average size of a district was approximately 4,000 square kilometers, and the average population numbered nearly 1.73 million in the year 2001.
Sub-districts: Tehsils / talukas / mandals
Districts in India are subdivided into taluqs or tehsils, areas that contain from 200 to 600 villages.
Hierarchy of Administrative Units in India
Considerations for selecting spatial unit/scale of analysis: • The scale of hazard and its impact• The scale at which the socio-economic data is reported

Descriptive statistics for paddy output
Dsitrict
Mean (‘000 tons /year)
Standard. Deviation Max Min Range
Balasore 388.43 109.48 642.82 214 428.82
Cuttack 619.03 139.39 946.89 292.59 654.3
Puri 441.92 112.19 769.67 261.44 508.23
Ganjam 412.18 139.87 750.76 180.88 569.88
East Godavari 754.59 243.53 1211 391.5 819.5
Krishna 761.26 233.57 1173.8 427.8 746
Guntur 752.3 259.29 1180.6 395 785.6
Nellore 452.89 176.65 819.48 198 621.48
Chengalpattu 655.81 187.3 993.57 232 761.57
Tanjavur 1323.45 291.82 1937.4 878 1059.4
Ramnathpuram 348.04 157.32 744 117.1 626.9
Tirunelveli 351.44 104.85 611.27 211 400.27

Plots of Time Series of Paddy Output for Some Districts
Tanjavur
East Godavari Nellore
Balasore
0
100
200
300
400
500
600
700
Year
'000 t
on
s
0
100
200
300
400
500
600
700
800
900
Year
'00
0 t
on
s
0
500
1000
1500
2000
2500
Year
'00
0 t
on
s
0
200
400
600
800
1000
1200
1400
Year
'00
0 to
ns
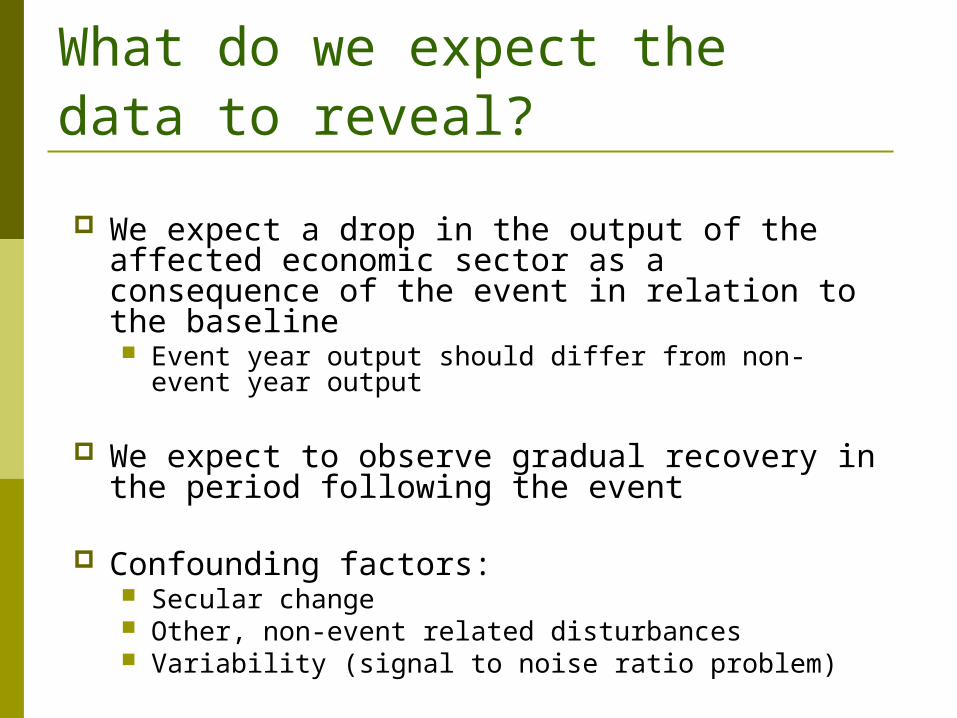
Secular Trend in the Data
Dsitrict Trend Coefficient
Balasore 9.78
Cuttack 8.22
Puri 7.80
Ganjam 10.55
East Godavari 24.52
Krishna 25.07
Guntur 27.24
Nellore 19.34
Chengalpattu 13.17
Tanjavur 15.49
Ramnathpuram 9.53
Tirunelveli 7.05
All values are significant at 1% level of significance

Assessing Impact on Agricultural Output
Grouped districts into 2 categories based on the number of cyclonic events that occurred during the study period:
Guntur
0
200
400
600
800
1000
1200
1400
Year
'000
tons
Districts with few events.Districts with many events
Nellore
0
100
200
300
400
500
600
700
800
900
Year
'000
tons

Districts with many events
•Existence of secular trend in the agricultural output data required de-trending the data
•Classified the residuals into those for event years and those for non-event years
• Examined the difference in these two populations using the non-parametric Kolmogorov-Smirnov (K-S) test
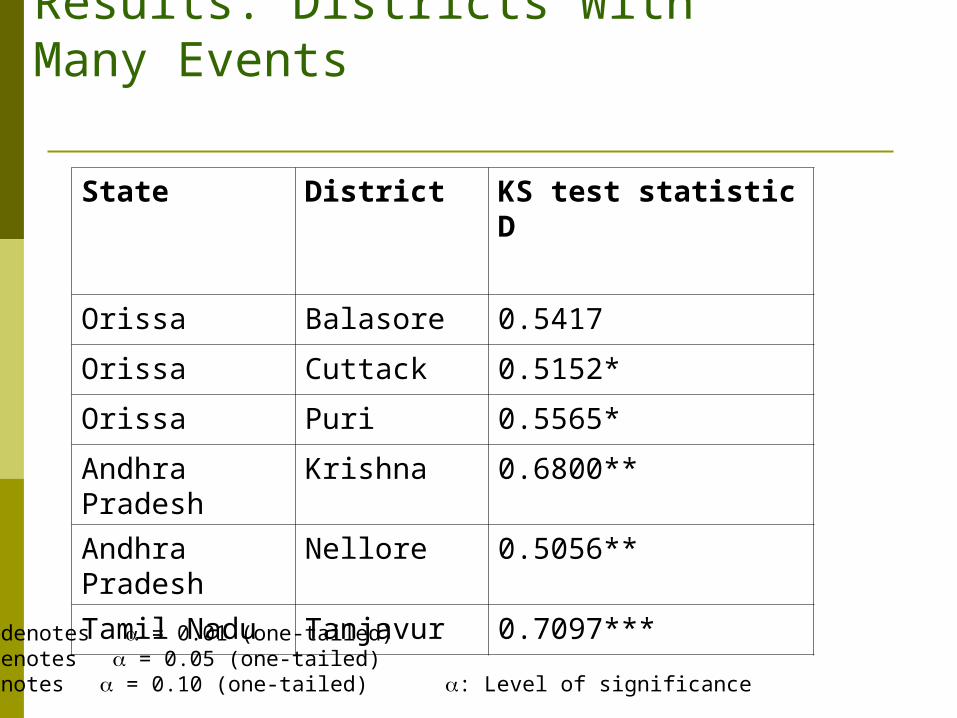
Results: Districts With Many Events
State District KS test statistic D
Orissa Balasore 0.5417
Orissa Cuttack 0.5152*
Orissa Puri 0.5565*
Andhra Pradesh Krishna 0.6800**
Andhra Pradesh Nellore 0.5056**
Tamil Nadu Tanjavur 0.7097***
*** denotes = 0.01 (one-tailed) ** denotes = 0.05 (one-tailed)* denotes = 0.10 (one-tailed) : Level of significance

Districts with few events
Compared residual in event year, with residuals of baseline years (after accounting for secular trend) by using the Student’s t-test.
The hypothesis can be specified as: Ho: Re = RneHa: Re < Rne
Where Re denotes the residuals for the event years and Rne denotes mean of residuals for the non event years

State District Cyclonic event year (s)
Event year residual
95% confidence limit
Orissa Ganjam 22/9/197228/8/1974
-40.46-70.13
-33.3237
Andhra Pradesh
East Godavari 7/11/196916/10/1982
-93.26999.1569
-26.4841
Andhra Pradesh
Guntur 19/11/1977 12/11/1987
-214.66-204.01
-18.5919
Tamil Nadu Chengalpattu 28/11/19664/11/197818/10/19821/12/1996
-25.330734.22083-368.062-41.9519
-21.8977
Tamil Nadu Ramnathpuram 24/11/1978 5.02648 -44.3477
Tamil Nadu Tirunelveli 17/12/1980 18.4607 -28.7653Figures in bold are statistically significant at 5% level of significance.
Results: Districts With Few Events

Alternative approach for districts with many events To account for secular trends, earlier approach focused on residuals after detrending the data
Alternatively, we can look at year to year changes in output. Four kinds of changes in output are possible:
Non-event to event change in output,
Event to non-event change in output,
Non-event to non-event change in output and
Event to event change in output.
We can postulate certain expectations regarding these changes in output:
Non-event to event change in output to be negative,
Event to non-event change in output to be positive,
Non-event to non-event and event to event change in output could either be positive or negative
If there is a statistically significant increase / recovery in output after the event year, then it provides for a more robust basis for attributing the decrease in output in the event year to a cyclone.
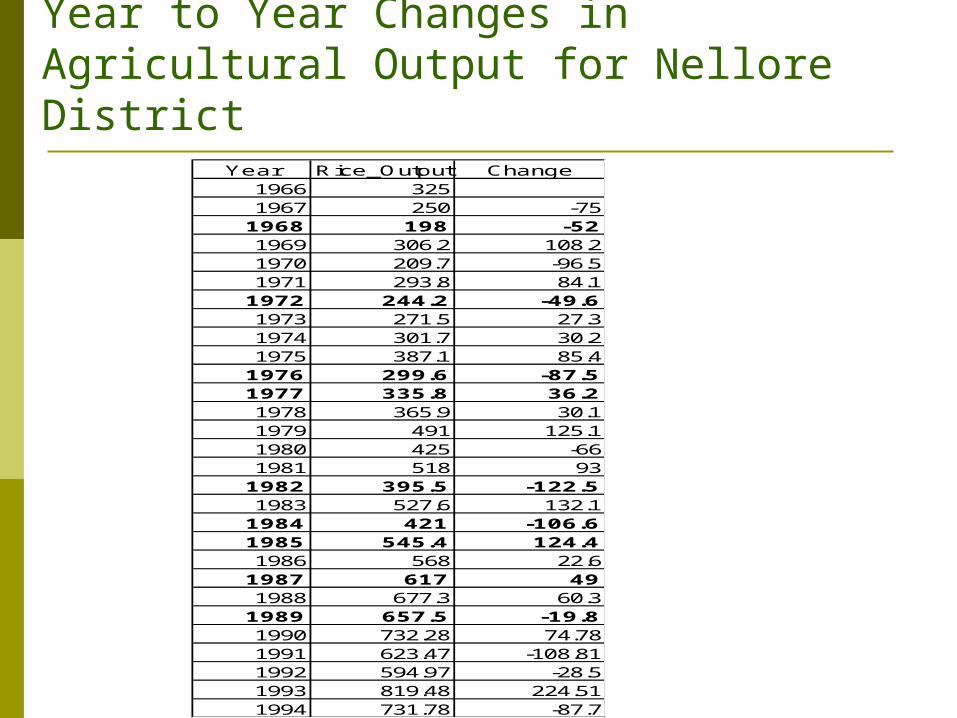
Year to Year Changes in Agricultural Output for Nellore District
Year Rice_Output Change1966 3251967 250 -751968 198 -521969 306.2 108.21970 209.7 -96.51971 293.8 84.11972 244.2 -49.61973 271.5 27.31974 301.7 30.21975 387.1 85.41976 299.6 -87.51977 335.8 36.21978 365.9 30.11979 491 125.11980 425 -661981 518 931982 395.5 -122.51983 527.6 132.11984 421 -106.61985 545.4 124.41986 568 22.61987 617 491988 677.3 60.31989 657.5 -19.81990 732.28 74.781991 623.47 -108.811992 594.97 -28.51993 819.48 224.511994 731.78 -87.7

Statistical Technique UsedTo test whether there is a statistically significant difference between the means of the three types of changes in output, we use Analysis of Variance (ANOVA) technique.
Analysis of Variance (ANOVA)
The hypothesis can be specified as:
Ho: µne-e = µe-ne = µne-ne
Ha: µne-e, µe-ne, µne-ne are not all equal.
Where µne-e denotes the mean of non-event to event changes in output;
µe-ne, denotes the mean of event to non-event changes in output;
µne-ne denotes the mean of non-event to non-event changes in output

Results of ANOVA for effect of cyclones onagricultural output
State District ANOVA(F statistic)
KS test statistic D
Orissa Balasore 2.56* 0.5417
Orissa Cuttack 2.75* 0.5152*
Orissa Puri 1.35 0.5565*
Andhra Pradesh Krishna 2.65* 0.6800**
Andhra Pradesh Nellore 5.24** 0.5056**
Tamil Nadu Tanjavur 6.33*** 0.7097***
*** denotes = 0.01 ** denotes = 0.05* denotes = 0.10

Observations Impacts of a cyclone can be measured in terms of flow of goods and services
of the affected socio-economic sectors, if appropriate spatial and temporal resolution is chosen.
This approach can provide new impact metric for linking generic adaptive capacity to observable impacts at the ground level.
This not only a relatively low cost methodology but also uses in a different manner the data for which well established reporting mechanisms already exist.
Assessment of impacts through a different route which could act as a check on biases and errors of the conventional impact assessment methods.
This methodology can be replicated for natural disasters other than cyclones (for instance, floods, earthquakes etc.).

Work in Progress
Extend the work - Fisheries output (fish catch), Electricity Consumption (much higher temporal resolution then the agricultural data)
0
200
400
600
800
1000
1200
1400
1600
Month and year
Ma
rin
e f
ish
ca
tch
in
to
nsImpact of Cyclone on Fisheries Output – Chengalpattu District
Impact Rec
over
y
Cyclonic event Nov-85