Assessing Faculty Research Productivity at Public Research ......general trends in research...
13
ACADEMIC AFFAIRS FORUM Assessing Faculty Research Productivity at Public Research Institutions Education Advisory Board 2445 M Street NW ● Washington, DC 20037 Telephone: 202-266-6400 ● Facsimile: 202-266-5700 ● www.educationadvisoryboard.com 2012 December Custom Research Brief Research Associate Kevin Danchisko Research Manager Allison Thomas
Transcript of Assessing Faculty Research Productivity at Public Research ......general trends in research...
ACADEMIC AFFAIRS FORUM
Assessing Faculty Research Productivity at Public Research Institutions
Education Advisory Board 2445 M Street NW ● Washington, DC 20037
Telephone: 202-266-6400 ● Facsimile: 202-266-5700 ● www.educationadvisoryboard.com
2012
December
Custom Research Brief Research Associate Kevin Danchisko Research Manager Allison Thomas
2 of 13
Education Advisory Board
2445 M Street NW ● Washington, DC 20037
Telephone: 202-266-6400 ● Facsimile: 202-266-5700 ● www.educationadvisoryboard.com
© 2012 The Advisory Board Company
3 of 13
Education Advisory Board
2445 M Street NW ● Washington, DC 20037
Telephone: 202-266-6400 ● Facsimile: 202-266-5700 ● www.educationadvisoryboard.com
© 2012 The Advisory Board Company
Table of Contents
I. Research Methodology ...................................................................................................... 4
Project Challenge ............................................................................................................. 4
Project Sources ................................................................................................................. 4
Research Parameters ....................................................................................................... 5
II. Executive Overview ...................................................................................................... 6
Key Findings..................................................................................................................... 6
III. Determining Faculty Research Productivity ........................................................... 7
Indicators of Research Productivity .............................................................................. 7
Research Productivity Review Processes ..................................................................... 7
Tenure and Promotion Committees .............................................................................. 9
Considerations for Transitioning to Doctoral Programs .......................................... 12
IV. Internal and External Use of Indicators ................................................................. 12
Communication with External Constituencies .......................................................... 12
4 of 13
Education Advisory Board
2445 M Street NW ● Washington, DC 20037
Telephone: 202-266-6400 ● Facsimile: 202-266-5700 ● www.educationadvisoryboard.com
© 2012 The Advisory Board Company
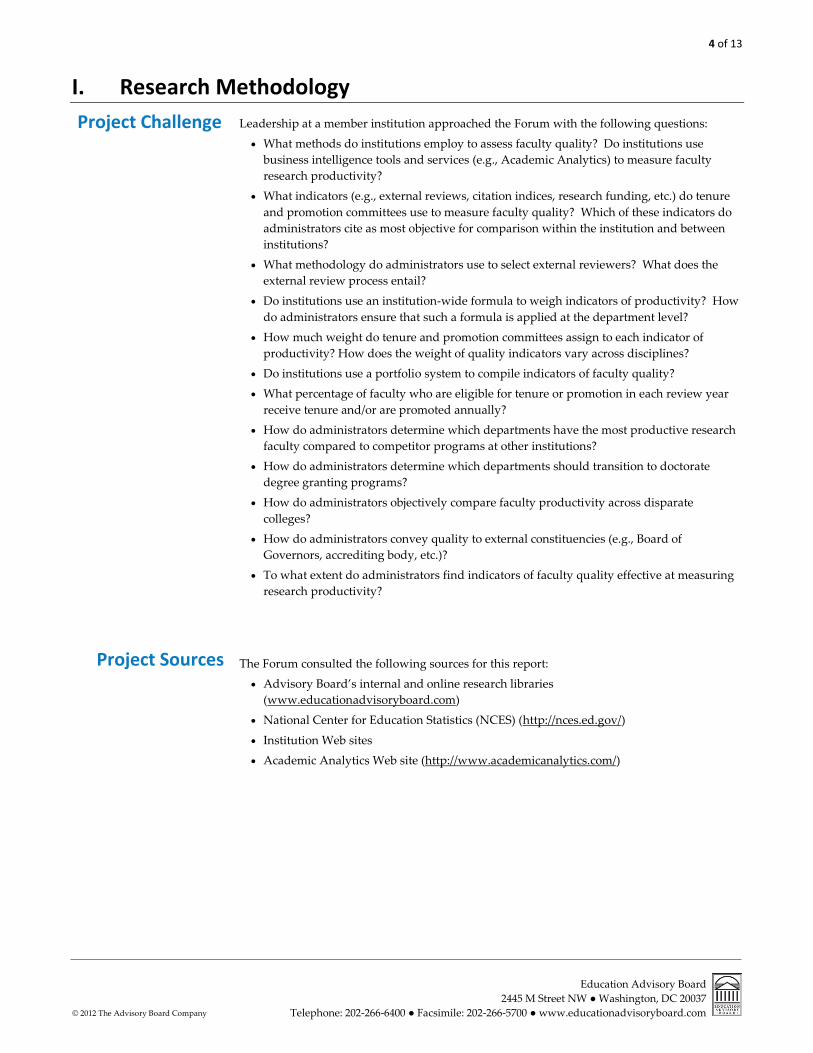
I. Research Methodology
Leadership at a member institution approached the Forum with the following questions:
What methods do institutions employ to assess faculty quality? Do institutions use
business intelligence tools and services (e.g., Academic Analytics) to measure faculty
research productivity?
What indicators (e.g., external reviews, citation indices, research funding, etc.) do tenure
and promotion committees use to measure faculty quality? Which of these indicators do
administrators cite as most objective for comparison within the institution and between
institutions?
What methodology do administrators use to select external reviewers? What does the
external review process entail?
Do institutions use an institution-wide formula to weigh indicators of productivity? How
do administrators ensure that such a formula is applied at the department level?
How much weight do tenure and promotion committees assign to each indicator of
productivity? How does the weight of quality indicators vary across disciplines?
Do institutions use a portfolio system to compile indicators of faculty quality?
What percentage of faculty who are eligible for tenure or promotion in each review year
receive tenure and/or are promoted annually?
How do administrators determine which departments have the most productive research
faculty compared to competitor programs at other institutions?
How do administrators determine which departments should transition to doctorate
degree granting programs?
How do administrators objectively compare faculty productivity across disparate
colleges?
How do administrators convey quality to external constituencies (e.g., Board of
Governors, accrediting body, etc.)?
To what extent do administrators find indicators of faculty quality effective at measuring
research productivity?
The Forum consulted the following sources for this report:
Advisory Board’s internal and online research libraries
(www.educationadvisoryboard.com)
National Center for Education Statistics (NCES) (http://nces.ed.gov/)
Institution Web sites
Academic Analytics Web site (http://www.academicanalytics.com/)
Project Challenge
Project Sources
5 of 13
Education Advisory Board
2445 M Street NW ● Washington, DC 20037
Telephone: 202-266-6400 ● Facsimile: 202-266-5700 ● www.educationadvisoryboard.com
© 2012 The Advisory Board Company
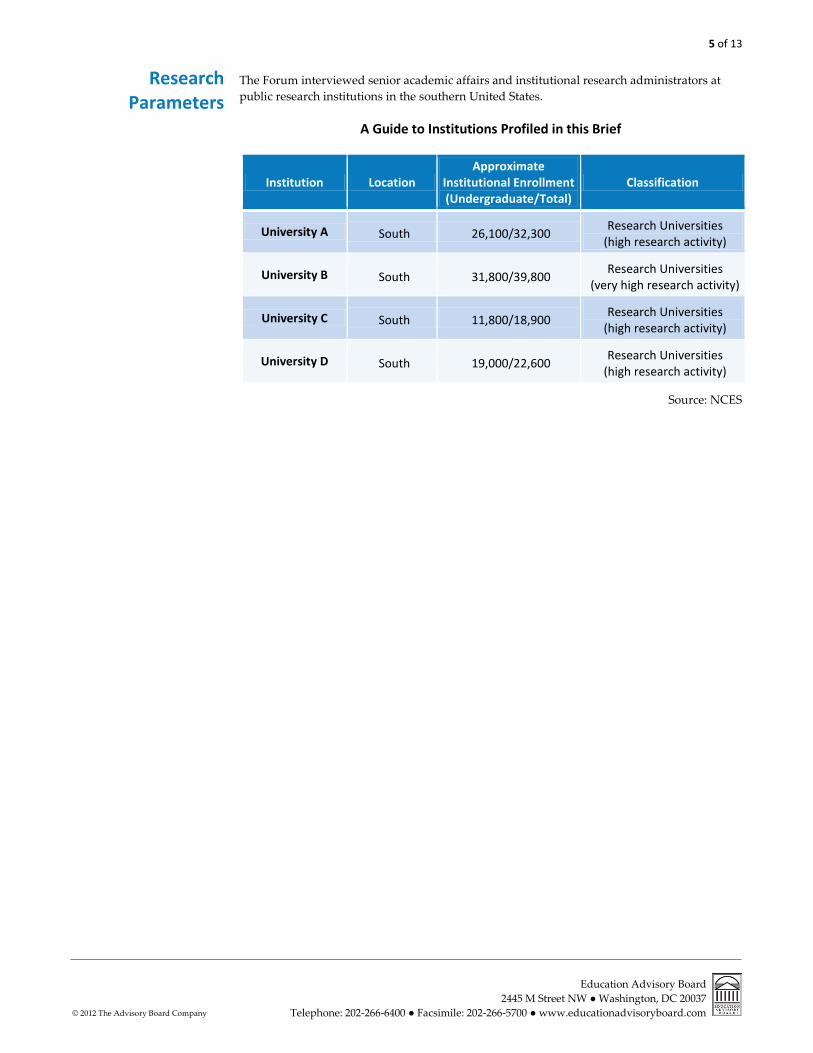
The Forum interviewed senior academic affairs and institutional research administrators at
public research institutions in the southern United States.
A Guide to Institutions Profiled in this Brief
Institution Location Approximate
Institutional Enrollment (Undergraduate/Total)
Classification
University A South 26,100/32,300 Research Universities
(high research activity)
University B South 31,800/39,800 Research Universities
(very high research activity)
University C South 11,800/18,900 Research Universities
(high research activity)
University D South 19,000/22,600 Research Universities
(high research activity)
Source: NCES
Research Parameters
6 of 13
Education Advisory Board
2445 M Street NW ● Washington, DC 20037
Telephone: 202-266-6400 ● Facsimile: 202-266-5700 ● www.educationadvisoryboard.com
© 2012 The Advisory Board Company
II. Executive Overview
Third-party assessment tools offer convenient comparisons to competitor programs but lack
transparency, current information, and comprehensive data to effectively support tenure
and promotion decisions. Products such as Academic Analytics’ Faculty Scholarly
Productivity Index and Thomson Reuters’ Journal Impact Factor document general program
trends and provide raw data (e.g., number of citations and publications) for further analysis.
Tenure and promotion committees measure faculty research productivity through research
awards and expenditures, publications, citations, degrees conferred, and credit hours that
students complete under faculty. Several contacts cite research funding and expenditures as
the most objective measures of faculty research productivity, but the average of these
indicators varies widely across disciplines. Electronic portfolios enable faculty members to
provide supporting evidence of their research efforts and academic affairs staff to compare
faculty members’ research work among peers.
No contact institutions use institution-wide formulas to weight research productivity
indicators because of the disparities between programs and subjectivity of such a composite
score. Several contacts report that discipline-based differences in faculty members’ ability to
publish or secure research funding limit the effectiveness of such a formula. Contacts at
University B also report that a formula may be counterproductive; faculty would dispute how
administrators weight the factors in the formula rather than try to improve their research
productivity scores.
Senior academic affairs administrators consider peer perception of programs, ability to
attract students, and potential for future research funding when determining viable doctoral
programs. Several contacts report that the ability of faculty to sustain programs is the most
important consideration; faculty must be able to secure research funding and remain well-
regarded among peers to successfully sustain a doctoral program. Contacts report that science
and engineering fields provide faculty members with more research funding opportunities
and therefore higher potential for program sustenance.
Key Findings
7 of 13
Education Advisory Board
2445 M Street NW ● Washington, DC 20037
Telephone: 202-266-6400 ● Facsimile: 202-266-5700 ● www.educationadvisoryboard.com
© 2012 The Advisory Board Company
III. Determining Faculty Research Productivity
Contacts Cite Research Funding and Expenditures as the Most Objective Measures of Faculty Research Productivity
Contacts at University C report that grant success
(e.g., amount awarded, proportion of grant
submissions funded) helps to demonstrate the
scholarly productivity of a faculty member or a
program. Contacts at University B warn that senior
academic affairs administrators must also consider
the context and timing of grant awards; faculty may
have few grants awarded in a given year because of
recent or previous large awards.
Common Indicators of Faculty Research Productivity across Contact Institutions
Academic affairs administrators must consider the quality and quantity of journal publications
when determining faculty research productivity. Contacts at University C report that quality
is more important than quantity, but senior-level administrators often lack the field-specific
knowledge to judge the quality of journals. Contacts report that faculty members and external
reviewers in the same field provide the most valuable insight about journal quality.
Third-party Assessment Tools Allow Academic Affairs Administrators to Compare Faculty Internally and against Competitor Programs
Multiple institutions use Academic Analytics’ Faculty Scholarly Productivity Index to compare
internal programs to competitor programs; however, contacts also warn that the product
contains flaws that administrators must consider when making any decisions based upon the
data. Academic affairs administrators at University B use Academic Analytics to observe
general trends in research productivity but not for any internal management decisions (e.g.,
program closure, tenure, etc.). Deans at University A compare internal programs to aspirant
institutions’ programs through Academic Analytics to ensure that the institution maintains
similar research productivity levels to other research institutions. Contacts at University D
reflect that Academic Analytics’ impact score of publications is useful because administrators
cannot calculate the impact of publications on their own, other than through patents and
Individual Indicators
Grant award funding
Institution and field-specific honors
Total research expenditures
Publications
Citations
Degrees conferred
Number of postdoctoral appointees
Number of postdoctoral appointees
Academic Program Indicators
Sum of all individual indicators
Number of student applications
Number of grant proposals
Number of graduate programs ranked top 50 in the nation (e.g., U.S. News & World Report, Academic Analytics, etc.)
Indicators of Research
Productivity
Research Productivity
Review Processes
Contacts at University D cite grant award funding as the most objective indicator of productivity across the institution.
600
At University D, faculty submit over 600 grant proposals each year; 300 out of 500 tenure-track faculty submit at least one grant proposal annually.
Grant Proposals
Academic affairs administrators at University D require that all faculty members submit grant proposals through the research and sponsored projects office to ensure comprehensive records of research activity.
8 of 13
Education Advisory Board
2445 M Street NW ● Washington, DC 20037
Telephone: 202-266-6400 ● Facsimile: 202-266-5700 ● www.educationadvisoryboard.com
© 2012 The Advisory Board Company
intellectual property. The impact score includes publications, citations, Federal research
funding, and honorific awards.1
Contacts at University B report that Thomson Reuters Journal Impact Factor, which the
institution purchases, maintains several advantages over Academic Analytics:
Transparent process: Contacts report that Thomson Reuters’ impact score equation is
more transparent than that of Academic Analytics.
Current data: The most recent data that Academic Analytics uses is from 2009-2010;
Thomson Reuters maintains data from the present year.
Avoids departmental overlap: Academic Analytics is unable to accurately attribute
research by faculty members who associate with multiple programs; Thomson Reuters
uses broad disciplines rather than specific programs. For example, clinical and
educational psychology would be in the same broad discipline in Thomson Reuters but
would be different programs under Academic Analytics. However, neither product can
accurately count research for a faculty member who associates with disparate disciplines
(e.g., history and business).
Though Academic Analytics data includes book publications, Thomson Reuters does not;
however, contacts at University B report that Thomson Reuters plans to add this feature.
Before this addition, the usefulness of the product to assess research productivity of faculty
members in book-heavy disciplines (e.g., history) remains limited.
Academic affairs administrators at University B
use raw data (e.g., number of publications and
citations) from Thomson Reuters to create
progress cards for faculty members. The
progress card includes the publications,
citations, and research funding of the current
year and previous years. Any data point that
decreases from the previous year appears in red
to encourage faculty members to increase these
scores. Administrators can easily combine the
results of all faculty members’ progress cards to create program or department progress cards.
1 “What We Do,” accessed December 17, 2012, http://www.academicanalytics.com/Public/WhatWeDo.
Drawbacks of Academic Analytics
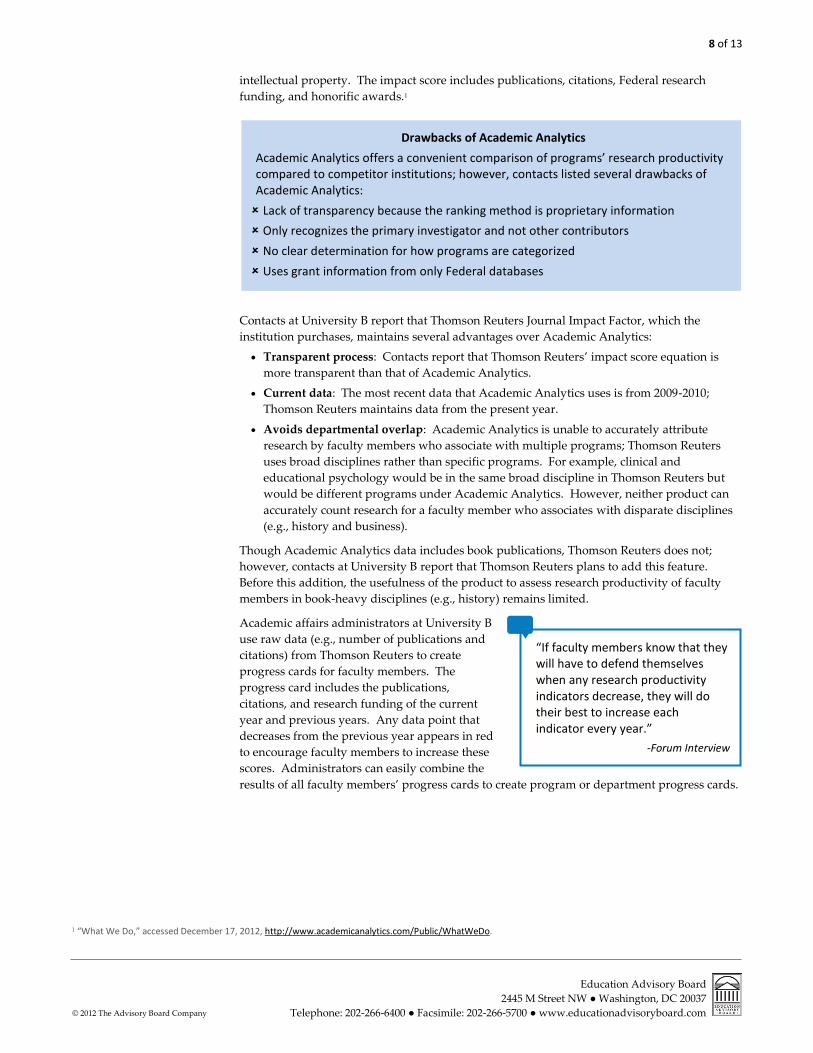
Academic Analytics offers a convenient comparison of programs’ research productivity compared to competitor institutions; however, contacts listed several drawbacks of Academic Analytics:
Lack of transparency because the ranking method is proprietary information
Only recognizes the primary investigator and not other contributors
No clear determination for how programs are categorized
Uses grant information from only Federal databases
“If faculty members know that they will have to defend themselves when any research productivity indicators decrease, they will do their best to increase each indicator every year.”
-Forum Interview
9 of 13
Education Advisory Board
2445 M Street NW ● Washington, DC 20037
Telephone: 202-266-6400 ● Facsimile: 202-266-5700 ● www.educationadvisoryboard.com
© 2012 The Advisory Board Company
Disparate Disciplines Impair Formulas that Weight Faculty Research Productivity
Contacts at University B report that measuring
one variable across faculty members (e.g., total
citations) is more objective than any composite
score. Though composite scores of all research
productivity indicators offer convenient
comparisons of faculty members’ productivity,
no contact institutions use composite scores. Contacts at University B report that if senior
academic affairs administrators created such a formula, faculty would dispute how
administrators weight the factors in the formula rather than try to improve their research
productivity scores.
All contacts emphasize that each discipline should assess research productivity differently.
Contacts reflect that more research funding is available for engineering and science fields than
for humanities disciplines. Therefore, faculty in the arts and humanities should receive more
recognition during productivity reviews for securing research grants. Also, the time between
publications varies greatly across disciplines; mathematicians may consider one paper each
year productive, but biologists may not.
Digital Portfolios of Supporting Documentation Enable Convenient Document Compilation and Reviewer Access
Contacts at University C recommend that portfolios
should be customized by department to allow for
different definitions of faculty productivity. Faculty
members in science disciplines often submit curricula
vitae and published works, whereas faculty in art
departments submit portfolios that include artistic
pieces (e.g., reproductions of visual artwork, musical
compositions, etc.). Portfolio systems also enable faculty members to self-report research
productivity; contacts at University A reflect that this minimizes faculty resistance to
measuring research productivity.
Digital Measures, data management software that faculty at University A and University D
use, allows for customization across disciplines. One staff member in the assessment office at
Tenure and Promotion
Committees
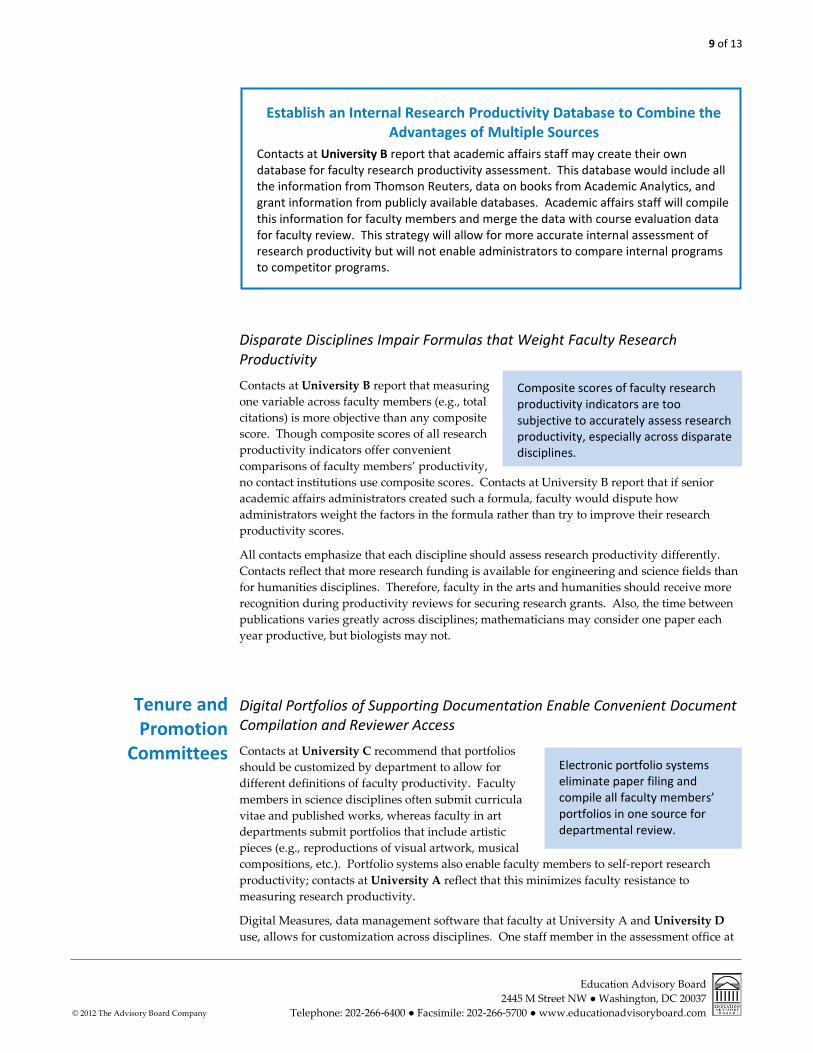
Composite scores of faculty research productivity indicators are too subjective to accurately assess research productivity, especially across disparate disciplines.
Electronic portfolio systems eliminate paper filing and compile all faculty members’ portfolios in one source for departmental review.
Establish an Internal Research Productivity Database to Combine the Advantages of Multiple Sources
Contacts at University B report that academic affairs staff may create their own database for faculty research productivity assessment. This database would include all the information from Thomson Reuters, data on books from Academic Analytics, and grant information from publicly available databases. Academic affairs staff will compile this information for faculty members and merge the data with course evaluation data for faculty review. This strategy will allow for more accurate internal assessment of research productivity but will not enable administrators to compare internal programs to competitor programs.
10 of 13
Education Advisory Board
2445 M Street NW ● Washington, DC 20037
Telephone: 202-266-6400 ● Facsimile: 202-266-5700 ● www.educationadvisoryboard.com
© 2012 The Advisory Board Company
University A maintains responsibility for customizing Digital Measures to include relevant
categories for various disciplines, such as performance and exhibition categories for
performing and visual arts. Faculty members may also designate research as private;
institution administrators may review this information for promotion and tenure decisions,
but the institutions will not release the information in publically available curricula vitae.
University B uses Sedona Software, a Web-interface, to document research productivity for
faculty members in the College of Liberal Arts and Social Sciences. Contacts report that this
software enables department heads and provost office staff to conveniently access all faculty
members’ productivity information and determine how faculty members rank among their
peers. Contacts at University D report that Academic Analytics helps tenure and promotion
committees gain insight into how faculty members rank in their department or against peers at
competitor institutions. However, academic affairs administrators should warn committees
about overreliance on such products because of their limitations and flaws.
Convenient Portfolio Compilation Encourages Complete and Accurate Portfolios
Contacts at University D report that the institution has used Digital Measures for three years
and that the software can automatically retrieve electronic copies of publications for faculty
members, which minimizes time faculty members spend on the portfolio compilation process.
Similarly, staff at University A are collaborating with Digital Measures to automatically
download citations from Scopus, an abstract and citation database. Most departments require
that new faculty members input the past five years of their research into the program, rather
than their whole research histories, to minimize portfolio creation time; the engineering college
employs a graduate assistant to input faculty research into Digital Measures.
When University A first started using Digital Measures, academic affairs administrators
trained faculty members to compile research into the software; contacts report that this
process helped staff gain faculty buy-in for portfolio completion. Now, a graduate assistant
trains new faculty members and faculty can view portfolio compilation training videos for
further instruction.
Annual and Cycle-based Reviews Ensure that Faculty Members Continue to Participate in Research, Teaching, and Service
University C requires faculty to document their teaching, public service, and publication
statuses (i.e., submitted, accepted, pending review) annually for merit raise considerations.
Academic affairs administrators also conduct reviews every five years to assess the
contributions (i.e., teaching, service, research) of the faculty members to the institution. The
provost’s office conducts departmental reviews every five or six years to assess each
Enable Faculty to Assign Credit for Each Researcher’s Involvement to Promote Interdisciplinary and Collaborative Research
Faculty members at University D detail the proportion of credit that all co-primary investigators should receive for collaborative research. Faculty may review their research expenditures and credit percentages for all projects before final calculations by academic affairs staff. Contacts report that this practice ensures the fairness of the faculty research productivity review process. If faculty members disagree on their credit proportions, project leads must mediate differences among faculty to obtain a consensus.
11 of 13
Education Advisory Board
2445 M Street NW ● Washington, DC 20037
Telephone: 202-266-6400 ● Facsimile: 202-266-5700 ● www.educationadvisoryboard.com
© 2012 The Advisory Board Company
department’s productivity. Contacts recommend that administrators contact leaders in the
respective fields to determine the average research productivity of a program in addition to
reviewing national rankings (e.g., National Science Foundation research and development
expenditure rankings).
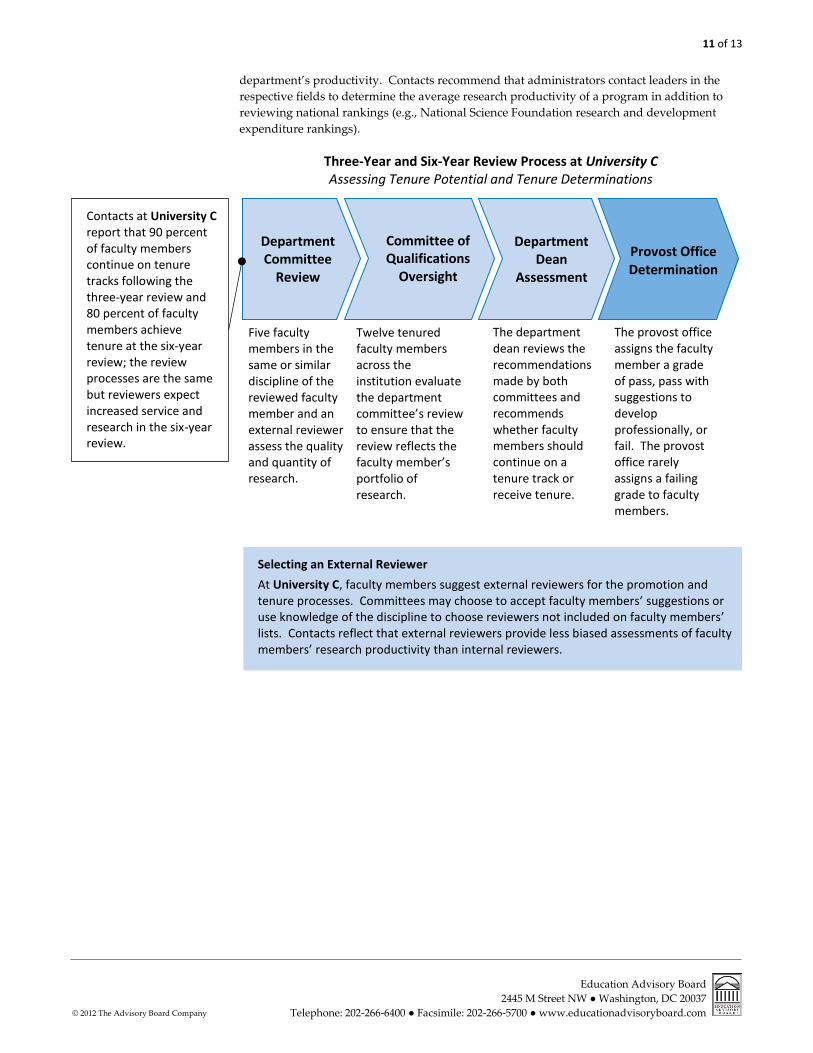
Three-Year and Six-Year Review Process at University C Assessing Tenure Potential and Tenure Determinations
Five faculty members in the same or similar discipline of the reviewed faculty member and an external reviewer assess the quality and quantity of research.
Department Committee
Review
Committee of Qualifications
Oversight
Twelve tenured faculty members across the institution evaluate the department committee’s review to ensure that the review reflects the faculty member’s portfolio of research.
The department dean reviews the recommendations made by both committees and recommends whether faculty members should continue on a tenure track or receive tenure.
Department Dean
Assessment
Provost Office Determination
The provost office assigns the faculty member a grade of pass, pass with suggestions to develop professionally, or fail. The provost office rarely assigns a failing grade to faculty members.
Contacts at University C report that 90 percent of faculty members continue on tenure tracks following the three-year review and 80 percent of faculty members achieve tenure at the six-year review; the review processes are the same but reviewers expect increased service and research in the six-year review.
Selecting an External Reviewer
At University C, faculty members suggest external reviewers for the promotion and tenure processes. Committees may choose to accept faculty members’ suggestions or use knowledge of the discipline to choose reviewers not included on faculty members’ lists. Contacts reflect that external reviewers provide less biased assessments of faculty members’ research productivity than internal reviewers.
12 of 13
Education Advisory Board
2445 M Street NW ● Washington, DC 20037
Telephone: 202-266-6400 ● Facsimile: 202-266-5700 ● www.educationadvisoryboard.com
© 2012 The Advisory Board Company
IV. Internal and External Use of Indicators
Peer Perception and Ability to Attract Students Supports Transition to Doctoral Degree-granting Programs
Several contacts report that state higher education coordinating boards are encouraging the
closure of more doctoral degree-granting programs than the initiation of programs. Contacts
at University B recommend that senior academic affairs administrators consider the following
questions when appraising the judgment of a higher education coordinating board:
How many degrees will the program likely produce annually?
Are current students interested in such a program, and are these students likely to
succeed in a doctoral program?
Are the faculty members able to secure research funding to sustain a doctoral program?
Contacts at University B report that peer reviews are equally important as research
productivity in determining whether faculty would succeed in a doctoral program. Contacts
at University D state that faculty ability to secure research funding is the best indicator of a
program’s viability; otherwise, an institution would struggle to financially support doctoral
students. However, only considering the ability to secure research funding favors technical
and scientific disciplines over humanities programs.
Senior Academic Affairs Administrators Present Plans to Increase Research Productivity to Governing Boards
Contacts at University B report that academic affairs administrators use charts and graphics
from Academic Analytics to present research trends to external constituencies (e.g., Board of
Directors) about internal and competitor programs. Administrators also report which
programs Academic Analytics identifies as successful or lacking among competitor programs.
Administrators then present plans to improve research productivity in programs that
Academic Analytics identified as weaker than competitors.
University D must report faculty productivity annually to the state system. In these
submissions, administrators include (in addition to the indicators listed in Section III): faculty
member salaries, the student credit hours that faculty members teach, and the level of courses
faculty members teach. Portfolio systems such as Digital Measures enable administrators to
conveniently demonstrate a faculty member’s research productivity to external constituencies;
administrators can combine faculty members’ reports to demonstrate an academic program’s
productivity.
Considerations for Transitioning
to Doctoral Programs
Communication with External
Constituencies
Establish Broadly Titled Doctoral Programs to Attract a Variety of Students and Minimize Program Closures
Student interest is a primary factor in the determination of whether a doctoral program should close. University C maintains broadly titled doctoral programs (e.g., Humanities) to allow for flexibility in course offerings; students focus courses in disciplines to customize the degree. The business school only offers two doctoral programs in management to prevent program closure. Students may concentrate in a variety of topics (e.g., finance, organizational behavior, etc.) within these programs. Contacts report that comparing these doctoral programs to competing programs is difficult because of the breadth of the programs.

13 of 13
Education Advisory Board
2445 M Street NW ● Washington, DC 20037
Telephone: 202-266-6400 ● Facsimile: 202-266-5700 ● www.educationadvisoryboard.com
© 2012 The Advisory Board Company
Encourage Faculty Members to Apply to Professional Development Programs to Enhance Research Productivity
Several biomedical sciences faculty members at University D receive professional development training through Support of Continuous Research Excellence, a National Institutes of Health program. The program aims to improve research excellence of minority-serving institutions. Academic affairs administrators may include such programs and internal centers for faculty development in plans to improve faculty research productivity that administrators present to governing boards.


![[Research Note] Sleep and Productivity](https://static.fdocuments.net/doc/165x107/55cf9671550346d0338b8396/research-note-sleep-and-productivity.jpg)