Assessing Employee Needs to Enhance a Workplace Wellness ...
33
Himmelfarb Health Sciences Library, e George Washington University Health Sciences Research Commons Doctor of Nursing Practice Projects Nursing Spring 2018 Assessing Employee Needs to Enhance a Workplace Wellness Program Paige Herschend, DNP, MSN, BSN, BA George Washington University Follow this and additional works at: hps://hsrc.himmelfarb.gwu.edu/son_dnp Part of the Mental and Social Health Commons , and the Nursing Administration Commons is DNP Project is brought to you for free and open access by the Nursing at Health Sciences Research Commons. It has been accepted for inclusion in Doctor of Nursing Practice Projects by an authorized administrator of Health Sciences Research Commons. For more information, please contact [email protected]. Recommended Citation Herschend, DNP, MSN, BSN, BA, P. (2018). Assessing Employee Needs to Enhance a Workplace Wellness Program. , (). Retrieved from hps://hsrc.himmelfarb.gwu.edu/son_dnp/25
Transcript of Assessing Employee Needs to Enhance a Workplace Wellness ...

Himmelfarb Health Sciences Library, The George Washington UniversityHealth Sciences Research Commons
Doctor of Nursing Practice Projects Nursing
Spring 2018
Assessing Employee Needs to Enhance aWorkplace Wellness ProgramPaige Herschend, DNP, MSN, BSN, BAGeorge Washington University
Follow this and additional works at: https://hsrc.himmelfarb.gwu.edu/son_dnp
Part of the Mental and Social Health Commons, and the Nursing Administration Commons
This DNP Project is brought to you for free and open access by the Nursing at Health Sciences Research Commons. It has been accepted for inclusionin Doctor of Nursing Practice Projects by an authorized administrator of Health Sciences Research Commons. For more information, please [email protected].
Recommended CitationHerschend, DNP, MSN, BSN, BA, P. (2018). Assessing Employee Needs to Enhance a Workplace Wellness Program. , (). Retrievedfrom https://hsrc.himmelfarb.gwu.edu/son_dnp/25

Running head: ENHANCING A WORKPLACE WELLNESS PROGRAM 1
Assessing Employee Needs to Enhance a Workplace Wellness Program
Presented to the Faculty of the School of Nursing,
The George Washington University,
In partial fulfillment of the
requirements for the degree of
Doctor of Nursing Practice
Paige Herschend, MSN, BSN, BA
DNP Project Team
Ellen Kurtzman, PhD, MPH, RN, FAAN
Kimberly Acquaviva, PhD, MSW, CSE
Vicki Parker, RN
Date of Degree: Spring 2018
ENHANCING A WORKPLACE WELLNESS PROGRAM 2
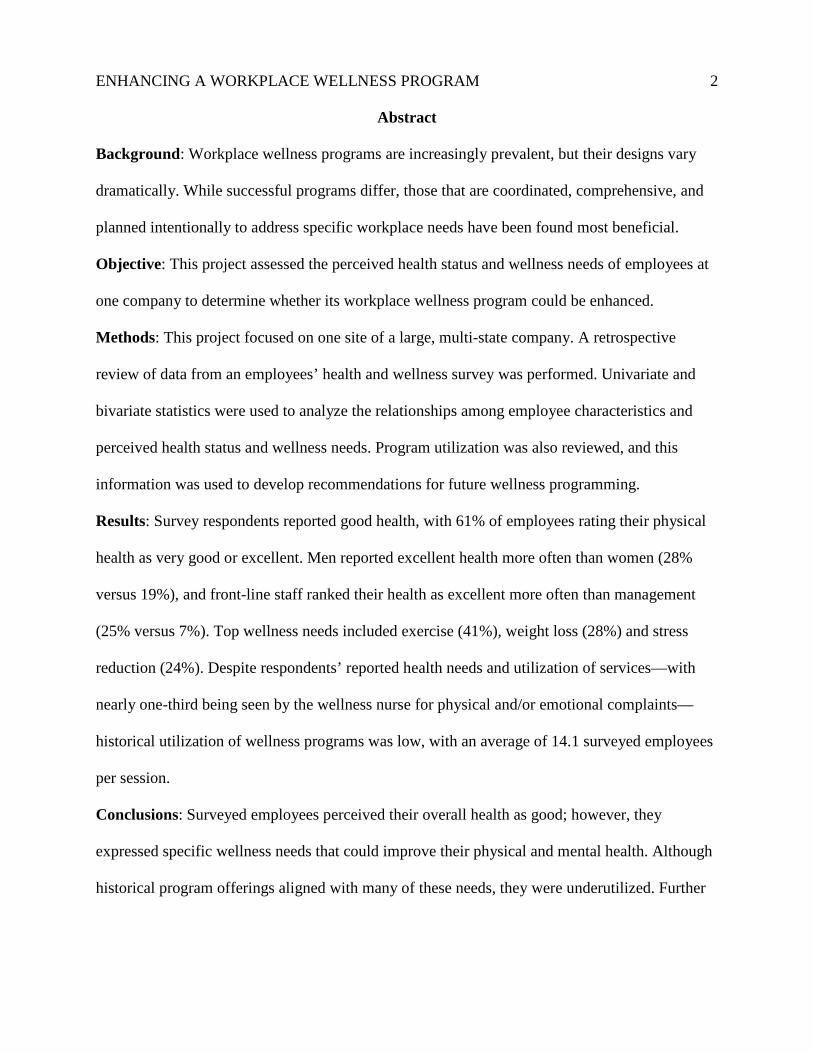
Abstract
Background: Workplace wellness programs are increasingly prevalent, but their designs vary
dramatically. While successful programs differ, those that are coordinated, comprehensive, and
planned intentionally to address specific workplace needs have been found most beneficial.
Objective: This project assessed the perceived health status and wellness needs of employees at
one company to determine whether its workplace wellness program could be enhanced.
Methods: This project focused on one site of a large, multi-state company. A retrospective
review of data from an employees’ health and wellness survey was performed. Univariate and
bivariate statistics were used to analyze the relationships among employee characteristics and
perceived health status and wellness needs. Program utilization was also reviewed, and this
information was used to develop recommendations for future wellness programming.
Results: Survey respondents reported good health, with 61% of employees rating their physical
health as very good or excellent. Men reported excellent health more often than women (28%
versus 19%), and front-line staff ranked their health as excellent more often than management
(25% versus 7%). Top wellness needs included exercise (41%), weight loss (28%) and stress
reduction (24%). Despite respondents’ reported health needs and utilization of services—with
nearly one-third being seen by the wellness nurse for physical and/or emotional complaints—
historical utilization of wellness programs was low, with an average of 14.1 surveyed employees
per session.
Conclusions: Surveyed employees perceived their overall health as good; however, they
expressed specific wellness needs that could improve their physical and mental health. Although
historical program offerings aligned with many of these needs, they were underutilized. Further

ENHANCING A WORKPLACE WELLNESS PROGRAM 3 research is needed to understand this discrepancy and improve program participation in the
future.
Background
The typical employed adult spends 8.9 hours per day at work; on average, one third of an
adult’s life is spent at the workplace (US Bureau of Labor Statistics, 2015). This is the largest
waking time commitment in an adult’s life and therefore an ideal target for health-related
interventions; yet, as of 2014, only 25% of large companies (500+ employees) offered onsite
occupational health, and only 16% offered onsite primary care (Mercer, 2015). Health promotion
activities are more prevalent, with an estimated 73-98% of companies offering some type of
program (Centers for Disease Control and Prevention [CDC], 2016). For example, programs like
smoking cessation, weight loss, and exercise groups are common, while other companies are
creative with flexible schedules, telephone or internet-based coaching, or subsidized gym
memberships.
Workplace wellness programs vary dramatically in their scope, offerings, and
effectiveness, making direct comparison difficult. Previous research has identified some common
elements of effective programs. Ultimately, effective programs were found to be comprehensive,
coordinated, and well-planned (CDC, 2016). Additionally, successful programs were tailored to
the workplace in question. As the CDC has contended, “a successful workplace health program
is one that is targeted to the specific employee population, suiting the worksite, employee needs,
and personal and organizational health goals” (Workplace Health Model, 2016, “Step 1,” para.
1).

ENHANCING A WORKPLACE WELLNESS PROGRAM 4
Problem Statement
Driven by this contention—that assessing employees’ needs and targeting wellness
programming is a critical first step—this project examined one company’s workplace wellness
program, known as the Health Advocate Nurse program (HAN). This program began in 2012 as
a community health program, which was then expanded by the company with the commitment of
its leadership and nurses into a full-scale employer offered wellness program. At the time of its
inception, the program’s structure and goals were loosely defined, and its affiliation to the
founding company was distant. Additionally, many of the employees served by this program
were seasonal and/or part-time employees. Because of the organic way in which the HAN
program developed and the unique composition of the employees it served, there was a need to
examine whether the HAN program was optimally designed to meet employees’ health and
wellness needs.
Purpose
This project assessed the perceived health status and wellness needs of employees at the
Atlanta, Georgia site of a large, multi-state company. This specific site, which employed 145
full-time and 847 seasonal employees, was selected as the project site because it developed the
Health Advocate Nurse program. Analyses of employees’ perceived health status and wellness
needs, as well as historical program utilization, were used to inform recommendations for future
program enhancement.
Significance
This project was unique, in that it focused on a workplace wellness program that evolved
organically and had matured at a time when there was little evidence regarding effective
workplace wellness program design, generally, and even less literature regarding design for non-

ENHANCING A WORKPLACE WELLNESS PROGRAM 5 traditional labor forces including seasonal and part-time employees (Stiehl et al., 2017). Given
this company’s employee base, a retrospective assessment of employees’ needs relative to the
wellness program represented an important opportunity for improvement. By analyzing the
perceived health status and expressed wellness needs of employees along with the utilization of
existing wellness services, this project informed enhancements to the HAN Program and
provided guidance for future programming.
Specific Aims
The aims of the project were to:
• Describe employees’ perceived health status and wellness needs;
• Describe employees’ utilization of the HAN Program and its services;
• Analyze the relationship among perceived health status, wellness needs, and employee
characteristics;
• Develop actionable recommendations to enhance the HAN Program and guide future
programming.
Research Questions
In conducting this analysis, the following questions were asked:
• What were the demographic and employment characteristics of the employees?
• What were the utilization patterns of HAN Program services among employees?
• What were their perceived health status and wellness needs?
• What was the relationship among health status, wellness needs, and employee
characteristics?
• How could the HAN program be enhanced to address employees’ perceived health status
and wellness needs?

ENHANCING A WORKPLACE WELLNESS PROGRAM 6
Literature Review
This review examined the literature on workplace wellness program planning, design,
and efficacy as a foundation for wellness program evaluation. For this literature review, the
online databases PubMed, CINAHL, and Google Scholar were searched for peer-reviewed
studies that contained the key words “workplace wellness,” “return on investment,” “health
promotion,” “part-time,” and “employee health.” There were 311 studies identified using these
terms, which were screened by title and abstract for potential applicability. Studies considered
for inclusion had to meet the following criteria: (1) there was a workplace wellness intervention
targeting employees, (2) the wellness program was sponsored by the employer, (3) the studies
were published in English since 2008. Of the original 311 titles screened, 49 studies met these
criteria, and were closely examined for their pertinence to the project’s aims. Studies were
retained if they examined the development, implementation, or evaluation of one or more
workplace wellness program. Specific attention was paid to studies focusing on programs
targeting seasonal or part-time employees and to those focused specifically on employee needs
assessments. A total of 16 studies were selected for inclusion in this review.
Six of the 16 studies focused on evaluating the effectiveness of a single workplace health
intervention. Their findings generally suggested benefits from workplace wellness programs in
the form of better health outcomes and reduction of employees’ chronic disease risk. For
example, Rouseff et al. (2016) demonstrated reduced cardiometabolic risk factors among
employees undergoing an intensive 12-week lifestyle modification program. Participants
showed a statistically significant (p<0.001) reduction in body mass index (BMI), blood pressure,
total and low-density lipoprotein (LDL) cholesterol, and hemoglobin A1c by the end of the 12-
week intervention, and the changes in BMI and blood pressure persisted at one-year post-

ENHANCING A WORKPLACE WELLNESS PROGRAM 7 intervention. A study by Weinhold et al. (2015) noted improved metabolic risk factors among
prediabetics after a workplace wellness intervention and demonstrated a statistically significant
(p<0.05) reduction in blood pressure, cholesterol, and body weight through the utilization of a
group-based lifestyle intervention. Kramer et al. (2015) implemented a comprehensive program
of education, telephone coaching, group teaching, and exercise, with the goal of increasing
healthy choices and reducing risk factors for chronic disease. Participants in this study
demonstrated a statistically significant decrease in weight (−5%, p<0.001), and improvements in
self-reported time spent in physical activity (+25.0 minutes, p= 0.04) (Kramer et al., 2015).
Only three studies in this group specifically focused on low-income or seasonal employee
populations, and all three showed statistically significant impacts on employees’ behaviors
(Lassen et al., 2011; Backman, Gonzaga, Sugerman, Francis, & Cook, 2011; Korshoj, Ravn,
Holtermann, Hansen, and Krustrup, 2016). For example, Lassen et al. showed a significant
decrease in dietary intake of fats (-2.2%, p=0.002) and sweets (-18g, p=0.002) after providing
nutritional education and healthier onsite food options (2011), while a similar study
demonstrated that increasing the fresh fruits available to low-wage employees led to a significant
increase in individuals’ purchase and consumption of fruits and vegetables (Backman, Gonzaga,
Sugerman, Francis, & Cook, 2011). The only randomized-controlled study of a workplace
wellness program that focused on low-income employees was a cluster randomized study by
Korshoj, Ravn, Holtermann, Hansen, and Krustrup (2016). Because of the increased risks of
cardiovascular disease among these employees and the fewer resources they had to mitigate
these risks, the authors theorized that the workplace was an ideal setting for introducing an
aerobic exercise regimen, and this intervention demonstrated a statistically significant (p<0.05)

ENHANCING A WORKPLACE WELLNESS PROGRAM 8 reduction in C-reactive protein and LDL cholesterol between groups (Korshoj, Ravn,
Holtermann, Hansen, & Krustrup, 2016).
The three remaining studies were descriptive studies that did not include an intervention.
The first was a scoping review in which the authors Stiehl et al. examined the literature on
workplace wellness programs specifically targeting low-wage workers (Stiehl et al., 2017). The
authors reviewed 35 interventional and non-interventional studies and coded them thematically.
These authors acknowledged the potential of workplace wellness programs to improve health
outcomes for low-wage workers, while criticizing the lack of research on this population. They
highlighted greater health risks and reduced healthcare access as key findings that should guide
future research, and emphasized that more research was needed to understand how to increase
access and participation in this population.
The same group of lead researchers conducted the remaining two studies and examined
employers and employees’ perspectives on workplace wellness programs. The first was a study
of midsize employers’ perspectives on workplace wellness programs (Hannon, Hammerback,
Garson, Harris & Sopher, 2012), while the second assessed employees’ perspectives
(Hammerback, Hannon, Harris, Thorp, Kohn and Parrish, 2015). In the first study, researchers
noted that most respondents viewed workplace wellness programs positively but were not
confident of their effectiveness when implemented in their workplace. The four recurrent themes
they identified among these employers were: (1) a belief that these programs could reduce their
health care costs, (2) a belief that they would improve employee morale and/or productivity (3) a
fear of being intrusive, and (4) a belief that their employees would not utilize the program
(Hannon, Hammerback, Garson, Harris & Sopher, 2012).

ENHANCING A WORKPLACE WELLNESS PROGRAM 9
These authors’ subsequent study used interviews of employees in the same set of low-
wage industries to determine if employer concerns about workplace wellness programs were also
raised by employees. They found that the majority of employees expressed interest in wellness
programs, but were concerned that their employers would not make health/wellness a priority or
be willing to cover its costs. None of the employees interviewed expressed concerns about
privacy or employer intrusion. When asked about programs of greatest interest, physical activity,
nutrition, and weight control were the most commonly named. The authors concluded that both
employers and employees saw workplace wellness programs as potentially valuable, but both
groups assumed the other might not be interested. The authors contended that in order to tailor
programs to meet employees’ needs, communication between employers and employees was
critical (Hammerback, Hannon, Harris, Thorp, Kohn and Parrish, 2015).
Along with investigations that examined their health benefits, researchers have begun to
examine the cost effectiveness of workplace wellness programs. While some studies have
demonstrated a positive return on investment (ROI) (Dement, Epling, Joyner, & Cavanaugh,
2015; Lerner, Rodday, Cohen, & Rogers, 2013; Light, Kline, Drosky, & Chapman, 2015;
Musich, McCalister, Wang, & Hawkins, 2015), there is a wide variation, some of which has been
attributed to study rigor. In a systematic review designed to assess the effect of study
methodology on ROI evaluation, Baxter, Sanderson, Venn, Blizzard and Palmer noted that
studies with higher methodological quality demonstrated smaller financial returns (2014). In an
editorial review of Baxter et al.’s work, O’Donnell (2015) criticized these authors’ emphasis on
ROI in the workplace wellness literature. Like Baxter and her colleagues, O’Donnell affirmed
that ROI can be difficult to assess, and that it can vary significantly by study methodology,
program scope, and measures of cost savings. O’Donnell contended, however, that workplace

ENHANCING A WORKPLACE WELLNESS PROGRAM 10 wellness programs should be considered human resource investments, and that employers should
be less concerned about ROI and more concerned about improving employee health and
enhancing market competitiveness and reputation (O’Donnell, 2015; Sherman & Fabius, 2012).
Despite the volume of research on workplace wellness, gaps exist. The majority of
studies reviewed have focused on large, professional companies and their full-time employees.
ROI studies are highly variable, and evaluation criteria are ill defined. Even so, the existing
research provided a best practices framework for this project.
Theoretical Foundation: The CDC Workplace Health Model
This project utilized the CDC’s Workplace Health Model as the theoretical foundation for
program evaluation and planning. This framework was developed with the assumption that a
coordinated, evidence-based approach to program development and implementation would
provide the best results. According to the CDC, effective workplace wellness programs have the
potential to reduce health risks and improve quality of life for employees (CDC, 2016). Research
has shown, however, that not every workplace wellness program is successful. In fact, evidence
has suggested that poorly designed programs may do more harm than good (Volk & Corlette,
2012), either by increasing corporate expenses without tangible results or by deterring employees
from adopting the behavior being promoted. Successful programs differ in their details, but tend
to be comprehensive, coordinated, and well-planned (CDC, 2016). To help businesses optimize
the effectiveness of their wellness programs, the CDC created a framework called the Workplace
Health Model. This model includes four steps: assessment, planning & management,
intervention, and evaluation. Recommendations for evidence-based approaches to maximizing
the positive impact of the program’s health benefits are provided at each step (CDC, 2016). The

ENHANCING A WORKPLACE WELLNESS PROGRAM 11 framework’s emphasis on coordinated programming tailored to the individual workplace
provided the impetus for this project.
Variables
In the analyses that follow, the dependent variables of greatest interest were the
employees’ perceived health status, expressed wellness needs, and historic utilization of the
HAN program (Table 1).
Table 1. Project Variables
Variable Theoretical Definition Operational Definition
Dependent Variables (1) Perceived health status
Perceived physical health status
The range of manifestation of disease in a given patient according to their self-perception
Ordinal Scale:
1) Very poor 2) Poor 3) Fair 4) Good 5) Excellent
Perceived mental health status
The range of manifestation of disease in a given patient according to their self-perception
Ordinal Scale:
1) Very poor 2) Poor 3) Fair 4) Good 5) Excellent
Perceived spiritual health status
The range of manifestation of disease in a given patient according to their self-perception
Ordinal Scale:
1) Very poor 2) Poor 3) Fair 4) Good 5) Excellent
(2) Expressed wellness needs Participants chose from a list of 58 options of future program offerings.
Binary:
Survey respondents marked all options they wanted.
Variable expressed as a proportion of total

ENHANCING A WORKPLACE WELLNESS PROGRAM 12
respondents, and limited to the 3 of highest frequency
Historical Program Utilization
(3) Utilization of HAN Educational Offerings
Most highly utilized educational offerings of the HAN Program
Average attendance per session for each of seven program types
(1) Diet/Nutrition (2) Exercise (3) Financial management (4) Mental Health (5) Spiritual Health (6) Screening exams (7) Other Programs
(4) Utilization of HAN 1:1 Encounters
Number of uses of 1:1 nurse encounters grouped by chief complaint/concern
Number of each complaint seen throughout the year
(1) Family (2) Financial (3) Relationships (4) Physical (5) Emotional (6) Spiritual
Employee Characteristics
Health insurance status Possession of a type of insurance coverage that covers the cost of an insured individual's medical and surgical expenses
Binary:
No insurance: (0) Insurance: (1) No Answer given: (99)
Job Classification A prescribed or expected behavior associated with a particular position or status in a group or organization.
Binary: Front-line staff: (0) Management: (1) No Answer given: (99)
Age Number of years since birth Categorical: grouped into four age ranges 0-20: (0) 21-40: (1) 41-64: (2) 65+: (3)

ENHANCING A WORKPLACE WELLNESS PROGRAM 13
No Answer given: (99)
Gender Self-identification as male or female
Binary: Male: 0 Female: 1 No Answer given: (99)
Marital Status A legal definition of being married or not married.
Categorical Single: (0) Separated/Divorced: (1) Married: (2) Widowed: (2) No Answer given: (99)
Race Belonging to a social group with a shared national or cultural tradition
Categorical: Asian: (0) Black: (1) Hawaiian/Pacific Islander: (2) 2+ races: (3) White: (4) Unknown: (5) No Answer given: (99)
Methods
Research Design
A retrospective review of secondary data collected by the company was performed.
These data included an employee survey regarding the HAN program, program utilization trends
gathered by the Health Advocate Nurse, and demographic data collected by the company’s
Human Resources Department.
Population/Sample
The target population included all employees at the worksite, all of whom had access to
the HAN Program as a benefit of employment. Demographic data were collected throughout the
year on all 992 employees by Human Resources. The health/wellness survey was distributed to

ENHANCING A WORKPLACE WELLNESS PROGRAM 14 each employee on arrival at one of five mandatory employee meetings, and was collected at each
meeting’s conclusion as employees exited the event. Employees chose only one of the five
meetings to attend, so there was no duplication in survey responses. Despite being mandatory,
some employees did not attend these meetings. Additionally, because these meetings all occurred
early in the year, many employees were hired after they had already been conducted. As a result,
even though the company listed 992 employees for the year, only 682 were eligible to complete a
survey. Of these, 402 surveys were completed and returned, for a 59% response rate. Protected
populations of minors and pregnant women were included in the data for this project, as they had
equal access to the HAN program.
Setting
The setting for this project was one worksite of a large, multi-state company outside of
Atlanta, GA.
Instrumentation/Measurements
Data for this project were drawn from three sources:
• First, employee data regarding perceived health status and wellness needs were gathered
from a confidential survey that was designed and conducted by the HAN nurse leader (Appendix
A). The survey was created based upon online sources and publicly available health assessment
surveys and refined with the help of select community nurses practicing in the Atlanta area. The
survey was first administered in 2009 and was adapted yearly based upon employee feedback.
Previous survey results were not retained, so were unavailable for analysis. The survey was
never tested for validity or reliability. All survey data were coded and entered into Excel for
analysis by the primary researcher. As noted, 402 employees completed and returned this survey
about their health status and wellness needs.

ENHANCING A WORKPLACE WELLNESS PROGRAM 15
• Demographic information for employees at this worksite was provided by Human
Resources in the form of an Excel spreadsheet. This included employee-level information on sex,
age, and race, as well as information about employment type. The variables were numerically
coded for analysis in Excel. Demographic data from 992 employees—including the 402
employees who responded to the confidential survey—were available for analysis.
• HAN utilization was measured two ways. Individual encounters with the nurse were
counted and assigned by the nurse to one of nine categories based on the patient’s chief
complaint/need. Aggregate attendance at seven types of group program offerings was tracked by
session. The unit of analysis for these data were site-level.
Data Analysis
Survey data were entered into Excel and imported into SPSS. Descriptive statistics were
produced to describe the sample, HAN utilization, and health status. Chi-square tests for
independence were used to (1) compare the characteristics of survey respondents to the
worksite’s entire employee population and (2) test the associations between wellness needs and
employee characteristics. Mann-Whitney tests were used to examine the relationship between
employees’ perceived health status, employee characteristics, and wellness needs.
Ethical Considerations
The project was reviewed by The George Washington University’s Institutional Review
Board (IRB) and determined not to meet the definition of human subject’s research. The ethical
concerns of this project were minimal. All information was de-identified before it was received
by the primary researcher. Participation in the employee survey was voluntary and permission
for use of these data for these analyses and for the purpose of scholarship was granted by the
company’s CEO and owners. Because of the sensitive nature of the topics covered in the survey

ENHANCING A WORKPLACE WELLNESS PROGRAM 16 and the company’s proprietary status, these data were still regarded as confidential and private.
To protect confidentiality, all data was stored on a password-protected PC, which was only
accessible to the primary researcher. Additionally, by being unnamed, the company’s privacy
and anonymity have been maintained.
Results
Employee Characteristics
As seen in Table 2, employees who completed the survey were likely to be female (60%),
and under 40 years old (69%). By age and gender, survey respondents were similar to all
employees; however, they varied by job classification. Specifically, the proportion of front-line
employees was significantly lower among survey respondents than in the employee population
(85% vs 91%, p=0.010), while management was overrepresented in the survey (15% vs 9%).
Table 2: Employee Characteristics Characteristic Survey Respondents (n=402) All Employees at Worksite (n=992) Frequency Percent Frequency Percent Gender Male 161 40% 402 40% Female 236 59% 589 60% No Answer 5 1% - - Age 0-20 156 39% 465 47% 21-40 119 30% 303 31% 41-64 79 20% 154 15% 65+ 28 7% 60 6% No Answer 20 5% 6 1% Marital Status Single 278 69% - - Separated 25 6% - - Married 79 20% - - Widowed 5 1% - - No Answer 15 4% - - County of Residence DeKalb 199 50% - - Gwinnet 126 31% - - Other 66 16% - - No Answer 11 3% - - Job Classification Front-line 342 85% 903 91% Management 60 15% 88 9% No Answer - - - -

ENHANCING A WORKPLACE WELLNESS PROGRAM 17
Health Insurance No Insurance 50 12% - - Insurance 325 81% - - No Answer 27 7% - - Race Black - - 653 66% White - - 264 27% Two or More - - 29 3% Hawaiian/Pacific Islander - - 1 0.1% Asian - - 14 1% No Answer - - 5 1%
Note. Cells left blank (-) when data was not gathered or not applicable
Program Utilization
Table 3 displays a yearly tally of educational program offerings, stratified by program
type. Of all the programs offered, mental health programs averaged the most attendees per
session (9.2), followed by screening programs with a mean of 5.4 employees per session. For the
individual nurse encounters recorded in Table 4, physical complaints were the most common
chief complaint (34.4%), follow closely by emotional concerns (32.1%).
Table 3: 2016 HAN Educational program utilization by program type (n=992) Program type Total sessions Total attended Mean attendance per session Diet/Nutrition 25 77 3.1 Exercise 22 88 4.0 Financial 9 35 3.9 Mental Health 6 55 9.2 Spiritual Health 46 142 3.1 Screenings 16 86 5.4 Other 45 1402 31.2 Total 169 2379 14.1
Table 4: 2016 HAN Individual nurse encounters by chief complaint (n=992)
Chief Complaint Encounters
Percentage of Total Family 76 8.5
Financial 103 11.5
Relationships 84 9.4
Physical 307 34.4
Emotional 287 32.1
Spiritual 32 3.6
Other 4 0.5

ENHANCING A WORKPLACE WELLNESS PROGRAM 18
Total 893 100
Employee Survey Responses
Employee surveys were distributed to a total of 682 employees across five meetings
during the spring of 2017. A total of 402 surveys were returned, for an average return rate of
59%.
Among employees completing the survey, nearly 70% perceived their physical health
status as good or excellent (Table 5). Similarly, 78% of employees rated their mental health as
good or excellent, and 79% rated their spiritual health as highly.
Table 5: Perceived health status of survey respondents (n=402) Perceived Health Status by Rank % (n) Descriptive Statistics Very
Poor Poor Fair Good Excellent Mean SD Skewness Kurtosis
Physical 0.3% (1) 4.8% (17) 25.3% (89) 46.9% (165) 22.7% (80) 3.9 0.83 -0.39 2.8 Mental 0.6% (2) 4.6% (16) 16.9% (59) 43.7% (153) 34.3% (120) 4.1 0.86 -0.77 3.3 Spiritual 0.3% (1) 3.2% (11) 17.3% (60) 35.6% (123) 43.6% (151) 4.2 0.85 -0.79 3.0
Survey respondents expressed a need for a wide variety of program offerings, beyond
what would be considered part of a traditional wellness program (see Appendix B for complete
list of responses). The top three wellness needs identified were exercise, weight loss, and stress
reduction (Table 6).
Table 6: Top three expressed wellness needs (n=402) Wellness Need Total Yes Responses Percent of Survey Respondents
Exercise 163 41%
Weight loss 113 28%
Stress reduction
96
24%
Surveyed employees’ perceived health status varied by gender, marital status, job
classification, and age group (Table 7). Men ranked their physical health significantly higher
than women, with 30% of men ranking their health as excellent, compared to 19% of women.
Men also ranked their mental (44% vs. 28%, p< 0.01) and spiritual health (53% vs. 38%, p<

ENHANCING A WORKPLACE WELLNESS PROGRAM 19 0.01) higher than women. Employees under 20 (34%) versus those in older age groups (13.6%-
17.1%) and front-line staff (25.5%) versus management (7.4%) also ranked their physical health
significantly higher (p< 0.01). Although this pattern of better reported health among front-line
versus management staff persisted on spiritual health—with 48% of front-line staff versus 19%
of management staff ranking their spiritual health as “excellent” (p<0.01)—differences were not
statistically significant for rankings of mental health—37% of front-line versus 21% of
management ranked their mental health as “excellent” (p=0.15).
There were also significant differences in mental and spiritual health based on age, with
the youngest and oldest employees reporting significantly higher health in this areas. Employees
over 65 had the highest reported mental (52.4%) and spiritual (61.9%) health, followed by
employees under 20, with 42.3% reporting excellent mental health and 54.7% reporting excellent
spiritual health (p<0.01)
Table 7: Comparison of health status by employee characteristic (n=402) Characteristic Physical Health Status by Rank % (n) Very Poor Poor Fair Good Excellent p-value Gender Male 0.0% (0) 3.6% (5) 17.3% (24) 49.6% (69) 29.5% (41)
0.03 Female 0.5% (1) 5.7% (12) 29.2% (61) 45.9% (96) 18.7% (39) Age 0-20 0.0% (0) 2.9% (4) 14.6% (20) 48.9% (67) 33.6% (46)
<0.01 21-40 0.9% (1) 9.3% (10) 36.1% (39) 39.8% (43) 13.9% (15) 41-64 0.0% (0) 2.9% (2) 30.0% (21) 50.0% (35) 17.1% (12) 65+ 0.0% (0) 0.0% (0) 13.6% (3) 72.7% (16) 13.6% (3) Marital Status
Single 0.4% (1) 5.8% (14) 23.6% (57) 44.6% (108) 25.6% (62) 0.01 Separated 0.0% (0) 0.0% (0) 58.3% (14) 29.2% (7) 12.5% (3)
Married 0.0% (0) 4.3% (3) 20.0% (14) 62.9% (44) 12.9% (9) Widowed 0.0% (0) 0.0% (0) 25.0% (1) 75.0% (3) 0.0% (0)
County of Residence DeKalb 0.0% (0) 6.3% (11) 22.4% (39) 45.4% (79) 25.9% (45)
0.06 Gwinnet 0.9% (1) 1.8% (2) 23.9% (27) 48.7% (55) 24.8% (28) Other 0.0% (0) 6.7% (4) 35.0% (21) 50.0% (30) 8.3% (5)
Job Classification Front-line staff 0.3% (1) 3.7% (11) 22.5% (67) 48.0% (143) 25.5% (76) <0.01 Management 0.0% (0) 11.1% (6) 40.7% (22) 40.7% (22) 7.4% (4)
Health Insurance Status

ENHANCING A WORKPLACE WELLNESS PROGRAM 20
No Insurance 0.0% (0) 13.3% (6) 26.7% (12) 44.4% (20) 15.6% (7) 0.09 Insurance 0.3% (1) 3.8% (11) 24.7% (71) 48.1% (138) 23.0% (66)
Mental Health Status by Rank % (n) Very poor Poor Fair Good Excellent p-value Gender Male 0.0% (0) 2.9% (4) 8.8% (12) 44.5% (61) 43.8% (60) <0.01 Female 1.0% (2) 5.7% (12) 22.0% (46) 43.1% (90) 28.2% (59) Age 0-20 0.7% (1) 2.9% (4) 16.8% (23) 37.2% (51) 42.3% (58)
<0.01 21-40 0.9% (1) 10.2% (11) 23.1% (25) 44.4% (48) 21.3% (23) 41-64 0.0% (0) 0.0% (0) 10.1% (7) 59.4% (41) 30.4% (21) 65+ 0.0% (0) 0.0% (0) 9.5% (2) 38.1% (8) 52.4% (11) Marital Status
Single 0.8% (2) 5.8% (14) 17.8% (43) 40.9% (99) 34.7% (84) 0.51 Separated 0.0% (0) 4.3% (1) 30.4% (7) 39.1% (9) 26.1% (6)
Married 0.0% (0) 1.4% (1) 11.6% (8) 52.2% (36) 34.8% (24) Widowed 0.0% (0) 0.0% (0) 25.0% (1) 75.0% (3) 0.0% (0)
County of Residence DeKalb 1.2% (2) 4.7% (8) 16.3% (28) 40.7% (70) 37.2% (64)
0.38 Gwinnet 0.0% (0) 3.5% (4) 14.9% (17) 45.6% (52) 36.0% (41) Other 0.0% (0) 6.8% (4) 23.7% (14) 47.5% (28) 22.0% (13)
Job Classification Front-line staff 0.3% (1) 4.4% (13) 16.2% (48) 42.4% (126) 36.7% (109) 0.15 Management 1.9% (1) 5.7% (3) 20.8% (11) 50.9% (27) 20.8% (11)
Health Insurance Status No Insurance 2.2% (1) 6.7% (3) 15.6% (7) 55.6% (25) 20.0% (9) 0.15 Insurance 0.3% (1) 4.5% (13) 16.8% (48) 43.0% (123) 35.3% (101)
Spiritual Health Status by Rank % (n) Very poor Poor Fair Good Excellent p-value Gender Male 0.7% (1) 3.7% (5) 11.8% (16) 30.9% (42) 52.9% (72) 0.03 Female 0.0% (0) 2.9% (6) 20.9% (43) 38.3% (79) 37.9% (78) Age 0-20 0.0% (0) 2.2% (3) 13.9% (19) 29.2% (40) 54.7% (75)
<0.01 21-40 0.9% (1) 7.5% (8) 27.4% (29) 40.6% (43) 23.6% (25) 41-64 0.0% (0) 0.0% (0) 13.2% (9) 39.7% (27) 47.1% (32) 65+ 0.0% (0) 0.0% (0) 9.5% (9) 28.6% (27) 61.9% (32) Marital Status
Single 0.4% (1) 4.2% (10) 18.3% (44) 34.6% (83) 42.5% (102) 0.87 Separated 0.0% (0) 4.3% (1) 26.1% (6) 26.1% (6) 43.5% (10) Married 0.0% (0) 0.0% (0) 13.4% (9) 37.3% (25) 49.3% (33) Widowed 0.0% (0) 0.0% (0) 25.0% (1) 50.0% (2) 25.0% (1)
County of Residence DeKalb 0.6% (1) 3.6% (6) 16.6% (28) 30.2% (51) 49.1% (83) 0.41 Gwinnet 0.0% (0) 1.8% (2) 18.4% (21) 38.6% (44) 41.2% (47) Other 0.0% (0) 5.2% (3) 19.0% (11) 43.1% (25) 32.8% (19)
Job Classification Front-line staff 0.3% (1) 3.4% (10) 12.6% (37) 35.7% (105) 48.0% (141) <0.01 Management 0.0% (0) 1.9% (1) 44.2% (23) 34.6% (18) 19.2% (10)
Health Insurance Status No Insurance 2.2% (1) 2.2% (1) 20.0% (9) 37.8% (17) 37.8% (17) 0.13 Insurance 0.0% (0) 3.5% (10) 17.0% (48) 35.1% (99) 44.3% (125)

ENHANCING A WORKPLACE WELLNESS PROGRAM 21
As shown in Table 8, some of the top wellness needs varied by employee characteristics,
while others did not. Among employees who reported that they needed exercise programs, there
was no significant difference by gender, age, job classification, or health insurance status. While
25% of employees over 65 expressed a desire for exercise programming compared to greater
than 40% of younger employees, this difference was not statistically significant (p=0.17).
Employees’ reported need for weight-loss programs varied by gender and job classification: 33%
of women reported needing a weight loss program compared to 22% of men (p=0.01) as did 52%
of managers compared to 24% of front-line staff (p<0.01). More female than male (28% vs
19%, p<0.05), management than front-line (42% vs 21%, p<0.01), and insured than uninsured
(27% vs 12%, p<0.05) employees reported needing stress reduction.
Table 8: Comparison of top three wellness needs by employee characteristic (N=402) Characteristic Wellness Needs % (n) Exercise Weight-loss Stress Reduction Gender Male 39.8% (64) 21.7% (35) 18.6% (30) Female 42.0% (99) 33.1% (78) 27.5% (65) p-value 0.66 0.01 0.04 Age 0-20 41.7% (65) 19.9% (31) 19.9% (31) 21-40 46.2% (55) 39.5% (47) 32.8% (39) 41-64 36.7% (29) 34.2% (27) 22.8% (18) 65+ 25.0% (7) 10.7% (3) 14.3% (4) p-value 0.17 0.323 0.05 Marital Status
Single 43.9% (122) 29.1% (81) 23.7% (66) Separated 52.0% (13) 36.0% (9) 24.0% (6) Married 34.2% (27) 29.1% (23) 25.3% (20) Widowed 0.0% (0) 0.0% (0) 20.0% (1) p-value 0.07 0.45 0.99
County of Residence DeKalb 45.7% (91) 26.6% (53) 20.1% (40) Gwinnet 36.5% (46) 31.8% (40) 26.2% (33) Other 36.4% (24) 30.3% (20) 33.3% (22)
p-value 0.18 0.59 0.08 Job Classification
Front-line 39.5% (135) 24.0% (82) 20.8% (71) Management 46.7% (28) 51.7% (31) 41.7% (25) p-value 0.30 <0.01 <0.01
Health Insurance No Insurance 40.0% (20) 22.0% (11) 12.0% (6) Insurance 41.9% (136) 29.9% (97) 26.2% (85)

ENHANCING A WORKPLACE WELLNESS PROGRAM 22
Table 9: Comparison of Wellness Needs by Health Status (N=402) Wellness Needs Physical Health Status by Rank % (n)
Very Poor Poor Fair Good Excellent p
Exercise 0.7% (1) 5.4% (8) 23.5% (35) 52.4% (78) 18.2% (27) 0.21 Weight loss 1.0% (1) 8.7% (9) 25.0% (26) 51.9% (54) 13.5% (14) 0.01 Stress reduction 1.2% (1) 4.6% (4) 27.6% (24) 54.0% (47) 12.6% (11) 0.05 Mental Health
Exercise 1.3% (2) 6.0% (9) 13.4% (20) 47.7% (71) 31.5% (47) 0.12 Weight loss 0.0% (0) 9.7% (10) 15.5% (16) 47.6% (49) 27.2% (28) 0.02 Stress reduction 2.3% (2) 11.5% (10) 25.3% (22) 47.1% (41) 13.8% (12) <0.01
Spiritual Health
Exercise 0.0% (0) 2.7% (4) 20.1% (30) 33.6% (50) 43.6% (65) 0.66
Weight loss 0.0% (0) 4.0% (4) 23.8% (24) 38.6% (39) 33.7% (34) 0.10
Stress reduction 0.0% (0) 7.0% (6) 30.2% (26) 40.7% (35) 22.1% (19) <0.01
Discussion
As noted above, employees’ perceived physical and mental health showed some
significant variation by employee characteristics. Greater proportions of women, for example,
reported lower physical and mental health, and women also reported needing weight loss and
stress reduction more than men did. Moving forward, it would be useful to track these types of
employee characteristics alongside program attendance numbers to determine if people who
expressed needs for specific programs are utilizing them. It would also be useful to track health
status longitudinally alongside program participation to determine if attendance at any specific
program is associated with improved perceived health.
Because the survey allowed employees to check all the programs they were interested in,
instead of limiting them to a certain number, the results should have provided insight into the
types of programs that would be most utilized. There was a significant discrepancy, however,
between the wellness needs employees reported on the survey and actual program utilization.
While 41% of all surveyed employees indicated interest in attending an exercise program, actual
p-value 0.81 0.25 0.03
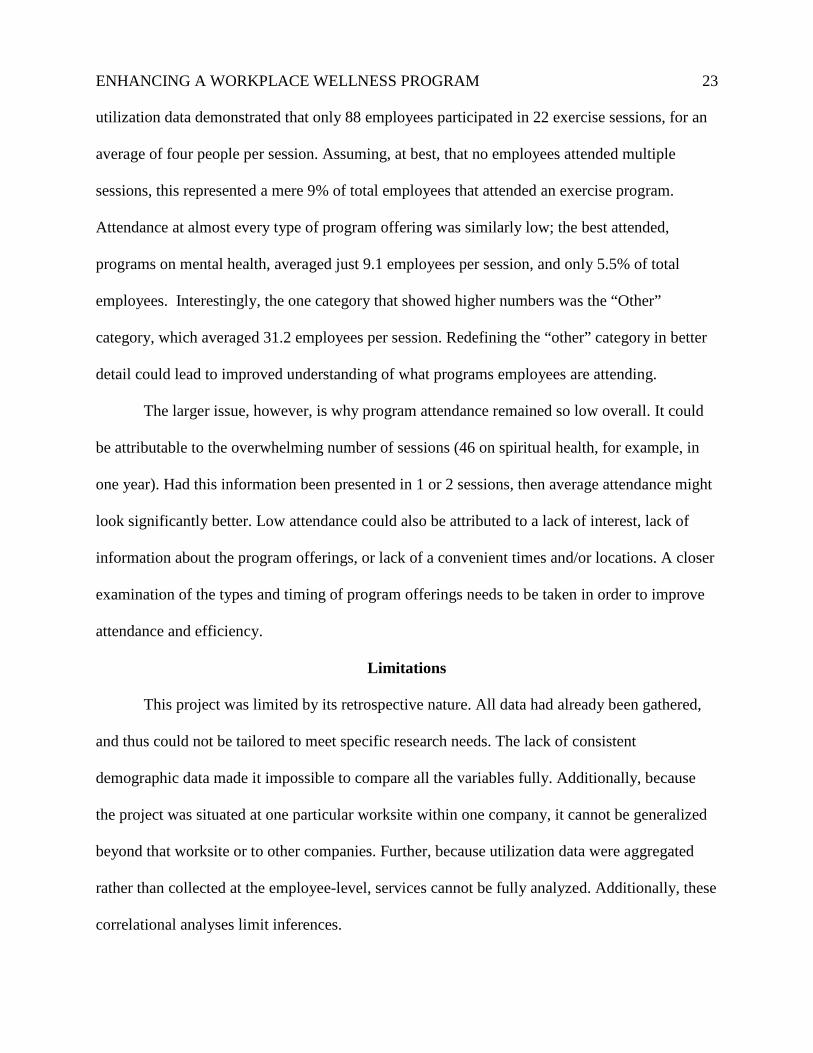
ENHANCING A WORKPLACE WELLNESS PROGRAM 23 utilization data demonstrated that only 88 employees participated in 22 exercise sessions, for an
average of four people per session. Assuming, at best, that no employees attended multiple
sessions, this represented a mere 9% of total employees that attended an exercise program.
Attendance at almost every type of program offering was similarly low; the best attended,
programs on mental health, averaged just 9.1 employees per session, and only 5.5% of total
employees. Interestingly, the one category that showed higher numbers was the “Other”
category, which averaged 31.2 employees per session. Redefining the “other” category in better
detail could lead to improved understanding of what programs employees are attending.
The larger issue, however, is why program attendance remained so low overall. It could
be attributable to the overwhelming number of sessions (46 on spiritual health, for example, in
one year). Had this information been presented in 1 or 2 sessions, then average attendance might
look significantly better. Low attendance could also be attributed to a lack of interest, lack of
information about the program offerings, or lack of a convenient times and/or locations. A closer
examination of the types and timing of program offerings needs to be taken in order to improve
attendance and efficiency.
Limitations
This project was limited by its retrospective nature. All data had already been gathered,
and thus could not be tailored to meet specific research needs. The lack of consistent
demographic data made it impossible to compare all the variables fully. Additionally, because
the project was situated at one particular worksite within one company, it cannot be generalized
beyond that worksite or to other companies. Further, because utilization data were aggregated
rather than collected at the employee-level, services cannot be fully analyzed. Additionally, these
correlational analyses limit inferences.

ENHANCING A WORKPLACE WELLNESS PROGRAM 24
The data analysis itself also had some weaknesses. In using chi-square on such a large
sample size, there was a risk of overpowering the analysis, and finding results that were
statistically significant without being practically useful. In addition, while the descriptive
statistics were very useful for drawing general conclusions about the data, this information did
not provide any intrinsic guidance for future planning.
Future Recommendations
Evidence has demonstrated that coordinated, well-organized wellness programs are the
most successful. While the program studied in this project is managed by a core group of
passionate nurses, it lacks an overarching governance structure. If the sponsoring company is
going to continue to allocate resources to this program, it would benefit from taking a more
proactive approach towards its planning and implementation. In this project, the Workplace
Health Model provided the guidance in comprehensive employee needs assessments, as well as
the development of program objectives, governance, and outcome measures.
In order to guide future planning, data collection and health informatics should be
improved. Ideally, each employee would have a unique identifier that could be used by human
resources and across all HAN programs, encounters, and surveys. This would allow for the
collection of anonymized but employee-specific data, which could be used to better understand
the needs of various employee subgroups. It would also allow for better outcome tracking from
one year to another and would contribute to a better understanding of which types of programs
are the most effective. Program terminology should also be standardized: for example, “mental
health” should be defined in more detail, and then used consistently on the survey, program
offerings, and individual encounters. Each type of program should be operationally defined, and
the “other” category should be broken into more detailed parts.

ENHANCING A WORKPLACE WELLNESS PROGRAM 25
While surveyed employees expressed the desire for a variety of wellness programs, that
desire did not appear to translate to program attendance. A closer look should be taken at when
and where programs are offered, as well as how they are promoted. Focus group interviews
could provide insight into these discrepancies. Based on these findings, expansion of current
offerings is not recommended, despite the expressed interest in certain types of programs. As
noted previously, many programs were offered frequently, but had low attendance rates. It may
be beneficial to offer fewer sessions of each program type, while making it clear that all concerns
can still be addressed during individual nurse encounters.
Additionally, certain wellness needs can be at least partially addressed without the
addition of new programming. Previous studies have demonstrated the effectiveness of
increasing healthy food choices in the workplace as a way to improve employee diet (Lassen et
al., 2011; Backman, Gonzaga, Sugerman, Francis, & Cook, 2011). Ensuring there are multiple
healthy, fresh food options available to employees during work hours could be a way to address
concerns about weight, nutrition, and general health in lieu of offering a more formal program.
Finally, while assessing employee needs is the first step in strengthening the wellness
program, the planning and management portion of the Workplace Health Model should be
revisited, and used to develop a more comprehensive, coordinated approach to program
development at the corporate level.
Conclusion
Analysis of employee surveys showed employee interest in a broad variety of wellness
programs. Exercise programming was desired by one-quarter of employee respondents, across all
demographic categories. Weight loss and stress reduction were also frequently requested,
particularly by women and management. Unfortunately, historical utilization trends showed poor

ENHANCING A WORKPLACE WELLNESS PROGRAM 26 attendance across almost all program types. As the program moves forward, it will be important
to continue to develop meaningful offerings targeting specific employee concerns. Further
evaluation is needed to determine why certain programs are poorly attended, and how they need
to be adapted. Implementing a more comprehensive, organized approach, including the use of
advanced data collection and informatics, will improve program performance and allow the
HAN program to best meet employee needs.

ENHANCING A WORKPLACE WELLNESS PROGRAM 27
References
Backman, D., Gonzaga, G., Sugerman, S., Francis, D., & Cook, S. (2011). Effect of fresh fruit
availability at worksites on the fruit and vegetable consumption of low-wage employees.
J Nutr Educ Behav. 43(2):S113-21. doi: 10.1016/j.jneb.2011.04.003.
Baxter, S., Sanderson, K., Venn, A. J., Blizzard, C. L., & Palmer, A. J. (2014). The relationship
between return on investment and quality of study methodology in workplace health
promotion programs. Am J Health Promot, 28(6), 347-363. doi:10.4278/ajhp.130731-
LIT-395
Dement, J. M., Epling, C., Joyner, J., & Cavanaugh, K. (2015). Impacts of Workplace Health
Promotion and Wellness Programs on Health Care Utilization and Costs: Results from an
academic workplace. J Occup Environ Med, 57(11), 1159-1169.
doi:10.1097/JOM.0000000000000555
Hammerback, K., Hannon, P.A., Harris, J.R., Clegg-Thorp, C., Kohn, M., & Parrish, A. (2015).
Perspectives on workplace health promotion among employees in low-wage industries.
Am J Health Promot, 29(6), 384–92. doi:10.4278/ajhp.130924-QUAL-495
Hannon, P.A., Hammerback, K., Garson, G., Harris, J.R., & Sopher, C.J. (2012). Stakeholder
perspectives on workplace health promotion: a qualitative study of midsized employers in
low-wage industries. Am J Health Promot, 27(2), 103-110. doi: 10.4278/ajhp.110204-
QUAL-51.
Korshøj, M., Ravn, M. H., Holtermann, A., Hansen, Å. M., & Krustrup, P. (2016). Aerobic
exercise reduces biomarkers related to cardiovascular risk among cleaners: effects of a
worksite intervention RCT. International Archives of Occupational and Environmental
Health, 89(2), 239-249. doi:10.1007/s00420-015-1067-5

ENHANCING A WORKPLACE WELLNESS PROGRAM 28 Kramer, M. K., Molenaar, D. M., Arena, V. C., Venditti, E. M., Meehan, R. J., Miller, R. G., . . .
Kriska, A. M. (2015). Improving employee health: evaluation of a worksite lifestyle
change program to decrease risk factors for diabetes and cardiovascular disease. J Occup
Environ Med, 57(3), 284-291. doi:10.1097/JOM.0000000000000350
Lassen, A.D., Thorsen, A.V., Sommer, H.M., Fagt, S., Trolle, E., Biltoft-Jensen, A., & Tetens, I.
(2011). Improving the diet of employees at blue-collar worksites: Results from the ‘Food
at Work’ intervention study. Public Health Nutr, 14(6), 965-974. doi:
10.1017/S1368980010003447
Lerner, D., Rodday, A.M., Cohen, J.T, & Rogers, W. (2013). A systematic review of the
evidence concerning the economic impact of employee-focused health promotion and
wellness programs. J Occup Environ Med, 55(2), 209-222. doi:
10.1097/JON.0b013e3182728d3c
Light, E. M., Kline, A. S., Drosky, M. A., & Chapman, L. S. (2015). Economic analysis of the
return-on-investment of a worksite wellness program for a large multistate retail grocery
organization. J Occup Environ Med, 57(8), 882-892.
doi:10.1097/JOM.0000000000000486
Mercer. (2015). National survey of employer sponsored health programs: 2014 report. Retrieved
from https://www.imercer.com/products/US-national-health-plan-survey.aspx
Musich, S., McCalister, T., Wang, S., & Hawkins, K. (2015). An evaluation of the Well at Dell
health management program: health risk change and financial return on investment. Am J
Health Promot, 29(3), 147-157. doi:10.4278/ajhp.131115-QUAN-582
O'Donnell, M. P. (2015). What is the ROI for workplace health promotion? It really does
depend, and that's the point. Am J Health Promot, 29(3), v-viii. doi:10.4278/ajhp.29.3.v

ENHANCING A WORKPLACE WELLNESS PROGRAM 29 Rouseff, M., Aneni, E. C., Guzman, H., Das, S., Brown, D., Osondu, C. U., . . . Nasir, K. (2016).
One-year outcomes of an intense workplace cardio-metabolic risk reduction program
among high-risk employees: The My Unlimited Potential. Obesity (Silver Spring), 24(1),
71-78. doi:10.1002/oby.21324
Sherman, B. W., & Fabius, R. J. (2012). Quantifying the value of worksite clinic
nonoccupational health care services: a critical analysis and review of the literature. J
Occup Environ Med, 54(4), 394-403. doi:10.1097/JOM.0b013e31824b2157
Stiehl, E., Shivaprakash, N., Thatcher, E., Ornelas, I. J., Kneipp, S., Baron, S. L., & Muramatsu,
N. (2017). Worksite health promotion for low-wage workers: A scoping literature review.
Am J Health Promot, 32(2), 359-373. doi:10.1177/0890117117728607
US Department of Health and Human Services, Centers for Disease Control and Prevention.
(2016). Workplace Health Model. Retrieved from
https://www.cdc.gov/workplacehealthpromotion/model/index.html
US. Department of Labor: Bureau of Labor Statistics. (2015). American Time Use Survey.
Retrieved from http://www.bls.gov/tus/charts/
Volk, J. & Corlette, S. (2012). Premium incentives to drive wellness in the workplace.
Washington, DC: Georgetown University Health Policy Institute.
Weinhold, K. R., Miller, C. K., Marrero, D. G., Nagaraja, H. N., Focht, B. C., & Gascon, G. M.
(2015). A randomized controlled trial translating the diabetes prevention program to a
university worksite, Ohio, 2012-2014. Prev Chronic Dis, 12, E210.
doi:10.5888/pcd12.150301

ENHANCING A WORKPLACE WELLNESS PROGRAM 30
Appendix A Employee Survey
Please check the appropriate spaces (demographic data – optional) Gender: ____Male ____Female Age: ____0-20 ____21-40 ____41-64 ____65+ Marital status: ____Single ____Married ____Widowed ____Separated/Divorced Do you have a child under 18? ____No ____Yes Are you currently covered by health insurance? ____No ____Yes County of residence: ____DeKalb ____Gwinnett ____Other
Did any of the following keep you from obtaining health care in the past 12 months?
____ Lack of transportation ____Didn’t know where to go for care ____Cost of care too high ____Don’t have a family doctor ____Don’t like doctors ____Afraid to go to a doctor ____No insurance
Please rate each aspect of your current health status: Physical health: ____Excellent ____Good ____Fair ____Poor ____Very poor Mental health: ____Excellent ____Good ____Fair ____Poor ____Very poor Spiritual health: ____Excellent ____Good ____Fair ____Poor ____Very poor Education classes about health and lifestyle management will be offered. Please check any/all topics that interest you enough that you will attend a program.
____Exercise ____Smoking cessation ____Diabetes ____Driving safety ____Women’s health issues ____AIDS/HIV ____Pregnancy ____Child abuse prevention ____Caring for aging parents ____Setting goals/priorities ____How faith/health connect ____Grief ____Stress reduction ____STI’s ____Mental health ____Autism ____Gang violence ____Assisted living ____Relationships ____Sign language
____Weight loss ____Heart disease ____Anger management ____High blood pressure ____Men’s health issues ____CPR/First aid ____Drug/alcohol dependence ____End of life issues ____Caring for disabled person ____Domestic violence ____Eye problems ____Osteoporosis ____High cholesterol ____Chronic pain ____Self defense ____PTSD ____Hospice ____Computer skills ____Managing a bank account
____Time management ____Stroke ____Alzheimer’s disease ____Cancer ____Nutrition/healthy eating ____Parenting ____Dealing with divorce ____Depression ____Home safety ____Communication ____Arthritis ____Organ donation ____Eating disorders ____Immunizations ____Relaxation/meditation ____Adoption ____Sports injuries ____Dental care ____Completing tax forms

ENHANCING A WORKPLACE WELLNESS PROGRAM 31
Appendix B
Wellness Needs by Number and Percentage of Survey Respondents
Wellness Need # Responses % of Respondents exercise 150 37.3% weight loss 107 26.6% stress reduction 87 21.6% sign language 77 19.2% relationships 64 15.9% self defense 61 15.2% time management 61 15.2% CPR/first aid 58 14.4% relaxation/meditation 53 13.2% women's health 52 12.9% managing a bank account 50 12.4% computer skills 45 11.2% mental health 40 10.0% depression 39 9.7% setting goals/priorities 36 9.0% caring for aging parents 34 8.5% nutrition 33 8.2% communication 33 8.2% completing tax returns 30 7.5% dental care 28 7.0% anger management 27 6.7% HTN 26 6.5% men's health 25 6.2% faith/health 23 5.7% pregnancy 22 5.5% diabetes 20 5.0% driving safety 19 4.7% sports injuries 19 4.7% adoption 19 4.7% heart disease 15 3.7% grief 15 3.7% child abuse prevention 15 3.7% home safety 14 3.5% end of life issues 13 3.2% arthritis 13 3.2% caring for disabled person 12 3.0% cancer 12 3.0% eating disorders 12 3.0% HIV/AIDS 11 2.7%

ENHANCING A WORKPLACE WELLNESS PROGRAM 32
high cholesterol 11 2.7% parenting 11 2.7% smoking cessation 10 2.5% STIs 10 2.5% eye problems 10 2.5% autism 9 2.2% PTSD 9 2.2% Alzheimer’s 7 1.7% dealing with divorce 7 1.7% gang violence 7 1.7% domestic violence 7 1.7% chronic pain 6 1.5% organ donation 6 1.5% immunizations 5 1.2% drug/alcohol dependence 5 1.2% assisted living 4 1.0% stroke 3 0.7% osteoporosis 2 0.5% hospice 1 0.2%