Assessing Bond Market Integration in Asia
35
Working Paper 10/2007 21 June 2007 ASSESSING BOND MARKET INTEGRATION IN ASIA Prepared by Ip-wing Yu, Laurence Fung and Chi-sang Tam 1 Research Department Abstract Development of the local bond markets has been a top priority for financial reforms in the region after the Asian financial crisis. Various initiatives have also been taken to foster the development of the regional bond market. This paper looks into the degree of integration of sovereign (government) bond markets in Asia. It provides a survey of indicators and measures to monitor the development, measure progress and assess the state of bond market integration in the region. Our empirical results broadly show that there is only weak bond market integration in the region and very little progress has taken place since 2003. The apparent lack of progress may be due to the “local” or “idiosyncratic” factors in some Asian economies. JEL Classification Numbers: C13; C22; F36; G15 Keywords: Financial integration; Kalman filter; Cointegration; Synchronisation; Dynamic correlation Author’s E-Mail Address: [email protected]; [email protected]; [email protected] 1 The authors are grateful to Hans Genberg and Cho-hoi Hui for their suggestions and comments. The views and analysis expressed in this paper are those of the authors, and do not necessarily represent the views of the Hong Kong Monetary Authority.
Transcript of Assessing Bond Market Integration in Asia
Working Paper 10/2007 21 June 2007
ASSESSING BOND MARKET INTEGRATION IN ASIA
Prepared by Ip-wing Yu, Laurence Fung and Chi-sang Tam1 Research Department
Abstract
Development of the local bond markets has been a top priority for financial reforms in the region after the Asian financial crisis. Various initiatives have also been taken to foster the development of the regional bond market. This paper looks into the degree of integration of sovereign (government) bond markets in Asia. It provides a survey of indicators and measures to monitor the development, measure progress and assess the state of bond market integration in the region. Our empirical results broadly show that there is only weak bond market integration in the region and very little progress has taken place since 2003. The apparent lack of progress may be due to the “local” or “idiosyncratic” factors in some Asian economies. JEL Classification Numbers: C13; C22; F36; G15 Keywords: Financial integration; Kalman filter; Cointegration; Synchronisation; Dynamic correlation Author’s E-Mail Address: [email protected]; [email protected]; [email protected]
1 The authors are grateful to Hans Genberg and Cho-hoi Hui for their suggestions and comments.
The views and analysis expressed in this paper are those of the authors, and do not necessarily represent the views of the Hong Kong Monetary Authority.
- 2 -
Executive Summary: • This study provides a survey of indicators for the purpose of assessing the trend of
bond market integration among ten Asian economies: Japan, Mainland China, Hong Kong, Taiwan, Korea, Singapore, Malaysia, Thailand, Indonesia, and the Philippines. Compared to other measures, these indicators give timely assessment of the extent of integration.
• A well balanced financial system is a key to maintaining financial stability in the
Asian region. Deeper and more integrated bond markets may facilitate risk management, enhance return-risk profiles and provide efficiency gains. Despite the potential benefits and repeated calls for developing broad and deep bond markets, bond markets in Asia are still not well developed and it may hinder the integration process.
• The indicators point to a very limited progress over the years in achieving greater
regional financial integration in the government bond markets. They suggest either stalled or even regressive processes. The results are in line with other alternative measures regarding bond market integration in the region.
The apparent lack of progress in bond market integration may be due to “local” or
“idiosyncratic” factors such as credit or liquidity risks in some economies, as well as the under-development of many local bond markets in the region. It is thus essential for central banks in the region to focus on the development of their domestic bond markets.
- 3 -
I. INTRODUCTION
Since the Asian financial crisis in 1997-1998, economies in the region have made efforts to diversify their reliance on the banking sector as the main source of funding channel in favour of other financial intermediaries such as equities and bonds. In particular, the development of local bond markets has been a top priority in the financial reform of Asian economies, as a balanced financial system with more funding channels is believed to be one of the keys in maintaining financial stability. Internationally, various initiatives have also been in place to foster the development of a regional bond market. These initiatives are part of the campaign to promote cooperation among the Asian governments in the financial market development.2
With increasing intra-regional trade and cross-border direct investment in
Asia, there is a question of whether cross-country capital market integration in the region will follow. Understanding the extent of financial integration and monitoring its progress in the region is important for Asian central banks. On the one hand, financial integration may promote financial development and hence enhance economic growth in the region.3 On the other hand, a highly integrated financial market may facilitate the transmission of the impacts of monetary policies from one economy to the others. At times of financial crisis, this contagion may have important consequence on the financial stability. Therefore, it is essential to have appropriate measures for the assessment and close monitoring of the progress of financial market integration.4 This study looks into the integration of sovereign (government) bond markets in Asia and provides a survey of indicators and measures to monitor the development, measure progress and assess the status of bond market integration in the region.5 In particular, it attempts to address the following questions:
• To what extent are the bond markets in the region integrated? • What is the evolution and the current level of bond market integration? Is it
progressing, at a standstill, or even regressing? • What is the relative importance of regional (within Asia) vs. global (mainly
the US) factors in intra-regional bond market integration?6 2 Two main initiatives relating to the development of regional bond market include the Asian Bond Fund
(ABF) established by the eleven members of the Executives’ Meeting of East Asia-Pacific Central Bank (EMEAP) and the Asian Bond Market Initiative (ABMI) by Asian Plus Three (APT) economies. See Park and Park (2005).
3 As De Brouwer and Corbett (2005) pointed out, financial market integration creates a set of powerful internal pressure for financial reform and development, through encouragement of further financial liberalisation and upgrading of financial capacity.
4 The informative value of these integration measures or indicators is highlighted by the publications from the European Central Bank (ECB) and the European Commission (EC) as an on-going effort to monitor the degree of financial integration in the Euro area. See ECB (2005) and EC (2005).
5 See Yu et al. (2007) for a study on the equity market integration in Asia. 6 The focus of this paper is to provide various indicators for assessing the trend and the progress of bond
market integration in the region. The policy implications with regard to a fully integrated bond market are not discussed in this paper. For a discussion of the policy implications from integration, see De Brouwer and Corbett (2005) and Park and Park (2005).
- 4 -
The remainder of this paper is organised as follows. In Section II,
we present the various integration indicators. Data used in the study and some preliminary analyses of the data series are given in Section III. Estimation results from the integration indicators are presented and their behaviours are examined in Section IV. Section V provides a summary and discussion. II. INDICATORS OF BOND MARKET INTEGRATION IN ASIA
Unlike equity market integration, there are few empirical works on bond market integration in Asia. The study by Danareksa Research Institute (2004) uses the 10-year government bond benchmark yield to examine the status of government bond market integration in the ASEAN+3 group of economies, and finds no significant convergence pattern. It concludes that the underdeveloped bond markets in most East Asian countries are mainly responsible for the slow convergence in the bond market yield in the region. Asian Development Bank (2005) notes that cross-country differentials in bond yields have been declining. Although these differentials remain significantly high, there is a sign of increased co-movement in bond yields, suggesting that bond market integration is making progress. Using data from the international bond market and the international syndicated loan market, McCauley et al. (2002) show that East Asian investors and banks have on average allocated half of the funds in bonds underwritten and loans syndicated for borrowers in East Asia. Based on this measure, they assert that the financial markets of East Asia are more integrated than what is often suggested.
To provide a better understanding of the direction of bond market integration in Asia, this study presents a survey of price-based indicators derived from high frequency data for the assessment. These indicators are either statistical measures or derived from models and they provide timely measure for regular monitoring purposes.7 Some of these indicators follow the approach of the European Central Bank (see ECB (2005)) while others make use of the recent advances in the literature in measuring the time-varying degree of integration. It is worth noting that financial market integration has different dimensions and its definition varies depending on the focus of the study. For instance, the bond return dispersion indicator utilises the idea of return convergence as a measure of integration, whereas the correlation analysis uses the extent of return co-movement as an indication of the degree of integration. Given that the derivations of these indicators are subject to technical limitations and model assumptions, and that the dimensions in which these indicators are intended to measure are different, the empirical results obtained from them may give somewhat different assessment as to the extent and the speed of bond market integration in the region. Therefore, these indicators should be 7 There is no universal definition on financial integration. In the literature, two types of measures are
commonly used to assess the degree of financial integration: price-based measures and quantity-based measures. See Adam et al. (2002) and Baele et al. (2003) for more details.

- 5 -
interpreted with caution and taken as indicative but not conclusive evidences on assessing the bond market integration. If possible, they should be supplemented by other integration measures like the cross-border holdings of Asian debt securities in regulator’s monitoring work.8 Table 1 summarises the indicators in the study.9 Detailed discussions on the methodologies of constructing these indicators and their interpretation are presented in the Appendix.
8 These alternative measures may not be as timely and frequent as the indicators presented in this paper. 9 It should be noted that most of these aggregate indicators are obtained by taking the simple average of
the indicators estimated for individual economies. However, as the starting dates of the data in this study are different (and so are their estimated indicators), the number of individual indicators being averaged will increase over time. For instance, government bond yield data were not available in Indonesia before January 2003. Thus, the estimated indicators for Indonesia are not included in the aggregation until January 2003. In this regard, the interpretation of the general trend of these aggregate indicators should be taken with caution.

- 6 -
Table 1. Summary of Integration Indicators for Asian Government Bond Markets
Method Indicator Indication of market integration
a. Cross-country bond return dispersion and differential
Return dispersion and maximum-minimum return differential
Lower return dispersion and smaller return differential imply higher return convergence
b. Haldane and Hall (1991) Kalman filter method
Time-varying β estimated via Kalman filter
The average β moves towards zero indicates an increasing sensitivity to regional influence
c. Dynamic cointegration analysis
Rolling estimates of the standardised trace statistics and the number of cointegrating vectors
Standardised trace statistic consistently greater than one indicates the presence of a long-run relationship between bond markets
d. Market cycle synchronisation
Rolling concordance index (RCI)
An upward trend in the RCI signals increased market concordance
e. Beta convergence of bond return
Conditional beta estimates from rolling GARCH estimations
The larger the estimated conditional beta towards one, the greater the market integration
f. Dynamic conditional correlation (DCC) model
Time-varying correlation estimated from the DCC model
The higher the correlation, the larger the return co-movement between markets and the greater the market integration
Notes: The indicators derived from the cross-country bond return dispersion and differential analysis, the beta convergence of bond return and the dynamic conditional correlation model are based on the holding period returns for government bond (bond returns) as discussed in Shiller (1979). For the Haldane and Hall Kalman filter method, the dynamic cointegration analysis and the market cycle synchronisation, the indicators are based on the bond indices which are calculated from the bond return series.
III. THE DATA AND THEIR TIME SERIES PROPERTIES Ten economies in the Asian region are covered in this study, namely Japan, the Mainland, Hong Kong, Taiwan, Korea, Singapore, Malaysia, Thailand, Indonesia, and the Philippines. In addition to aggregate indicator for all these economies, indicators for regional blocs are also constructed. These regional blocs include:
- 7 -
a. Greater China region: the Mainland, Hong Kong and Taiwan b. Four-dragon bloc: Hong Kong, Taiwan, Korea and Singapore c. Asian emerging region: Malaysia, Thailand, Indonesia and the Philippines
Government bond yields with maturity of 2-year, 5-year and 10-year from these ten Asian economies are examined.10 As government bond issuances vary between economies, each bond yield series has different starting dates and maturities (see Table 2). The US Treasury Bond yields of corresponding maturities are used as proxies for world influence (or common news factor). The regional influence proxies of different maturities will be the unweighted cross-country government bond return average of the corresponding maturities, or the JP Morgan EMBIG Asia Sovereign return. 11 The derivations of integration indicators are based on the holding period returns (bond returns) in terms of the US dollar.12, 13 Similar to other studies in the literature, most of the indicators derived in this paper are based on daily returns.14 The use of high frequency data allows us to assess the integration process in a more timely manner.
10 For Hong Kong, bond yields are those of Exchange Fund Notes (EFN) of corresponding maturities. 11 The choice of regional proxy is different in different integration measures. For the Haldane and Hall
Kalman filter method and the market cycle synchronisation, the proxy is the unweighted cross-country government bond index average of the corresponding maturities. For each bond market, this regional benchmark bond return proxy is calculated as the average cross-country bond return of the corresponding maturity, excluding the bond return of that market itself. For instance, when calculating the 10-year regional benchmark bond return for Hong Kong, the 10-year EFN return of Hong Kong is excluded from the cross-country average calculation. On the other hand, the JP Morgan EMBIG Asia Sovereign return is used as the regional bond market proxy for all economies for the estimations of the dynamic conditional correlations for the 10-year bond returns. With a common regional bond market proxy, it will reduce the number of data series used in the estimations and thus make the estimation process more efficient.
12 In this study, the bond return is approximated by the daily holding period return for a government bond based on Shiller (1979). For bonds selling at or near par value, Shiller suggests an approximate expression for the n-period holding period return )(n
tH ,
where )1/(1),1/()1(),1/()( 11)1(1
)()( RRRH nnn
nntn
nt
nt +=−−=−−= −−−
+ γγγγγγγ , )(ntR is the yield
to maturity and R is the mean value of the yield to maturity. Once the local currency bond return is calculated, it is expressed in terms of the US dollar by dividing the local currency bond return by the daily percentage change in the local currency per US dollar exchange rate. The indicators derived from the cross-country bond return dispersion and differential analysis, the beta convergence of bond return and the dynamic conditional correlation model are based on the bond returns. For the Haldane and Hall Kalman filter method, the dynamic cointegration analysis and the market cycle synchronisation, the indicators are based on the bond indices which are calculated from the bond return series.
13 In the integration literature, it is common to express the asset returns in terms of the same currency. In fact, the exchange rate volatility has little impact on the results of the integration indicators in this study. In the preliminary analysis, we use the bond yields (in local currency terms) to calculate the indicators. When comparing the results presented in this paper with those from the preliminary analysis, their general trends are very similar and the actual levels of the indicators between the two results are slightly different,
14 Except for the estimation of the dynamic conditional correlation indicator where the bond return is for one week, other indicators are derived based on the one-day bond return.
- 8 -
Table 2. Government Bond Yields
Bond yield data starting date
2-year 5-year 10-year
Hong Kong1, Japan, Korea2, Malaysia, the Philippines and the US Treasury bond
Jan-96 Jan-96 Oct-96
China NA May-04 May-01 Taiwan Jul-02 Jun-02 Oct-96 Singapore Jul-97 Jan-96 Jun-98 Thailand Sep-99 Sep-99 Oct-96 Indonesia Jan-03 Jan-03 Jul-03 JP Morgan EMBIG Asia Sovereign yield Dec-97
Notes: 1. Yields are those of Exchange Fund Notes of corresponding maturities. 2. 3-year government bond yield in Korea is used instead of 2-year.
Sources: Bloomberg, CEIC, Datastream and IMF. To conduct cointegration analysis, the non-stationary property of the data series in question must be established. Table 3 shows the Phillips-Perron (PP) test to determine the unit root property of the government bond indices. Furthermore, Tables 4 and 5 present, respectively, the Ljung-Box test results for serial correlation on the squared level of the daily and weekly government bond return series.15
Table 3. Stationarity Test of Government Bond Indices
PP unit root test
On the level On the first difference
2-year 5-year 10-year 2-year 5-year 10-year
The Mainland - -0.68 -1.43 - -39.80* -36.04*
Hong Kong -1.06 -0.96 -0.91 -50.76* -51.84* -48.40*
Taiwan -1.94 -2.46 -0.21 -37.63* -38.27* -52.18*
Japan -2.44 -2.14 -2.14 -54.62* -53.42* -49.96*
Korea 0.05 0.12 0.14 -48.29* -47.94* -46.78*
Singapore -2.11 -1.48 -1.39 -45.01* -49.21* -44.63*
Malaysia -0.84 -0.68 -0.53 -46.97* -47.10* -45.52*
Thailand -1.51 -1.87 -0.86 -39.86* -34.06* -50.00*
Indonesia -2.36 -2.58 -1.73 -31.00* -29.42* -30.06*
The Philippines -1.32 -0.75 -0.59 -46.79* -44.24* -53.43*
Notes: * indicates significance at the 5% confidence level. The critical value at the 5% level of the PP test is -2.87.
15 Weekly bond returns are derived from weekly bond yield series. See Footnote 12 for the derivation of
the bond return.
- 9 -
The results of the PP test in Table 3 show that all benchmark government bond indices are non-stationary in the level (the null hypothesis of the presence of unit root cannot be rejected) but stationary in the first difference. Given that these bond indices possess unit roots, the Johansen (1988) procedure can be applied, based on a rolling window with constant sample size, to consider whether the individually non-stationary bond indices are cointegrating. The Ljung-Box tests for serial correlation, as shown by the Q statistics in Table 4, provide evidence of serial correlation in the squared levels of the daily bond return series. Thus, when deriving the beta convergence indicator, Equation (4) in the Appendix is estimated under a GARCH(1,1) specification for each government bond return series.
Table 4. Serial Correlation Tests of Daily Government Bond Returns
Ljung-Box Q(8) test statistics
2-year 5-year 10-year
The Mainland - 138.01* 35.76*
Hong Kong 207.71* 152.31* 147.87*
Taiwan 163.63* 217.77* 382.23*
Japan 230.15* 192.53* 192.45*
Korea 1,610.30* 1,782.8* 1,838.10*
Singapore 456.45* 443.97* 244.65*
Malaysia 1,058.30* 1,007.60* 852.62*
Thailand 237.57* 172.44* 113.82*
Indonesia 48.76* 50.03* 57.13*
The Philippines 427.07* 580.01* 443.36*
The US 608.12* 795.09* 199.81*
Notes: * indicates significance at the 5% confidence level. Q(8) is the Ljung-Box statistics based on the squared level of the daily bond return up to the 8th order. The statistics are asymptotically distributed as 2χ (8). The critical value of 2χ (8) at the 5% level is 15.5.
The Ljung-Box test statistics in Table 5 show that there are serial correlations in the squared levels of most of the weekly bond return series. Therefore, univariate GARCH models are first estimated for each bond return series, and their standardised residuals will then be used in the DCC model in Equations (5) and (6), as shown in the Appendix, to estimate the time-varying condition correlations between bond returns.16 16 In the analysis that followed, only the weekly bond returns from government bonds with 5 years and
10 years of maturity are estimated using the DCC model. Thus, Table 5 only presents the Ljung-Box (Q) test statistics of these two bond return series.
- 10 -
Table 5. Serial Correlation Tests of Weekly Government Bond Returns
Ljung-Box Q(4) test statistics
5-year 10-year
The Mainland 27.19* 5.38
Hong Kong 27.55* 30.86*
Taiwan 18.88* 23.73*
Japan 3.36 4.08
Korea 281.00* 217.90*
Singapore 155.78* 27.16*
Malaysia 115.50* 98.54*
Thailand 5.34 131.54*
Indonesia 7.83 16.70*
The Philippines 19.88* 35.33*
The US 25.38* 10.25*
Notes: * indicates significance at the 5% confidence level. Q(4) is the Ljung-Box statistics based on the squared level of the weekly bond return up to the 4th order. The statistics are asymptotically distributed as 2χ (4). The critical value of 2χ (4) at the 5% level is 9.49.
IV. ESTIMATION RESULTS AND PRESENTATION OF INTEGRATION INDICATORS a. Cross-country return dispersion
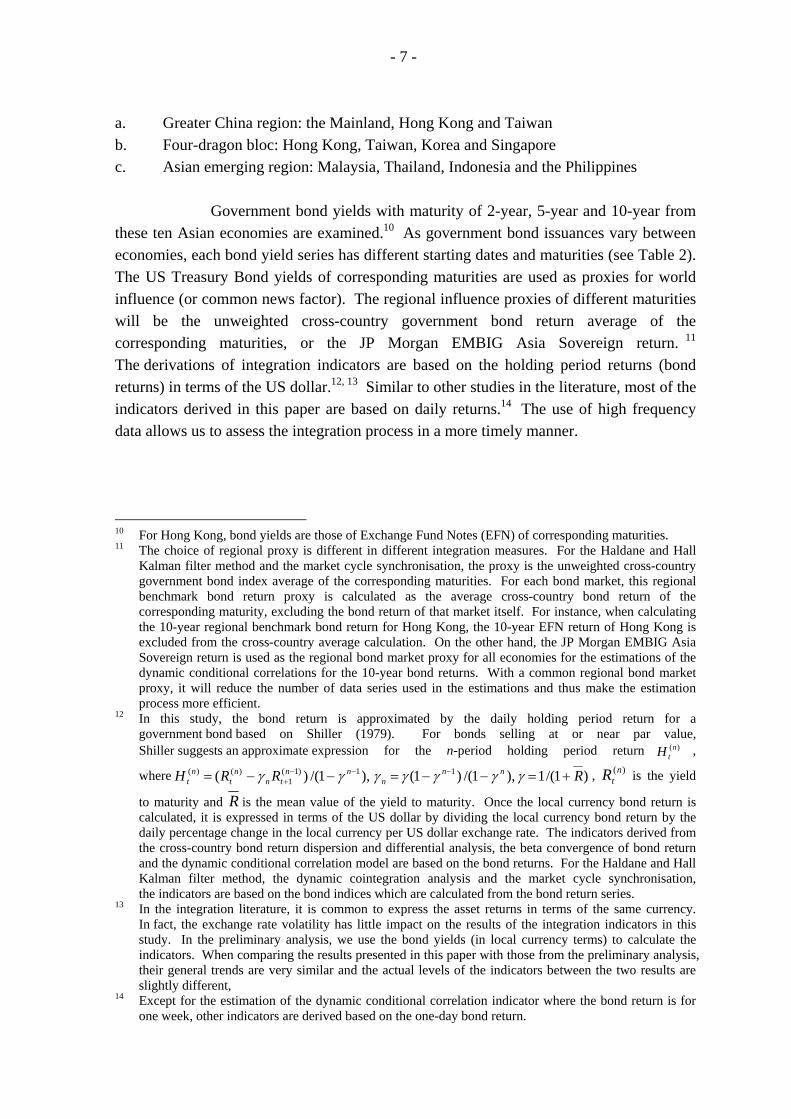
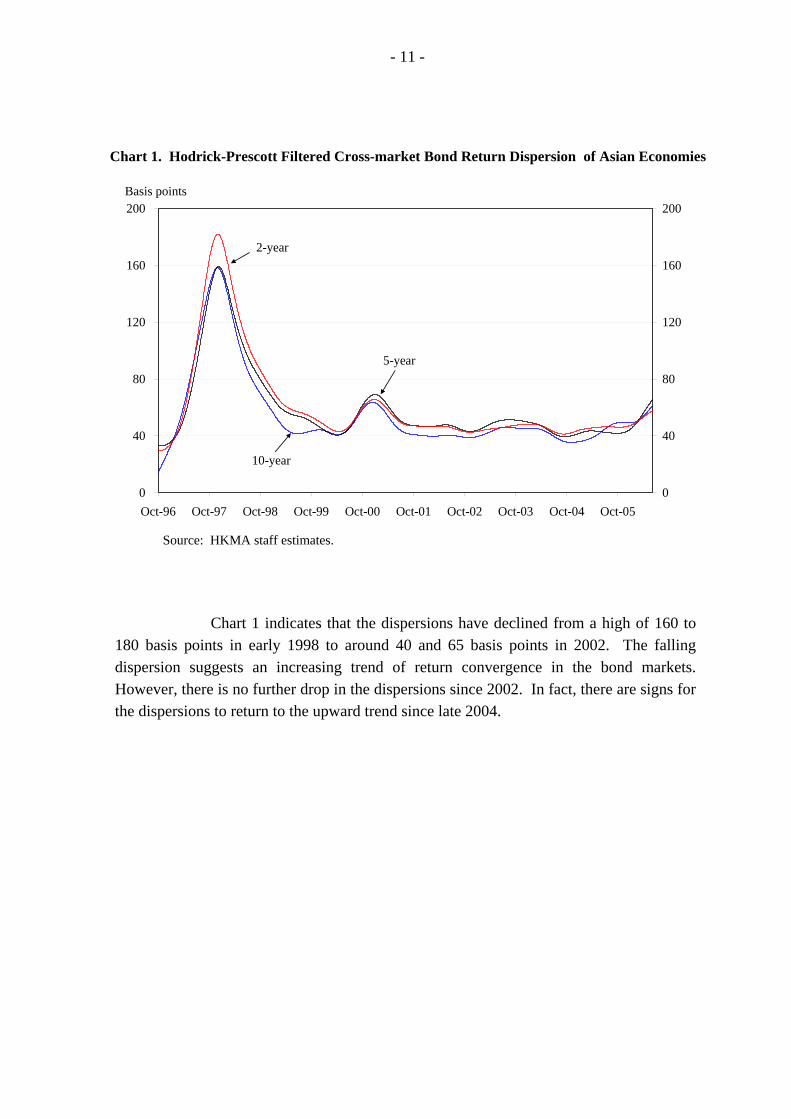
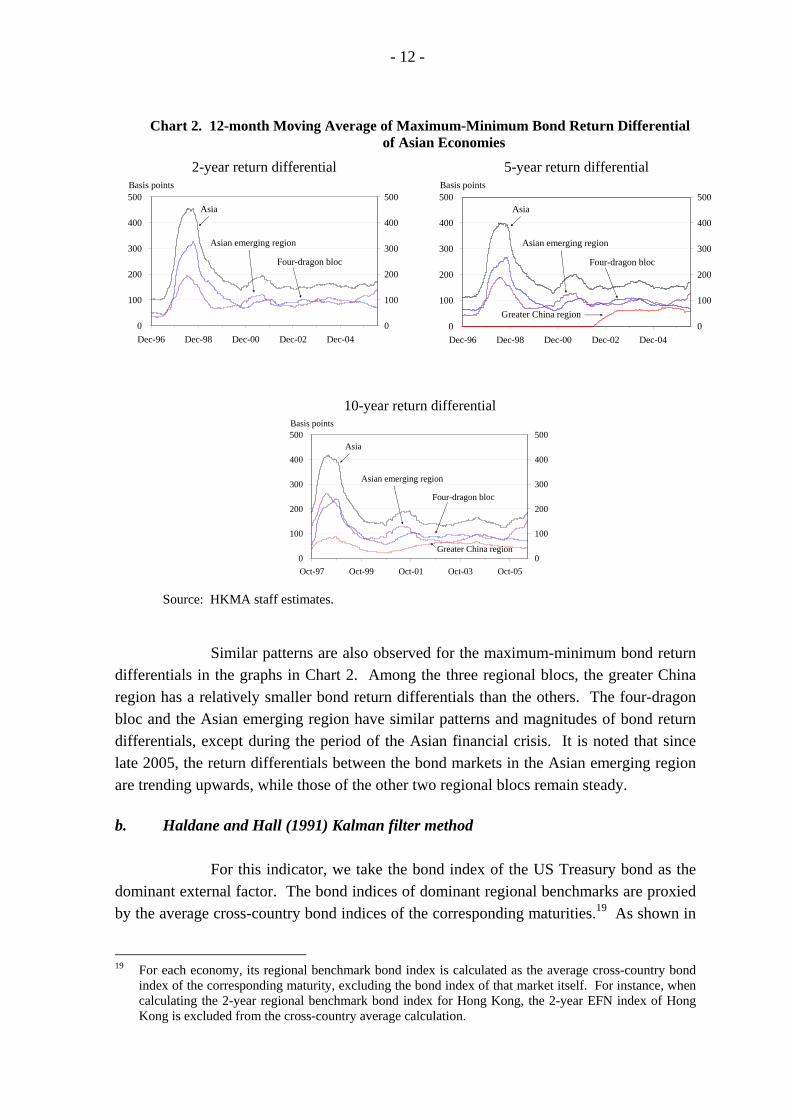
Similar to ECB (2005), the cross-country return dispersion is calculated as the cross-market standard deviation of the daily returns of the ten Asian bond markets of 2-year, 5-year and 10-year maturity respectively. The return dispersion is filtered using the Hodrick-Prescott smoothing technique to reveal the long-term trend of the series.17 A falling return dispersion is taken as an indication of increasing integration and vice versa.18 Chart 1 presents the dispersions for bond returns of 2-year, 5-year and 10-year maturity. The 250-day moving average of maximum-minimum bond return differentials of regional blocs are shown in Chart 2.
17 The daily smoothing parameter of the Hodrick-Prescott filter is 6,812,100, which is set following the
frequency power rule of Ravn and Uhlig (2002) with a power of 2. While a larger parameter number results in more smoothing, we find that the general trend of the filtered return dispersion is not affected by the choice of the smoothing parameter.
18 It is noted that the perceived credit risk or liquidity of the relevant government bonds could be different even in a fully integrated market. In this case, the dispersion or differential may not fall further even when there is an increased integration in the bond markets.
- 11 -
Chart 1. Hodrick-Prescott Filtered Cross-market Bond Return Dispersion of Asian Economies
0
40
80
120
160
200
Oct-96 Oct-97 Oct-98 Oct-99 Oct-00 Oct-01 Oct-02 Oct-03 Oct-04 Oct-050
40
80
120
160
200Basis points
10-year
5-year
2-year
Source: HKMA staff estimates. Chart 1 indicates that the dispersions have declined from a high of 160 to 180 basis points in early 1998 to around 40 and 65 basis points in 2002. The falling dispersion suggests an increasing trend of return convergence in the bond markets. However, there is no further drop in the dispersions since 2002. In fact, there are signs for the dispersions to return to the upward trend since late 2004.
- 12 -
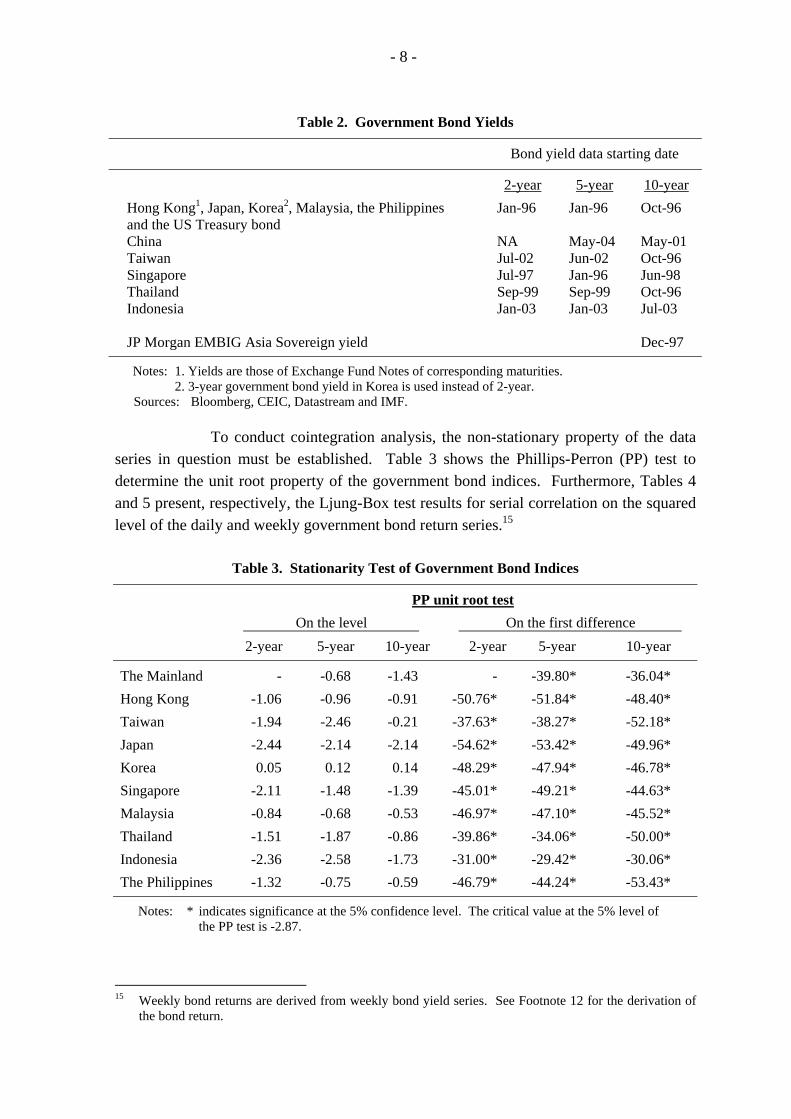
Chart 2. 12-month Moving Average of Maximum-Minimum Bond Return Differential
of Asian Economies
2-year return differential 5-year return differential
0
100
200
300
400
500
Dec-96 Dec-98 Dec-00 Dec-02 Dec-040
100
200
300
400
500Basis points
Asia
Four-dragon bloc
Asian emerging region
0
100
200
300
400
500
Dec-96 Dec-98 Dec-00 Dec-02 Dec-040
100
200
300
400
500Basis points
Asia
Greater China region
Four-dragon bloc
Asian emerging region
10-year return differential
0
100
200
300
400
500
Oct-97 Oct-99 Oct-01 Oct-03 Oct-050
100
200
300
400
500Basis points
Asia
Greater China region
Four-dragon bloc
Asian emerging region
Source: HKMA staff estimates.
Similar patterns are also observed for the maximum-minimum bond return differentials in the graphs in Chart 2. Among the three regional blocs, the greater China region has a relatively smaller bond return differentials than the others. The four-dragon bloc and the Asian emerging region have similar patterns and magnitudes of bond return differentials, except during the period of the Asian financial crisis. It is noted that since late 2005, the return differentials between the bond markets in the Asian emerging region are trending upwards, while those of the other two regional blocs remain steady. b. Haldane and Hall (1991) Kalman filter method For this indicator, we take the bond index of the US Treasury bond as the dominant external factor. The bond indices of dominant regional benchmarks are proxied by the average cross-country bond indices of the corresponding maturities.19 As shown in
19 For each economy, its regional benchmark bond index is calculated as the average cross-country bond
index of the corresponding maturity, excluding the bond index of that market itself. For instance, when calculating the 2-year regional benchmark bond index for Hong Kong, the 2-year EFN index of Hong Kong is excluded from the cross-country average calculation.
- 13 -
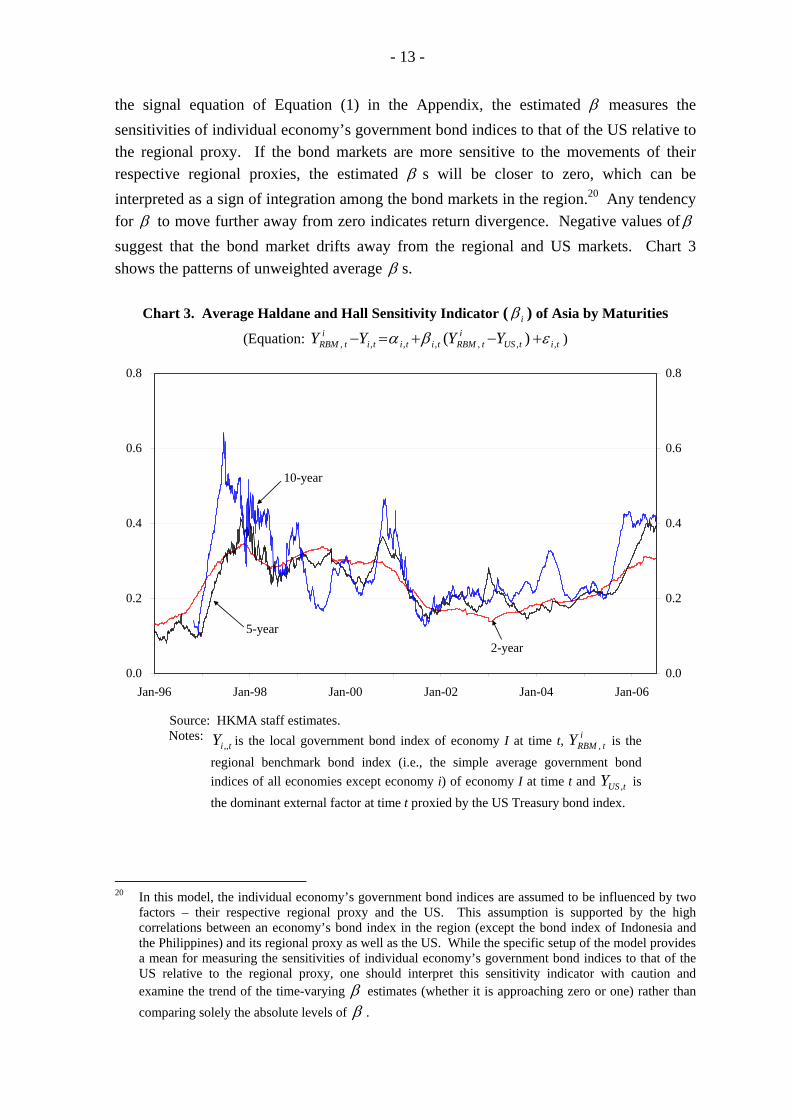
the signal equation of Equation (1) in the Appendix, the estimated β measures the sensitivities of individual economy’s government bond indices to that of the US relative to the regional proxy. If the bond markets are more sensitive to the movements of their respective regional proxies, the estimated β s will be closer to zero, which can be interpreted as a sign of integration among the bond markets in the region.20 Any tendency for β to move further away from zero indicates return divergence. Negative values ofβ suggest that the bond market drifts away from the regional and US markets. Chart 3 shows the patterns of unweighted average β s.
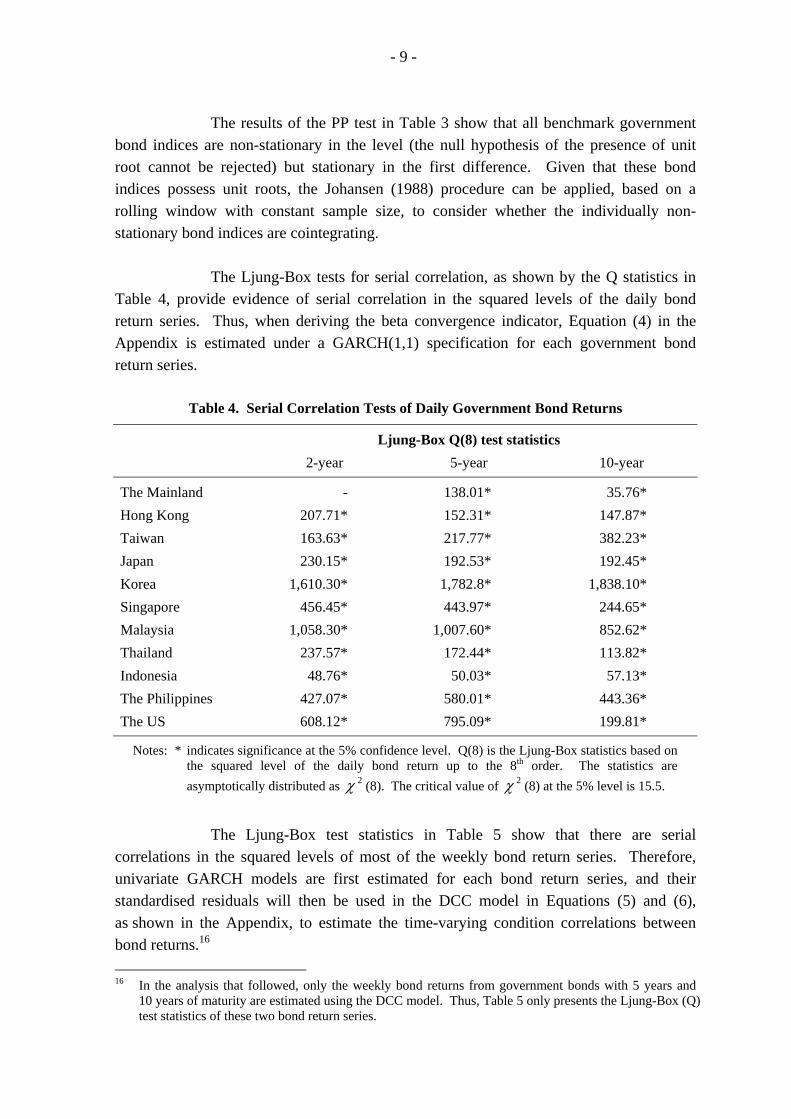
Chart 3. Average Haldane and Hall Sensitivity Indicator ( iβ ) of Asia by Maturities (Equation: titUS
itRBMtititi
itRBM YYYY ,,,,,,, )( εβα +−+=− )
0.0
0.2
0.4
0.6
0.8
Jan-96 Jan-98 Jan-00 Jan-02 Jan-04 Jan-060.0
0.2
0.4
0.6
0.8
10-year
5-year2-year
Source: HKMA staff estimates. Notes:
tiY ,, is the local government bond index of economy I at time t, itRBMY , is the
regional benchmark bond index (i.e., the simple average government bond indices of all economies except economy i) of economy I at time t and tUSY , is the dominant external factor at time t proxied by the US Treasury bond index.
20 In this model, the individual economy’s government bond indices are assumed to be influenced by two
factors – their respective regional proxy and the US. This assumption is supported by the high correlations between an economy’s bond index in the region (except the bond index of Indonesia and the Philippines) and its regional proxy as well as the US. While the specific setup of the model provides a mean for measuring the sensitivities of individual economy’s government bond indices to that of the US relative to the regional proxy, one should interpret this sensitivity indicator with caution and examine the trend of the time-varying β estimates (whether it is approaching zero or one) rather than comparing solely the absolute levels of β .
- 14 -
As shown in Chart 3, the β indicators for different maturities appear to
move in tandem for most of the time. There were several occasions when the indicators showed signs of increasing sensitivities to the regional benchmark bond indices (an indication of integration) as they approached zero. Since 2003, the sensitivity to regional influence, though still dominant, appears to be declining, as the indicators drift away from around 0.2 to about 0.3 and 0.4 in 2006.21
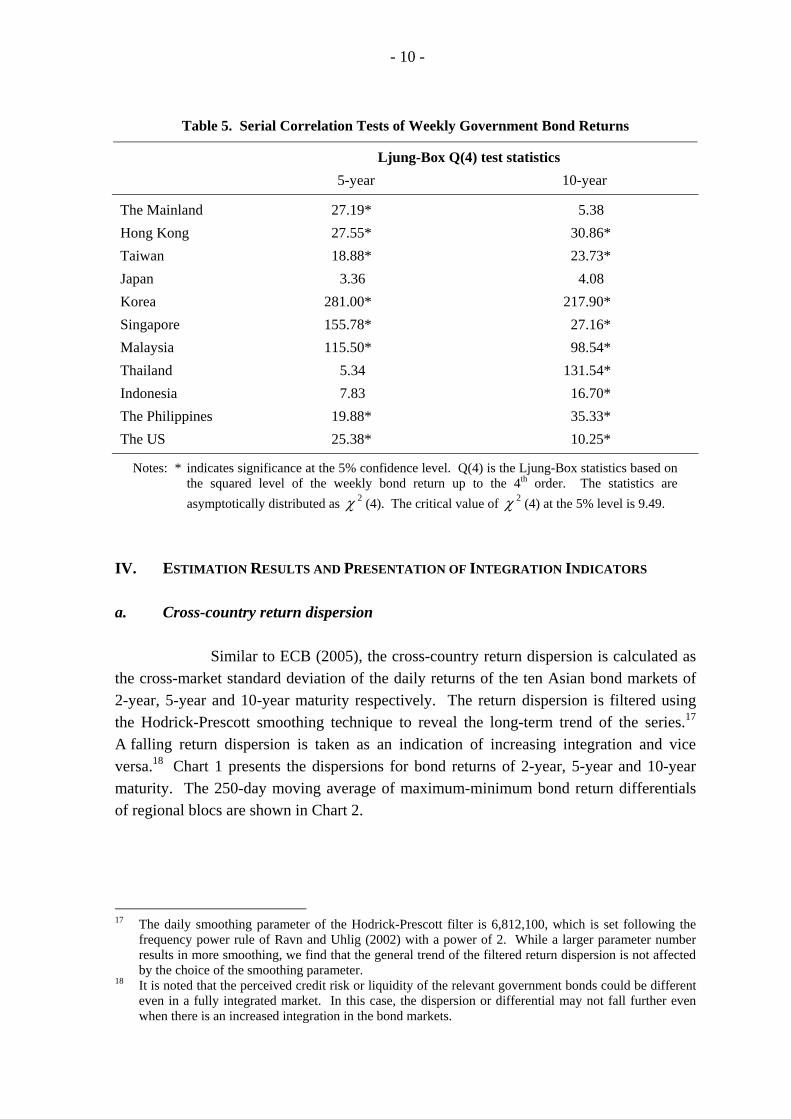
Chart 4. Average Haldane and Hall Sensitivity Indicator ( iβ ) by Regional Blocs 2-year bond 5-year bond
0.0
0.2
0.4
0.6
0.8
1.0
Jan-96 Jan-98 Jan-00 Jan-02 Jan-04 Jan-060.0
0.2
0.4
0.6
0.8
1.0
Four-dragonbloc Asian emerging
region
0.0
0.2
0.4
0.6
0.8
1.0
Jan-96 Jan-98 Jan-00 Jan-02 Jan-04 Jan-060.0
0.2
0.4
0.6
0.8
1.0Greater China
regionFour-dragon
bloc
Asian emergingregion
10-year bond
0.0
0.2
0.4
0.6
0.8
1.0
Oct-96 Oct-98 Oct-00 Oct-02 Oct-040.0
0.2
0.4
0.6
0.8
1.0Greater China
region
Four-dragonbloc
Asian emergingregion
Source: HKMA staff estimates.
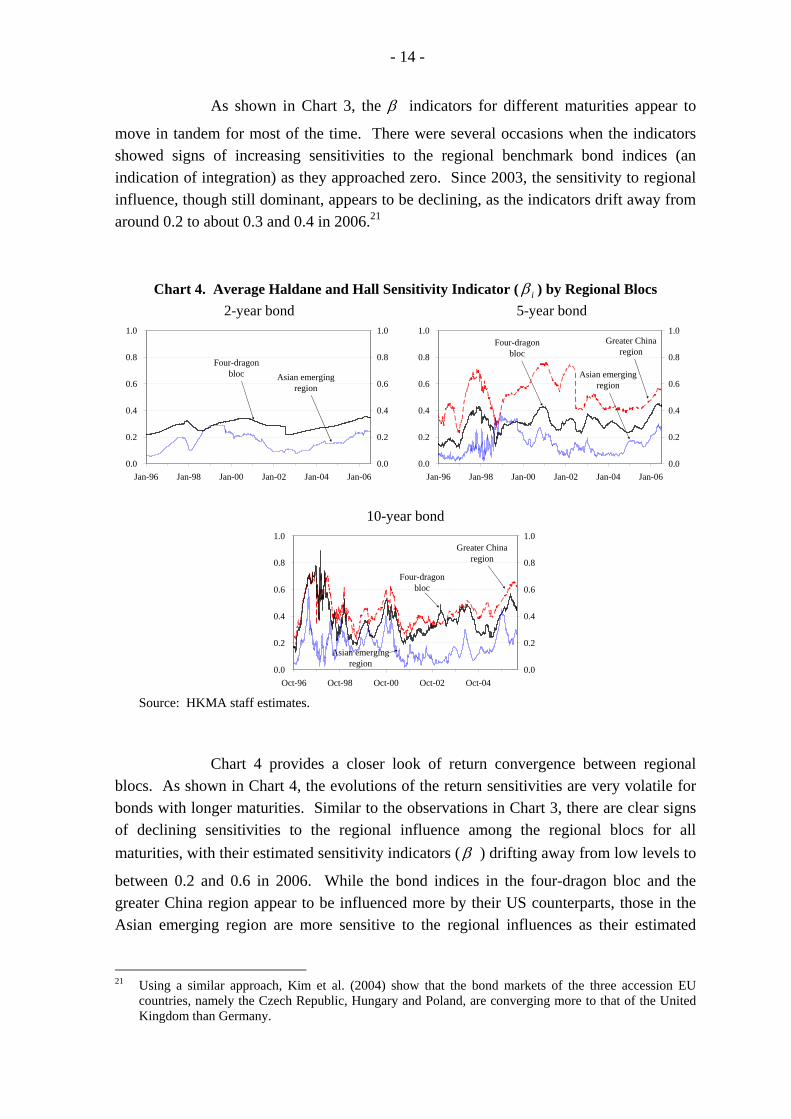
Chart 4 provides a closer look of return convergence between regional blocs. As shown in Chart 4, the evolutions of the return sensitivities are very volatile for bonds with longer maturities. Similar to the observations in Chart 3, there are clear signs of declining sensitivities to the regional influence among the regional blocs for all maturities, with their estimated sensitivity indicators (β ) drifting away from low levels to
between 0.2 and 0.6 in 2006. While the bond indices in the four-dragon bloc and the greater China region appear to be influenced more by their US counterparts, those in the Asian emerging region are more sensitive to the regional influences as their estimated
21 Using a similar approach, Kim et al. (2004) show that the bond markets of the three accession EU
countries, namely the Czech Republic, Hungary and Poland, are converging more to that of the United Kingdom than Germany.
- 15 -
sensitivity indicators (β ) are closer to zero than those obtained for the other two regional
blocs. c. Dynamic cointegration analysis
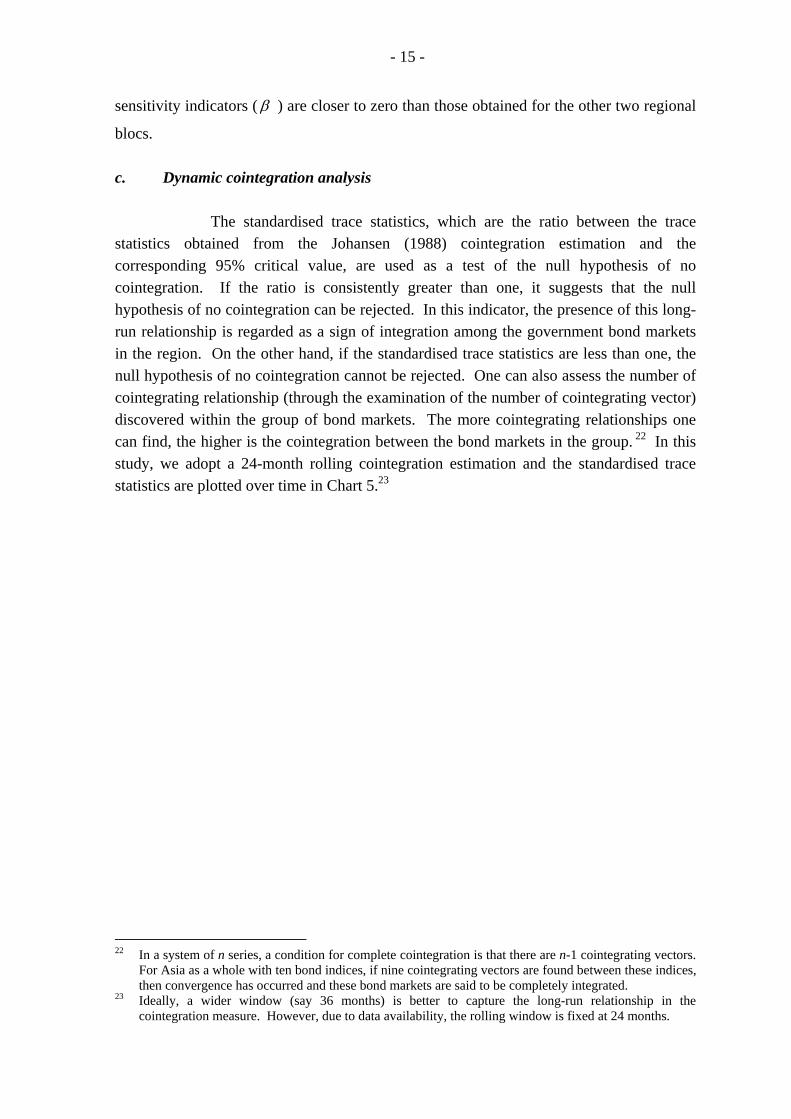
The standardised trace statistics, which are the ratio between the trace statistics obtained from the Johansen (1988) cointegration estimation and the corresponding 95% critical value, are used as a test of the null hypothesis of no cointegration. If the ratio is consistently greater than one, it suggests that the null hypothesis of no cointegration can be rejected. In this indicator, the presence of this long-run relationship is regarded as a sign of integration among the government bond markets in the region. On the other hand, if the standardised trace statistics are less than one, the null hypothesis of no cointegration cannot be rejected. One can also assess the number of cointegrating relationship (through the examination of the number of cointegrating vector) discovered within the group of bond markets. The more cointegrating relationships one can find, the higher is the cointegration between the bond markets in the group. 22 In this study, we adopt a 24-month rolling cointegration estimation and the standardised trace statistics are plotted over time in Chart 5.23
22 In a system of n series, a condition for complete cointegration is that there are n-1 cointegrating vectors.
For Asia as a whole with ten bond indices, if nine cointegrating vectors are found between these indices, then convergence has occurred and these bond markets are said to be completely integrated.
23 Ideally, a wider window (say 36 months) is better to capture the long-run relationship in the cointegration measure. However, due to data availability, the rolling window is fixed at 24 months.
- 16 -
Chart 5. 24-month Rolling Standardised Trace Statistics
for Testing Various Null Hypotheses 10-year bond 5-year bond
0.0
0.2
0.4
0.6
0.8
1.0
1.2
1.4
Jul-05 Oct-05 Jan-06 Apr-060.0
0.2
0.4
0.6
0.8
1.0
1.2
1.4No cointegration
At most one cointegrating vector
At most two cointegrating vectors
0.0
0.2
0.4
0.6
0.8
1.0
1.2
1.4
Apr-06 May-06 Jun-060.0
0.2
0.4
0.6
0.8
1.0
1.2
1.4No cointegration
At most one cointegrating vectorAt most two cointegrating vector
2-year bond
0.0
0.2
0.4
0.6
0.8
1.0
1.2
1.4
Feb-05 May-05 Aug-05 Nov-05 Feb-06 May-060.0
0.2
0.4
0.6
0.8
1.0
1.2
1.4No cointegration
At most one cointegrating vector
At most two cointegrating vector
Source: HKMA staff estimates.
Chart 5 shows that for the null hypothesis of no cointegarion, the standardised trace statistics for bond indices of 5-year and 10-year maturity are consistently larger than one, while that of 2-year maturity have fallen below one since 2006. However, the null hypotheses of more than one cointegrating relationship (through the examination of the number of cointegrating vector) are mostly rejected for Asia as a whole for all maturities, as the standardised trace statistics are less than one. This suggests that there is only a weak cointegration between the government bond markets in the region. Compared to the bond markets in the European Union member countries, the Asian bond markets are much less cointegrated, suggesting a low degree of integration in Asia.24
24 Using the same dynamic cointegration approach, Kim et al. (2004) show that the number of
cointegrating vectors from ten European Union member countries’ bond markets ranges from three to seven over the study period from January 1999 to October 2003. They conclude that the ten European bond markets form an integrated system but there is little evidence that the system is increasingly converging.
- 17 -
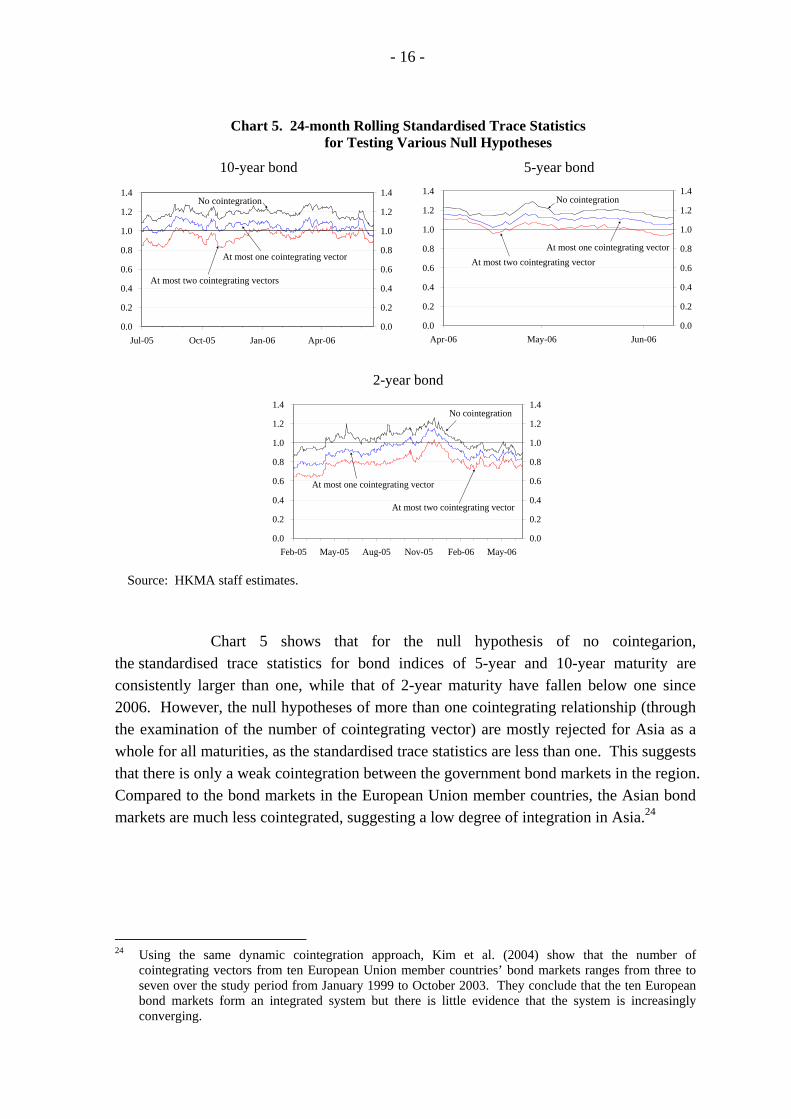
Chart 6. 24-month Rolling Standardised Trace Statistics
for Testing the Null Hypothesis of No Cointegration by Regional Blocs Greater China region Four-dragon bloc
0.00.2
0.40.60.8
1.01.21.41.6
1.8
May-03 Nov-03 May-04 Nov-04 May-05 Nov-05 May-060.00.2
0.40.60.8
1.01.21.41.6
1.8
2-year
10-year
5-year
0.2
0.4
0.6
0.8
1.0
1.2
1.4
1.6
1.8
Jun-00 Jun-01 Jun-02 Jun-03 Jun-04 Jun-05 Jun-060.2
0.4
0.6
0.8
1.0
1.2
1.4
1.6
1.8
2-year
10-year
5-year
Asian emerging region
0.2
0.4
0.6
0.8
1.0
1.2
1.4
1.6
1.8
Dec-04 Mar-05 Jun-05 Sep-05 Dec-05 Mar-06 Jun-060.2
0.4
0.6
0.8
1.0
1.2
1.4
1.6
1.8
2-year
10-year5-year
Source: HKMA staff estimates.
Chart 6 provides the standardised trace statistics for the null hypothesis of no cointegration among regional blocs for bonds of different maturities. The graphs show that the bond markets between members of the same regional bloc are only occasionally cointegrated. Since June 2005, their standardised trace statistics have mostly stayed at a level below one. d. Market cycle synchronisation
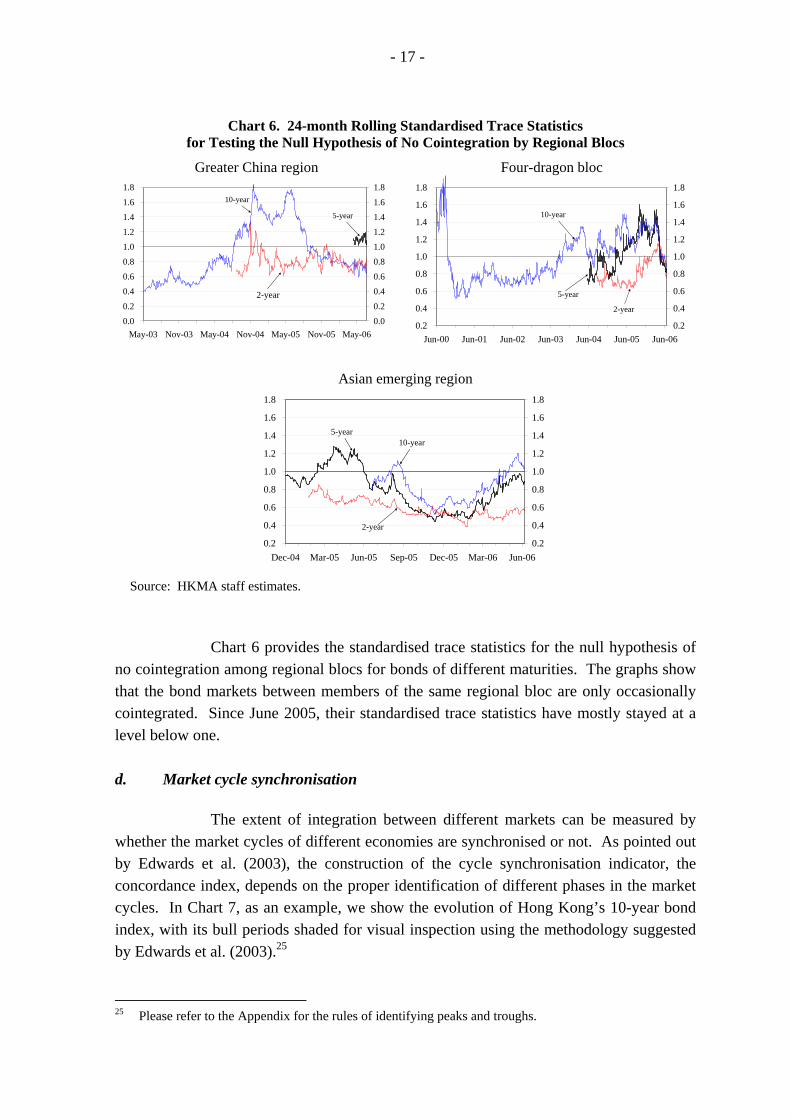
The extent of integration between different markets can be measured by whether the market cycles of different economies are synchronised or not. As pointed out by Edwards et al. (2003), the construction of the cycle synchronisation indicator, the concordance index, depends on the proper identification of different phases in the market cycles. In Chart 7, as an example, we show the evolution of Hong Kong’s 10-year bond index, with its bull periods shaded for visual inspection using the methodology suggested by Edwards et al. (2003).25
25 Please refer to the Appendix for the rules of identifying peaks and troughs.
- 18 -
Chart 7. Hong Kong 10-year EFN Index and Market Cycles
50
60
70
80
90
100
110
120
Jun-97 Jun-99 Jun-01 Jun-03 Jun-05
Return Index
Note: Shaded areas represent bull phases.
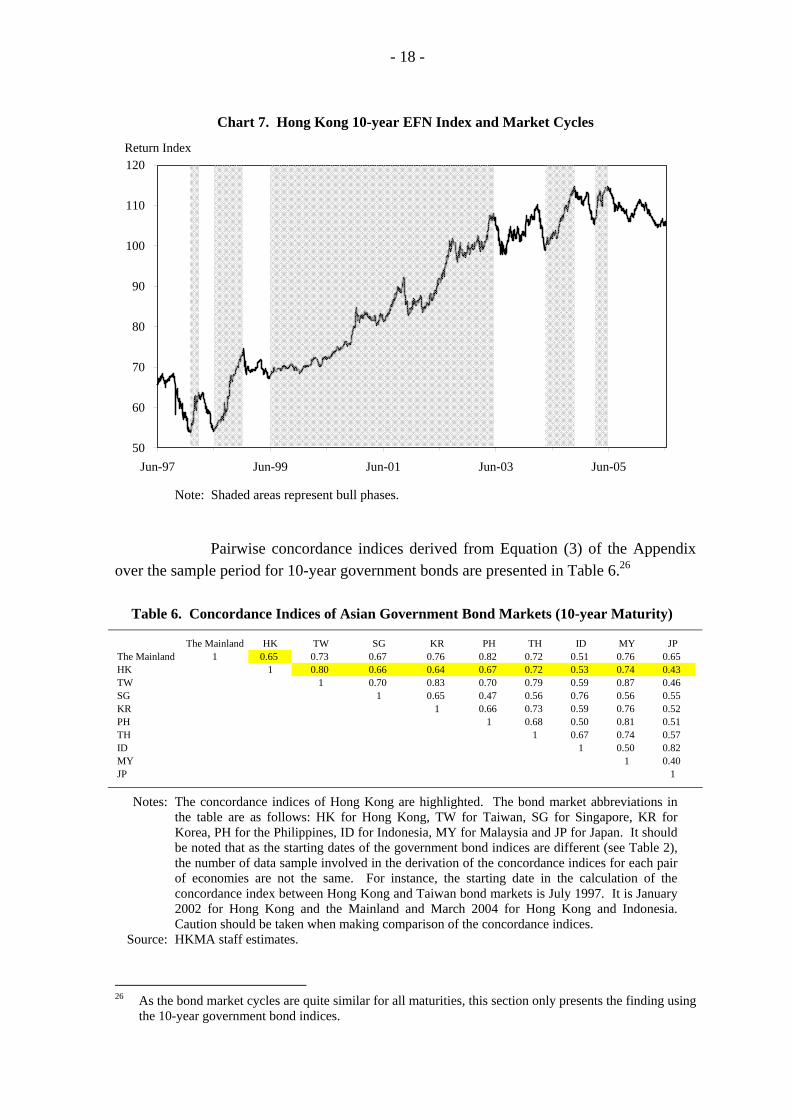
Pairwise concordance indices derived from Equation (3) of the Appendix over the sample period for 10-year government bonds are presented in Table 6.26
Table 6. Concordance Indices of Asian Government Bond Markets (10-year Maturity)
The Mainland HK TW SG KR PH TH ID MY JPThe Mainland 1 0.65 0.73 0.67 0.76 0.82 0.72 0.51 0.76 0.65HK 1 0.80 0.66 0.64 0.67 0.72 0.53 0.74 0.43TW 1 0.70 0.83 0.70 0.79 0.59 0.87 0.46SG 1 0.65 0.47 0.56 0.76 0.56 0.55KR 1 0.66 0.73 0.59 0.76 0.52PH 1 0.68 0.50 0.81 0.51TH 1 0.67 0.74 0.57ID 1 0.50 0.82MY 1 0.40JP 1
Notes: The concordance indices of Hong Kong are highlighted. The bond market abbreviations in the table are as follows: HK for Hong Kong, TW for Taiwan, SG for Singapore, KR for Korea, PH for the Philippines, ID for Indonesia, MY for Malaysia and JP for Japan. It should be noted that as the starting dates of the government bond indices are different (see Table 2), the number of data sample involved in the derivation of the concordance indices for each pair of economies are not the same. For instance, the starting date in the calculation of the concordance index between Hong Kong and Taiwan bond markets is July 1997. It is January 2002 for Hong Kong and the Mainland and March 2004 for Hong Kong and Indonesia. Caution should be taken when making comparison of the concordance indices.
Source: HKMA staff estimates.
26 As the bond market cycles are quite similar for all maturities, this section only presents the finding using
the 10-year government bond indices.
- 19 -
The pairwise concordance indices of bond markets are quite high,
averaging 0.6 and above, with the exception of Indonesia averaging at 0.54. This implies that over the sample periods, the bond market cycles in the region are aligned with one another for over 60% of the time.
Using a window of 16 months (which is equivalent to the length of one
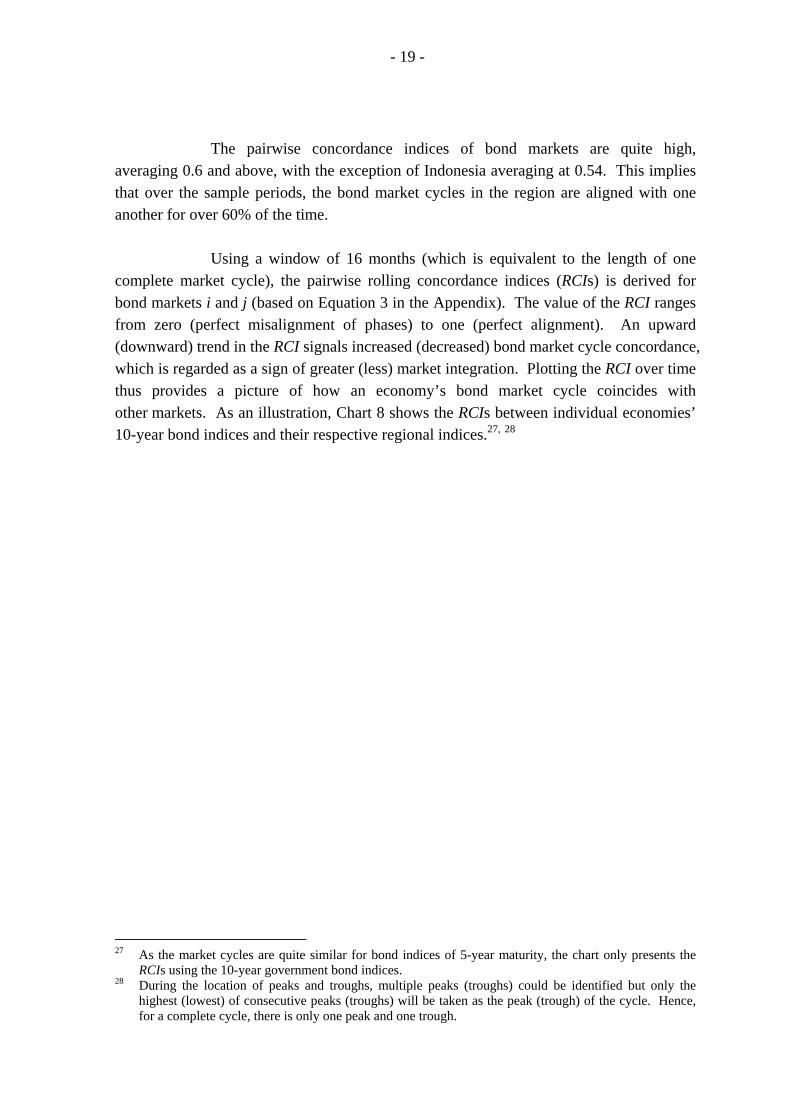
complete market cycle), the pairwise rolling concordance indices (RCIs) is derived for bond markets i and j (based on Equation 3 in the Appendix). The value of the RCI ranges from zero (perfect misalignment of phases) to one (perfect alignment). An upward (downward) trend in the RCI signals increased (decreased) bond market cycle concordance, which is regarded as a sign of greater (less) market integration. Plotting the RCI over time thus provides a picture of how an economy’s bond market cycle coincides with other markets. As an illustration, Chart 8 shows the RCIs between individual economies’ 10-year bond indices and their respective regional indices.27, 28
27 As the market cycles are quite similar for bond indices of 5-year maturity, the chart only presents the
RCIs using the 10-year government bond indices. 28 During the location of peaks and troughs, multiple peaks (troughs) could be identified but only the
highest (lowest) of consecutive peaks (troughs) will be taken as the peak (trough) of the cycle. Hence, for a complete cycle, there is only one peak and one trough.
- 20 -
Chart 8. RCIs of Asian Government 10-year Bond Indices vs. Regional Bond Proxies
Greater China region Four-dragon bloc and Japan
0.0
0.2
0.4
0.6
0.8
1.0
1.2
Oct-98 Oct-99 Oct-00 Oct-01 Oct-02 Oct-03 Oct-04 Oct-050.0
0.2
0.4
0.6
0.8
1.0
1.2
The Mainland
Hong Kong
Taiwan
0.0
0.2
0.4
0.6
0.8
1.0
1.2
Oct-98 Oct-99 Oct-00 Oct-01 Oct-02 Oct-03 Oct-04 Oct-050.0
0.2
0.4
0.6
0.8
1.0
1.2Hong Kong
Japan KoreaSingapore
Taiwan
Asian emerging region
0.0
0.2
0.4
0.6
0.8
1.0
1.2
Oct-98 Oct-99 Oct-00 Oct-01 Oct-02 Oct-03 Oct-04 Oct-050.0
0.2
0.4
0.6
0.8
1.0
1.2
Philippines
Malaysia
ThailandIndonesia
Notes: 1. The individual bond market’s regional index is proxied by the cross-country average bond index of the corresponding maturity excluding the bond index of that market itself.
2. It should be noted that as the local peak or trough is located by comparing the bond index level at time t with the levels throughout t + 174 days and t – 174 days (approximately eight months before and after time t), the RCIs are calculated up to 4 November 2005 which is 174 days before the end of the sample period.
Source: HKMA staff estimates. The graphs in Chart 8 show that the bond market cycles are quite
synchronised for the Asian region as a whole. Most bond markets in the region experienced a fall in their RCIs between 2003 and 2004. The RCIs of Korea, Taiwan and the Mainland managed to pick up after the drop, while that of the Asian emerging markets fell back to between 0.5 and 0.7 following a brief improvement. Also, notable declines in bond market cycle synchronisation are observed in Hong Kong, Singapore and Japan. Their RCIs have dropped to less than 0.5 as at October 2005.
- 21 -
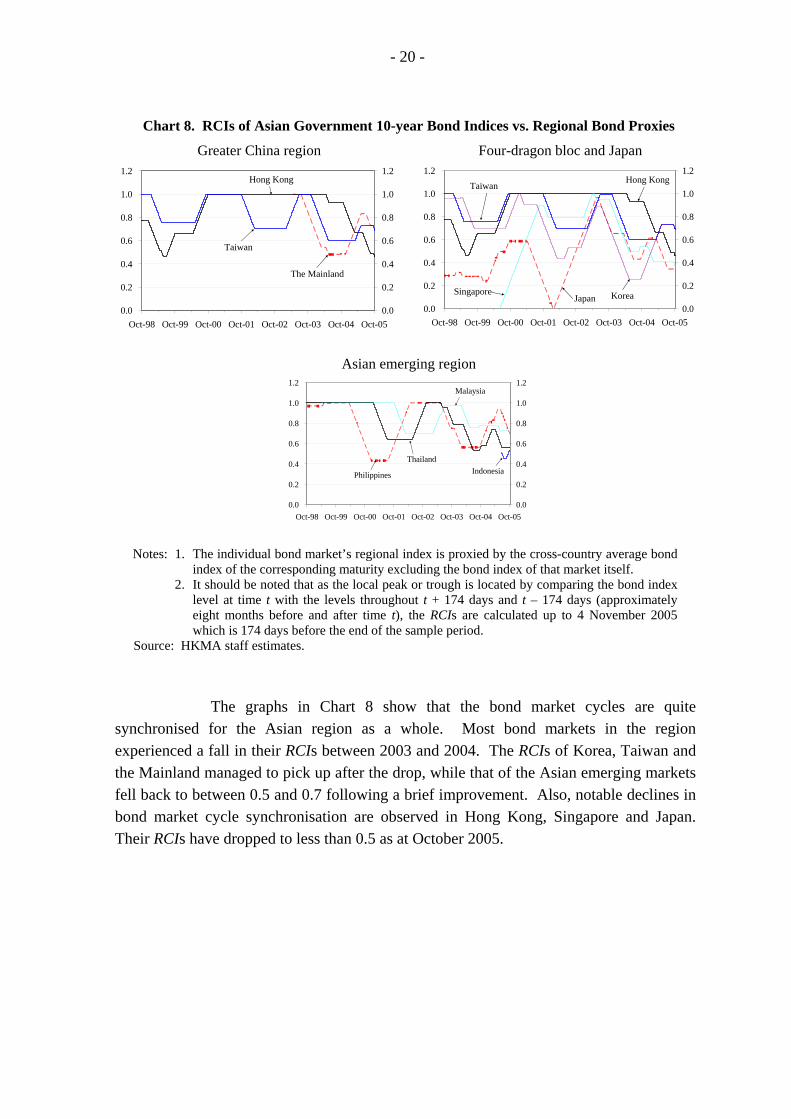
Chart 9. Average RCIs of 10-year Bond Indices of Regional Blocs
0.0
0.2
0.4
0.6
0.8
1.0
1.2
Oct-98 Oct-00 Oct-02 Oct-040.0
0.2
0.4
0.6
0.8
1.0
1.2Greater China region
Asian emerging regionFour-dragon bloc
Note: As the starting dates of bond indices are different, the number of RCI series being averaged will increase over time.
Source: HKMA staff estimates. Chart 9 takes a closer look on the average rolling RCIs for the bond markets within the three regional blocs respectively. It shows that the synchronisation of the bond market cycles within the three regional blocs varies quite a lot before 2004, with the RCIs swinging from perfect synchronisation (RCI of one) to less than 0.4 in the case of the Asian emerging region. Yet their RCIs have stabilised at between 0.6 and 0.8 levels since late 2004, meaning that about 60 to 80% of the time the bond market cycles in members of these regional blocs were “aligned” with other members within the same bloc. Overall, Charts 8 and 9 suggest that the bond market cycles in the Asian emerging region are quite “synchronised” both with the regional cycle and among themselves, compared to that of the four-dragon bloc and the greater China region.
- 22 -
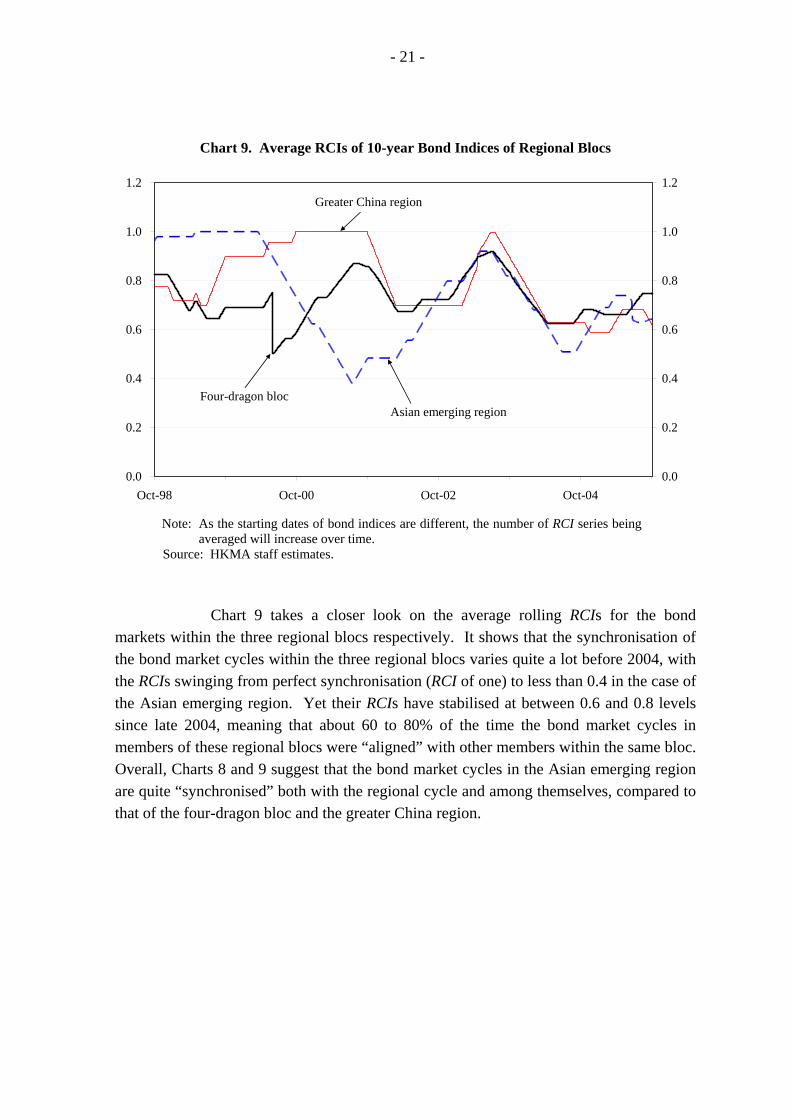
e. Beta convergence of bond return
The beta coefficient in Equation (4) in the Appendix is derived by estimating the GARCH model using a rolling window of 18 months. For complete market integration, the estimated beta should be equal to one, i.e., bond returns of individual economy ( tcY ,Δ ) should react exclusively to common news, which is represented by the
return of the US Treasury bond ( tUSY ,Δ ). A rising beta suggests an increasing trend of
market integration.29 Chart 10 depicts the evolution of the estimated betas.
Chart 10. Unweighted 18-month Rolling Beta Estimates (Mean equation: tctUStctctc YY ,,,,, εβα +Δ+=Δ )
-0.1
0.0
0.1
0.2
0.3
0.4
Jul-97 Jul-98 Jul-99 Jul-00 Jul-01 Jul-02 Jul-03 Jul-04 Jul-05 Jul-06-0.1
0.0
0.1
0.2
0.3
0.4
Rolling 18-month beta
10-year5-year
2-year
Note: tcY ,Δ denotes the bond return of country c at time t and tUSY ,Δ is the bond return
of the US Treasury of corresponding maturity at time t. Source: HKMA staff estimates.
For Asia as a whole, the estimated betas in Chart 10 suggest a slowly rising
trend of common news influence from the US since 1999. Nonetheless, they remain at a low level of 0.3 or below for all maturities. Table 7 highlights the unweighted average rolling betas for individual economies.
29 It should be noted that the estimation results of the econometric specification in Equation (4) in the
Appendix may differ depending on the selection of the most appropriate benchmark bond to reflect the “common news” effect. In many studies, the US Treasury bond is a popular choice in representing the “common news” factor.
- 23 -
Table 7. Average Beta Estimates
Economy 2-year bond 5-year bond 10-year bond
Hong Kong 0.54 0.55 0.62 The Mainland NA -0.01 0.16 Taiwan 0.12 0.19 0.14 Korea 0.11 0.13 0.13 Singapore 0.20 0.20 0.35 Japan 0.14 0.16 0.18 Malaysia 0.00 0.01 0.00 Thailand 0.11 0.18 0.11 Indonesia 0.06 0.09 -0.03 The Philippines 0.03 0.00 -0.04
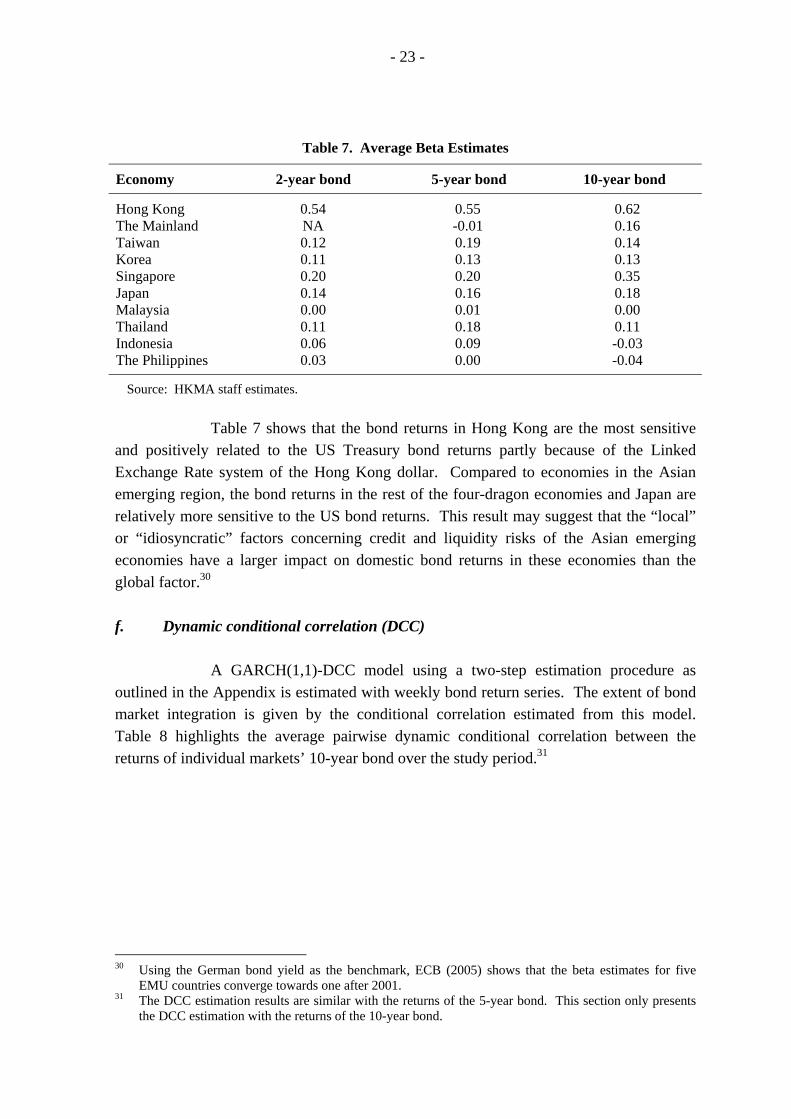
Source: HKMA staff estimates. Table 7 shows that the bond returns in Hong Kong are the most sensitive and positively related to the US Treasury bond returns partly because of the Linked Exchange Rate system of the Hong Kong dollar. Compared to economies in the Asian emerging region, the bond returns in the rest of the four-dragon economies and Japan are relatively more sensitive to the US bond returns. This result may suggest that the “local” or “idiosyncratic” factors concerning credit and liquidity risks of the Asian emerging economies have a larger impact on domestic bond returns in these economies than the global factor.30 f. Dynamic conditional correlation (DCC)
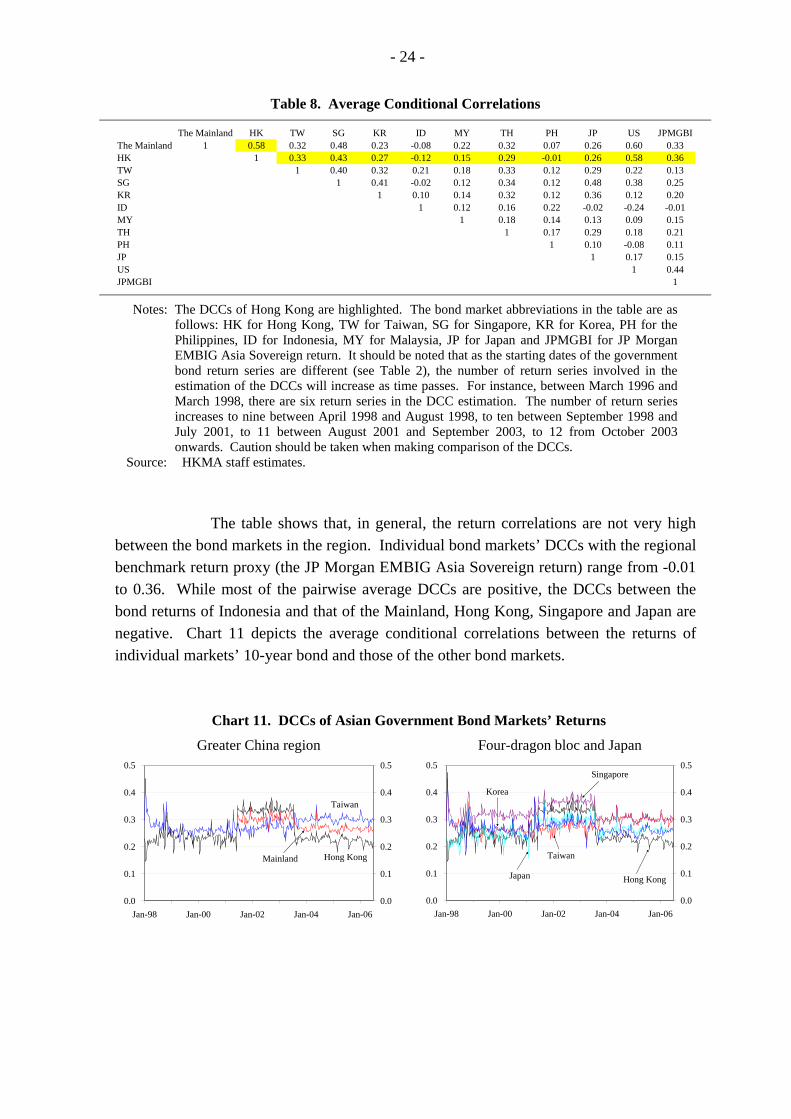
A GARCH(1,1)-DCC model using a two-step estimation procedure as outlined in the Appendix is estimated with weekly bond return series. The extent of bond market integration is given by the conditional correlation estimated from this model. Table 8 highlights the average pairwise dynamic conditional correlation between the returns of individual markets’ 10-year bond over the study period.31
30 Using the German bond yield as the benchmark, ECB (2005) shows that the beta estimates for five
EMU countries converge towards one after 2001. 31 The DCC estimation results are similar with the returns of the 5-year bond. This section only presents
the DCC estimation with the returns of the 10-year bond.
- 24 -
Table 8. Average Conditional Correlations
The Mainland HK TW SG KR ID MY TH PH JP US JPMGBIThe Mainland 1 0.58 0.32 0.48 0.23 -0.08 0.22 0.32 0.07 0.26 0.60 0.33HK 1 0.33 0.43 0.27 -0.12 0.15 0.29 -0.01 0.26 0.58 0.36TW 1 0.40 0.32 0.21 0.18 0.33 0.12 0.29 0.22 0.13SG 1 0.41 -0.02 0.12 0.34 0.12 0.48 0.38 0.25KR 1 0.10 0.14 0.32 0.12 0.36 0.12 0.20ID 1 0.12 0.16 0.22 -0.02 -0.24 -0.01MY 1 0.18 0.14 0.13 0.09 0.15TH 1 0.17 0.29 0.18 0.21PH 1 0.10 -0.08 0.11JP 1 0.17 0.15US 1 0.44JPMGBI 1
Notes: The DCCs of Hong Kong are highlighted. The bond market abbreviations in the table are as follows: HK for Hong Kong, TW for Taiwan, SG for Singapore, KR for Korea, PH for the Philippines, ID for Indonesia, MY for Malaysia, JP for Japan and JPMGBI for JP Morgan EMBIG Asia Sovereign return. It should be noted that as the starting dates of the government bond return series are different (see Table 2), the number of return series involved in the estimation of the DCCs will increase as time passes. For instance, between March 1996 and March 1998, there are six return series in the DCC estimation. The number of return series increases to nine between April 1998 and August 1998, to ten between September 1998 and July 2001, to 11 between August 2001 and September 2003, to 12 from October 2003 onwards. Caution should be taken when making comparison of the DCCs.
Source: HKMA staff estimates. The table shows that, in general, the return correlations are not very high
between the bond markets in the region. Individual bond markets’ DCCs with the regional benchmark return proxy (the JP Morgan EMBIG Asia Sovereign return) range from -0.01 to 0.36. While most of the pairwise average DCCs are positive, the DCCs between the bond returns of Indonesia and that of the Mainland, Hong Kong, Singapore and Japan are negative. Chart 11 depicts the average conditional correlations between the returns of individual markets’ 10-year bond and those of the other bond markets.
Chart 11. DCCs of Asian Government Bond Markets’ Returns
Greater China region Four-dragon bloc and Japan
0.0
0.1
0.2
0.3
0.4
0.5
Jan-98 Jan-00 Jan-02 Jan-04 Jan-060.0
0.1
0.2
0.3
0.4
0.5
Hong KongMainland
Taiwan
0.0
0.1
0.2
0.3
0.4
0.5
Jan-98 Jan-00 Jan-02 Jan-04 Jan-060.0
0.1
0.2
0.3
0.4
0.5
Korea
Hong Kong
Taiwan
Singapore
Japan
- 25 -
Asian emerging region
0.0
0.1
0.2
0.3
0.4
0.5
Jan-98 Jan-00 Jan-02 Jan-04 Jan-060.0
0.1
0.2
0.3
0.4
0.5
IndonesiaPhilippines
Thailand
Malaysia
Source: HKMA staff estimates.
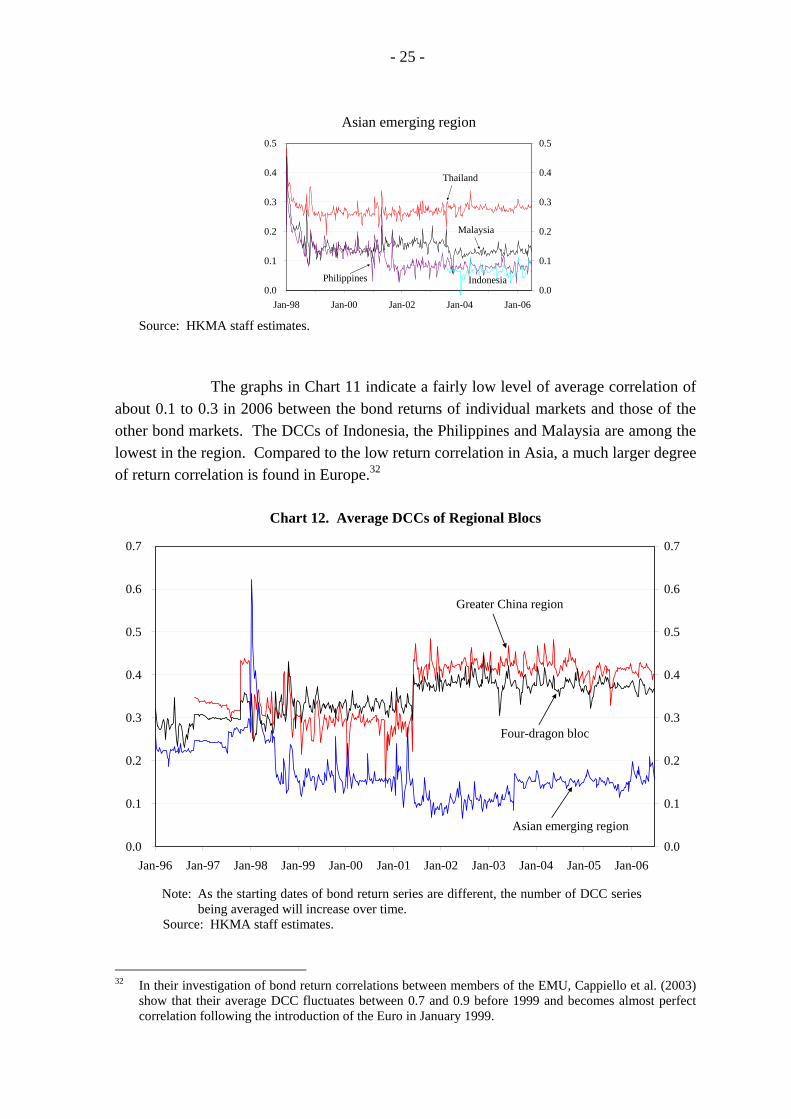
The graphs in Chart 11 indicate a fairly low level of average correlation of about 0.1 to 0.3 in 2006 between the bond returns of individual markets and those of the other bond markets. The DCCs of Indonesia, the Philippines and Malaysia are among the lowest in the region. Compared to the low return correlation in Asia, a much larger degree of return correlation is found in Europe.32
Chart 12. Average DCCs of Regional Blocs
0.0
0.1
0.2
0.3
0.4
0.5
0.6
0.7
Jan-96 Jan-97 Jan-98 Jan-99 Jan-00 Jan-01 Jan-02 Jan-03 Jan-04 Jan-05 Jan-060.0
0.1
0.2
0.3
0.4
0.5
0.6
0.7
Greater China region
Asian emerging region
Four-dragon bloc
Note: As the starting dates of bond return series are different, the number of DCC series being averaged will increase over time.
Source: HKMA staff estimates.
32 In their investigation of bond return correlations between members of the EMU, Cappiello et al. (2003)
show that their average DCC fluctuates between 0.7 and 0.9 before 1999 and becomes almost perfect correlation following the introduction of the Euro in January 1999.

- 26 -
Chart 12 focuses on the pattern of the average DCCs within the three
regional blocs. The bond markets in the greater China region and the four-dragon bloc are relatively more correlated with each other respectively, compared to that in the Asian emerging region. Nonetheless, the degree of correlation is not high as the average correlation is just above 0.4 in 2006.
V. SUMMARY AND DISCUSSION
Table 9 provides a summary on the current status of bond market integration by the various indicators.
Table 9. Summary of Indication of Current Bond Market Integration in Asia
Method Indication of market integration
Current status of market integration
a. Cross-country dispersion of bond return
Lower return dispersion and smaller return differential imply higher return convergence
Return dispersions are falling, but there are signs that the dispersions are trending upwards lately
b. Haldane and Hall (1991) Kalman filter method
Unweighted average β moves towards zero indicates an increasing sensitivity to regional influence
Some progress during 1990s but no improvement since 2003
c. Dynamic cointegration analysis
Standardised trace statistics consistently greater than one and increasing number of cointegration relationships
At most only one cointegration relationship can be found, indicating weak cointegration
d. Market cycle synchronisation
An upward trend in the RCI signals increased market concordance
Bond market cycles in the Asian emerging region as well as other regional blocs seem to be as “synchronised” with the regional cycles and between themselves
e. Beta convergence of bond return
The larger the estimated conditional beta towards one, the greater the influence from “common news” factor
Small estimated beta values but they are improving
f. Dynamic conditional correlation (DCC) model
The higher the time-varying correlation, the larger the co-movement between government bond return
Low level of conditional correlation between 0.1 and 0.3
- 27 -
Given the different focus of each indicator, the picture that emerges from
the empirical results is not completely uniform. For instance, while the conditional correlation between the bond returns of the Asian emerging region is very low at about 0.3 or less, the phases of their bond market cycles are fairly “aligned” at about 0.6. On the other hand, both the Haldane and Hall sensitivity indicator and the beta convergence indicator point to an increasing sensitivity of Asian bond market returns to that in the US, suggesting a decline in the regional bond market integration. For Asia as a whole, most indicators point to a weak integration and the situation has not improved (or very little progress has been made) since 2003. While the return dispersions have declined since the Asian financial crisis, there are signs that they are now trending upwards. The Haldane and Hall sensitivity indicators have drifted away from about 0.2 in 2002-2003 and risen to about 0.4 in 2006, suggesting an increased influence from the US Treasury bond market. In particular, bond returns of the greater China economies and the four-dragon economies are more sensitive to their US counterparts than those of the Asian emerging markets. The beta convergence measures also indicate an increased in the sensitivity to the US Treasury bond returns. The results from the dynamic cointegration analysis only indicate weak cointegration among the government bond markets. The conditional correlations from the DCC measures show that the bond markets are very weakly correlated. The only exception is from the synchronisation measure, which shows that the bond market cycles in the region are “aligned” over 60% of the time during the study period. However, it is also noted that the bond market cycles in Hong Kong, Singapore and Japan are becoming less synchronised with the region since late 2003. Compared to their Asian counterparts, the European bond markets are much more integrated, a result suggested by the fall of the yield spread dispersions to zero since 2001, a strong degree of beta convergence to the German bond yield and their large return correlations of 0.9.
Compared to the equity market integration study by Yu et al. (2007) which
covered the same economies in the Asian region, the bond market integration is relatively lagging behind. Despite the fact that the two markets only record minimal or even regressive progresses in their respective integration process since 2003, the various indicators still suggest a larger degree of integration in the equity markets. For instance, while the dynamic cointegration measure indicates both markets are weakly cointegrated, measures based on the dynamic correlation, the Haldane and Hall sensitivity indicator and the cycle synchronisation show the higher degree of equity market integration. This result may suggest that the bond markets in the region may have different stages of development and their interdependencies are in general weak when compared to those of the equity markets in the region.
In summary, the empirical results from these indicators provide a general picture regarding the trend of bond market integration in Asia. The evidence presented is broadly in line with the common perception that there is very limited progress of bond
- 28 -
market integration taking place in the region. The picture is also supported by other alternative measures. For instance, using the share of cross-border bond investment in their bond portfolios as one of the measures of capital market integration, Chu et al. (2006) note that Asian economies hold a relatively smaller share – 3.6% on average in 2004, compared to 68.8% in Europe. The demand for debt securities from the US and Europe remains strong and their share in Asian economies’ bond portfolio amounts to 68.2% on average in 2004. The apparent lack of progress in bond market integration may be due to the “local” or “idiosyncratic” factors such as credit or liquidity risks in some Asian economies. It may also be the case that many local bond markets in the region are still in their early development stage and with low liquidity due to inactive trading. While international effort to pursue policy coordination is desirable for promoting a higher degree of bond market integration, it is also essential for central banks in the Asian region to focus on the development of their domestic bond markets. Institutional and regulatory reforms, such as improving market infrastructure, introducing new products, promoting retail investment and attracting offshore investors, opening local currency bond market to supranational and foreign financial institutions, will help speed up the development of domestic bond markets, and thus providing a more favourable platform for greater bond market integration.
- 29 -
REFERENCES Adam, K., T. Jappelli, A. Menichini, M. Padula and M. Pagano (2002): “Analyse,
Compare, and Apply Alternative Indicators and Monitoring Methodologies to Measure the Evolution of Capital Market Integration in the European Union”, Report commissioned by the European Commission.
Asian Development Bank (2005): “Asia Bond Monitor”, November. Baele, L., A. Ferrando, P. Hordahl, E. Krylova and C. Monnet (2004): “Measuring
Financial Integration in the Euro Area”, European Central Bank Occasional Paper 14. Cappiello, L., R. F. Engle and K. Sheppard (2003): “Asymmetric Dynamics in the
Correlations of Global Equity and Bond Returns”, European Central Bank Working Paper 204.
Chu, C., Y. K. Mo, G. Wong and P. Lim (2006): “Financial Integration in Asia”, Hong
Kong Monetary Authority Quarterly Bulletin 49. Danareksa Research Institute (2004): “Toward a Regional Financial Architecture for East
Asia”, Report commissioned by ASEAN Secretariat. De Brouwer, G. and J. Corbett (2005): “A New Financial Market Structure For East Asia:
How to Promote Regional Financial Market Integration”, Paper prepared for presentation at the OECD/ADBI 7th Round Table on Capital Market Reform in Asia, 27-28 October 2005.
Edwards, S., J. G. Biscarri and F. P. de Gracia (2003): “Stock Market Cycles, Financial
Liberalisation and Volatility”, Journal of International Money and Finance 22, 925-955.
Engle, R. F. (2002): “Dynamic Conditional Correlation: A Simple Class of Multivariate
Generalized Autoregressive Conditional Heteroskedasticity Models”, Journal of Business and Economic Statistics 20(3), 339-350.
Engle, R. F. and K. Sheppard (2001): “Theoretical and Empirical Properties of Dynamic
Conditional Correlation Multivariate GARCH”, NBER Working Paper 8554. European Central Bank (2005): “Indicators of Financial Integration in the Euro Area”,
September. European Commission (2005) Financial Integration Monitor. Haldane A. G. and S. G. Hall (1991): “Sterling’s Relationship with the Dollar and the
Deutschemark: 1976-89”, The Economic Journal 101(406), 436-443. Harding, D. and A. R. Pagan (2000): “Knowing the Cycle”, in Backhouse, R.E. and
Salanti, A. (Eds.) Macro-economics and the Real World Volume 1: Econometric Techniques and Macroeconomics, Oxford University Press, Oxford, 23-42.
- 30 -
(2002): “Dissecting the Cycle: A Methodological Investigation”, Journal of Monetary Economics 49(2) 365-381.
Johansen, S. (1988): “Statistical analysis of Cointegration Vectors”, Journal of Economic
Dynamics and Control 12, 251-254. Kim, S. J., B. M. Lucey and E. Wu (2004): “Dynamics of Bond Market Integration
between Existing and Accession EU Countries”, Institute for International Integration Studies Discussion Paper 25.
Manning, N. (2002): “Common Trends and Convergence? South East Asian Equity
Markets, 1988 – 1999”, Journal of International Money and Finance 21, 183-202. McCauley, R., S. S. Fung and B. Gadanecz (2002): “Integrating the Finances of East
Asia”, Bank for International Settlements Quarterly Review (December). Pagan, A. R. and K. A. Sossounov (2003): “A Simple Framework for Analysing Bull and
Bear Markets”, Journal of Applied Econometrics 18(1), 23-46. Park, Y. C. (2004): “Regional Financial Integration in East Asia: Challenges and
Prospects”, Paper prepared for presentation at the United Nations Conference on Regional Financial Arrangements.
Park, D. and Y. C. Park (2005): “Toward Developing Regional Bond Markets in East
Asia”, Asian Economic Papers 3(2), 183-209. Pascual, A. G. (2003): “Assessing European Stock Markets (Co)integration”, Economics
Letters 78, 197-203. Ravn, M. O. and H. Uhlig (2002): “On Adjusting the Hodrick-Prescott Filter for the
Frequency of Observations”, Review of Economics and Statistics 84, 371-375. Reininger, T. and Z. Walko (2005): “The Integration of the Czech, Hungarian and Polish
Bond Markets with the Euro Area Bond Market”, Paper prepared for presentation at the ONB, ECB and CFS Conference on Financial Development, Integration and Stability in Central, Eastern and South-Eastern Europe, November.
Serletis, A. and M. King (1997): “Common Stochastic Trends and Convergence of
European Union stock Markets”, The Manchester School 65(1), 44-57. Shiller, R. J. (1979): “The Volatility of Long-term Interest Rates and Expectations Models
of the Term Structure”, Journal of Political Economy 87(6), 1190-1219. Wong, A. S. K. and P. J. G. Vlaar (2003): “Modelling Time-varying Correlations of
Financial Markets”, De Nederlandsche Bank NV Research Memorandum 739/0319. Yu, Ip-wing, L. Fung and C. S. Tam (2007): “Assessing Financial Market Integration in
Asia – Equity Markets”, Hong Kong Monetary Authority Working Paper 04/2007.
- 31 -
Appendix
Methodology and Interpretation: Indicators of Bond Market Integration
This Appendix provides the methodologies of constructing the indicators for assessing bond market integration in Asia and their interpretation. All integration indicators are derived based on the bond returns of individual economies expressed in terms of the US dollar. The bond returns are approximated by the holding period return as discussed in Shiller (1979).33 Once the bond return series (in local currency) are derived, they are converted into US dollar return series by dividing the local currency bond return series by the percentage change in the local currency per US dollar exchange rate of the respective economies. a. Cross-country bond return dispersion
The European Central Bank (ECB) uses the dispersion of government bond yield spreads as one of their indicators to assess bond market integration in the Euro area. 34 Given comparable maturities and other relevant features, yield spreads for government bonds can provide a direct measure of yield convergence. The higher the degree of yield convergence, the lower the dispersion is.35
In this study, we modifying the ECB (2005) approach and calculate the the
cross-country bond return dispersion indicator. This indicator is derived first by taking the standard deviation of the government bond return series of various economies in the region. Once a time series of standard deviations is obtained, it is filtered using the Hodrick-Prescott smoothing technique to reveal the long-term trend component of the series. In addition, to assess the bond market integration process among regional blocs, a 12-month moving average of the cross-market maximum-minimum return differential is constructed. For both measures, the smaller the return dispersion or differential between bond markets is, the greater their return convergence is.
b. Haldane and Hall (1991) Kalman filter method
The notion of convergence or integration is that the difference between two (or more) series should become arbitrarily small or converge to some constant c as time elapses, such that corYXE ktktk
0)(lim =− ++∞→, where X and Y are the two series.
The convergence process may be gradual and on-going over time. Under this circumstance, we need an indicator which would allow for the detection of such process
33 See Footnote 12 for the formula of holding period return. 34 See ECB (2005). 35 It is noted that the perceived credit risk or liquidity of the relevant government bonds could be different
and this may affect the outcome of the indicator and its interpretation. See Footnote 18 for details.
- 32 -
from a lower to a higher integration level over time. This indicator will be useful in describing both the degree and timing of structural change during the integration process. The Kalman filter approach suggested by Haldane and Hall (1991) is used to measure the time-varying convergence dynamic. The method estimates a simple equation via Kalman filter estimation with the signal equation as
titUSi
tRBMtititii
tRBM YYYY ,,,,,,, )( εβα +−+=− , ),0(~, VNtiε (1)
and the state equations as
),0(~,1,, UNtttiti ξξαα += −
),0(~,1,, WNtttiti μμββ += − (2)
where tiY ,, is the local government bond index of economy i at time t, i
tRBMY , is the regional
benchmark bond index (i.e., the cross-country simple average government bond index of all economies except economy i) of economy i at time t and tUSY , is the dominant external
market at time t proxied by the US Treasury bond index. We obtain the estimated parameter iβ over time via Kalman Filter. From Equation (1), it is easy to show that if iY
and iRBMY converge (the government bond index of economy i converges to the dominant
regional benchmark bond index), we would expect iβ to approach zero. Conversely, if iY
and USY converge (the government bond index of economy i converges to the US Treasury
bond index instead of the regional benchmark index), we would expect iβ to approach
one.36 Under this measure, a tendency for iβ moving towards zero indicates an increasing
sensitivity of individual bond index to the influence of the regional bond index, which can be interpreted as a sign of bond market integration.37
36 By re-arranging Equation (1), we obtain the following equation: titititUSti
itRBMti YYY ,,,,,,, )1( =−−+− εαββ (A1)
It can be seen from Equation (A1) that when iβ approaches zero, the movement in Yi, t would be
increasingly influenced by that in itRBMY , , suggesting that the two series are converging. On the other
hand, when iβ approaches one, the influence from itRBMY , is reducing while that from YUS, t is
increasing, which suggests Yi,t and YUS, t are converging. The situation when iβ is greater than one or
becomes negative suggests that Yi, t is diverging away from itRBMY , and YUS, t .
37 One caveat of the Haldane and Hall approach is that the conclusion of whether the bond markets are converging or diverging may well differ depending on the choices of the dominant regional market and dominant external market.
- 33 -
c. Dynamic cointegration analysis
If the financial markets of a group of economies are integrated and interdependent, there are likely to have cointegration relationship between financial variables of these economies. To examine the time-varying nature of convergence and cointegration, the rolling cointegration procedure similar to Pascual (2003) is used with a constant sample size as the estimation rolls over to the next period. Using the Johansen (1988) cointegration technique, the trace statistic obtained from the rolling estimation, which is a test of the general question of whether there exists one or more cointegrating vectors, can be used to test the cointegration of the government bond markets over time. The trace statistics can be plotted over time to examine the time varying nature of market integration. If markets are cointegrating (i.e., converging), the standardised trace statistics, which are the ratio between the trace statistics and the corresponding 95% critical values, should be consistently greater than one, suggesting that the null hypothesis of no cointegration can be rejected. If markets are diverging or not even in any sense of cointegrated, the standardised trace statistics will be less than one. The more cointegrating vectors one can discover from a group of financial variables, the greater their cointegration is. d. Synchronisation of financial market cycle approach
Another indication of market integration is to look into whether market cycles “align” in time across the region, i.e., we try to identify whether, at a given moment in time, the financial markets in the region are in the same phase of the financial market cycle. If the financial market cycles in the region are more or less “synchronised”, it may provide another indication (or evidence) of financial market integration.
The first step in the analysis of the cycle phases is the determination of the
turning points – the peaks and the troughs that signal the change in the trend of the market from bearish to bullish and vice versa. Based on the bond index of individual economy, we define a rising bond index as the bull phase of the bond market cycle, while a falling bond index as the bear phase of the cycle. Following the rules from Edwards et al. (2003) for locating the turning points, we identify the peaks and the troughs of bond market cycles as follows:
1. local peak (trough) is located by comparing the bond index level at time t with
bond index levels throughout t + 174 days and t – 174 days (approximately eight months before and after time t)38
38 Edwards et al. (2003) note that the results of locating peaks and troughs may be sensitive to the choice
of the window width. In this study, as in Edwards et al., a total cycle length of 16 months is chosen, as suggested by Pagan and Sossounov (2003).

- 34 -
2. Once the peaks and troughs are identified, censoring rules are applied to ensure that we do not identify spurious phases:
(i) turning points within eight months of the beginning / end of the series are
eliminated (ii) peak or trough next to the endpoint of the series is eliminated if it is lower /
higher than the endpoint (iii) cycles of less than 16 months of duration are eliminated (iv) phases of less than four months are eliminated (v) enforced alternation so that a peak is always followed by a trough and vice
versa (vi) if consecutive peaks (troughs) occur, take the highest (lowest) one
3. For periods which are identified as bull phase (St), then St = 1, and those identified
as bear phase (Bt), then Bt = 1. A rolling concordance index (RCI), using a window of width 16 months (which is equivalent to the length of one complete market cycle), is constructed for bond markets i and j, as follows:39
RCIij = [ ]∑=
−−−− +350
1,,,,350
1τ
ττττ tjtitjti BBSS (3)
The value of the concordance index ranges from zero (perfect misalignment
of phases) to one (perfect alignment).40 An upward (downward) trend in the RCI signals increasing (decreasing) market concordance, implying greater (less) market integration. e. Beta convergence of bond yield
Another indicator also covered in ECB (2005) is the beta convergence indicator. If bond markets are fully integrated and country-specific credit risks are absent, bond yields should only react to news common to all markets. That is, changes in the bond yields of individual economies should react exclusively to common news, which is reflected in a change of the benchmark government bond yield.41 We modify the ECB approach and use bond returns instead of changes in bond yield. To separate common from local influences, the following regression model is specified:
tctUStctctc YY ,,,,, εβα +Δ+=Δ (4)
As we have demonstrated in Table 4 in the main text, the estimation of Equation (4) is plagued with ARCH effect. Thus, Equation (4) is specified under a GARCH(1,1) 39 A rolling window width of 16 months is used as this length represents one complete cycle. 40 The concordance index is used in Harding and Pagan (2000, 2002). 41 See also Reininger and Walko (2005).
- 35 -
specification in the variance terms. Following ECB (2005), the conditional beta is derived by estimating the GARCH model using a rolling window of 18 months (about 393 days). For complete market integration, the conditional beta should be equal to 1, i.e., the bond market return of individual economies ( tcY ,Δ ) should react exclusively to common news,
which is reflected in the return of the US Treasury bond ( tUSY ,Δ , or other benchmark
yields) with the same maturity. tc,α denotes a country-specific time-varying intercept.
f. Correlation using dynamic conditional correlation (DCC) model
Simple (or rolling) correlation analysis is among the simplest method for examining the co-movement of financial markets. Basically, higher correlation between markets implies higher co-movement and greater integration between the markets. The DCC model, proposed by Engle and Sheppard (2001) and Engle (2002), is a new class of multivariate model which is particularly well suited to examine correlation dynamics among assets. The DCC approach has the flexibility of univariate GARCH but without the complexity of general multivariate GARCH. As the parameters to be estimated in the correlation process are independent of the number of series to be correlated, a large number of series can be considered in a single estimation. Furthermore, Wong and Vlaar (2003) show that the DCC model outperforms other alternatives in modelling time-varying correlations.
To measure bond market correlations, a two-step estimation procedure of
the DCC model is used. Univariate GARCH models are first estimated for each bond market return series. The standardised residuals from the first step are then used to estimate the dynamic conditional correlations between bond market returns. Specifically, let tiz , and tjz , be the standardised residuals of bond market returns of economy i and j at time t respectively, i ≠ j. The GARCH process, as suggested in Engle (2002), is:
)()( 1,1,1,, ijtijijtjtiijtij qzzq ρβραρ −+−+= −−− (5) and
tjjtii
tijtij qq
q
,,
,, =ρ
(6)
where ijq is the off-diagonal elements of the variance-covariance matrix, ijρ is the
unconditional expectation of the cross product tjti zz ,, and tij ,ρ is the conditional correlation between the bond market returns of economy i and j at time t.42
42 See Engle (2002) for a detailed description of the simple DCC model and the estimation procedure.