ASSESSEMENT OF UNCERTAINITY ANALYSIS OF …ethesis.nitrkl.ac.in/4706/1/109MN0474.pdf · assessement...
42
ASSESSEMENT OF UNCERTAINITY ANALYSIS OF MINE FANS BY STUDYING VENTILATION NETWORK DESIGN A THESIS SUBMITTED IN PARTIAL FULLFILLMENT OF THE REQUIREMENTS FOR THE DEGREE OF Bachelor of Technology In Mining Engineering By ROSHAN LAKRA 109MN0474 DEPARTMENT OF MINING ENGINEERING NATIONAL INSTITUTE OF TECHNOLOGY ROURKELA – 769008 April, 2013
Transcript of ASSESSEMENT OF UNCERTAINITY ANALYSIS OF …ethesis.nitrkl.ac.in/4706/1/109MN0474.pdf · assessement...
i
ASSESSEMENT OF UNCERTAINITY ANALYSIS OF MINE
FANS BY STUDYING VENTILATION NETWORK DESIGN
A THESIS SUBMITTED IN PARTIAL FULLFILLMENT OF THE
REQUIREMENTS FOR THE DEGREE OF
Bachelor of Technology
In
Mining Engineering
By
ROSHAN LAKRA
109MN0474
DEPARTMENT OF MINING ENGINEERING
NATIONAL INSTITUTE OF TECHNOLOGY
ROURKELA – 769008
April, 2013

i
ASSESSEMENT OF UNCERTAINITY ANALYSIS OF MINE
FANS BY STUDYING VENTILATION NETWORK DESIGN
A THESIS SUBMITTED IN PARTIAL FULFILLMENT OF THE
REQUIREMENTS FOR
THE DEGREE OF
BACHELOR OF TECHNOLOGY
IN
MINING ENGINEERING
BY
ROSHAN LAKRA
109MN0474
Under the Guidance of
DR. S. CHATTERJEE
ASSISTANT PROFFESSOR
DEPARTMENT OF MINING ENGINEERING
NATIONAL INSTITUTE OF TECHNOLOGY
ROURKELA-769008
2012-2013

ii
National Institute of Technology
Rourkela
CERTIFICATE
This is to certify that the thesis entitled “Assessement of uncertainity analysis of mine fans by
studing ventilation network design” submitted by Sri Roshan Lakra (Roll No. 109mn0474) in
partial fulfilment of the requirements for the award of Bachelor of Technology degree in Mining
Engineering at the National Institute of Technology, Rourkela is an authentic work carried out by
him under my supervision and guidance.
To the best of my knowledge, the matter embodied in the thesis has not been submitted to any
other University/Institute for the award of any Degree or Diploma.
Date: Dr. Snehamoy Chatterjee
Assistant Professor
Department of Mining Engineering
National Institute of Technology
Rourkela – 769008

iii
ACKNOWLEDGEMENT
I wish to express our deep sense of gratitude and indebtedness to Dr. Snehamoy Chatterjee,
Assistant Professor, Department of Mining Engineering, NIT, Rourkela; for introducing the
present topic and for his inspiring guidance, constructive and valuable suggestion throughout this
work. His able knowledge and expert supervision with unswerving patience fathered our work at
every stage, for without his warm affection and encouragement, the fulfillment of the task would
have been very difficult.
We would also like to convey our sincere thanks to the faculty and staff members of Department
of Mining Engineering, NIT Rourkela, for their help at different times.
Last but not least, our special thanks to my co-project workers and all other friends and family
members who have patiently extended all sorts of help for accomplishing this project.
Date: ROSHAN LAKRA
109MN0474
Mining Engineering

iv
ABSTRACT
The objective of a ventilation network system is to provide the desire quantity of airflows
throughout the mine such that the workers can work underground in a safe and healthy
environment at the level specified by the mining regulations.
In coal mines the ventilation network system has a greater impact on safety and production. The
selections of mine fan and air quantity calculation at different working places are generally
decided by solving the ventilation network using iterative Hardy-Cross method
In this thesis, an approach was adopted to simulating the ventilation network considering the
airways resistances as uncertain variables. A Monte-Carlo simulation-based approach was
followed to generate random set of resistance values from the distribution functions of the
airways resistances. The VENTSIM software was used to solve the Hardy-Cross method for
ventilation network simulation using one set of random resistance values. The Monte-Carlo
simulation based approach helps to analysis the uncertainty of air quantity at specific working
faces as well as total quantity required for ventilating the mine. The major focus of the thesis is
towards the quantity of air in the working face generated by the mine main fan and the risk
involve with the selection of mine main fan for a coal mine.
The methodology for the ventilation network design proposed in this thesis was applied in a
underground coalmine in Eastern part of India. The airways resistances are calculated by
measuring the values at different places in same airways. The mean and standard deviation used
for Monte-Carlo simulation assuming the distribution is Gaussian. A total number of 71 airways
are simulated in the case study mine. A risk analysis of quantity of air reaching at face was
performed at two working faces by generating 200 realizations The results in this thesis was
validated my measuring quantity at different measuring station in this mine.

v
CONTENTS
Certificate…………………………………………………………………………………….…ii
Acknowledgement……………………………………………………………………………...iii
Abstract…………………………………………………………………………………………iv
List of figures…………………………………………………………………………………...vi
List of tables……………………………………………………………………………………vii
Chapter1: Introduction
1.Introduction……………………………………………………………………….…..2
2.Objective………………………………………………………………………………4
Chapter2: Literature Review
2.literature review……………………………………………………………………….6
Chapter3: Methodology
3. Methodology…………………………………………………………………………11
3.1. Ventilation Circuits………………………………………………………………...11
3.2. Method for solving ventilation network…………………………………………..13
3.3. Hardy cross method…………………………………………………………….….13
3.4. Monte carlo method………………………………………………………………..16
Chapter4: Validation of model
4.1. model validation…………………………………………………………………...19
Chapter5: Case Study
5.1. Result and analysis………………………………………………………………...21
Chapter6: Conclusion…………………………………………………………………….…..31
Chpater7: References……………………………………………………………………..…..33
vi
List of figures
Figure.1 operating point of the fan……………………………………………………...8
Figure.2 pressure vs airflow variation at small increments (McPherson, 1993)………14
Figure.3 simulated model design of a ventilation network of a coal mine…………….25
figure.4 histogram plotted for working face no.50…………………………………….26
Figure.5 probability distribution curve for working face no.50……………………….27
Figure.6 histrogram plotted for working face no.4……………………………………27
Figure.7 probability distribution curve for working face no.4………………………..28
Figure.8 histrogram plotted for working face no.3……………………………………28
Figure.9 probability curve of the working face number 3…………………………….29

vii
List of tables
Table:1 details of the ventilation system………………………………………………………21
Table.2. table for network summary of the simulated network model……………………...22
Table:3. Mean and variance of 71 airways………………………………………………….…26

1
Chapter 1
INTRODUCTION

2
INTRODUCTION
Underground mine ventilation is an utter important job for the occupational health and safety of
underground employees (Ramani 1992a). Underground mine ventilation provides a flow of air to
the underground workings of a mine of sufficient volume to dilute and remove noxious gases,
typically NOx, SO2, methane, CO2 and CO. The underground atmosphere is contaminated from
dust, aerosols, diesel fumes and particulates and fumes from strata by various operations.
Oxygen reduction may also take place due to recirculation of ventilating air where diesel engines
are operating. To protect employees against the risk and the consequences of underground fires
and unplanned explosions, it is important to maintain a healthy working environment
underground (Bandopadhyay 1992). Correct design, implementation and maintenance of mine
ventilation is therefore of fundamental importance.
The largest component of the operating cost for mine ventilation is electricity to power the
ventilation fans, which may account for one third of a typical underground mine's entire
electrical power cost. The design of ventilation system in an underground mine has several
considerations to be made to solve the problems arising from it like wear of machine parts,
decrease in efficiency of the fan with time, estimating the quantity of air required in the mine to
ventilate each district properly, the maintenance of pressure, selection of proper installation site
of the fan, resistance offered by the roadways, supports, stoppings, etc.
Design methods of mine ventilation system can be categorized into three groups: ( 1 ) analytical
methods, (2) empirical methods and (3) observational methods (Ramani 1992b). Analytical
methods deal with fundamental concepts of fluid mechanics in conjunction with applied
mathematics. Empirical methods include the governmental, health and safety regulations as well
as experimental rules. Observational methods rely on consistently monitoring the ventilation
system in the course of time. Incessantly measuring and inspecting the amount of harmful or
explosive gases, air velocity and quantity and air pressure are the chief essence of this method.
Therefore, a primary ventilation system cannot be developed unless observational methods are
taken into account. Using the above mentioned methods appropriately, a perfect ventilation
system for both initial and further stages of mining will be achieved.

3
The control of primary ventilation flows or circuits in a mine requires careful planning from the
design stage and thereafter throughout the operating life of the mine. For initial design of any
mine or a planned upgrade, the computer simulation of the ventilation network is helpful for
solving complex ventilation systems with many features including fan selection and optimal fan
location selection; determining optimal fan settings for efficient operation; determining the
amount of regulation required to control airflow; selection of locations for doors and regulators;
determining the effect of air leakage on the overall system; and, determining possible effects of
improvements/changes to airways (Hartman, 1997):
To simulate airflows, quantity, resistance, pressure and heats and many other types of ventilation
data from a modeled network of airways, different ventilation software are used. To develop a
computerized monitoring system to provide immediate or real time simulated information on
each branch within an underground ventilation network. The system measures airflow or air
pressure changes in selected ventilation branches and simulates flows through all mine sections.
Once the simulation program has updated readings it can remodel the whole mine system, report
the flows in all branches and compare individual branch readings with expected values.
The conventional approach to ventilation network simulation considered the deterministic
airways resistance. However, major shortcoming of this approach is that the uncertainties related
to lack of accurate airways resistance parameters, errors in measuring airway length and
perimeters properties leads to wrong simulated results.
Due to the importance of ventilation network simulation, determination of airways air quantity
has a significant consequence to decision makers. With respect to the uncertainties of airways
resistance parameters, utilizing risk analysis is essential for ventilation performance.
Conventional approaches do not take into account many uncertainties in their calculations
quantitatively. To avoid such misleading results, probabilistic approaches of the ventilation
network simulation with reliability analysis is preferred.

4
Objectives:
In order to solve the problems incurring in mine ventilation design with uncertain airways
resistance, it is highly essential to simulate the mine ventilation network. Hence the objective of
this study includes:
Network Simulation by Hardy Cross method.
Incorporating the uncertainty for the airways.
Risk analysis by Monte Carlo simulation
Validation of the model.

5
Chapter 2
LITERATURE REVIEW

6
LITERATURE REVIEW:
2.1. Tradition approach of ventilation:-
The major purpose of the methods was to ventilate the working areas. In the tradition method the
volume of air flow in the working areas determined at a preliminary stage of planning and the
empirical values of the airflow based on tonnage can also be used. The airflow required by
different parts of the mine like the development areas, mechanical plant, leakage are estimated.
In many mines the efficiency is very low. Inaccuracies in estimates of airflow through each
leakage paths cause major error in main ventilation path. The square law, p=RQ2 , cause twice
the percentage error in the frictional pressure drop. To solve the leakage along the path was the
major challenge faced by the traditional method of ventilation. The quantity of airflow Q is
estimated in every major airways. By using the the given size of airways and airflow determine
the air velocity. The need for the additional airways can be made. The resistance, R of is
determined either from estimated frictional factors or on the basis of local empirical data. Using
the square law, p = RQ2 detrmine the frictional pressure drop for individual airways.
2.2. Mine Fan
A fan is a device that utilizes the mechanical energy of a rotating impeller to produce both
movement of the air and an increase in its total pressure. Primary mine fans are generally either
centrifugal fans or axial flow fans. Most fans today are of the axial flow type (Hartman et al.
1997).
Mine fans were classified in terms of their location, main fans handling all of the air passing
through the system, booster fans assisting the through-flow of air in discrete areas of the mine
and auxiliary fans to overcome the resistance of ducts in blind headings.
Fans may also be classified into two major types with reference to their mechanical design. A
centrifugal fan resembles a paddle wheel. Air enters near the center of the wheel, turns through a
right angle and moves radially outward by centrifugal action between the blades of the rotating
7
impeller. Those blades may be straight or curved either backwards or forwards with respect to
the direction of rotation. Each of these designs produces a distinctive performance characteristic.
An axial fan relies on the same principle as an aircraft propeller, although usually with many
more blades for mine applications. Air passes through the fan along flow paths that are
essentially aligned with the axis of rotation of the impeller and without changing their macro-
direction.
Fan total pressure can be divided into two components i.e. Fan static pressure and fan velocity
pressure
Fan velocity pressure is the average velocity pressure at fan outlet only. Fan total pressure is the
increase in total pressure due to fan. Fan static pressure is the difference between the fan total
pressure and fan velocity pressure.
In deep mines or where workings have become distant from surface connections the pressures
required to be developed by main fans may be very high in order to maintain acceptable face
airflows. This leads to practical difficulties at airlocks and during the transportation of personnel,
mined mineral and materials. More serious, however, is the fact that higher pressures at main
fans inevitably cause greater leakage throughout the entire system. Any required fractional
increase in face airflows will necessitate the same fractional increase in main fan volume flows
for any given system resistance. Hence, as both fan operating power and costs are proportional to
the product of fan pressure and airflow, those costs can rapidly become excessive as a large mine
continues to expand. In such circumstances, the employment of booster fans provides an
attractive alternative to the capital penalties of driving new airways, enlarging existing ones, or
providing additional surface connections.
Unlike the main fans which, in combination, handle all of the mine air, a booster fan installation
deals with the airflow for a localized area of the mine only. It has frequently been the case that
the installation of underground booster fans has resulted in improved ventilation of a mine while,
at the same time, producing significant reductions in total fan operating costs. Furthermore, if
booster fans are improperly located or sized then they may result in undesired recirculation.

8
2.3. Mine fan selection:
A fan is a mechanical device which utilizes the mechanical energy of a rotating impeller to
produce the required quantity of air and increase in its total pressure. So the selection of proper
fan for the mine is important. The selection of the mine fan can be done in the planning stage ,
for more detailed selection the nomogram method can also be used, an exact selection with the
help of a complete technical data can be done by using computer based programs.
Figure1. operating point of the fan
The selection of fans is based on fan curve data provided by the manufacturer’s. A fan is
selected on the basis of the available pitch setting. Although at this point in time, the cost of a
fixed pitch fan is the same as an adjustable pitch fan (Spendrup 2005).

9
2.4. Booster fan
A booster fan basically used in underground mines installed in series with a main surface fan
which is used to boost the pressure of air current passing through. It can also be used to
reduce air leakage and decreased main fan pressure.
Advantages:
Increase flow rates.
Equally distribute the air through out the mines.
Provide air to area difficult to access.
Increase flow of the air in heavy resistance airways paths.
Disadvantages:
Problems if main fan /booster fan stops.
Heavy noise, dust generated by booster fans.
It reduce ability to control recirculation of mine air.
Ventilation can be interrupted upto a greater extent if booster fan stop working.

10
Chapter 3
METHODOLOGY
11
3. METHODOLOGY
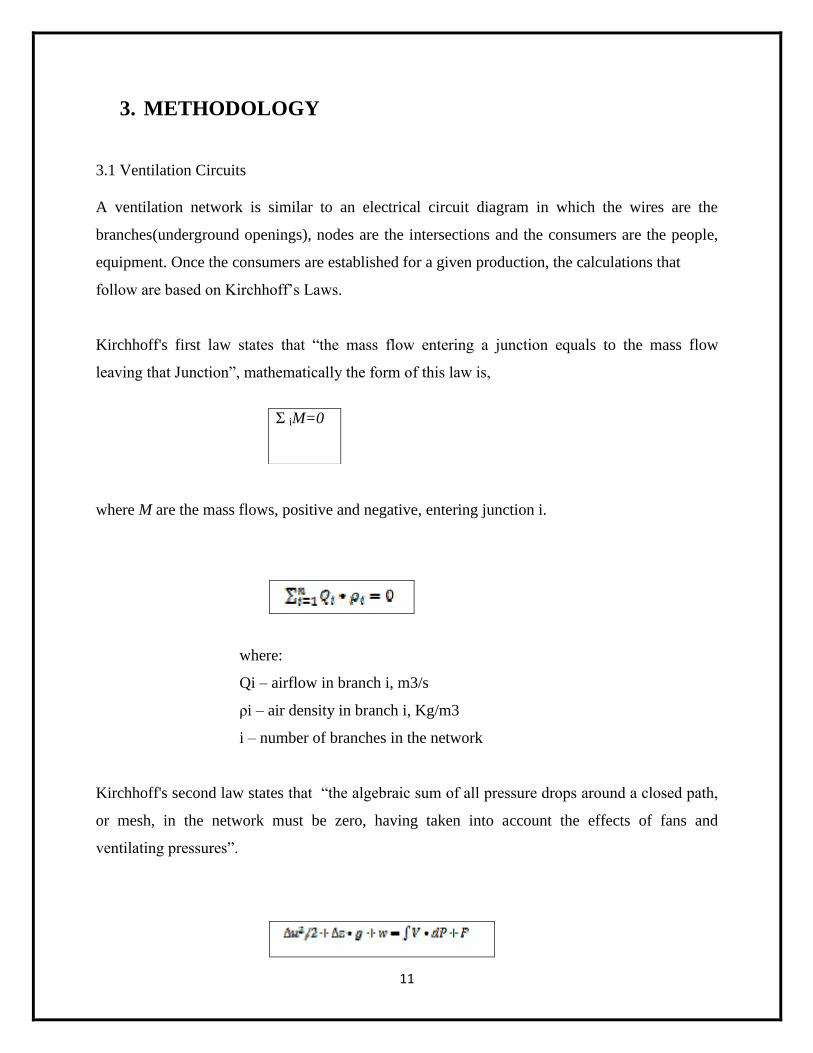
3.1 Ventilation Circuits
A ventilation network is similar to an electrical circuit diagram in which the wires are the
branches(underground openings), nodes are the intersections and the consumers are the people,
equipment. Once the consumers are established for a given production, the calculations that
follow are based on Kirchhoff’s Laws.
Kirchhoff's first law states that “the mass flow entering a junction equals to the mass flow
leaving that Junction”, mathematically the form of this law is,
where M are the mass flows, positive and negative, entering junction i.
where:
Qi – airflow in branch i, m3/s
ρi – air density in branch i, Kg/m3
i – number of branches in the network
Kirchhoff's second law states that “the algebraic sum of all pressure drops around a closed path,
or mesh, in the network must be zero, having taken into account the effects of fans and
ventilating pressures”.
Σ iM=0

12
where:
u – air velocity, m/s
z – elevation above the reference, m
w – work input from fan, J/Kg
V – specific volume, m³/Kg
P – barometric pressure, Pa
F – work done against friction, J/Kg
The terms ∆z and ∆u2/2 will be approaching zero as the mesh is closed. The term - ∫ V • dP is the
natural ventilating energy. With these two changes, the new form for this law becomes:
And, if we convert this in pressure units:
where ρ is the standard air density, Kg/m3.
So the final form for Kirchoff’s Second Law is:

13
3.2. Method of solving ventilation network.
There are basically two methods of approach to the analysis of the network. The analytical
methods involve formulating the governing laws into sets of equations that can be solved
analytically to give exact solutions. The numerical methods that have come to the fore with the
availability of electronic digital computers solve the equations through iterative procedures of
successive approximation until a solution is found to within a specified accuracy.
3.3. Hardy cross method.
In the Hardy- Cross method of analysis, the airflow and pressure drop can be stated as;
Q = Qa + ∆Q
P = Pa + ∆P
Where:
Qa – initial estimation of the airflow, m³/s
∆Q – error in the initial estimation, m³/s
Pa – pressure drop corresponding to Qa, Pa
∆P - error in pressure drop corresponding to _Q, Pa
14
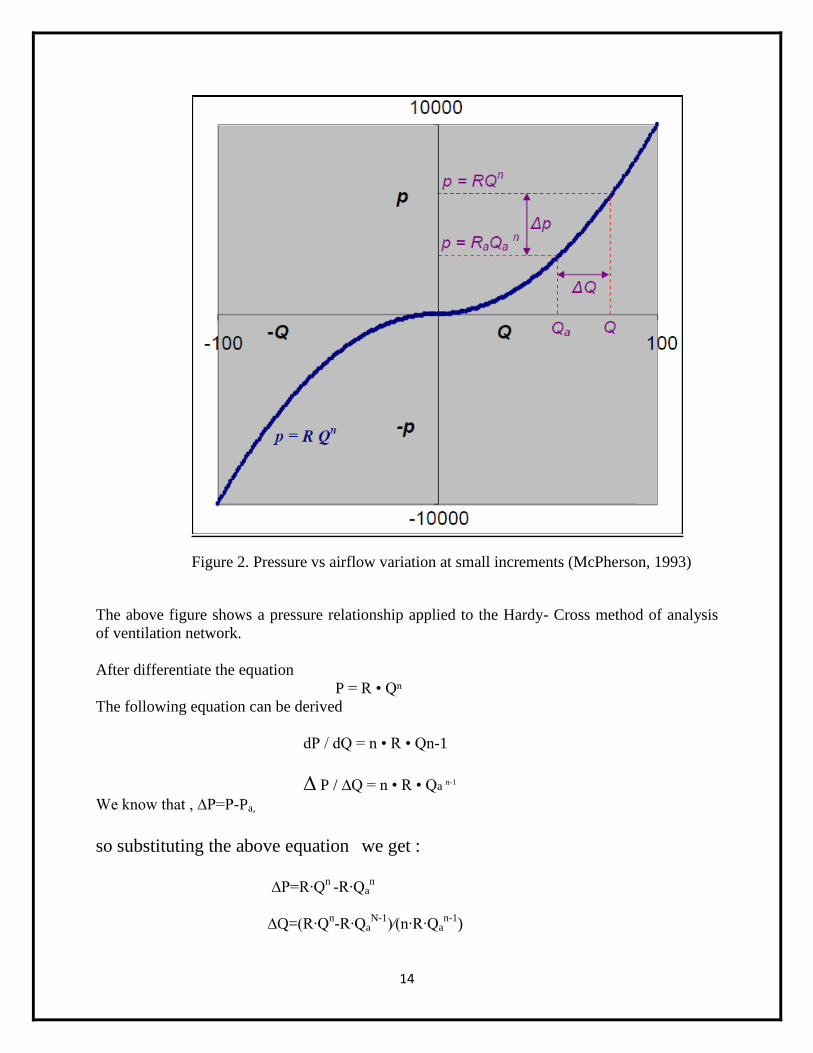
Figure 2. Pressure vs airflow variation at small increments (McPherson, 1993)
The above figure shows a pressure relationship applied to the Hardy- Cross method of analysis
of ventilation network.
After differentiate the equation
P = R • Qⁿ
The following equation can be derived
dP / dQ = n • R • Qn-1
∆ P / ∆Q = n • R • Qa n-1
We know that , ∆P=P-Pa,
so substituting the above equation we get :
∆P=R∙Q
n -R∙Qa
n
∆Q=(R∙Qn-R∙Qa
N-1)∕(n∙R∙Qa
n-1)
15
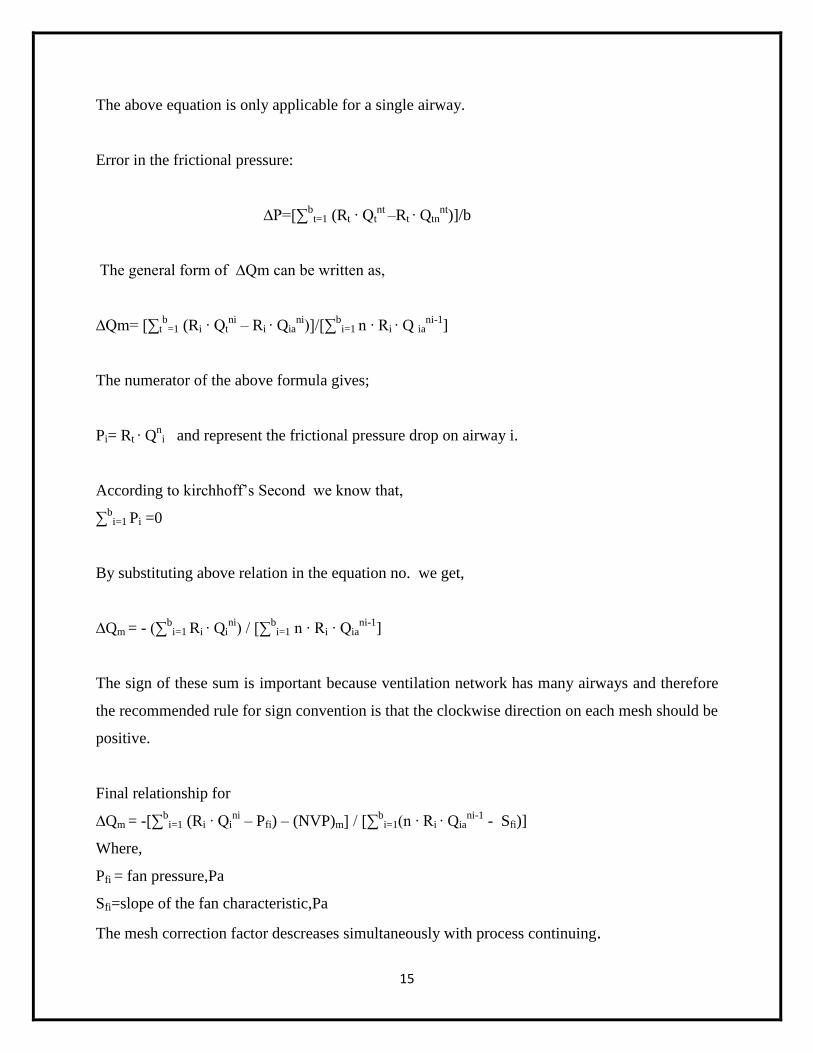
The above equation is only applicable for a single airway.
Error in the frictional pressure:
∆P=[∑b
t=1 (Rt ∙ Qtnt
–Rt ∙ Qtnnt
)]/b
The general form of ∆Qm can be written as,
∆Qm= [∑tb
=1 (Ri ∙ Qtni
– Ri ∙ Qiani
)]/[∑b
i=1 n ∙ Ri ∙ Q iani-1
]
The numerator of the above formula gives;
Pi= Rt ∙ Qn
i and represent the frictional pressure drop on airway i.
According to kirchhoff’s Second we know that,
∑b
i=1 Pi =0
By substituting above relation in the equation no. we get,
∆Qm = - (∑b
i=1 Ri ∙ Qini
) / [∑bi=1 n ∙ Ri ∙ Qia
ni-1]
The sign of these sum is important because ventilation network has many airways and therefore
the recommended rule for sign convention is that the clockwise direction on each mesh should be
positive.
Final relationship for
∆Qm = -[∑b
i=1 (Ri ∙ Qini
– Pfi) – (NVP)m] / [∑b
i=1(n ∙ Ri ∙ Qiani-1
- Sfi)]
Where,
Pfi = fan pressure,Pa
Sfi=slope of the fan characteristic,Pa
The mesh correction factor descreases simultaneously with process continuing.

16
3.4. Monte Carlo method
Monte Carlo means using random numbers in scientific computing. More precisely, it means
using random numbers as a tool to compute something that is not random. 'Monte
Carlo simulation' is more specifically used to describe a method for propagating (translating)
uncertainties in model inputs into uncertainties in model outputs (results). Hence, it is a type of
simulation that explicitly and quantitatively represents uncertainties. Monte Carlo simulation
relies on the process of explicitly representing uncertainties by specifying inputs as probability
distributions. If the inputs describing a system are uncertain, the prediction of future
performance is necessarily uncertain. That is, the result of any analysis based on inputs
represented by probability distributions is itself a probability distribution.
In order to compute the probability distribution of predicted performance, it is necessary
to propagate (translate) the input uncertainties into uncertainties in the results. A variety of
methods exist for propagating uncertainty. Monte Carlo simulation is perhaps the most common
technique for propagating the uncertainty in the various aspects of a system to the predicted
performance.
In Monte Carlo simulation, the entire system is simulated a large number of times. Each
simulation is equally likely, referred to as a realization of the system. For each realization, all of
the uncertain parameters are sampled (i.e., a single random value is selected from the specified
distribution describing each parameter). The system is then simulated through time (given the
particular set of input parameters) such that the performance of the system can be computed.
This result is a large number of separate and independent results, each representing a possible
“future” for the system (i.e., one possible path the system may follow through time). The results
of the independent system realizations are assembled into probability distributions of possible
outcomes. As a result, the outputs are not single values, but probability distributions.
The accuracy of a Monte Carlo simulation is a function of the number of realizations. That is, the
confidence bounds on the results can be readily computed based on the number of
realizations. This Monte Carlo simulation Method consists of following steps:
1. Choosing a random value for each input variable according to assigned probability density
function.

17
2. Calculating air quantity at different airways by using a Hardy-Cross method based on selected
values in step 1.
3. Repeating steps 1 and 2 for many times as necessary.
4. Determining distribution function of air quantity at different airways.
Following steps were followed in the thesis:
Step 1: The ventilation data from the coal mine was obtained by carrying ventilation survey in
different measuring station. The data was tabulated serially to analyse the uncertainity of the fan.
Step 2: Model was plotted and simulated based on the provided data.
Step 3: Based on the individual airways resistance of the actual simulated ventilation network,
200 random normal resistances was generated.
Step 4: Taking the actual resistance as the mean, variance is calculated and 200 more random
normal resistances was generated using the man and variance for each airways.
Step 5: Validation of the network model is done by using VENTSIM.
Step 6: Then quantity of airflow in three working faces were obtained.
Step 7: Histrogram were plotted for each of the working face and compared with the histrogarm
of the fan quantity.

18
CHAPTER 4
VENTILATION MODELING

19
4. VENTILATION MODELING
The simulation of the coal mine ventilation network was performed using the computer
ventilation software VENTSIM. The evaluation of airflow in the airways is based on the Hardy
Cross method, an iteration estimation method used to adjust the air quantity flow through the
airways until the estimation errors lie within acceptable limits.
The ventilation model is designed to reflect the existing mine structure as well as the future
planned extension. Each airways carries parameters such as length, height , width, friction…etc.
These parameters used to calculate resistance, quantity, pressure.
A very important step in designing a ventilation network is to determine the minimum airfow for
different working faces of the mine. The quantity and quality of airflow must meet the airflows
required by the Mining Acts and Regulations.
Based on the type of system required, the ventilation model can fix the airflow on a airway.
Ventilation models use a fan database inbuild within the softwate VENTSIM. Each fan curve
input in the database is build based on the manufacturer fan curve.

20
Chapter 5
CASE STUDY:
RESULTS AND DISCUSSIONS
21
CASE STUDY:
RESULTS AND DISCUSSIONS
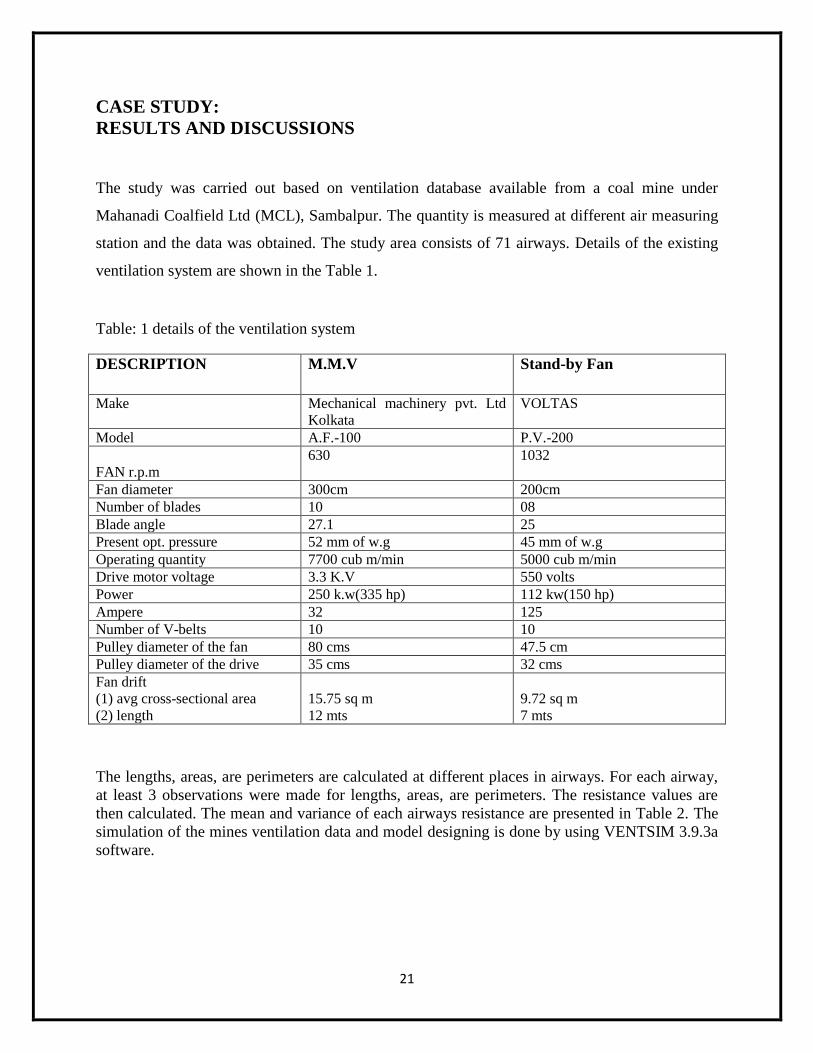
The study was carried out based on ventilation database available from a coal mine under
Mahanadi Coalfield Ltd (MCL), Sambalpur. The quantity is measured at different air measuring
station and the data was obtained. The study area consists of 71 airways. Details of the existing
ventilation system are shown in the Table 1.
Table: 1 details of the ventilation system
DESCRIPTION M.M.V Stand-by Fan
Make Mechanical machinery pvt. Ltd
Kolkata
VOLTAS
Model A.F.-100 P.V.-200
FAN r.p.m
630 1032
Fan diameter 300cm 200cm
Number of blades 10 08
Blade angle 27.1 25
Present opt. pressure 52 mm of w.g 45 mm of w.g
Operating quantity 7700 cub m/min 5000 cub m/min
Drive motor voltage 3.3 K.V 550 volts
Power 250 k.w(335 hp) 112 kw(150 hp)
Ampere 32 125
Number of V-belts 10 10
Pulley diameter of the fan 80 cms 47.5 cm
Pulley diameter of the drive 35 cms 32 cms
Fan drift
(1) avg cross-sectional area
(2) length
15.75 sq m
12 mts
9.72 sq m
7 mts
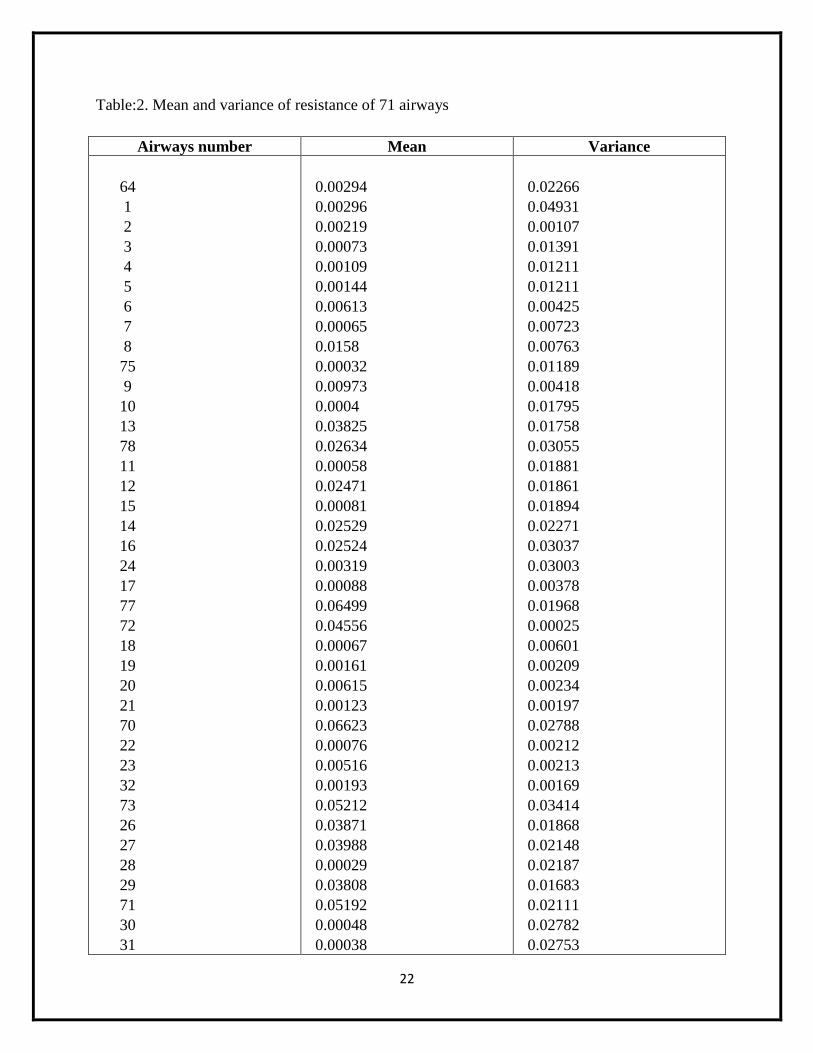
The lengths, areas, are perimeters are calculated at different places in airways. For each airway,
at least 3 observations were made for lengths, areas, are perimeters. The resistance values are
then calculated. The mean and variance of each airways resistance are presented in Table 2. The
simulation of the mines ventilation data and model designing is done by using VENTSIM 3.9.3a
software.
22
Table:2. Mean and variance of resistance of 71 airways
Airways number Mean Variance
64
1
2
3
4
5
6
7
8
75
9
10
13
78
11
12
15
14
16
24
17
77
72
18
19
20
21
70
22
23
32
73
26
27
28
29
71
30
31
0.00294
0.00296
0.00219
0.00073
0.00109
0.00144
0.00613
0.00065
0.0158
0.00032
0.00973
0.0004
0.03825
0.02634
0.00058
0.02471
0.00081
0.02529
0.02524
0.00319
0.00088
0.06499
0.04556
0.00067
0.00161
0.00615
0.00123
0.06623
0.00076
0.00516
0.00193
0.05212
0.03871
0.03988
0.00029
0.03808
0.05192
0.00048
0.00038
0.02266
0.04931
0.00107
0.01391
0.01211
0.01211
0.00425
0.00723
0.00763
0.01189
0.00418
0.01795
0.01758
0.03055
0.01881
0.01861
0.01894
0.02271
0.03037
0.03003
0.00378
0.01968
0.00025
0.00601
0.00209
0.00234
0.00197
0.02788
0.00212
0.00213
0.00169
0.03414
0.01868
0.02148
0.02187
0.01683
0.02111
0.02782
0.02753

23
33
69
35
36
37
38
39
40
41
42
43
44
45
46
47
48
49
50
51
52
67
54
55
68
57
58
59
60
61
62
65
66
0.00075
0.05106
0.00179
0.00227
0.00121
0.00204
0.00143
0.00547
0.07269
0.00469
0.00296
0.03242
0.0011
0.00121
0.00094
0.00031
0.00038
0.00212
0.02193
0.00144
0.03698
0.00367
0.00231
0.04612
0.00071
0.00266
0.00033
0.0004
0.00062
0.00136
0.00048
0.00197
0.01801
0.03448
0.00188
0.00045
0.00034
0.00022
0.00013
0.02084
0.04092
0.00182
0.00087
0.01962
0.0023
0.00136
0.00204
0.01575
0.01052
0.00028
0.02131
0.01944
0.01857
0.00138
0.02112
0.01995
0.03451
0.01853
0.02043
0.02231
0.02266
0.0012
0.02256
0.00075
Monte Carlo Simulation was performed to calculate the expected value of quantity flows through
different airways, and the risk of not achieving specific quantity in different airways. According
to Monte Carlo simulation method, a random value has been selected for each airway resistance
based on the assigned probability density function. Theoretically, the more Monte Carlo trials the
more accurate the solution will be, but the number of required Monte Carlo trials is dependent on
the level of confidence in the solution and the amount of variables being considered. Since, the
24
number of resistance values calculated in each airways are limited, fitting the theoretical
distribution functions with these parameters are difficult. In this paper, the distributions are
considered Gaussian distribution.
In this Monte Carlo simulation, the ventilation network simulation was performed by Hardy-
Cross method. A total number of 200 trials were made for ventilation network simulation. Figure
3 represents the quantity at different airways for a single run. The summary statics of the
ventilation network is presented in Table 3. The total mine resistance is found to be 0.01131 Ns2
/ m8 and the total airflow throughout the network is 7819 m
3/s. Since the variability of the
airways resistances are normally distributed, the probability density functions of the safety
factors are also normally distributed as expected.

25
Figure.3 simulated model design of a ventilation network of a coal mine
26
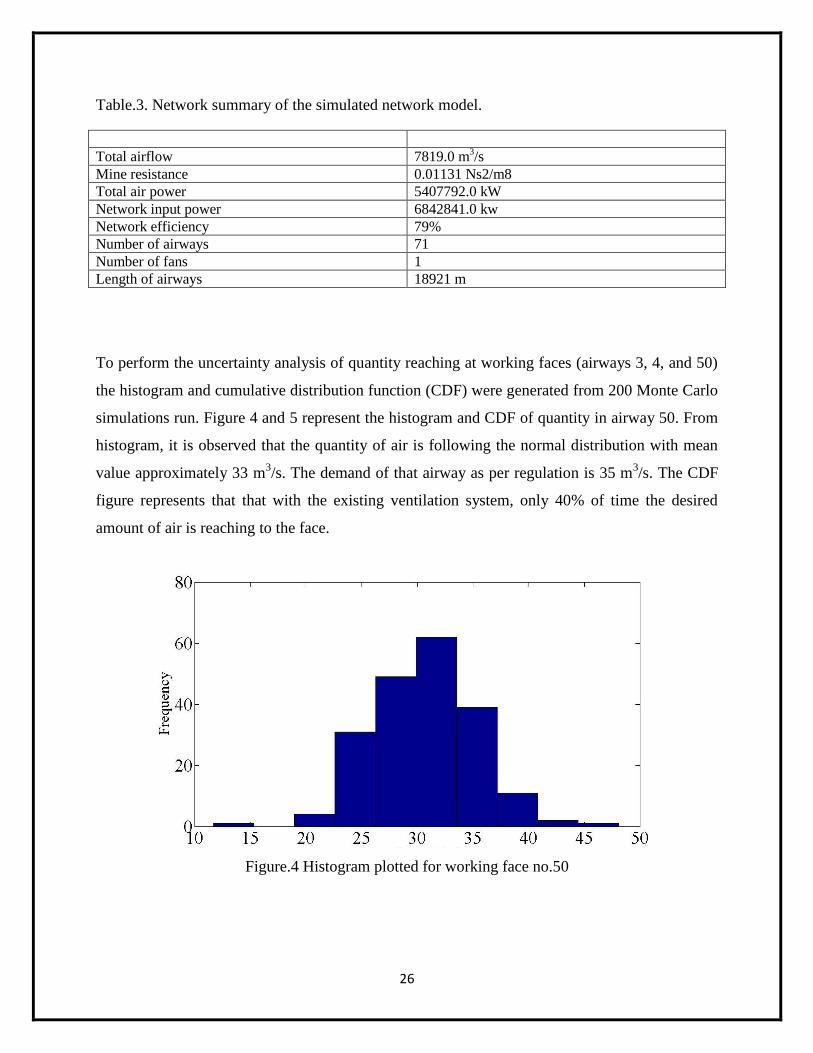
Table.3. Network summary of the simulated network model.
Total airflow 7819.0 m3/s
Mine resistance 0.01131 Ns2/m8
Total air power 5407792.0 kW
Network input power 6842841.0 kw
Network efficiency 79%
Number of airways 71
Number of fans 1
Length of airways 18921 m
To perform the uncertainty analysis of quantity reaching at working faces (airways 3, 4, and 50)
the histogram and cumulative distribution function (CDF) were generated from 200 Monte Carlo
simulations run. Figure 4 and 5 represent the histogram and CDF of quantity in airway 50. From
histogram, it is observed that the quantity of air is following the normal distribution with mean
value approximately 33 m3/s. The demand of that airway as per regulation is 35 m
3/s. The CDF
figure represents that that with the existing ventilation system, only 40% of time the desired
amount of air is reaching to the face.
Figure.4 Histogram plotted for working face no.50

27
Figure.5 Probability distribution curve for working face no.50
Figure 6 and 7 represent the histogram and CDF of quantity at face in airway 4. The mean
quanity reaching that face in 22.3 m3/s. As per regulation, the amount of air required at that face
is 20 m3/s. Therefore, it is clearly observed from the CDF that the risk of not meeting required
quantity 42%.
Figure.6 Histrogram plotted for working face no.4

28
Figure.7 Probability distribution curve for working face no.4
Figure 8 and 9 represent histogram and CDF of quantity of air in airway number 3. The expected air
quantity is 9.1 m3/s and the probability of not reaching the desire quantity of air (10 m
3/s) is 58%.
Figure.8 Histrogram plotted for working face no.3

29
Figure.9 Probability curve of the working face number 3.

30
Chapter 6
CONCLUSION

31
Conclusion
The uncertainty analysis of mine fan is studied by simulation network systems. From the above
study, the following conclusions can be drawn:
The maximum and minimum variance simulated is 0.07269 and 0.00029 respectively.
The maximum and minimum quantity of air flowing to the working face number 50 is
40.1 m3/s and 11.7 m3/s
Only 40% of time the desired amount of air is reaching to the face 50; therefore risk
associated is 60%.
The maximum and minimum quantity of air flowing to the working face number 4 is 35.6
m3/s and 10.6 m3/s
The risk of not meeting required quantity at face number is 42%
The maximum and minimum quantity of air flowing to the working face number 3 is 19.8
m3/s and 1.8 m3/s .
The expected air quantity at face number 3 is 9.1 m3/s and the probability of not reaching the
desire quantity of air (10 m3/s) is 58%.

32
Chapter 7
REFERENCES

33
REFERENCES
1. Sarac.S and Sensogut.C(2000) “A combined method for the analysis of mine ventilation
networks”, pp-371
2. Cristian F. Gherghel (2010), “The influnce of ventilation modeling on production
planning”, pp-37-51
3. Malcolm J. McPherson(1993) “ subsurface ventilation and environmental engineering”
,pp-5-40
4. Mackay D.J.C, “Introduction to monte carlo methods” , pp-1-4
5. Malcolm J. M., (1993)“subsurface ventilation and environmental engineering” ,pp-3-20
6. Exikis, A and Kapageridis, I.K. 2006. “Simulation of air and contaminant flow in
underground mine ventilation networks”, pp-1-2
7. Hartman, H.L. 1997. Mine Ventilation and Air Conditioning, Third Edition. New York:
John Wiley & Sons, Inc.
8. Spendrup, J.2005. "Re: Request for Information." Ed. Tyson Murphy.
9. Habibi, A. and Gillies S. 2012. “Use of booster fans in underground coal mining to
advantage”,pp-1-4
10. Ramımı. R. V.. 1992a."Mme Ventilation" chap 11.6 m SME Mining Engineering
Handbook. 2"'1 ed.. H. L. Hartman, sr. ed.. SME. Littleton. CO,p.l()52- 1092.
11. Ramani. R. V.. 1992b. "Mine Ventilation Design: Coal Mine Ventilation" sec. 11.7.2 in
SME Min ing Engineering Hamlbimk. 2'"' éd., H. L. Hartman, sr. ed., SME. Littleton.
CO.pp.l 106-1121.
12. Bandopadhyay. S. 1992. "Mine Ventilation Design: Coal Mine Ventilation" sec. 11.7.2 in
SME Min ing Engineering Handbook. 2'"' ed., H. L. Hartman, sr. ed.. SME. Littleton.
CO.pp.l 139-II53.

34