ASSESSEMENT OF CUSTOMERS’ BRAND SWITCHING OF BEERS: …
81
ASSESSEMENT OF CUSTOMERS’ BRAND SWITCHING OF BEERS: IN THE CASE OF BREWERY INDUSTRY IN NORTH GONDAR REGION DR KOPPALA VENUGOPAL Professor Department of Marketing Management College of Business and Economics University of Gondar, Gondar, Ethiopia. ASCHALEW ADANE Lecturer Department of Marketing Management, College of Business and Economics, University of Gondar, Gondar, Ethiopia YIMER ASEMARE Student of Post Graduation Department of Marketing Management, College of Business and Economics, University of Gondar, Gondar, Ethiopia
Transcript of ASSESSEMENT OF CUSTOMERS’ BRAND SWITCHING OF BEERS: …
ASSESSEMENT OF CUSTOMERS’ BRAND SWITCHING
OF BEERS: IN THE CASE OF BREWERY INDUSTRY IN
NORTH GONDAR REGION
DR KOPPALA VENUGOPAL
Professor
Department of Marketing Management
College of Business and Economics
University of Gondar, Gondar, Ethiopia.
ASCHALEW ADANE Lecturer
Department of Marketing Management,
College of Business and Economics,
University of Gondar, Gondar, Ethiopia
YIMER ASEMARE
Student of Post Graduation
Department of Marketing Management,
College of Business and Economics,
University of Gondar, Gondar, Ethiopia
ISBN: 978-81-935201-4-7
First Edition: 2017
Copyright © forum4researchers
All rights reserved. No part of this book may be reproduced or utilized in any form or by any means, electronic or
mechanical, including photocopying, recording or by any information storage or retrieval systems, without
permission in writing from the publisher. No responsibility for loss occasioned to any person acting or refraining
from action as a result of any material in this publication can be accepted by the author or publisher.
Published by FORUM FOR INTELLECTUAL ACADEMICIANS AND RESEARCHERS PUBLICATIONS
ii
TABLE OF CONTENTS
ABSTRACT
CHAPTER ONE: INTRODUCTION 01 - 09
1.1 Back ground of the study
1.2. Statement of the problem
1.3 Research questions
1.4 Objective of the study
1.4.1 General objective
1.4.2 Specific objective
1.5 Scope of the study
1.6 Hypothesis
1.7. Significance of the study
1.8 Limitation of the study
CHAPTER TWO: LITRETURE REVIEW 10 - 36
2.1 INTRODUCTION
2.1.1 Top 10 beer brand in the world
2.1.2 The complete list of Ethiopian Beers
2.2 Theoretical frame work
2.3. EMPERICAL FRAME WORK
2.3.1 Product Quality
2.3.2 Price/Value for Money
2.3.3 Switching cost
2.3.4 Social Influence
2.3.5 Situational Factors
2.3.6 Demographics
2.3.7 Brand Loyalty
2.3.8 Customer Satisfaction
2.3.9 Brand Credibility
2.4. CONCEPTUAL FRAME WORK
iii
CHAPTER THREE: RESEARCH DESIGN & METHODOLOGY 37 - 41
3.1 Research design
3.2 Sample and Sampling Techniques
3.2.1 Sample size determination
3.2.2 Sample selection Techniques
3.3 Sources and Tools of Data Collection
3.4 Procedure of Data Collection
3.5 Methods of Data Analysis
3.6 Validity and Reliability
3.6.1 Validity
3.6.2 Reliability
3.7 Organization of the study
CHAPTER FOUR: - DATA ANALYSIS AND DISCUSION 42 - 57
4.1 Descriptive Statistics for demographics
4.2 Consumption pattern
4.3 Descriptive statistics for variables
4.4 .Cornbanch’s Alpha Test
4.5 Pearson correlation, regression results and discussions
4.6 Consumption of beer brands
CHAPTER FIVE: SUMMARY, CONCLUSION AND RECOMMENDATION 58 - 62
5.1 Summary
5.2 Conclusion
5.3 Recommendation
5.4 Further studies
Reference
APPENDICES ................................................................................................................................................
Annex 1፡ Questionnaire English Version
Annex 2: Statistical Output
iv
ABSTRACT
Consume brand switching behavior is basically the behavior of consumers in shifting their
attitude from one brand to another brand. Complete or fractional brand switching can exist
where customers shut all their preferences and move entirely to some other service provider.
This study examined the factors influencing beer brand switching behavior and beer
consumption pattern among the selected respondents in North Gondar region. The goal of this
paper is to identify factors affecting consumer brand switching buying behaviors at North
Gondar region, Ethiopia. The research has used cross-sectional survey method as the subset of
quantitative approach for data collection which allowed the information being collected from
sampled customers. Quantitative and qualitative questionnaire was used to measure responses of
participants. The statistical analysis method employed in this study is factor analysis using SPSS
software. This consumer brand switching behavior is a great rise due to product quality,
promotion, social influence and availability. In addition, an association between situation and
consumption pattern existed among North Gondar district residents consuming their favorite
beer. Sporting events or alone at home demonstrated heavy to moderate drinking behavior.
Therefore brewery industries should pay higher attention on beer quality, promotion and
availability/distribution. Again beer industries should build their credibility in the society in
order to become a failure because of social influences in the brand switching. Advertizing
through television during sporting event or official sponsorship with sport teams is the best
strategy to survive in the business. At the end of this paper, a set of suggestions (studies
regarding political issues, health and emotional benefits) are outlined to be investigated in the
subsequent research works.
Key Words: - Brand Switching Behavior, Consumer Behavior, product Quality, Availability,
Complete switching.
1
CHAPTER ONE: INTRODUCTION
1.1 Back ground of the study
The consumer behavior study is basically the psychology of consumers, like when, how, why
and people buy and use the products for satisfying their needs. From a marketing point of view,
the consumer behavior is, “the psychology of how consumers think, feel, reason and select
between different alternatives like brands, products and retailers” (Perner, 2006). Consumer
brand switching behaviors have been basically the behavior of consumers in shifting their
attitude from one brand to another brand (Zikiene and Bakanauskas, 2006). Brand switching is
most common with products that have no great perceived variation in quality across brands such
as beer, bottled water, dairy products, or paper towels (Munazza S. and Ilhaamie A., 2014)
The consumer brand switching behaviors have been identifying, searching, selecting and
consuming products and services for satisfying their needs and wants (Solomon etal., 2006).
Consumer behavior determines how consumers decide to buy products and what the various
factors have responsible for this area (Bhasin, 2010).
The companies are always trying to build mutual relationships with their customers through
delivering better value and fulfilling their commitments, but due to competitive business
environment, it’s becoming difficult for marketers to do so. The consumer brand switching
behavior is there in between both, companies and customers, because the consumer brand
switching behavior restricts both parties to make long term relationships between producers and
consumers; and even it breaks the pre-developed long term relationships between them (Zikiene
and Bakanauskas, 2006).
In the present competitive global market, it has been seen that organizations are increasingly
focusing on the retention of their existing customers. Thus, gaining knowledge about customers'
switching behavior has substantively important for the sustainability of any organization.
Customers' brand switching behavior is the process exhibited by a customer, behaving differently
to a particular brand and undergoes alteration in the preference of the existing product or
services. Since, consumers are the ultimate end users of any product or services, the success of
any organization depends upon the satisfaction of the consumers, if not they will switch to other
brands. When any organization loses a customer they are not only losing future earnings but also
2
incurring the cost of finding new customers. Over time loyal customers become less price
sensitive therefore, losing loyal customer means giving up high margins. Considering the
technological advancements and its easy access to every individual, customers are becoming
intolerant and they can dissolve the relationship as soon as any problem arises. Thus, customer
retention is the core concern of each and every organization (Anju, 2014).
In this process, consumers are influenced by factors that trigger their brand switching behavior.
Studies shows that, consumer brand switching is influenced by demographic characters, Product
Quality, Price, Switching cost, Change in technology, Promotions (Advertizing), Social
influences, Availability/Distribution (Carlos , 2015, Dave R, 2008 and Sana Malik, 2014).
The term beer means “…any beverage brewed from a starch (farinaceous) grain. Because the
grain is made into malt, another term for beer is malt liquor” (Goldammer & Ted, 2010).
International beer industry is besieged by five companies: Snow (chian, 5.4%), Tsungtao (chain,
2.8%), Bud light (USA, 2.5%), Budweiser (USA, 2.3%) and Skol (Brazil, 2.2%) covered about
15% of beer drink sales create worldwide. In Ethiopia St. George, Dashen, Waliya, Harrar,
Bedele, Meta, Habesha and Raya are more captivating brands (Addise admas, 2014 and
Bloomberg, 2015).
‘Ethiopia is already the second most populous country in Africa and it is developing very
quickly, with GDP rising 9-10% per annul and beer consumption. Beer is quickly becoming one
of Ethiopia’s favorite drinks, with consumption rates expected to increase by 15 percent annually
over the next five years. According to a report carried out last year by Access Capital, an Addis
Ababa-based research group, this growth in consumption have very much in line with Ethiopian
population levels and economic growth rates (Ethiopian-news, 2014).
Despite its rapid growth, the Ethiopian beer market is still in its infancy when compared to other
African countries. In 2010, beer consumption rates in the country were approximately eight (8)
liters per capita per year, according to Luc van Kamenade reports from Addis Ababa on Africa’s
newest nation. It is very small proportion when compared to Nigeria (11 liters), South Africa (60
liters) and well below the global average of 27 liters (Ethiopian-news, 2014).
3
In an increasingly more diversified beer market, with more to join soon, Heineken, one of the
world's largest brewers, comes to own old brands in Ethiopia, and yet disrupts the market with a
totally new brand. It named this brand Walya. The French company BGI, since 1922, has
operated in Ethiopia, acquiring St.George Beer. BGI Ethiopia has a 42pc share in Raya Brewery.
Dashen Brewery is another company located in Debrebrhan and in historical town Gondar which
is annually visited by about 95,000tourists.The name Dashen is taken from the famous mountain
Dashen (elevation 4523 meters) which is located 100km from the brewery and it is a home to
rare endemic fauna and flora (Addis Fortune, 2014).
Currently, Ethiopia's total beer production capacity stands at 7.1m hectoliters annually. BGI
Ethiopia's capacity stands at 2.7m hectoliters from its three factories at Addis Ababa, Hawassa
and Kombolcha. Heineken S.C., which owns Walya, Harare and Beadle breweries, has a
capacity of 2.5m hectoliters, Dashin Brewery S.C., 2.5m hectoliters, and Diageo, owner of Meta
Abo Brewery, follow with one million hectoliters respectively (Addis Fortune, 2014).
North Gondar district is west northern part of Ethiopia and home town for Dashen beer factory,
therefore suitable area for the consumer brand switching in beer industry. And there is no other
study conducted with this title in the district of the country.
In this context, the role of consumer brand switching behavior plays a significant role for
researchers. In this paper, tried to review the literature on the consumer brand switching behavior
and proposed a comprehensive outline of consumer brand switching behavior to be explored and
empirically tested in future research endeavors. At the end of this paper, we have outlined a set
of suggestions related to the consumer brand switching behavior of consumers to be investigated
in the subsequent research works.
4
1.2. Statement of the problem
The fundamental problem in predicting the customer choices exist in the fact that brand
switching decisions of the customers are slowly made on the bases of several different criteria
simultaneously which includes factors like product quality, prices, promotion etc. Thus the
frequent brand switching behavior of customers has compelled to review such factors that affect
the beer industry. Thus the problem has been more confounded in beer industry where customers
get attracted towards the competitor's offers & features and analyzes the expectations of the
customers regarding the beer industry (Solomon et al, 2006).
Beer factory managers' understanding of their customers is essential to stop them from switching
to another brand or company. According to Dibb and Meadows (2001), relationship marketing
has been one of the best approaches that are probable to meet with a lot of interest with respect to
consumer brand switching behavior. When customers dump one service provider for another it
means customer switching or swapping (Garland, 2002). Complete or fractional understanding
can exist as explained by Stewart (1998), Colgate & Hedge (2001). In complete switching,
customers shut all their preference and move entirely to some other service provider, (Bolton and
Bronkhorst, 1995, Boote, 1998 and Sana, 2014).
Among specific marketing mix variables, pricing appears to have the most consistent impact in
studies. Promotions such as sales promotions have shown influence on brand choice which
ultimately effect bottom-line prices for consumers. For example, pricing promotions could
involve coupons or simply a reduction of price within the product category (Singh et al. 2005;
Papatla and Krishnamurthi, 1996; Wagner and Taudes, 1986, Orth, 2005). In probability
modeling studies, it has been shown that displays and features have some impact on brand
choice, but this evidence is not as overwhelming or as consistent as other factors among brand
choice research studies (Chib et al. 2004; Papatla and Krishnamurthi, 1996; Alvarez and
Casielles, 2005). Product attributes have high importance on discovering what areas of the
product can be altered in order to make their brand more appealing to the consumer. According
to current research, it has been found that the greater the number of brand attributes for a
product, then the more likely the consumer is to make that particular brand choice (Greenwald et
5
al. 1986; Romaniuk, 2003). Product attributes are important to marketers in order to differentiate
products from their competitors (Aaker et al. 1992; Belch & Belch, 1995).
Switching costs as an exit barrier plays a part in the buyer seller relation and it is because of that
customers take into account the switching costs (Weiss and Anderson, (1992) Smith, (1998)
Jones et al (2000), Jackson (1985). Many researches focus on the effect of switching costs on
customer loyalty in the beer industry (Caruana, 2004 & Hu and Hwang, 2006). According to
Jones and Sasser (1995), customer switching costs would change in different sectors of the
industry.
In Brewery industries, particularly of the same products that are competing in the market place
with generally undifferentiated products; therefore, consumer brand switching becomes a main
concern and a primary competitive weapon (Stafford, 1996). The researcher prefer Gondar
district because of; Firstly Gondar District is a home for Dashen beer factory, therefore there is
competent strategic war regarding price, promotion, reducing switching cost, and etc, among
brewery factories to control the market share of the district. Secondly the district is with various
geographical altitude (form the highest point of the country North mountain (which is with very
cold atmosphere) to the low lands (which is desert area, expected there is huge demand for beer).
Finally Addis Ababa-Gondar-Metema and Addis Ababa-Gondar-Humera roots are the main
corridors in the country. And many transporters and merchants even form other part of the
country and neighbor counties (Sudan and south Sudan) pass through this root, therefore
consumers are diversified and represent the whole country.
There is a significant impact that customer brand switching can have on a firm and it is important
to understand why customers switch from their providers. Indeed, this is a point behind this
research. Hence, how many factors influence the decision making process of the consumers to
switch from the providers are the focus of this research. So, this study tries to assess customers
brand switching behaviour from one beer to other beer in North Gondar Administrative Zone.
These seven independent variables (Demographic characters, Product Quality, Price, Switching
cost, Change in technology, Promotion, availability/distribution) factors affecting consumers
brand switching behavior are not seen before in the country, also in the district. It helps to have
better understanding consumers in the area for their brand switching behavior.
6
1.3 Research questions
Taking general background of the study and statement of the problem into account, the study
tried to answer the following research questions.
RQ1: What are the factors that affect the consumer behavior towards switching from existing
brand to another brand?
RQ2: Which factors (product quality, price, switching cost, change in technology, social
influence, promotion and availability/distribution) have the most significant impact on
beer brand switching behavior?
RQ3. Which strategies can be adopted to discourage the brewery consumer brand switching
behavior?
1.4 Objective of the study
1.4.1 General objective
The general objective of the study is to determine the factor affecting consumers brand switching
behavior in beer industries in Gondar district, Ethiopia. 1.4.2 Specific objective
The specific objectives of the study are:-
To examine the most drinking breweries in the district.
To examine the average beer consumption of people in the region annually.
To examine the consumer awareness of brewery usage.
To study the reasons for consumers brand switching to other brands.
To conceptualization framework of brand switching behavior, summarizes and proliferates
consumers’ behavioral response model proposed previously by scholars and researchers from
a variety of geographical origins.
7
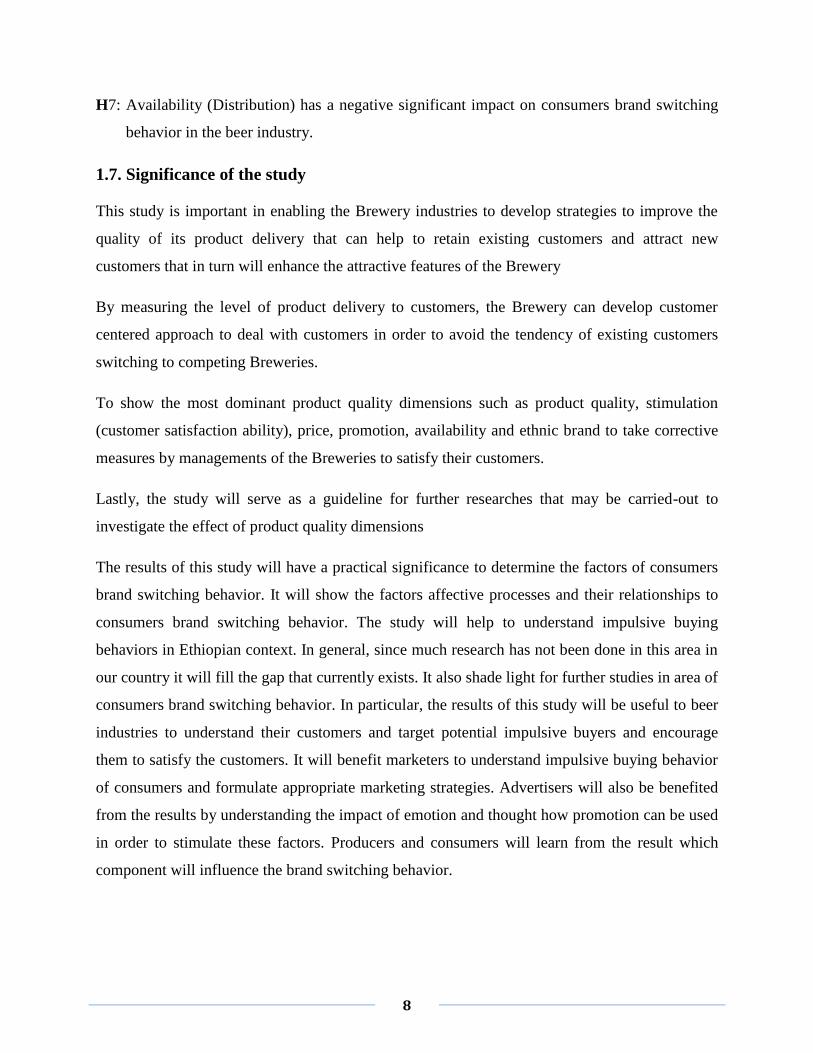
1.5 Scope of the study
This study focused on the consumer in Gondar District, which is the home of beer factory in
North West Ethiopia. By narrowing the scope of the study, it enables and increases the better
understanding on the consumers in Gondar district. Here, the results of the findings have been
the representative for the consumers in this study’s scope and are useful for the markets who
intend to have their business in Gondar district. Additionally avoids cultural biases which might
also influence the results of funding.
More over the thesis bounded only by seven variables which are product quality, price, switching
costs, change in technology, promotion, social influence and availability (distribution). Even
though there are many factors potentially can affect consumer brand switching behavior like
emotional situation ,political condition, cultural biases, and health benefits, but only the above
listed variables are enough, since, beyond these the thesis might not manageable.
1.6 Hypothesis
From set of independent variables anticipated to have significant impact on consumers brand
switching behavior, researcher formulated seven hypothesis described below:
H1: Product Quality has a positive significant impact on consumers brand switching behavior in
the beer industry.
H2: Price has a positive significant impact on consumers brand switching behavior in the beer
industry.
H3: Switching cost has a negative significant impact on consumers brand switching behavior in
the beer industry.
H4: Change in technology has a positive significant impact on consumers brand switching
behavior in the beer industry.
H5: Promotions have a positive significant impact on consumers brand switching behavior in the
beer industry.
H6: Social influences have a positive significant impact on consumers brand switching behavior
in the beer industry.
8
H7: Availability (Distribution) has a negative significant impact on consumers brand switching
behavior in the beer industry.
1.7. Significance of the study
This study is important in enabling the Brewery industries to develop strategies to improve the
quality of its product delivery that can help to retain existing customers and attract new
customers that in turn will enhance the attractive features of the Brewery
By measuring the level of product delivery to customers, the Brewery can develop customer
centered approach to deal with customers in order to avoid the tendency of existing customers
switching to competing Breweries.
To show the most dominant product quality dimensions such as product quality, stimulation
(customer satisfaction ability), price, promotion, availability and ethnic brand to take corrective
measures by managements of the Breweries to satisfy their customers.
Lastly, the study will serve as a guideline for further researches that may be carried-out to
investigate the effect of product quality dimensions
The results of this study will have a practical significance to determine the factors of consumers
brand switching behavior. It will show the factors affective processes and their relationships to
consumers brand switching behavior. The study will help to understand impulsive buying
behaviors in Ethiopian context. In general, since much research has not been done in this area in
our country it will fill the gap that currently exists. It also shade light for further studies in area of
consumers brand switching behavior. In particular, the results of this study will be useful to beer
industries to understand their customers and target potential impulsive buyers and encourage
them to satisfy the customers. It will benefit marketers to understand impulsive buying behavior
of consumers and formulate appropriate marketing strategies. Advertisers will also be benefited
from the results by understanding the impact of emotion and thought how promotion can be used
in order to stimulate these factors. Producers and consumers will learn from the result which
component will influence the brand switching behavior.
9
1.8 Limitation of the study
The same research needs to be conducted in the same and other business industries that have
long-term relationship with their customers. Like any other studies, this study will have its own
limitation; one of which is the conduct of this study in a developing country that people may not
understand the significance of this study and will require time to explain the process. Another
limitation is that this study is data collection at one round, called cross- sectional due to shortage
or lack of finance. The longitudinal approach would result in more accurate information
findings. some limitations like inability to get all the required documents regarding the actual
figure of the customer; and lack of sufficient time as a result of the regular government work
duties may be anticipated and expected as the future limitations in affecting the research
progress. And other limitations like Lack of consistent and organized data, inaccessibility of
previous related literatures especially in the proposed study area, difficulty to get easily the
respondents and to gather their responses were the major obstacles in preparing this paper.
10
CHAPTER TWO: LITRETURE REVIEW
2.1 INTRODUCTION
There are two types of customers while porting out number to another company; they are active
and passive customers. Active customers are those who are well aware of new packages and
offers their chances of brand switching are very high and passive customers are those who are
not well aware of new packages, company tell them through promotion. Some people who are
more conscious about their decision they took wrong decision and when they are unconscious
about their decisions they took best decisions an older (Dijksterhuis et al. 2006). Price, quality,
switching cost, social influence, promotion, change in technology and distribution always attracts
the customer which is main reason to switch between brands (Carlos E., 2015; Dave R., 2008
and Sana Malik, 2014).
Brewed in more than 170 styles, there are more than 20,000 brands of beer old around the world.
All malt beverages are referred to as “beer,” but there are two distinct types: ales and lagers. In
Ethiopia there are more than 7 brands, and we will see the consumers brand switching behavior
in the beer industry in north Gondar district with their factors.
2.1.1 Top 10 beer brand in the world
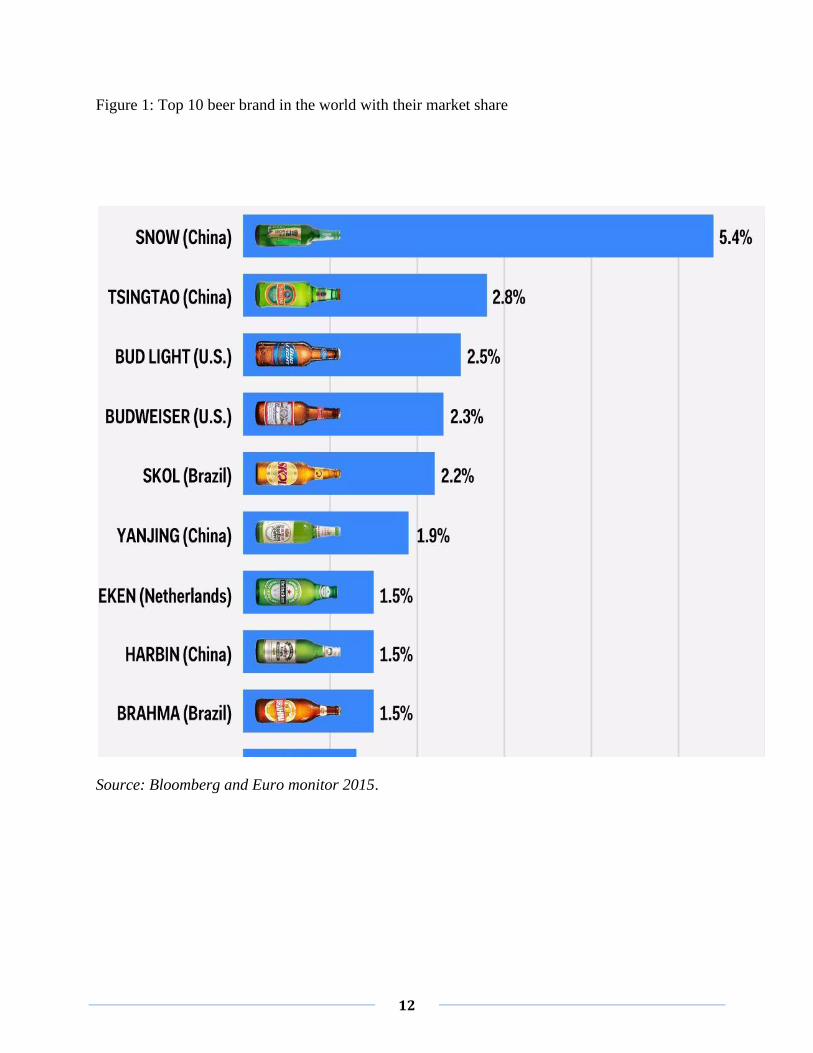
Among top ten beers brand in their market share four of them are from chain and four of the top
ten are belongs to AB-InBev Company. Let see them one by one their market share, where they
produced and the owners.
Snow: world number one brand beer with 5.4% market share. Produced in chain and the owner
is SABMiller / China Resources Enterprises.
Tsingtao: world number two brand beer with 2.8% market share. Produced in chain and the
owner is tsingtao.
Bud Light: world number three brand beer with 2.5% market share. Produced in united states
and the owner is AB-InBev.
Budweiser: world number four brand beer with 2.3% market share. Produced in united states
and the owner is AB-InBev.
11
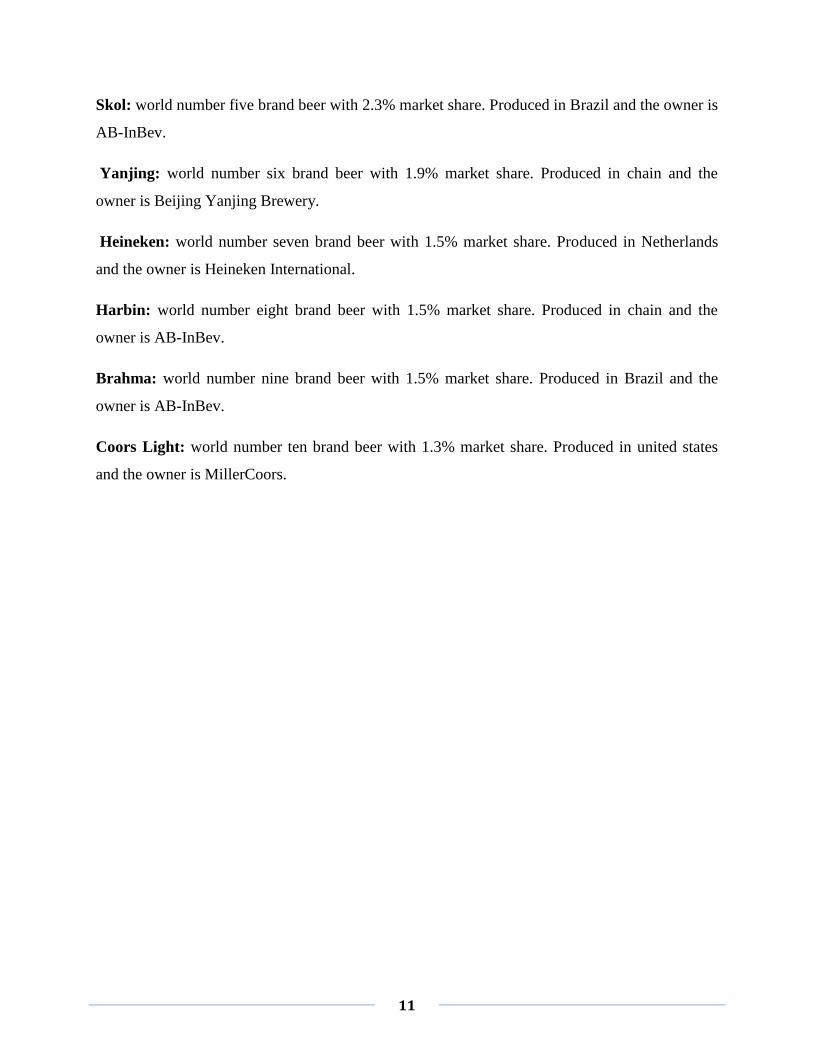
Skol: world number five brand beer with 2.3% market share. Produced in Brazil and the owner is
AB-InBev.
Yanjing: world number six brand beer with 1.9% market share. Produced in chain and the
owner is Beijing Yanjing Brewery.
Heineken: world number seven brand beer with 1.5% market share. Produced in Netherlands
and the owner is Heineken International.
Harbin: world number eight brand beer with 1.5% market share. Produced in chain and the
owner is AB-InBev.
Brahma: world number nine brand beer with 1.5% market share. Produced in Brazil and the
owner is AB-InBev.
Coors Light: world number ten brand beer with 1.3% market share. Produced in united states
and the owner is MillerCoors.
12
Figure 1: Top 10 beer brand in the world with their market share
Source: Bloomberg and Euro monitor 2015.
13
2.1.2 The complete list of Ethiopian Beers
Beer industries in Ethiopia have been growing in recent years including a flow in demand
associated with increased urbanization, population growth, and rising incomes. From a level of
just one million hectoliters in 2003/04, total beer production of the country has increased to
nearly 3.1 million hectoliters by 2008/09(Abiy Solomon, 2015) and by currently (2014) it
reached 7.1m hectoliters annually (Addis fortune, 2014).
Here are list of all beers in Ethiopia. This list includes ABV (Alcohol By Volume), Size,
Company and Style of the beers in Ethiopia Beer market.
St. George’s
St. George Beer of BGI (French’s Castel Group) was operating in Ethiopia since 1922. Named
after the saint that slayed the dragon (memorialized on the label), this lager is the most popular
beer in Ethiopia (ABV: 4.5% and Size: 330 ml, Company: BGI Ethiopia and style: lager)
Walia
HBSC aka Heineken and perhaps soon SABMiller (who recently made a bid to take over the
company) pumped out a new brew just in time to usher in the Ethiopian New Year, 2007. The
label has since changed and is now called Walia (ABV: 5%, Size: 33cl, Company: HBSC and
Style: Lager)
Dashen
Dashen is brewed in the northern city of Gondar and, like other Ethiopian breweries, has
benefited from an injection of foreign capital. The brewery recently added a biergarden and is
conveniently located on the road to Gondar’s airport. This beer is omnipresent in the north
(ABV: 4.5%, Size: 33cl, Company: Dashen Brewery, Gondar and Deberbrihn and Style: Pils)
14
Habesha
Even if it was introduced in recent but it is becoming popular and computes with the giant
breweries industries. Very known for its nice and traditional advert through media (ABV: 5 %,
Size: 33 cl, Company: Habesha Brewery S.C Debrebrihn and Style: Lager)
Meta
Also in the frenzy to snatch up Ethiopian breweries, the Diageo Group staked its’ claim on “The
Pride of Ethiopia” – Meta. Meta is brewed with malted barley, hops, and spring water (ABV:
5%, Size: 33cl, Company: Meta ABO Brewery S.C. Ethiopia, and Style: Lager).
Raya
Raya is also a new comer (ABV: 5 %, Size: 33 cl, Company: Raya Brewery S.C and Style:
Lager).
Other breweries
Other breweries like beadle special, Harar, Zemen, and Zebider beers are the other alternatives
for the domestic beer customers; with foreign beers, though importation to the customers.
15
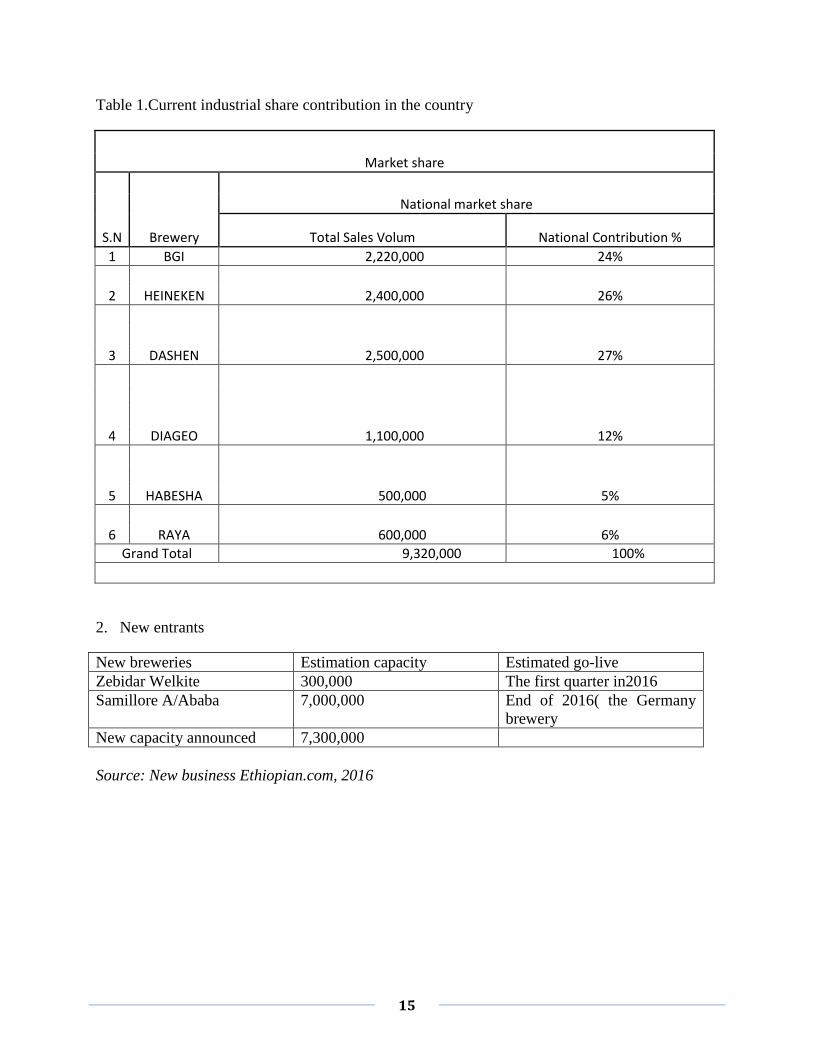
Table 1.Current industrial share contribution in the country
Market share
S.N Brewery
National market share
Total Sales Volum National Contribution %
1 BGI 2,220,000 24%
2 HEINEKEN 2,400,000 26%
3 DASHEN 2,500,000 27%
4 DIAGEO 1,100,000 12%
5 HABESHA 500,000 5%
6 RAYA 600,000 6%
Grand Total 9,320,000 100%
2. New entrants
New breweries Estimation capacity Estimated go-live
Zebidar Welkite 300,000 The first quarter in2016
Samillore A/Ababa 7,000,000 End of 2016( the Germany
brewery
New capacity announced 7,300,000
Source: New business Ethiopian.com, 2016
16
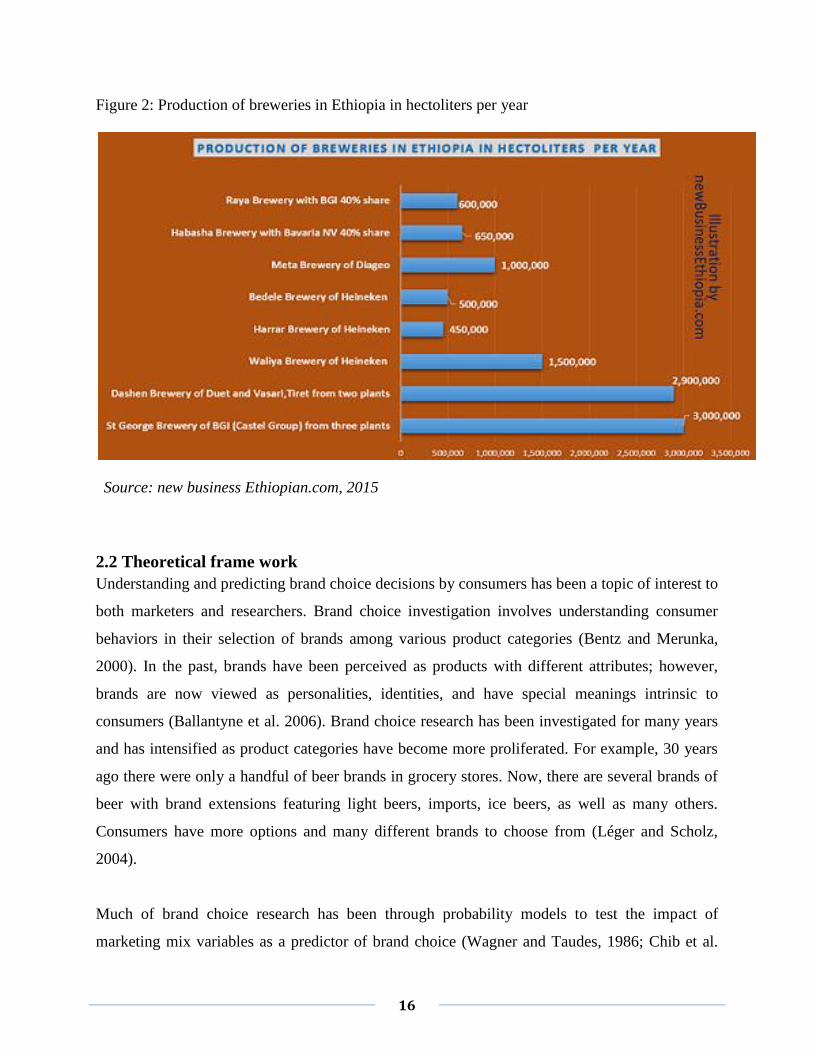
Figure 2: Production of breweries in Ethiopia in hectoliters per year
Source: new business Ethiopian.com, 2015
2.2 Theoretical frame work
Understanding and predicting brand choice decisions by consumers has been a topic of interest to
both marketers and researchers. Brand choice investigation involves understanding consumer
behaviors in their selection of brands among various product categories (Bentz and Merunka,
2000). In the past, brands have been perceived as products with different attributes; however,
brands are now viewed as personalities, identities, and have special meanings intrinsic to
consumers (Ballantyne et al. 2006). Brand choice research has been investigated for many years
and has intensified as product categories have become more proliferated. For example, 30 years
ago there were only a handful of beer brands in grocery stores. Now, there are several brands of
beer with brand extensions featuring light beers, imports, ice beers, as well as many others.
Consumers have more options and many different brands to choose from (Léger and Scholz,
2004).
Much of brand choice research has been through probability models to test the impact of
marketing mix variables as a predictor of brand choice (Wagner and Taudes, 1986; Chib et al.
17
2004; Bentz and Merunka, 2000). These variables (referred in most research studies as the 4 P’s)
are elements such as product features, displays (i.e. advertising, sales promotions), availability
(stock of inventory), and price (Chib et al. 2004, May; Bentz and Merunka, 2000; Wager and
Taudes, 1986). When used in probability modeling, marketing mix variables are considered
nonstationary and heterogeneous among the population (Wagner and Taudes, 1986).
There are other areas that have been researched with brand choice as well. Researchers have
examined the casual effects of brand related variables on brand choice. These variables include
situational factors, consumer personality, social benefits, emotions, quality, brand credibility,
product attributes, seasonality, and trends. The studies used within brand choice researches have
involved experiments and surveys of key marketing variables to measure impact on brand choice
(Charlton and Ehrenberg, 1973; Simonson et al. 1994; Erdem and Swait, 2004; Wagner and
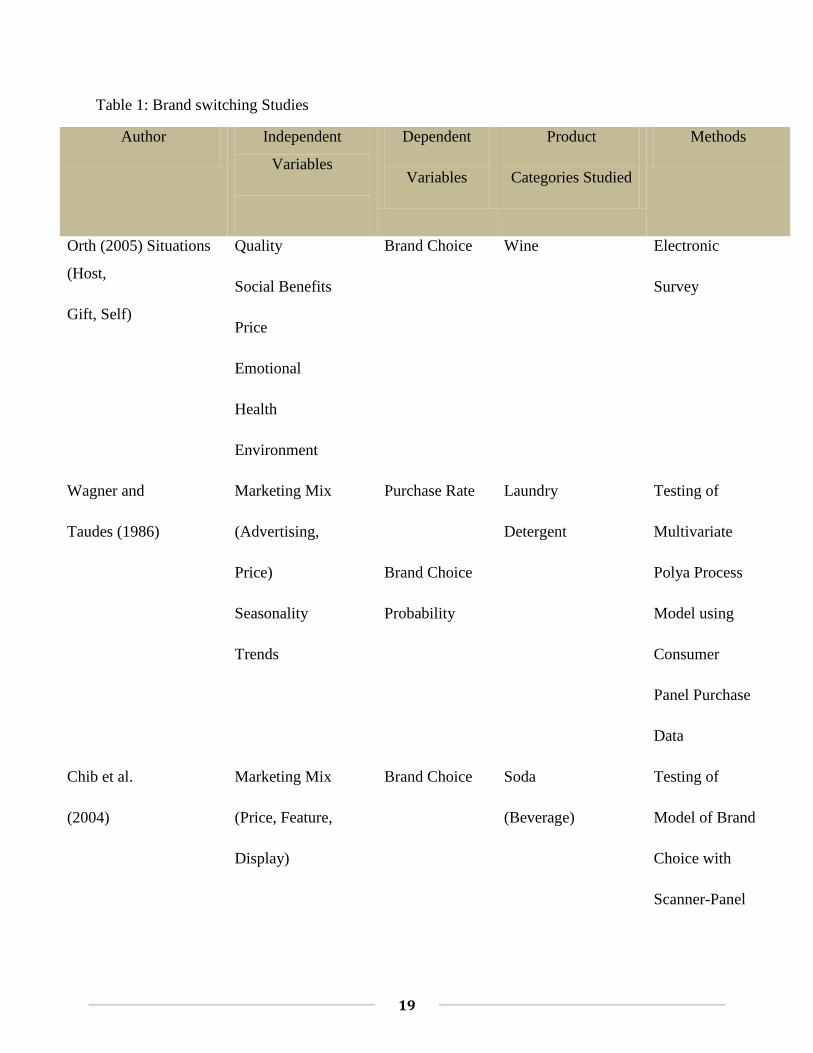
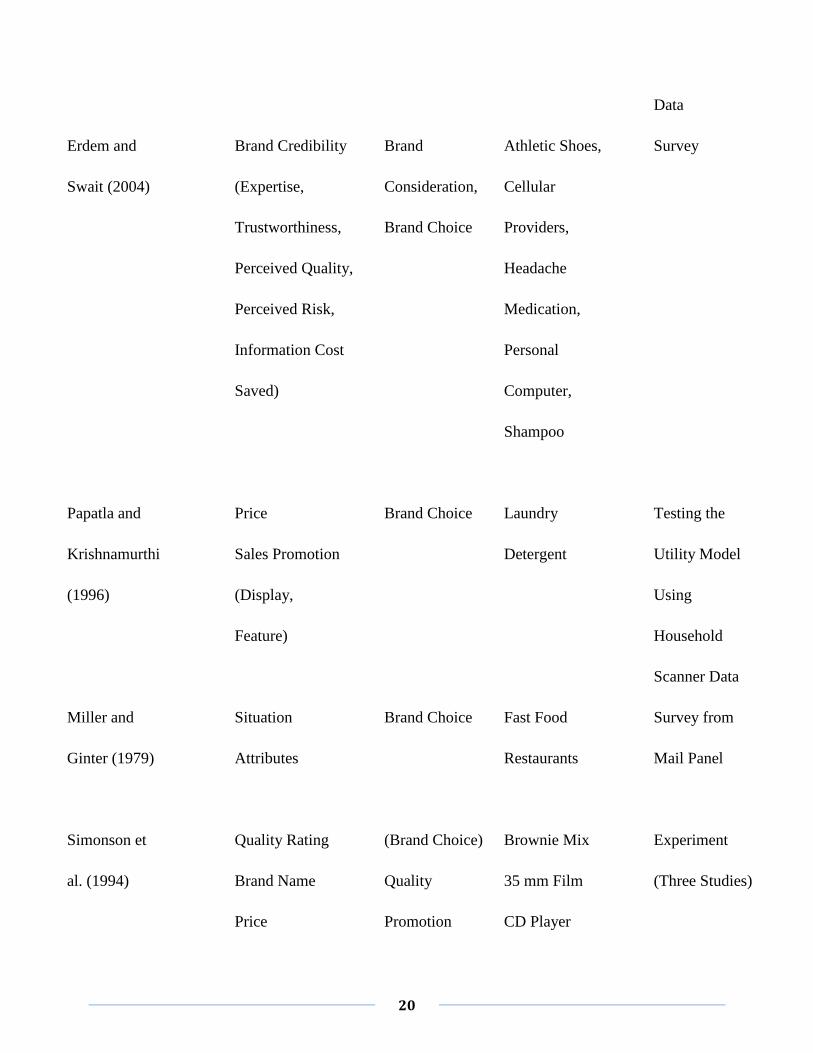
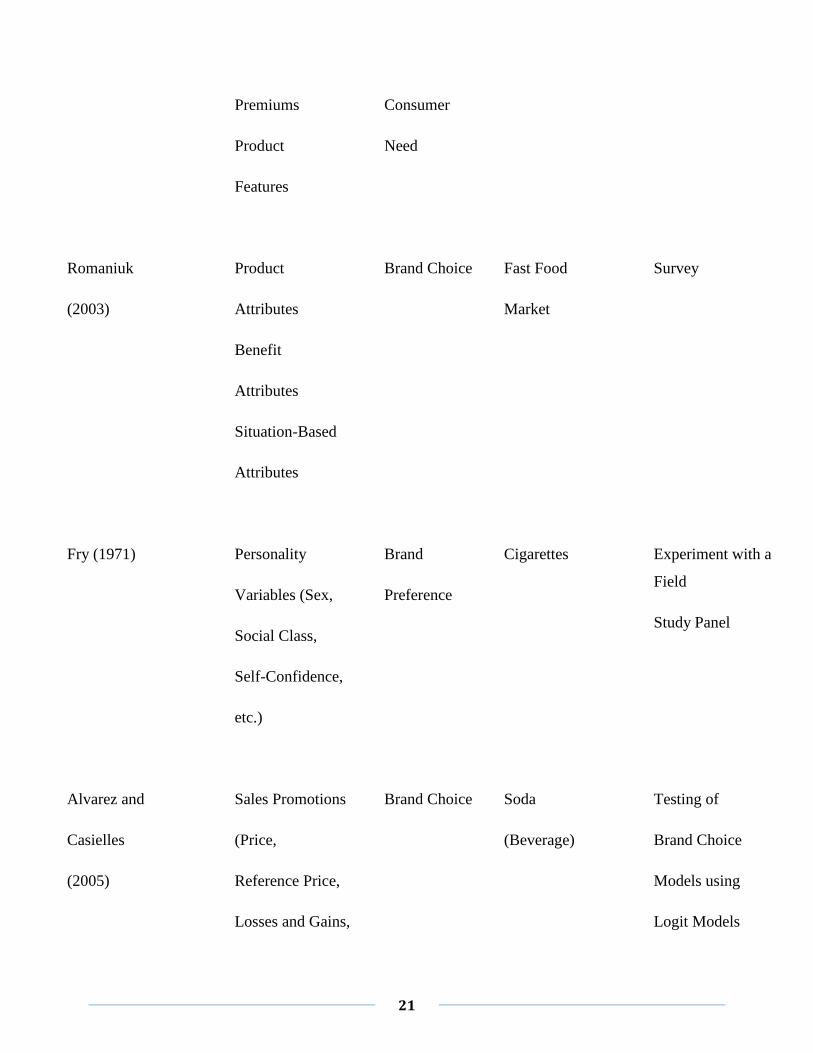
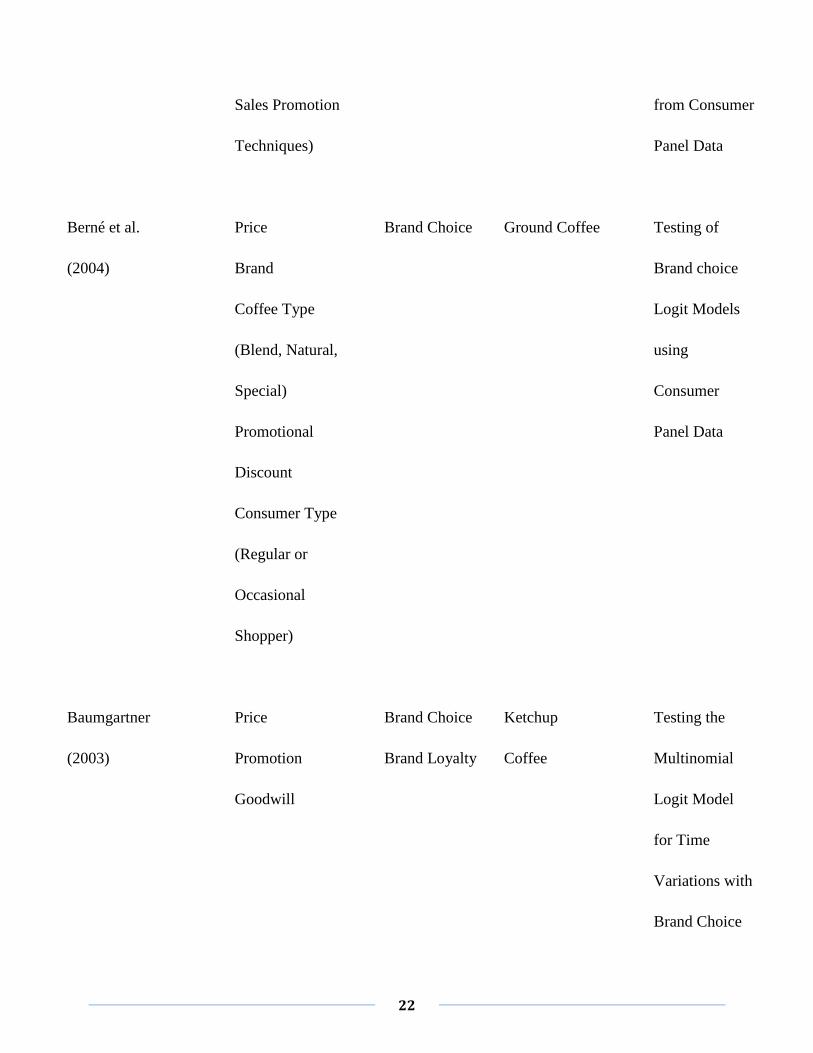
Taudes, 1986; Orth, 2005). Table 1 demonstrates these brand choice studies.
Among specific marketing mix variables, pricing appears to have the most consistent impact in
studies. Promotions such as sales promotions have shown influence on brand choice which
ultimately effect bottom-line prices for consumers. For example, pricing promotions could
involve coupons or simply a reduction of price within the product category (Singh et al. 2005;
Papatla and Krishnamurthi, 1996; Wagner and Taudes, 1986; Orth, 2005). In probability
modeling studies, it has been shown that displays and features have some impact on brand
choice, but this evidence is not as overwhelming or as consistent as other factors among brand
choice research studies (Chib et al. (2004), Papatla and Krishnamurthi, (1996), Alvarez &
Casielles, 2005). Product attributes have high importance on discovering what areas of the
product can be altered in order to make their brand more appealing to the consumer. According
to current research, it has been found that the greater the number of brand attributes for a
product, then the more likely the consumer is to make that particular band choice (Greenwald et
al. 1986; Romaniuk, 2003). Product attributes are important to marketers in order to differentiate
products from their competitors (Aaker et al. 1992; Belch & Belch, 1995).
Non-marketing mix variables have been researched in order to discover external factors that
impact brand switching. Seasonality and trends have been researched with brand choice.
18
However, their outcomes depend upon the product category. For example, a product such as
laundry detergent will most likely have better sales figures in the summertime when the weather
is more favorable and people are outside more (Wagner & Taudes, 1986). Personality factors
have shown an impact based on what brands consumers buy. Brand credibility has shown
significance in determining brand choice as well (Erdem & Swait, 2004 and Fry, 1971). Other
areas such as purchase time, purchase order, and product name have been researched but have
not been deemed to be main factors in determining a brand choice decision (Charlton &
Ehrenberg, 1973). These studies allow marketers to understand consumer brand switching
behaviors and allow for market share penetration, which give marketers a better understanding of
what elements effect a particular brand or product category (Chib et al., 2004, Wagner & Taudes,
1986).
Several product categories have been used in order to study brand switching. The majority of
product categories include low consumer involvement retail products. Some examples of
products studied in the past with brand choice are laundry detergent, soda, athletic shoes,
ketchup, coffee, snack foods, and bar soaps. Table 1 provides a listing of the various product
categories used in previous brand choice researches (Wagner and Taudes, 1986; Chib et al. 2004;
Erdem and Swait, 2004; Baumgartner, 2003; Papatla and Krishnamurthi, 1996; Alvarez and
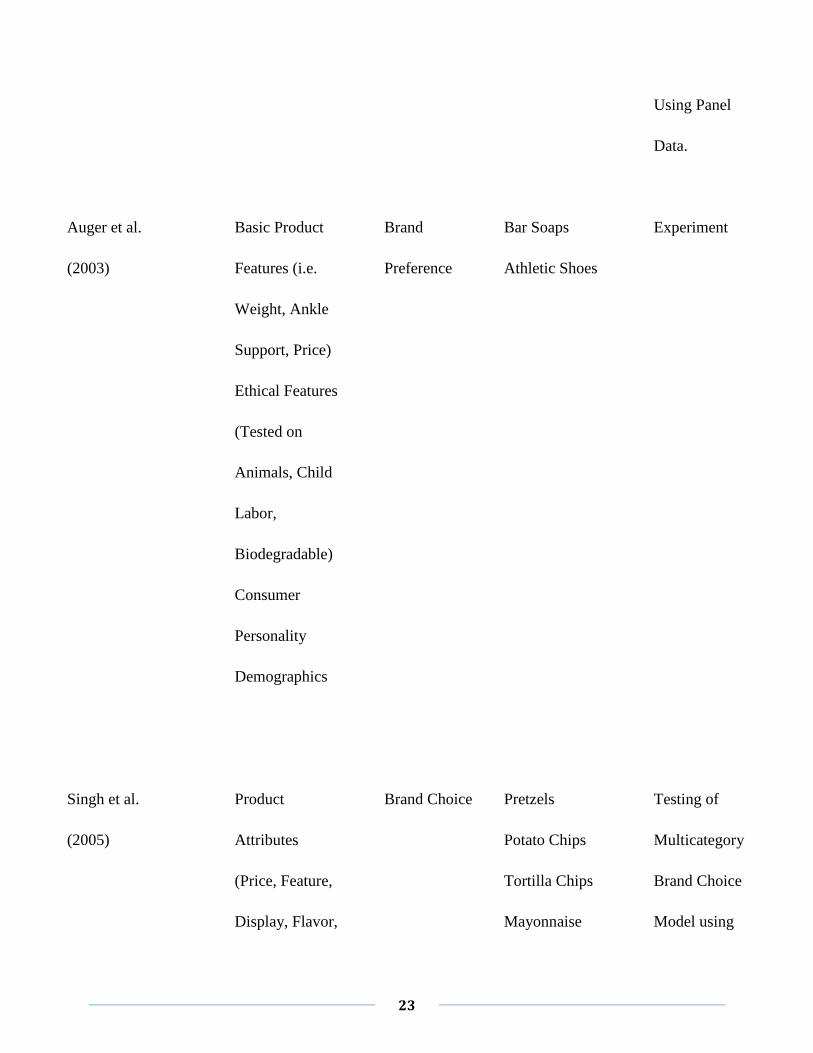
Casielles, 2005; Berné et al. 2004; Singh et al. 2005; Auger et al. 2003).
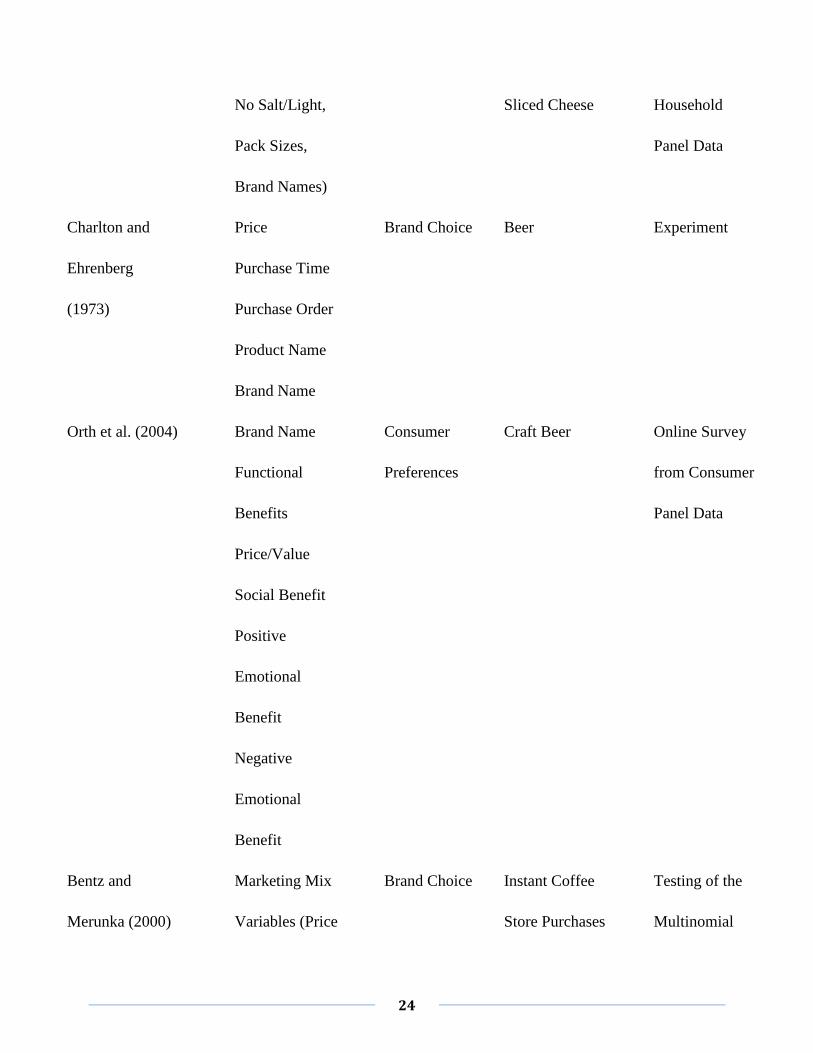
Among previous brand choice literature, there have been very few studies involving the product
category of beer. Woodside and Fleck Jr. (1979) conducted a qualitative study regarding brand
choice of beer drinkers. The methodology for this study consisted of two in-depth personal
interviews with two beer drinkers. The researchers concluded that involvement, normative,
situational, and product attributes all influenced brand choice in the study. Charlton and
Ehrenberg (1973) conducted an experiment with the product category of beer where variables
manipulated were price, purchase time, purchase order, product name, and brand name. More
recently a study was conducted (Orth et al. 2004) which examined craft beer preference and the
relationship of brand benefits with consumer demographics. Brand benefits were considered to
be significant drivers of consumer preferences in this product category. Brand benefits were
shown to be an effective predictor in the product category of beer for brand choice.
19
Table 1: Brand switching Studies
Author Independent
Variables
Dependent
Variables
Product
Categories Studied
Methods
Orth (2005) Situations
(Host,
Gift, Self)
Quality
Social Benefits
Price
Emotional
Health
Environment
Brand Choice Wine Electronic
Survey
Wagner and
Taudes (1986)
Marketing Mix
(Advertising,
Price)
Seasonality
Trends
Purchase Rate
Brand Choice
Probability
Laundry
Detergent
Testing of
Multivariate
Polya Process
Model using
Consumer
Panel Purchase
Data
Chib et al.
(2004)
Marketing Mix
(Price, Feature,
Display)
Brand Choice Soda
(Beverage)
Testing of
Model of Brand
Choice with
Scanner-Panel
20
Data
Erdem and
Swait (2004)
Brand Credibility
(Expertise,
Trustworthiness,
Perceived Quality,
Perceived Risk,
Information Cost
Saved)
Brand
Consideration,
Brand Choice
Athletic Shoes,
Cellular
Providers,
Headache
Medication,
Personal
Computer,
Shampoo
Survey
Papatla and
Krishnamurthi
(1996)
Price
Sales Promotion
(Display,
Feature)
Brand Choice Laundry
Detergent
Testing the
Utility Model
Using
Household
Scanner Data
Miller and
Ginter (1979)
Situation
Attributes
Brand Choice Fast Food
Restaurants
Survey from
Mail Panel
Simonson et
al. (1994)
Quality Rating
Brand Name
Price
(Brand Choice)
Quality
Promotion
Brownie Mix
35 mm Film
CD Player
Experiment
(Three Studies)
21
Premiums
Product
Features
Consumer
Need
Romaniuk
(2003)
Product
Attributes
Benefit
Attributes
Situation-Based
Attributes
Brand Choice
Fast Food
Market
Survey
Fry (1971) Personality
Variables (Sex,
Social Class,
Self-Confidence,
etc.)
Brand
Preference
Cigarettes
Experiment with a
Field
Study Panel
Alvarez and
Casielles
(2005)
Sales Promotions
(Price,
Reference Price,
Losses and Gains,
Brand Choice Soda
(Beverage)
Testing of
Brand Choice
Models using
Logit Models
22
Sales Promotion
Techniques)
from Consumer
Panel Data
Berné et al.
(2004)
Price
Brand
Coffee Type
(Blend, Natural,
Special)
Promotional
Discount
Consumer Type
(Regular or
Occasional
Shopper)
Brand Choice Ground Coffee Testing of
Brand choice
Logit Models
using
Consumer
Panel Data
Baumgartner
(2003)
Price
Promotion
Goodwill
Brand Choice
Brand Loyalty
Ketchup
Coffee
Testing the
Multinomial
Logit Model
for Time
Variations with
Brand Choice
23
Using Panel
Data.
Auger et al.
(2003)
Basic Product
Features (i.e.
Weight, Ankle
Support, Price)
Ethical Features
(Tested on
Animals, Child
Labor,
Biodegradable)
Consumer
Personality
Demographics
Brand
Preference
Bar Soaps
Athletic Shoes
Experiment
Singh et al.
(2005)
Product
Attributes
(Price, Feature,
Display, Flavor,
Brand Choice
Pretzels
Potato Chips
Tortilla Chips
Mayonnaise
Testing of
Multicategory
Brand Choice
Model using
24
No Salt/Light,
Pack Sizes,
Brand Names)
Sliced Cheese Household
Panel Data
Charlton and
Ehrenberg
(1973)
Price
Purchase Time
Purchase Order
Product Name
Brand Name
Brand Choice
Beer Experiment
Orth et al. (2004)
Brand Name
Functional
Benefits
Price/Value
Social Benefit
Positive
Emotional
Benefit
Negative
Emotional
Benefit
Consumer
Preferences
Craft Beer
Online Survey
from Consumer
Panel Data
Bentz and
Merunka (2000)
Marketing Mix
Variables (Price
Brand Choice Instant Coffee
Store Purchases
Testing of the
Multinomial

25
per Quantity,
Promotional
Price Cut as a
Percentage of
Normal Price)
Product
Characteristics
Household-
Specific
Variables (Brand
and Size
Loyalties)
Chocolate
Logit Model in
Combination
with Neutral Net
work Model
using Panel
Scanner Data
Source: from Dave R. 2008 and other new thesis with own tabular presentation
Indicated variables were found to be significantly associated with brand choice.
These studies involved interaction which effect among dependent variables but had no main
effects on individual dependent variables.
2.3. EMPERICAL FRAME WORK
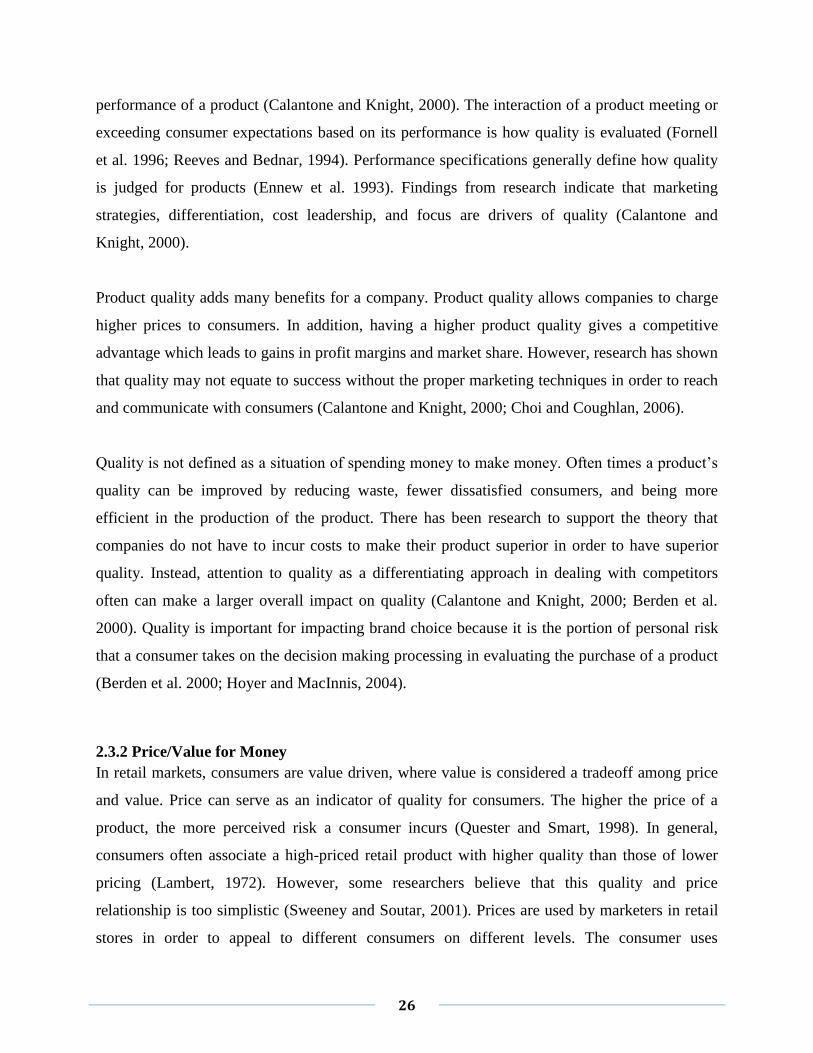
2.3.1 Product Quality
Quality refers to the degree of excellence in a product or service (Xianhua and Germain, 2003).
Therefore, quality is one of the most important factors influencing customer satisfaction (Fornell
et al. 1996) and is considered the ability of a product or service to perform its specific task
(Ennew et al. 1993). The success of a brand in customer satisfaction is quality. Companies
conform to requirements set by consumers (Berden et al. 2000). Quality is significant on the
26
performance of a product (Calantone and Knight, 2000). The interaction of a product meeting or
exceeding consumer expectations based on its performance is how quality is evaluated (Fornell
et al. 1996; Reeves and Bednar, 1994). Performance specifications generally define how quality
is judged for products (Ennew et al. 1993). Findings from research indicate that marketing
strategies, differentiation, cost leadership, and focus are drivers of quality (Calantone and
Knight, 2000).
Product quality adds many benefits for a company. Product quality allows companies to charge
higher prices to consumers. In addition, having a higher product quality gives a competitive
advantage which leads to gains in profit margins and market share. However, research has shown
that quality may not equate to success without the proper marketing techniques in order to reach
and communicate with consumers (Calantone and Knight, 2000; Choi and Coughlan, 2006).
Quality is not defined as a situation of spending money to make money. Often times a product’s
quality can be improved by reducing waste, fewer dissatisfied consumers, and being more
efficient in the production of the product. There has been research to support the theory that
companies do not have to incur costs to make their product superior in order to have superior
quality. Instead, attention to quality as a differentiating approach in dealing with competitors
often can make a larger overall impact on quality (Calantone and Knight, 2000; Berden et al.
2000). Quality is important for impacting brand choice because it is the portion of personal risk
that a consumer takes on the decision making processing in evaluating the purchase of a product
(Berden et al. 2000; Hoyer and MacInnis, 2004).
2.3.2 Price/Value for Money
In retail markets, consumers are value driven, where value is considered a tradeoff among price
and value. Price can serve as an indicator of quality for consumers. The higher the price of a
product, the more perceived risk a consumer incurs (Quester and Smart, 1998). In general,
consumers often associate a high-priced retail product with higher quality than those of lower
pricing (Lambert, 1972). However, some researchers believe that this quality and price
relationship is too simplistic (Sweeney and Soutar, 2001). Prices are used by marketers in retail
stores in order to appeal to different consumers on different levels. The consumer uses
27
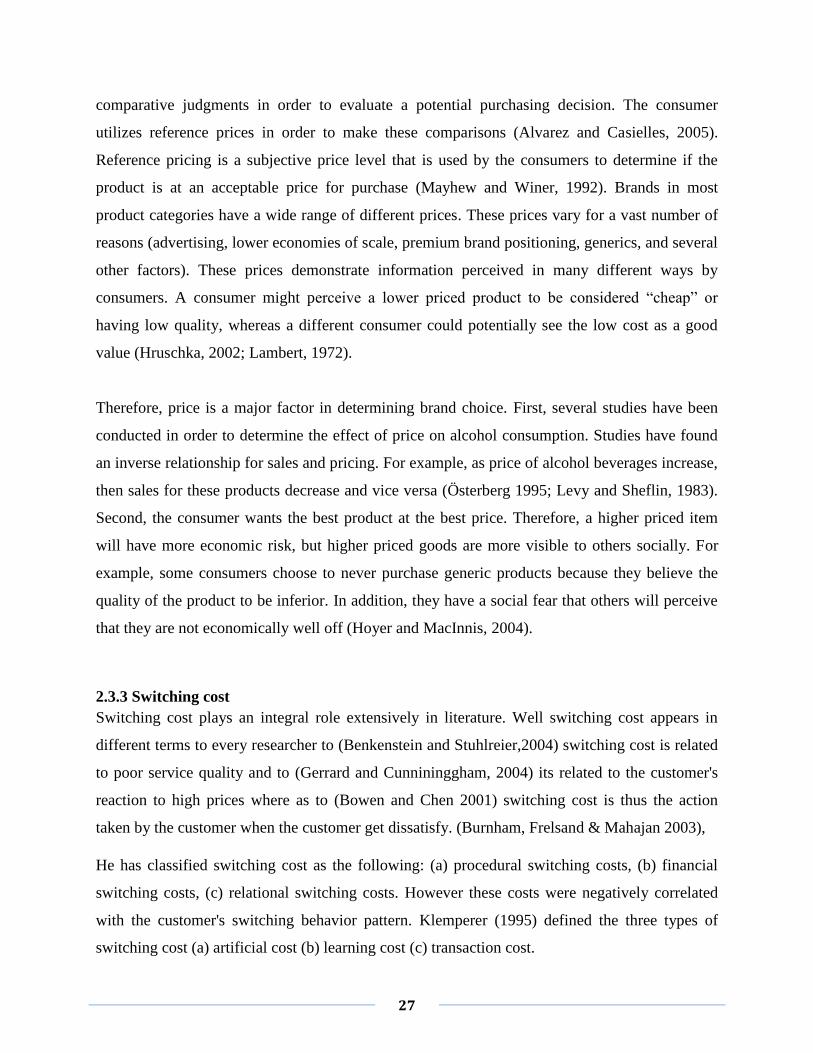
comparative judgments in order to evaluate a potential purchasing decision. The consumer
utilizes reference prices in order to make these comparisons (Alvarez and Casielles, 2005).
Reference pricing is a subjective price level that is used by the consumers to determine if the
product is at an acceptable price for purchase (Mayhew and Winer, 1992). Brands in most
product categories have a wide range of different prices. These prices vary for a vast number of
reasons (advertising, lower economies of scale, premium brand positioning, generics, and several
other factors). These prices demonstrate information perceived in many different ways by
consumers. A consumer might perceive a lower priced product to be considered “cheap” or
having low quality, whereas a different consumer could potentially see the low cost as a good
value (Hruschka, 2002; Lambert, 1972).
Therefore, price is a major factor in determining brand choice. First, several studies have been
conducted in order to determine the effect of price on alcohol consumption. Studies have found
an inverse relationship for sales and pricing. For example, as price of alcohol beverages increase,
then sales for these products decrease and vice versa (Österberg 1995; Levy and Sheflin, 1983).
Second, the consumer wants the best product at the best price. Therefore, a higher priced item
will have more economic risk, but higher priced goods are more visible to others socially. For
example, some consumers choose to never purchase generic products because they believe the
quality of the product to be inferior. In addition, they have a social fear that others will perceive
that they are not economically well off (Hoyer and MacInnis, 2004).
2.3.3 Switching cost
Switching cost plays an integral role extensively in literature. Well switching cost appears in
different terms to every researcher to (Benkenstein and Stuhlreier,2004) switching cost is related
to poor service quality and to (Gerrard and Cunnininggham, 2004) its related to the customer's
reaction to high prices where as to (Bowen and Chen 2001) switching cost is thus the action
taken by the customer when the customer get dissatisfy. (Burnham, Frelsand & Mahajan 2003),
He has classified switching cost as the following: (a) procedural switching costs, (b) financial
switching costs, (c) relational switching costs. However these costs were negatively correlated
with the customer's switching behavior pattern. Klemperer (1995) defined the three types of
switching cost (a) artificial cost (b) learning cost (c) transaction cost.
28
Whereas the most important is the transaction cost which shows that the customer should be
aware of the cost incurs while switching to another service providers. Jones, Mothersbaugh &
Beatty, 2000) and (Sharma & Patterson 2000) they recommended that switching costs are
basically the factors themselves in influential switching. (Bumham, Frels & Mahajam 2003)
survey in cross- industry specify that switching cost such as financial loss and suspicions with
the new service provider discourage consumers from switching to other service providers
regardless of dissatisfaction. References of family and friends and pressure for consistency could
also dispirit customers from switching through peers, expectation, customs and traditional
values.
Customer satisfaction among theoretical literatures has been given much consideration. (Fornell
1992) defined that satisfaction derives from the overall assessment depending upon the total
consumption and purchase experience of the service compared with repurchasing expectations
over time.
The evaluation that a customer makes of any definite transaction is known as Satisfaction. While
( Oliver 1980) stated that " Satisfaction is a summary psychological state resulting when the
emotions surrounding disconfirmed expectations are coupled with the customer’s prior feelings
about consumption experience".
In marketing literatures, customer satisfaction has been an indicator in evaluating the relationship
between customers and service providers.
According to Li (2008), five emotions perceived by customers as below are satisfactory:
(1) Satisfaction: the products can be accepted or tolerated;
(2) Content: the products bring people with a positive and happy experience;
(3) Relieved: the products remove people's negative state.
(4) Novelty: the products bring people with freshness and exciting;
(5) Surprise: the products make customer unexpectedly pleased
(Yi & Jeon, 2003) His study is based on the subscription market. Customers basically subscribe
to mobile phone services with no purpose of switching, they tend to remain loyal with the
present service until and unless some factors prompt them to switch to another network for
29
improved features or services. The research shows that customer satisfaction is basically could
not be fully explained through customer retention that if customer is retained he is satisfied.
There are other underlying factors to determine the switching. (Inger 2008) He analyzed that the
fine understanding of the emotion that plays an important role in customer switching behavior
and identifies the occurrence of negative distinct emotions in terms of distinct triggers. The
findings was that the emotions identified were located in the relationship trigger part and was
immensely expressed by the respondents during their switching behavior in forms of anxiety,
annoyance, disappointment and dissatisfaction, stress tension etc. (Seth et al 2008) describes in
his study that to manage the customer perceived service quality for a cellular mobile phone, it
analyzes that the service quality attributes is very important whereas responsiveness is its most
important dimension, followed by other dimensions such as reliability, customer network quality,
assurance ,empathy and tangibles. (Kalpana & Chinnadurai 2006) analyzes in their study named
"Promotional Schemes for Cellular Services" stated that the increased in competition and
customer's changed taste and preferences in all over the world prompting the companies to
change their strategies as well. The study revealed that the advertisement plays vital role in
influencing the customers to switch over.
2.3.4 Social Influence
Social influences consist of influential factors determined by family and friends. College
students have more of a propensity to drink the brands that their parents and friends consume on
a regular basis. When children leave their parent’s home to join the workforce or go off to
college, then a majority of them are taking their parents’ purchasing behaviors with them. These
behaviors may diminish over time as the young adult is separated from their family, but the
influence is still apparent (Feltham, 1998). In addition, adolescents are exposed to peer-pressure
and group-think mentalities, which lead them to consuming brands that their friends and peers
consume (Collins et al. 2003). This social influence stems from persuasion by attitudes and
behaviors of fellow peers (Jessor, 1981 and Kandel, 1980). Therefore, normative influences can
have an effect on brand choice for the beer product category. Throughout research on social
behavior, other individuals’ behaviors may serve as cues which could increase the potential for
behavior. In addition, the behavior of others might remind the individual that alternatives to their
own behavior are available (Bandura, 1977).
30
Social influence has an effect on brands that consumers choose. There is a social risk associated
with every purchase decision a consumer makes. Opinion leaders, family/friend influence,
reference groups, social class, culture, and subculture can affect the brands that a consumer
purchases. This social risk is often associated with what the consumer believes are acceptable
brands based on the brand perceptions in the individual’s social group. For example, a consumer
may purchase a higher priced, upscale brand in order to identify and be accepted by a higher
social class (Hoyer and MacInnis, 2004).
2.3.5 Situational Factors
Benefits sought out by consumers can differ based on the situation that the consumer is in (Yang
et al. 2002). According to Belk (1974), “Situations may be defined as those factors particular to a
time and place of observation which have a demonstrable and systemic effect on behavior”.
Consumers evaluate brands in different manners based on the situation (Vazquez et al. 2002). It
is suggested from previous research that situational factors are a better predictor for consumer
behavior than measures involving consumer attitudes. Research has indicated that consumer
preferences change according to their environment (Quester and Smart, 1998; Lai, 1991, Belk,
1974).
According to Lai (1991), there are three types of situations that are used in marketing strategy
among situational factors: communication situation, purchase situation, and consumption
situation. Situational drivers should have a frequent number of customers per situation. In
addition, each situation must be clearly different than the other in order to account for variance
measures. Therefore, effects from environmental factors are not homogenous but rather
heterogeneous (Miller and Ginter, 1979; Yang et al. 2002).
A consumer might choose a brand based on being in different situations and will therefore, be
motivated to drink a certain brand (Yang et al. 2002). According to drinking studies, around 80%
of young people’s total alcohol consumption occurs at a public place (Knibbe et al. 1991). The
greatest occurrences of drinking are in the home or in bars (Wilks and Callan, 1990). In addition,
heavy and light drinkers tend to drink twice as much during “happy hours” in bars than they do
31
during times that are not involved in such promotions. Therefore, there are some interaction
effects of brand benefits based on situational factors (Babor et al. 1978; Orth, 2005).
Consumers may face similar environments, but there are several motivating conditions that play
a role on brand choice depending on the consumer (Yang et al. 2002). Several studies have
shown this idea of situational influences proving that individuals prefer to drink different brands
based on different occasions (Bearden and Etzel, 1982). For example, Quester and Smart (1998)
used the purchase of a bottle of red wine for a drink during the week (alone or with one’s family)
over dinner, for a dinner party at a friend’s house on a weekend (with 5 to 6 close friends), and as
a gift for an employer or respected friend. Orth (2005) evaluated three different situations based
on drinking red wine with the same scale from Quester and Smart. Miller and Ginter (1979)
explored situational impacts on brand choice with respect to fast food restaurants. The situation
variations analyzed were lunch on a weekday, snack during a shopping trip, evening meal when
rushed for time, and evening meal with the family when not rushed for time. All of the studies
involving situational factors demonstrated significance based on impacting brand choice (Orth,
2005; Miller and Ginter, 1979).
Areas that have been studied with situational drivers include product involvement, brand choice,
and product attributes. High product involvement was considered a factor that influences
behaviors with the interaction of situational drivers. Product factors have different levels of
importance to consumers based on situation. Brand choice has been found to be impacted
significantly by situational factors (Orth, 2005; Quester and Smart, 1998; Miller and Ginter,
1979; Yang et al. 2002).
It is important for marketers to understand where brands are effective in given situations. This
gives marketers insights as to where the brands are being effectively communicated, purchased,
and consumed (Miller and Ginter, 1979; Quester and Smart, 1998). However, one study has
argued with these notions. Results from a research study using a probability models to determine
preferences indicated that marketers do not have to make their brands congruent to consumers or
their environment. It is suggested that the source of brand preferences must be understood in
order to have an impact on situational factors that influence brand choice (Yang, et al. 2002).
32
Situation variation depends on the product category used for research (Belk, 1974). Beer is an
important category to use because it is a narrowly defined product category in accordance with
researching situational drivers (Miller and Ginter, 1979). Drinking beer is considered an activity
that may occur in distinct situations. Therefore, there should be a clear variance according to
their changing environment (Yang et al. 2002).
2.3.6 Demographics
Demographic variables have been proven to be indicators for brand choice. Factors such as age
and gender play a role in how consumers evaluate and ultimately purchase brands in several
different product categories (Walsh and Mitchell, 2005). Based on studies involving
demographics and drinking behaviors, males tend to drink in larger quantities in same sex
groups, whereas women drink with mixed crowds or with a male (Hartford et al. 1983). Age is
also a variable to be explored for college students because there are those of legal age and others
that are obtaining beer illegally. There are a number of these college students that purchase beers
illegally via a false ID or by having an older peer purchase it for them (Schwartz et al. 1998). In
addition, there is very little known about demographic issues such as gender, age, and education
(year in college) with particular subject matter as it relates to this segment and brand choice.
2.3.7 Brand Loyalty
Brand Loyalty is the only tool for any company to survive in a severe competition. Brand helps
in creating relationship between consumer and producer. To be a leading company, it is a
massive task to build brand loyalty. Brand is the only word that differentiates the goods and
services from the other ones. Therefore, the dominated companies spend a lot on the brand to
make it unique in order to develop the brand loyalty. Brand loyalty can be created by the
numerous ways and strategies but most convenient ones are how much you fulfill your promises
in the light of brand credibility and so on service quality is how much strong. If the customer is
satisfied then it will show its loyalty towards brand and if not then it shift the intention towards
other brand in term of brand switching (Oliver, 1999; Russell-Bennett et al. 2007).
Brand is an important subject which creates positive image in eyes of customers to make itself
different from the competitors (Kotler, 2004). Loyal customers even at toughest times purchase
the product offering at high rate. Brands are the asset of organizations.
33
2.3.8 Customer Satisfaction
It is the perception of the customer created by the companies through the advertising publicities,
and other social media intend to purchase the product. In general it is the feeling of customer
about product quality and its features provided to them such a performance and reliability of the
product. The promises made by the brand product to meet the expectations of the customers
(Zenithal, 1988). Basically there are two phases of the quality objective and perceived quality.
It is commonly used in studies. Basically satisfaction is a speedy or quick experience of the
customers after using the product through which the overall satisfaction can be assessed (Lam, et
al, 2004). Various studies tells that the loyalty is affected by the satisfaction through the
satisfaction level we can predict the purchase intentions and behavior of consumer towards the
brand product (Egbert, 2002).
Practical studies illustrate that satisfaction is the producessor of brand loyalty, intention to rebuy
the product and behavior of brand towards its customers (Russell- Bennett et al., 2007). Brand
loyalty can increased by the satisfaction of customer and repeat the purchase of the same product
services.
2.3.9 Brand Credibility
Brand Credibility means the image of the brand in the mind of the customer or consumer, it is
the mixture of multi characteristics term. The characteristics of the term contain reliability what
is advertised by the manufacturer of brand in term of, truthfulness, claim justification and,
delivering and trust spreading. Brand credibility contains three terms expertise, good looks, and
trustworthiness (Sternthal and Craig, 1982; Erdem and Swait, 2004). Market share and brand’s
customer based are affected by the brand credibility (Chaudhuri and Holbrook, 2001).The
manufacturers are looking for the motivators that can gradually increase the brand credibility.
Brand credibility also supports the manufacturers and customers relationship and makes them
strong and log run. The importance of brand credibility in making the decision and other choices
is vital.
Brand credibility give rises to the risk minimization approaches for the customer if it satisfied
with the brand specification. This will reduce the perceive risk and further more reduce the
34
information outlay during using the brand, (Shogun, 1980; Day, 1969; Jacoby and Chestnut,
1978). Behavioural and attitudinal brand credibility leads to loyalty. These are the two unique
dimensions while measuring the brand loyalty, (Gremler, 1995). Loyalty regards to re-
purchasing product and attitudinal loyalty spreads the commitment of consumer towards brand
having additional values, (Chaudhuri and Holbrook, 2001).
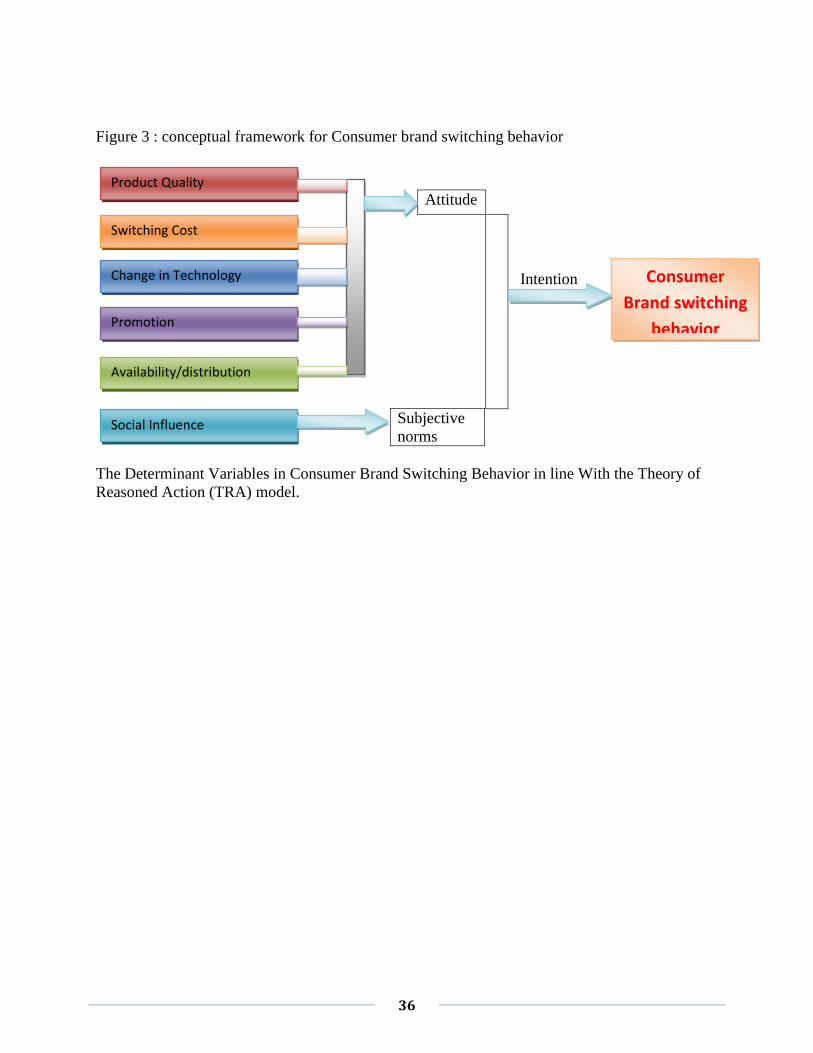
2.4. CONCEPTUAL FRAME WORK
Ajzen and Fishbein’s (1980) Theory of Reasoned Action (TRA) is one of the most researched
models that describe the psychological processes of decision making. It is comprised of three
main components in order to predict behavior. The three components are attitude, subjective
norms, and intention. This model has been applied to many different areas of study such as
alcohol, marijuana, and purchasing consumer products (Eagly & Chaiken, 1993).
In this model, attitude involves the positive or negative associations an individual has on specific
behavior. Subjective norms deal with the normative and social influences that impact an
individual’s behavior. Social influence on an individual and susceptibility to interpersonal
influence are factors that measure subjective norms. In a given population, there may be cases
that lean more towards attitude providing more influence in terms of behavior. However, in other
cases, subjective norms might potentially lead to a different behavior (Trafimow & Fishbein,
2001). Other influential factors could be intrinsic and extrinsic. They result from situational
and/or interpersonal factors (Chatzisarantis and Biddle, 1998; Bagozzi et al. 1992).
The two main factors involved in TRA, attitude and subjective norms, lead to intention. Intention
is the likelihood of completing a certain behavior, and the relative importance of normative
influence and attitudinal considerations. Intention is utilized for understanding judgment based
on how a final decision is made (Ajzen & Fishbein, 1980). Consumer factors such as
demographics and consumption behaviors provide an understanding of intention. Intention can
give marketers an idea of how a consumer will behave toward particular brands (Bagozzi et al.
1992).
According to previous research studies, other variables aside from attitude and subjective norm
can have an overall impact on behavior (Trafimow & Fishbein, 2001). Susceptibility to
interpersonal influence and social influence lead to subject norms in an individual. Quality, price,
35
emotion, environment, health benefits, and product category involvement deal with the
individual’s attitude toward the brand. In addition, importance of subjective norms and attitudes
can vary depending upon the situation (Bagozzi et al. 1992). All of these components, either
weighing more heavily on subjective norm or attitude, lead to intention. This intention results in
an individual beer brand choice and beer consumption behavior.
There have been several studies involving the TRA model and alcohol research studies. These
studies involved predicting alcohol consumption behavior (O’Callaghan et al. 1997; Trafimow,
1996; Wall et al. 1998). Most of these particular studies were used in efforts to understand and
predict drinking behaviors prevalent among college students. These studies were ultimately used
in order to curve drinking behaviors. The TRA model has been utilized in this study to
conceptualize research questions involving beer brand choice and beer consumption behaviors.
Figure 3 illustrates the TRA model used for this study. The model has been extended in order to
demonstrate all measures involved in this study. This modified model is exploratory in nature in
order to gather a theoretical understanding among variables used in the study. The model lists the
organization of variables as they relate to the concepts and relationships in the model.
36
Figure 3 : conceptual framework for Consumer brand switching behavior
Intention
The Determinant Variables in Consumer Brand Switching Behavior in line With the Theory of
Reasoned Action (TRA) model.
Attitude
Subjective
norms
Product Quality
Social Influence
Availability/distribution
Switching Cost
Change in Technology
Promotion
Consumer
Brand switching
behavior
37
CHAPTER THREE: RESEARCH DESIGN & METHODOLOGY
This chapter states the design of the research and explains the sampling techniques used. It also
give details of the data sources, tools of data collection and procedure of data collection, methods
of data analysis as well as the scope and organization of the study.
3.1 Research design
The research employed descriptive research designs which refer to a set of methods and
procedures that describe marketing variables. Descriptive research uses a set of scientific
methods and procedures to collect raw data and create data structures that describe the existing
characteristics or situations (example, attitudes, intentions, preferences, purchase behaviors,
evaluations of current marketing mix strategies) of a defined target population or market
structure instead of interpreting and deciding decision (Creswell,1994). Descriptive research
designs are appropriate when the research objectives include determination of the degree to
which marketing (or decision) variables are related to actual market phenomena. Here, the
researcher looks for answers to the how, who, what, when, and where questions concerning
different components of a market structure.
Descriptive studies generally allow decision makers to draw inferences about their customers,
competitors, target markets, environmental factors, or other phenomena of concern. A
quantitative approach is under descriptive research design that is decided and adopted based on
the nature of the problem, objectives of the study, the level and nature of the research questions
and the practical considerations related to the research environment among others. Moreover, the
quantitative approach allows explanation of a phenomenon by collecting numerical data that are
analyzed using mathematically based method, particularly statistics. Having the proposed
approach to conduct the study, therefore, the researcher have used cross-sectional survey
method which is the subset of quantitative approach for data collection which will allow
information to be collected from sampled customers. Hence, to gather data for the study, the
researcher have employed a survey questionnaire as the research design. The research strategy is
consistent with past studies with similar aims.
It was intend to use the quantitative and method because the nature of the survey this research
administers will use about seven variables which analyzed using quantitative approach. It
38
generally involves the collection of primary data from large numbers of individuals with the
intention of projecting the results to a wider population. It includes surveys and content analysis.
Since the aim of the study was to generalize on the brand switching based on the representative
sample, a quantitative method was deemed suitable. Moreover, the findings are subjected to
some mathematical and statistical manipulations to produce broadly representative data.
3.2 Sample and Sampling Techniques
The target population of these studies is consumers of beer in the Gondar district (‘zone’). Since
there are one city and many towns and villages, the study focuses on a city and major five towns
based on the beer usage (consumption) and different geographical altitude. They are also in the
root roads of the district.
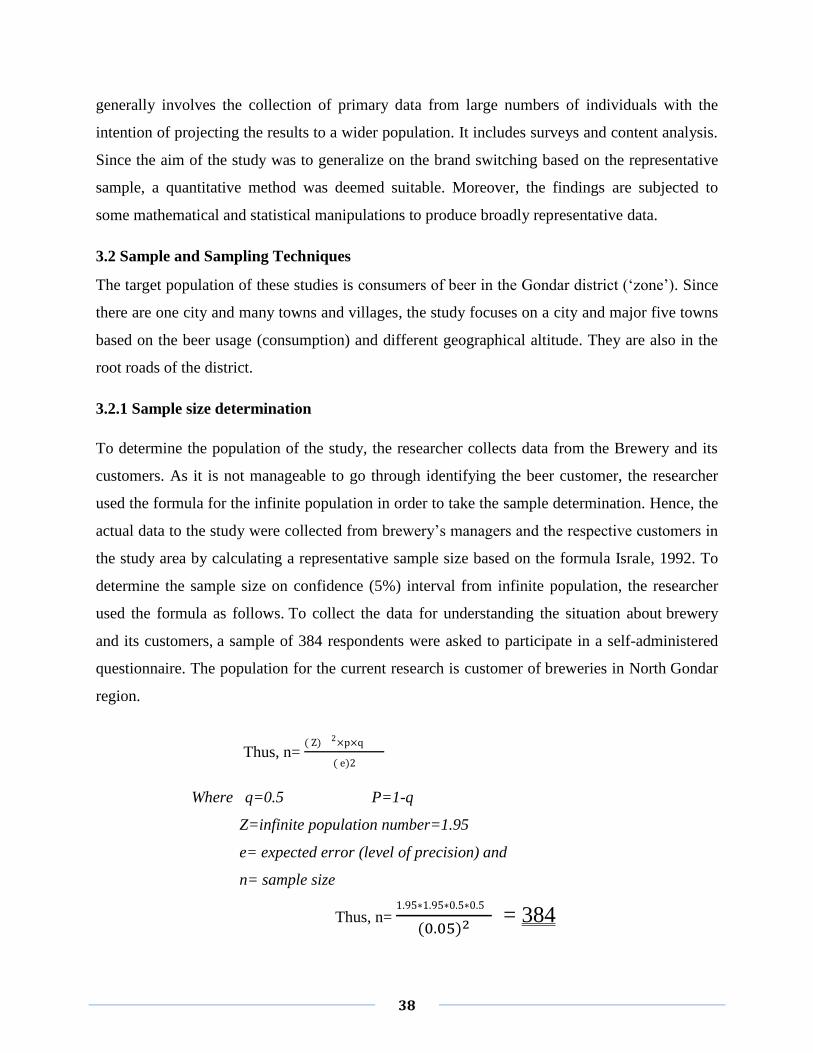
3.2.1 Sample size determination
To determine the population of the study, the researcher collects data from the Brewery and its
customers. As it is not manageable to go through identifying the beer customer, the researcher
used the formula for the infinite population in order to take the sample determination. Hence, the
actual data to the study were collected from brewery’s managers and the respective customers in
the study area by calculating a representative sample size based on the formula Israle, 1992. To
determine the sample size on confidence (5%) interval from infinite population, the researcher
used the formula as follows. To collect the data for understanding the situation about brewery
and its customers, a sample of 384 respondents were asked to participate in a self-administered
questionnaire. The population for the current research is customer of breweries in North Gondar
region.
Thus, n= ( Z) 2×p×q
( e)2
Where q=0.5 P=1-q
Z=infinite population number=1.95
e= expected error (level of precision) and
n= sample size
Thus, n= 1.95∗1.95∗0.5∗0.5
(0.05)2 = 384
39
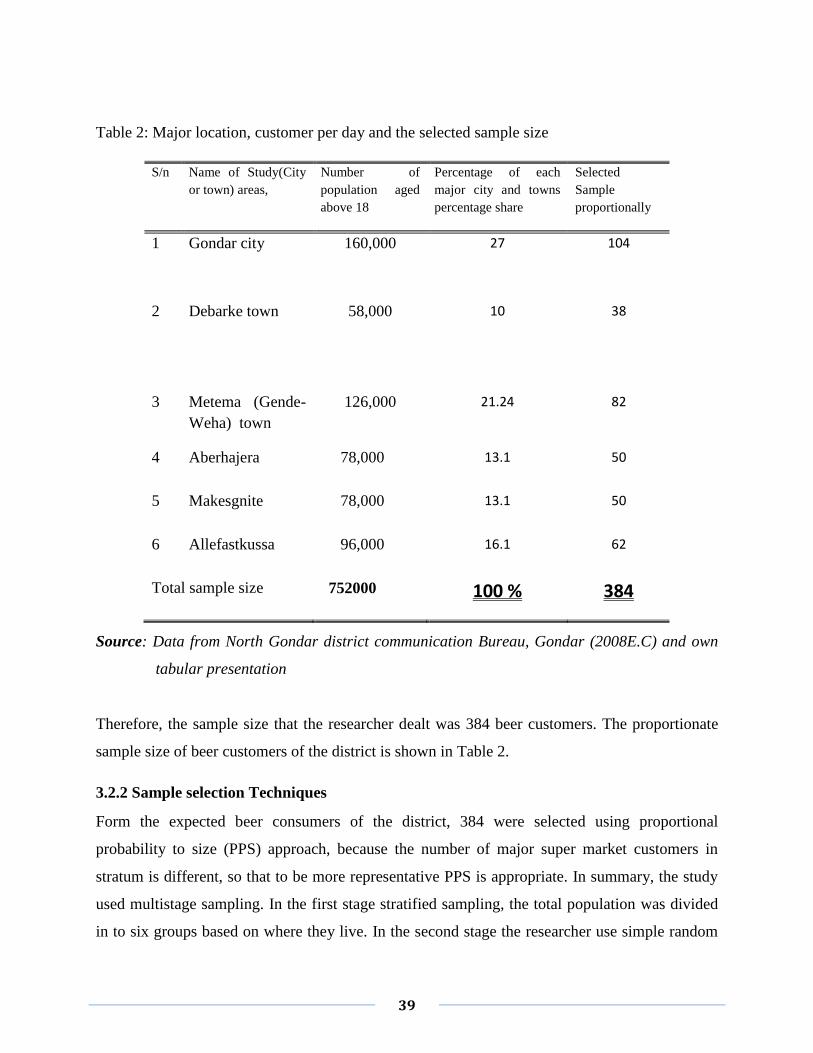
Table 2: Major location, customer per day and the selected sample size
Source: Data from North Gondar district communication Bureau, Gondar (2008E.C) and own
tabular presentation
Therefore, the sample size that the researcher dealt was 384 beer customers. The proportionate
sample size of beer customers of the district is shown in Table 2.
3.2.2 Sample selection Techniques
Form the expected beer consumers of the district, 384 were selected using proportional
probability to size (PPS) approach, because the number of major super market customers in
stratum is different, so that to be more representative PPS is appropriate. In summary, the study
used multistage sampling. In the first stage stratified sampling, the total population was divided
in to six groups based on where they live. In the second stage the researcher use simple random
S/n Name of Study(City
or town) areas,
Number of
population aged
above 18
Percentage of each
major city and towns
percentage share
Selected
Sample
proportionally
1 Gondar city 160,000 27 104
2 Debarke town 58,000 10 38
3 Metema (Gende-
Weha) town
126,000 21.24 82
4 Aberhajera 78,000 13.1 50
5 Makesgnite 78,000 13.1 50
6 Allefastkussa 96,000 16.1 62
Total sample size 752000 100 % 384
40
sampling to select because it is considered as the simplest, most convenient and bias free
selection method. It enables every member of the population to have an equal and independent
chance of being selected proportionately as respondents (Yamane, 1967).
For the purpose of getting different group of people, the study involved city and towns from
different corners. It involved a total of six a city and towns which are selected from the district.
A total of 384 respondents were included in the study, which were selected randomly.
3.3 Sources and Tools of Data Collection
This research used both primary and secondary data sources. The primary data was collected
using survey methods of data collection that is self administered questionnaire. The survey was
constituted by 31 item statements that represent 1 dependent variable assumed as “brand
switching behavior”; and seven independent variables referred demographic character, product
quality, price, switching cost, technological change, promotion, social influence and distribution.
Brand switching behavior of North Gondar districts consumers were selected in major City and
towns. Quantitative measure, in conjunction with five-point Likert scale (1= strongly disagree,
2= disagree, 3= neutral, 4= agree and 5= strongly agree), is used to measure responses/ rating of
participants to all survey items. In case of secondary data sources: Books, Journals, Research
papers and inter-net sources were used.
Since questionnaire is the tool for data collection, it administered among customers of beer in the
study areas. The questionnaire was first written in English, translated into Amharic and then
translated back to English to ensure the accuracy and consistency of wording. Consumer Brand
switching behavior is the dependent variable while demographic character, product quality,
price, switching cost, change in technology, promotion, social influence and distribution are
independent variables.
3.4 Procedure of Data Collection
During the data collection first a brief explanation about the questioner was given to each
participant on how to answer the questions through examples. The researcher tried to convince
participants to take time and answer the questionnaire in bar, restaurant, hotel, etc. During the
collection of questionnaires the researcher checked whether all the questions had been properly
answered.
41
3.5 Methods of Data Analysis
In this study descriptive statistics used to measure mean. Cronbach alpha test was employed to
determine the reliability of the internal consistency between individual psychological processes
which measured using multi item variable scales. Independent sample test and ANOVA test was
used to test the hypothesis.
3.6 Validity and Reliability
3.6.1 Validity
According to Rubin and Babbie (2001) content validity refers to the sampling adequacy of the
items of an instrument. It has to do with whether a measuring devise covers the full range of
meanings or forms that would be included in a variable being measured. Expert opinions
(advisor) were used in the design of the research instrument before it was used in the survey.
3.6.2 Reliability
Cronbach’s Alpha is an index of reliability associated with variation accounted for by the true
score of the underlying construct. Alpha coefficient range in value from 0 to 1 may be used to
describe the reliability of factors extracted from dichotomous (that is, questions with two
possible answers) and /or multi-point formatted questionnaires or scales (Struwig and Stead,
2001). Although there is no lower limit to the coefficient, the closer the Cronbach’s coefficient
alpha is to 1, the greater the internal consistency of the items of the scale. According to Guari
and Gronhaung (2005), coefficient of less than 0.6 is considered poor, those greater than 0.6, but
less than 0.8 are considered acceptable and coefficient greater than 0.8 are considered good. This
study’s questionnaire had an acceptable Cronbach’s alpha coefficient of 0.69.
3.7 Organization of the study
Chapter one deals with introduction, chapter two deals with review of related literature, research
design and methodology discussed in chapter three, Chapter four constitute results and
discussion and the last chapter, chapter five, summarized study provides conclusion and way
forward or recommendation.
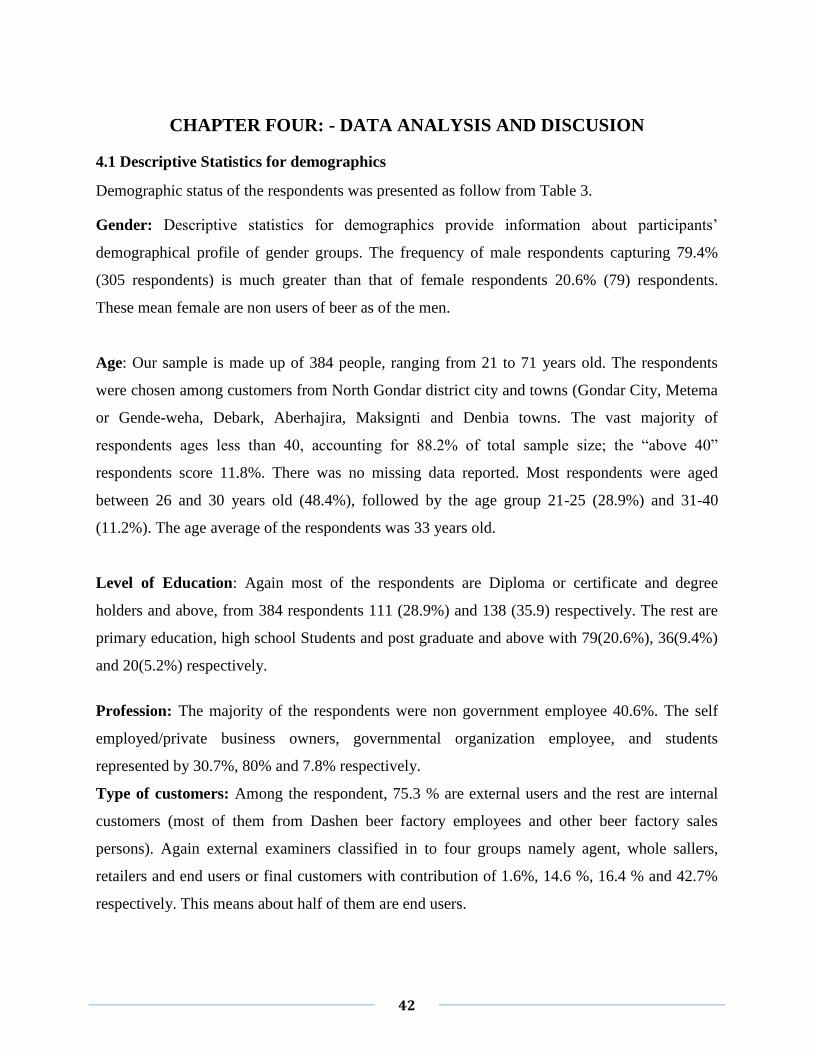
42
CHAPTER FOUR: - DATA ANALYSIS AND DISCUSION
4.1 Descriptive Statistics for demographics
Demographic status of the respondents was presented as follow from Table 3.
Gender: Descriptive statistics for demographics provide information about participants’
demographical profile of gender groups. The frequency of male respondents capturing 79.4%
(305 respondents) is much greater than that of female respondents 20.6% (79) respondents.
These mean female are non users of beer as of the men.
Age: Our sample is made up of 384 people, ranging from 21 to 71 years old. The respondents
were chosen among customers from North Gondar district city and towns (Gondar City, Metema
or Gende-weha, Debark, Aberhajira, Maksignti and Denbia towns. The vast majority of
respondents ages less than 40, accounting for 88.2% of total sample size; the “above 40”
respondents score 11.8%. There was no missing data reported. Most respondents were aged
between 26 and 30 years old (48.4%), followed by the age group 21-25 (28.9%) and 31-40
(11.2%). The age average of the respondents was 33 years old.
Level of Education: Again most of the respondents are Diploma or certificate and degree
holders and above, from 384 respondents 111 (28.9%) and 138 (35.9) respectively. The rest are
primary education, high school Students and post graduate and above with 79(20.6%), 36(9.4%)
and 20(5.2%) respectively.
Profession: The majority of the respondents were non government employee 40.6%. The self
employed/private business owners, governmental organization employee, and students
represented by 30.7%, 80% and 7.8% respectively.
Type of customers: Among the respondent, 75.3 % are external users and the rest are internal
customers (most of them from Dashen beer factory employees and other beer factory sales
persons). Again external examiners classified in to four groups namely agent, whole sallers,
retailers and end users or final customers with contribution of 1.6%, 14.6 %, 16.4 % and 42.7%
respectively. This means about half of them are end users.
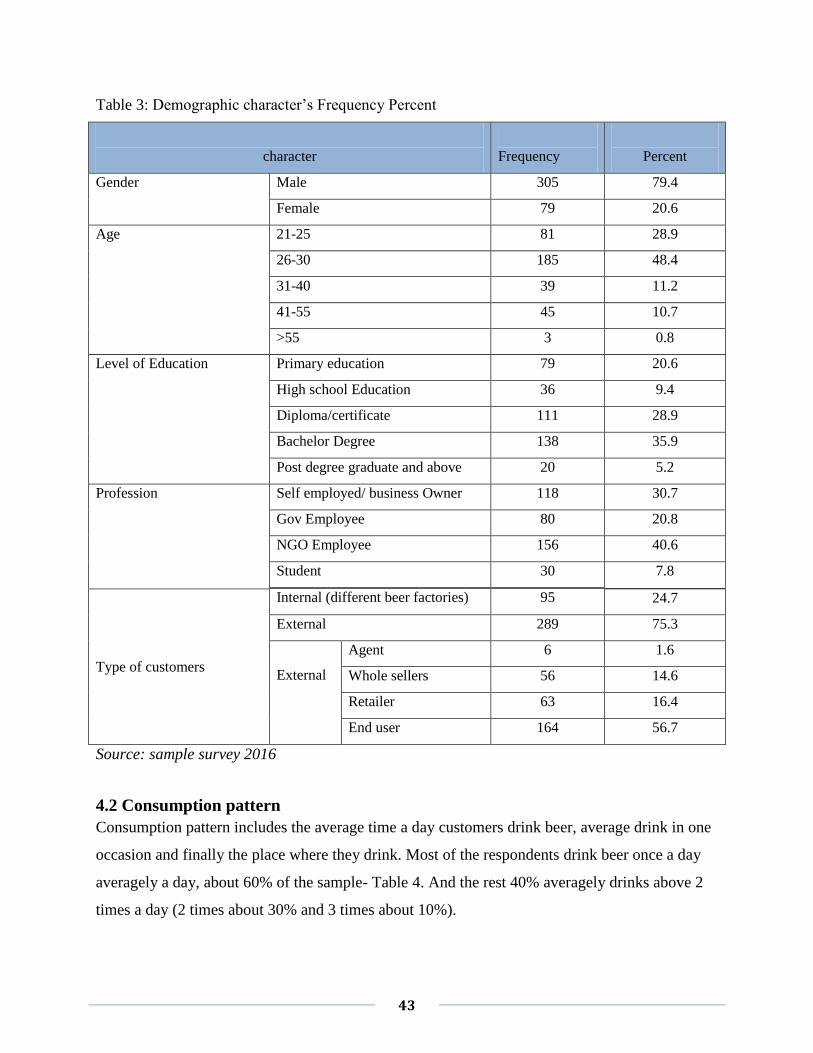
43
Table 3: Demographic character’s Frequency Percent
character
Frequency
Percent
Gender Male 305 79.4
Female 79 20.6
Age
21-25 81 28.9
26-30 185 48.4
31-40 39 11.2
41-55 45 10.7
>55 3 0.8
Level of Education Primary education 79 20.6
High school Education 36 9.4
Diploma/certificate 111 28.9
Bachelor Degree 138 35.9
Post degree graduate and above 20 5.2
Profession Self employed/ business Owner 118 30.7
Gov Employee 80 20.8
NGO Employee 156 40.6
Student 30 7.8
Internal (different beer factories) 95
Type of customers
24.7
External 289 75.3
External
Agent 6 1.6
Whole sellers 56 14.6
Retailer 63 16.4
End user 164 56.7
Source: sample survey 2016
4.2 Consumption pattern
Consumption pattern includes the average time a day customers drink beer, average drink in one
occasion and finally the place where they drink. Most of the respondents drink beer once a day
averagely a day, about 60% of the sample- Table 4. And the rest 40% averagely drinks above 2
times a day (2 times about 30% and 3 times about 10%).
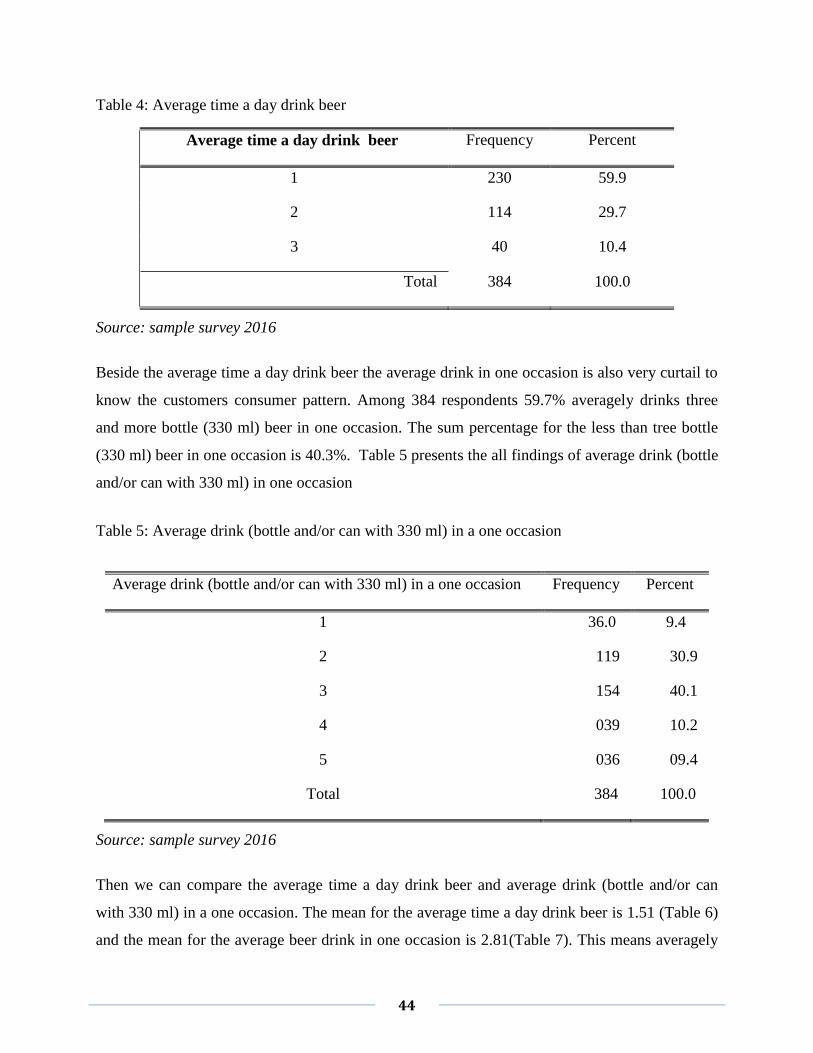
44
Table 4: Average time a day drink beer
Average time a day drink beer Frequency Percent
1 230 59.9
2 114 29.7
3 40 10.4
Total 384 100.0
Source: sample survey 2016
Beside the average time a day drink beer the average drink in one occasion is also very curtail to
know the customers consumer pattern. Among 384 respondents 59.7% averagely drinks three
and more bottle (330 ml) beer in one occasion. The sum percentage for the less than tree bottle
(330 ml) beer in one occasion is 40.3%. Table 5 presents the all findings of average drink (bottle
and/or can with 330 ml) in one occasion
Table 5: Average drink (bottle and/or can with 330 ml) in a one occasion
Average drink (bottle and/or can with 330 ml) in a one occasion Frequency Percent
1 36.0 9.4
2 119 30.9
3 154 40.1
4 039 10.2
5 036 09.4
Total 384 100.0
Source: sample survey 2016
Then we can compare the average time a day drink beer and average drink (bottle and/or can
with 330 ml) in a one occasion. The mean for the average time a day drink beer is 1.51 (Table 6)
and the mean for the average beer drink in one occasion is 2.81(Table 7). This means averagely
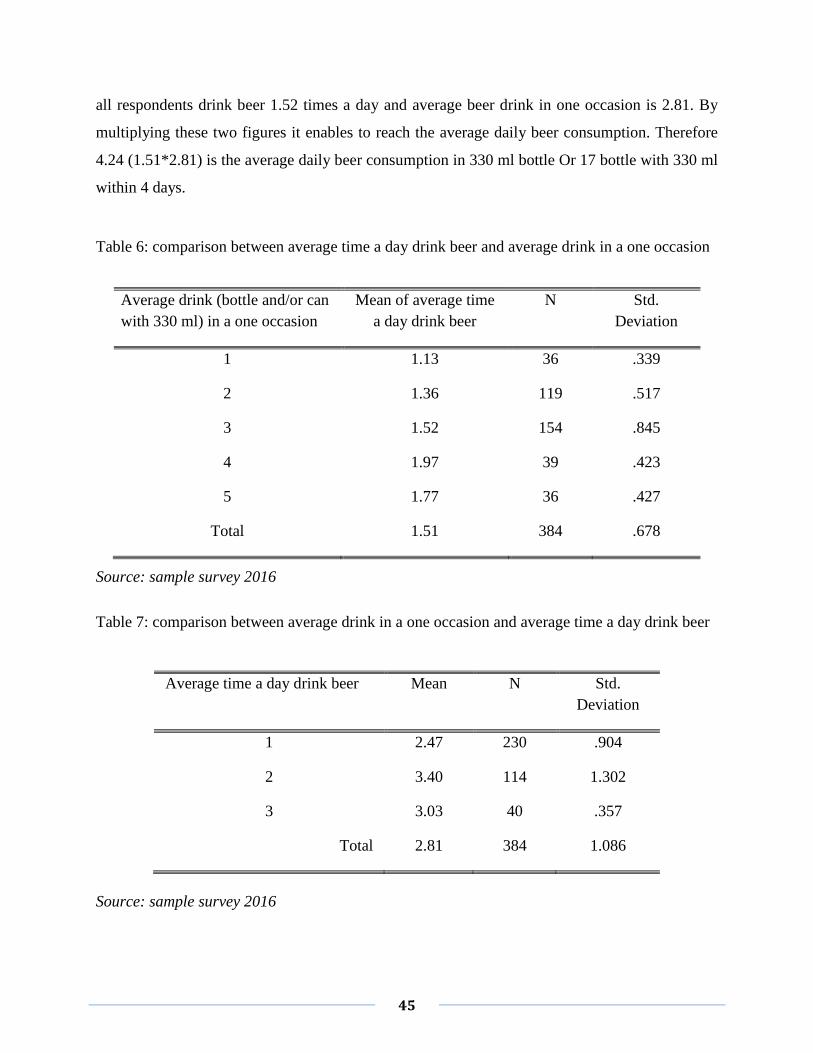
45
all respondents drink beer 1.52 times a day and average beer drink in one occasion is 2.81. By
multiplying these two figures it enables to reach the average daily beer consumption. Therefore
4.24 (1.51*2.81) is the average daily beer consumption in 330 ml bottle Or 17 bottle with 330 ml
within 4 days.
Table 6: comparison between average time a day drink beer and average drink in a one occasion
Average drink (bottle and/or can
with 330 ml) in a one occasion
Mean of average time
a day drink beer
N Std.
Deviation
1 1.13 36 .339
2 1.36 119 .517
3 1.52 154 .845
4 1.97 39 .423
5 1.77 36 .427
Total 1.51 384 .678
Source: sample survey 2016
Table 7: comparison between average drink in a one occasion and average time a day drink beer
Average time a day drink beer Mean N Std.
Deviation
1 2.47 230 .904
2 3.40 114 1.302
3 3.03 40 .357
Total 2.81 384 1.086
Source: sample survey 2016
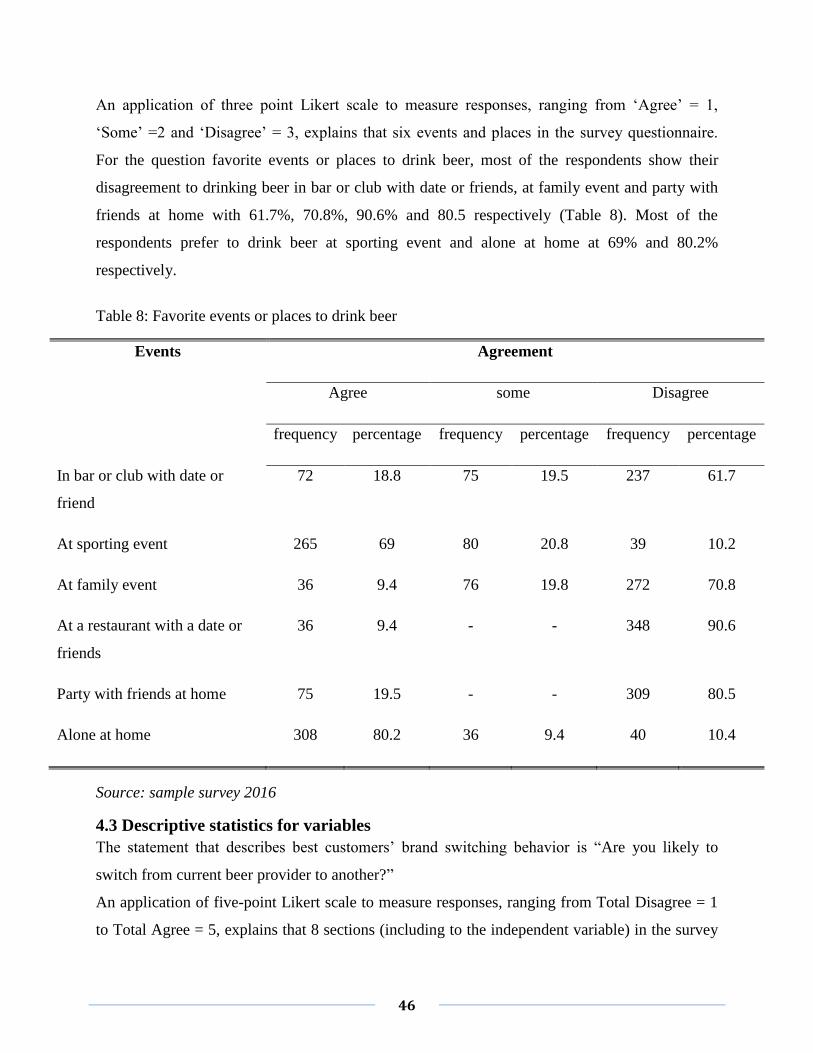
46
An application of three point Likert scale to measure responses, ranging from ‘Agree’ = 1,
‘Some’ =2 and ‘Disagree’ = 3, explains that six events and places in the survey questionnaire.
For the question favorite events or places to drink beer, most of the respondents show their
disagreement to drinking beer in bar or club with date or friends, at family event and party with
friends at home with 61.7%, 70.8%, 90.6% and 80.5 respectively (Table 8). Most of the
respondents prefer to drink beer at sporting event and alone at home at 69% and 80.2%
respectively.
Table 8: Favorite events or places to drink beer
Events Agreement
Agree some Disagree
frequency percentage frequency percentage frequency percentage
In bar or club with date or
friend
72 18.8 75 19.5 237 61.7
At sporting event 265 69 80 20.8 39 10.2
At family event 36 9.4 76 19.8 272 70.8
At a restaurant with a date or
friends
36 9.4 - - 348 90.6
Party with friends at home 75 19.5 - - 309 80.5
Alone at home 308 80.2 36 9.4 40 10.4
Source: sample survey 2016
4.3 Descriptive statistics for variables
The statement that describes best customers’ brand switching behavior is “Are you likely to
switch from current beer provider to another?”
An application of five-point Likert scale to measure responses, ranging from Total Disagree = 1
to Total Agree = 5, explains that 8 sections (including to the independent variable) in the survey
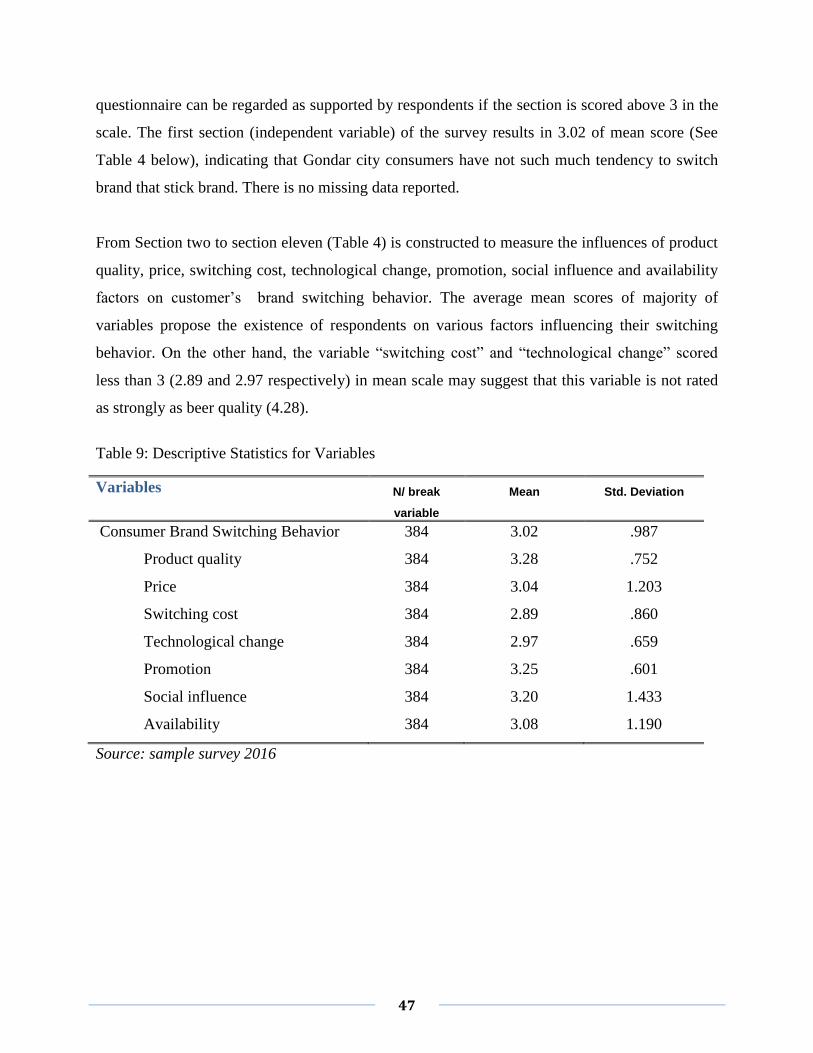
47
questionnaire can be regarded as supported by respondents if the section is scored above 3 in the
scale. The first section (independent variable) of the survey results in 3.02 of mean score (See
Table 4 below), indicating that Gondar city consumers have not such much tendency to switch
brand that stick brand. There is no missing data reported.
From Section two to section eleven (Table 4) is constructed to measure the influences of product
quality, price, switching cost, technological change, promotion, social influence and availability
factors on customer’s brand switching behavior. The average mean scores of majority of
variables propose the existence of respondents on various factors influencing their switching
behavior. On the other hand, the variable “switching cost” and “technological change” scored
less than 3 (2.89 and 2.97 respectively) in mean scale may suggest that this variable is not rated
as strongly as beer quality (4.28).
Table 9: Descriptive Statistics for Variables
Variables N/ break
variable
Mean Std. Deviation
Consumer Brand Switching Behavior 384 3.02 .987
Product quality 384 3.28 .752
Price 384 3.04 1.203
Switching cost 384 2.89 .860
Technological change 384 2.97 .659
Promotion 384 3.25 .601
Social influence 384 3.20 1.433
Availability 384 3.08 1.190
Source: sample survey 2016
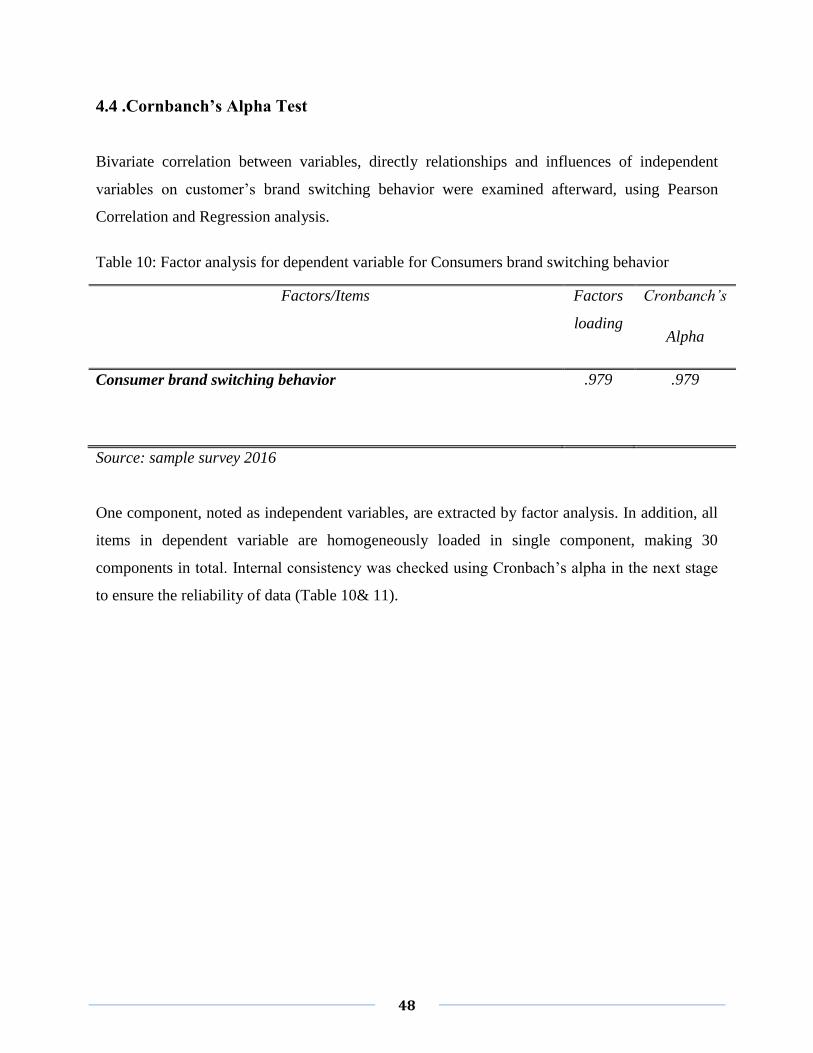
48
4.4 .Cornbanch’s Alpha Test
Bivariate correlation between variables, directly relationships and influences of independent
variables on customer’s brand switching behavior were examined afterward, using Pearson
Correlation and Regression analysis.
Table 10: Factor analysis for dependent variable for Consumers brand switching behavior
Factors/Items Factors
loading
Cronbanch’s
Alpha
Consumer brand switching behavior
.979 .979
Source: sample survey 2016
One component, noted as independent variables, are extracted by factor analysis. In addition, all
items in dependent variable are homogeneously loaded in single component, making 30
components in total. Internal consistency was checked using Cronbach’s alpha in the next stage
to ensure the reliability of data (Table 10& 11).
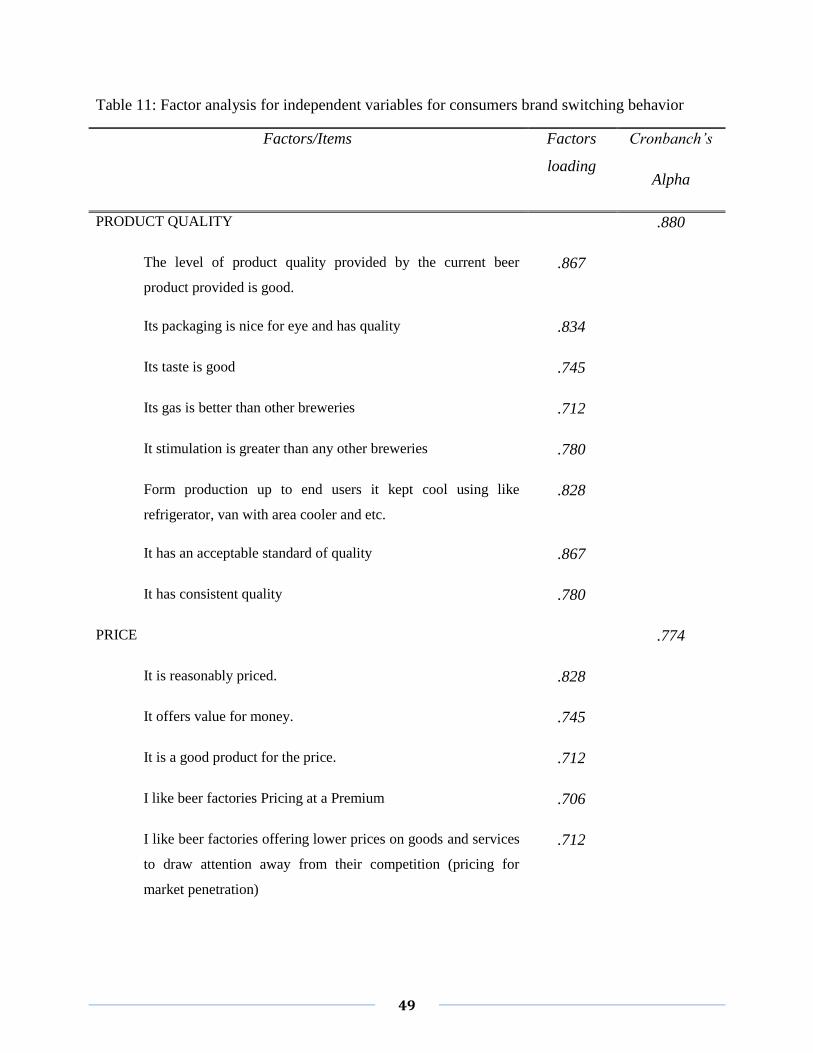
49
Table 11: Factor analysis for independent variables for consumers brand switching behavior
Factors/Items Factors
loading
Cronbanch’s
Alpha
PRODUCT QUALITY .880
The level of product quality provided by the current beer
product provided is good.
.867
Its packaging is nice for eye and has quality .834
Its taste is good .745
Its gas is better than other breweries .712
It stimulation is greater than any other breweries .780
Form production up to end users it kept cool using like
refrigerator, van with area cooler and etc.
.828
It has an acceptable standard of quality .867
It has consistent quality .780
PRICE .774
It is reasonably priced. .828
It offers value for money. .745
It is a good product for the price. .712
I like beer factories Pricing at a Premium .706
I like beer factories offering lower prices on goods and services
to draw attention away from their competition (pricing for
market penetration)
.712
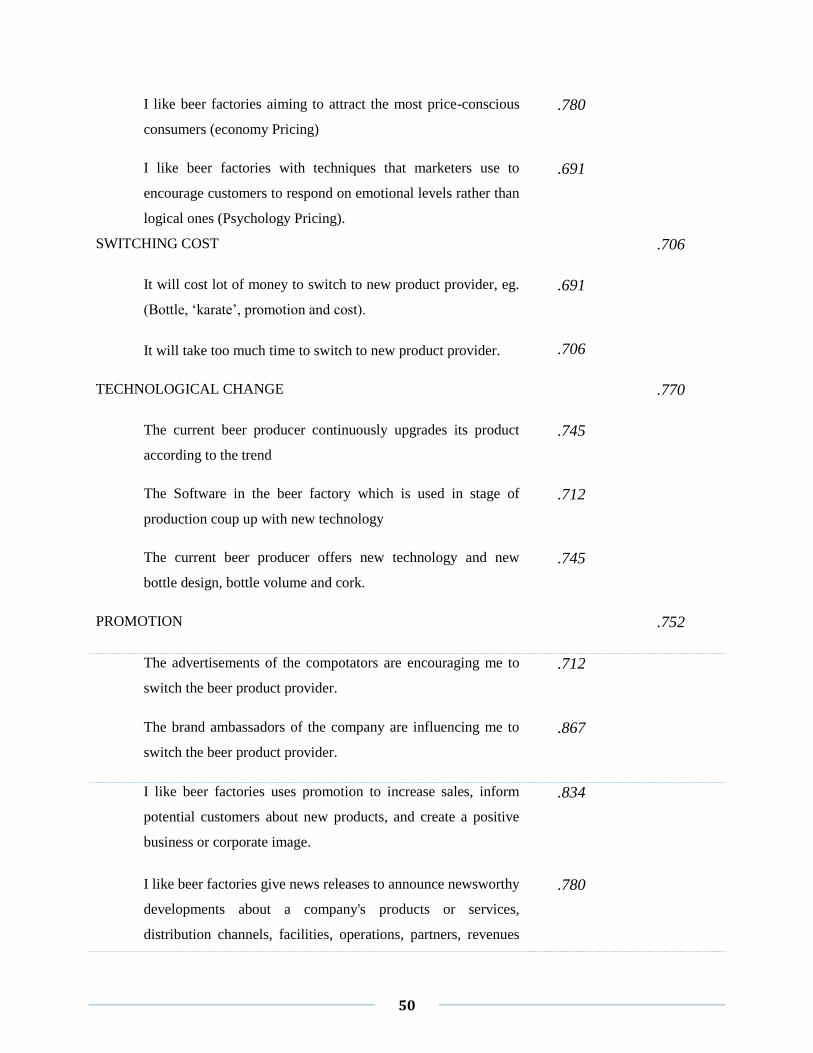
50
I like beer factories aiming to attract the most price-conscious
consumers (economy Pricing)
.780
I like beer factories with techniques that marketers use to
encourage customers to respond on emotional levels rather than
logical ones (Psychology Pricing).
.691
SWITCHING COST .706
It will cost lot of money to switch to new product provider, eg.
(Bottle, ‘karate’, promotion and cost).
.691
It will take too much time to switch to new product provider. .706
TECHNOLOGICAL CHANGE .770
The current beer producer continuously upgrades its product
according to the trend
.745
The Software in the beer factory which is used in stage of
production coup up with new technology
.712
The current beer producer offers new technology and new
bottle design, bottle volume and cork.
.745
PROMOTION .752
The advertisements of the compotators are encouraging me to
switch the beer product provider.
.712
The brand ambassadors of the company are influencing me to
switch the beer product provider.
.867
I like beer factories uses promotion to increase sales, inform
potential customers about new products, and create a positive
business or corporate image.
.834
I like beer factories give news releases to announce newsworthy
developments about a company's products or services,
distribution channels, facilities, operations, partners, revenues
.780
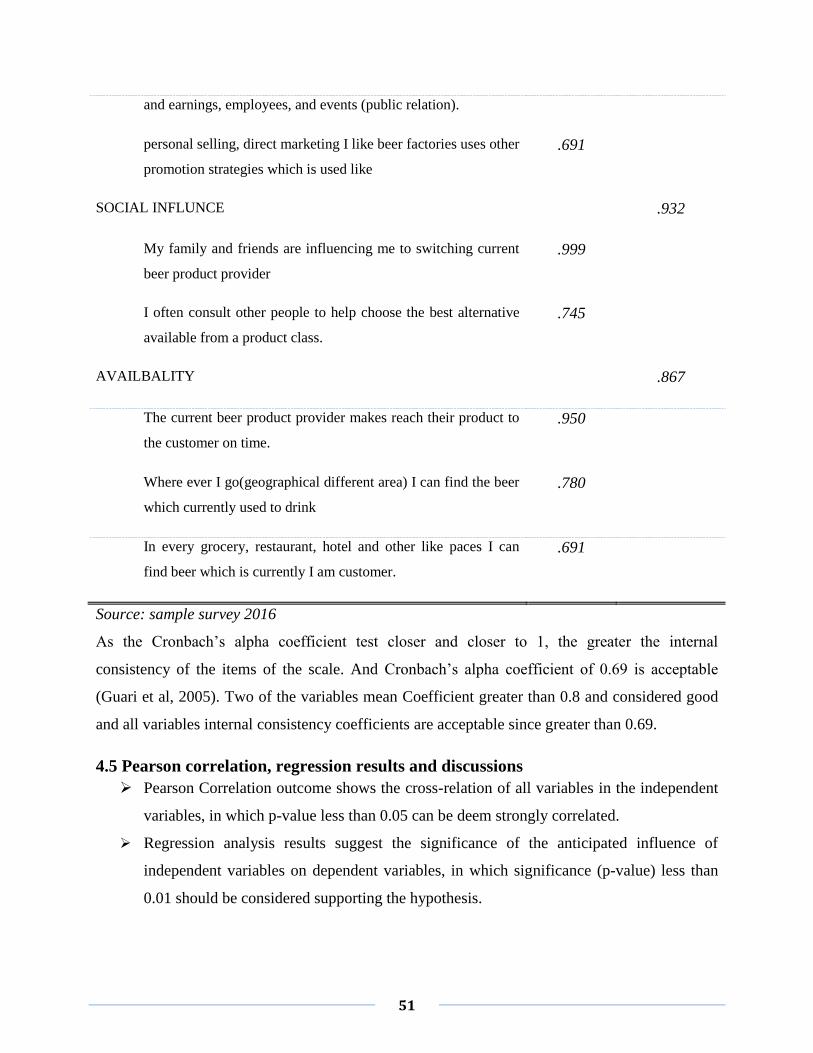
51
and earnings, employees, and events (public relation).
personal selling, direct marketing I like beer factories uses other
promotion strategies which is used like
.691
SOCIAL INFLUNCE .932
My family and friends are influencing me to switching current
beer product provider
.999
I often consult other people to help choose the best alternative
available from a product class.
.745
AVAILBALITY .867
The current beer product provider makes reach their product to
the customer on time.
.950
Where ever I go(geographical different area) I can find the beer
which currently used to drink
.780
In every grocery, restaurant, hotel and other like paces I can
find beer which is currently I am customer.
.691
Source: sample survey 2016
As the Cronbach’s alpha coefficient test closer and closer to 1, the greater the internal
consistency of the items of the scale. And Cronbach’s alpha coefficient of 0.69 is acceptable
(Guari et al, 2005). Two of the variables mean Coefficient greater than 0.8 and considered good
and all variables internal consistency coefficients are acceptable since greater than 0.69.
4.5 Pearson correlation, regression results and discussions
Pearson Correlation outcome shows the cross-relation of all variables in the independent
variables, in which p-value less than 0.05 can be deem strongly correlated.
Regression analysis results suggest the significance of the anticipated influence of
independent variables on dependent variables, in which significance (p-value) less than
0.01 should be considered supporting the hypothesis.
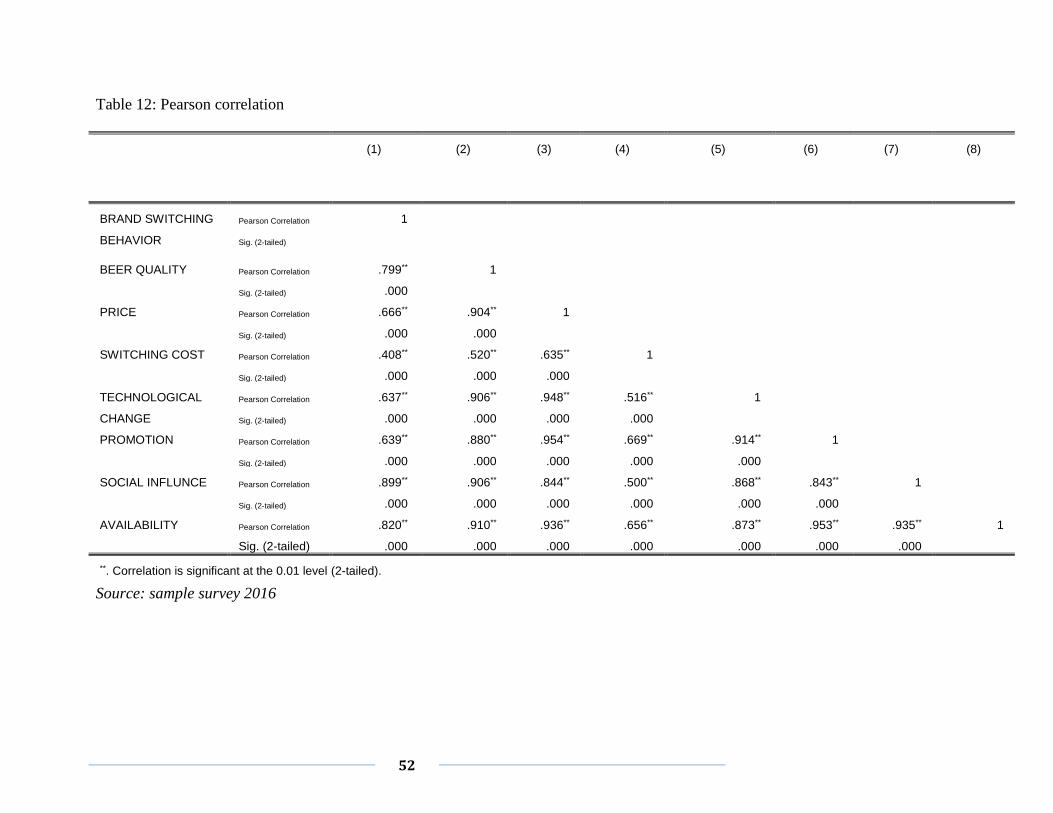
52
Table 12: Pearson correlation
Source: sample survey 2016
(1) (2) (3) (4) (5) (6) (7) (8)
BRAND SWITCHING
BEHAVIOR
Pearson Correlation 1
Sig. (2-tailed)
BEER QUALITY Pearson Correlation .799** 1
Sig. (2-tailed) .000
PRICE Pearson Correlation .666** .904** 1
Sig. (2-tailed) .000 .000
SWITCHING COST Pearson Correlation .408** .520** .635** 1
Sig. (2-tailed) .000 .000 .000
TECHNOLOGICAL
CHANGE
Pearson Correlation .637** .906** .948** .516** 1
Sig. (2-tailed) .000 .000 .000 .000
PROMOTION Pearson Correlation .639** .880** .954** .669** .914** 1
Sig. (2-tailed) .000 .000 .000 .000 .000
SOCIAL INFLUNCE Pearson Correlation .899** .906** .844** .500** .868** .843** 1
Sig. (2-tailed) .000 .000 .000 .000 .000 .000
AVAILABILITY Pearson Correlation .820** .910** .936** .656** .873** .953** .935** 1
Sig. (2-tailed) .000 .000 .000 .000 .000 .000 .000
**. Correlation is significant at the 0.01 level (2-tailed).
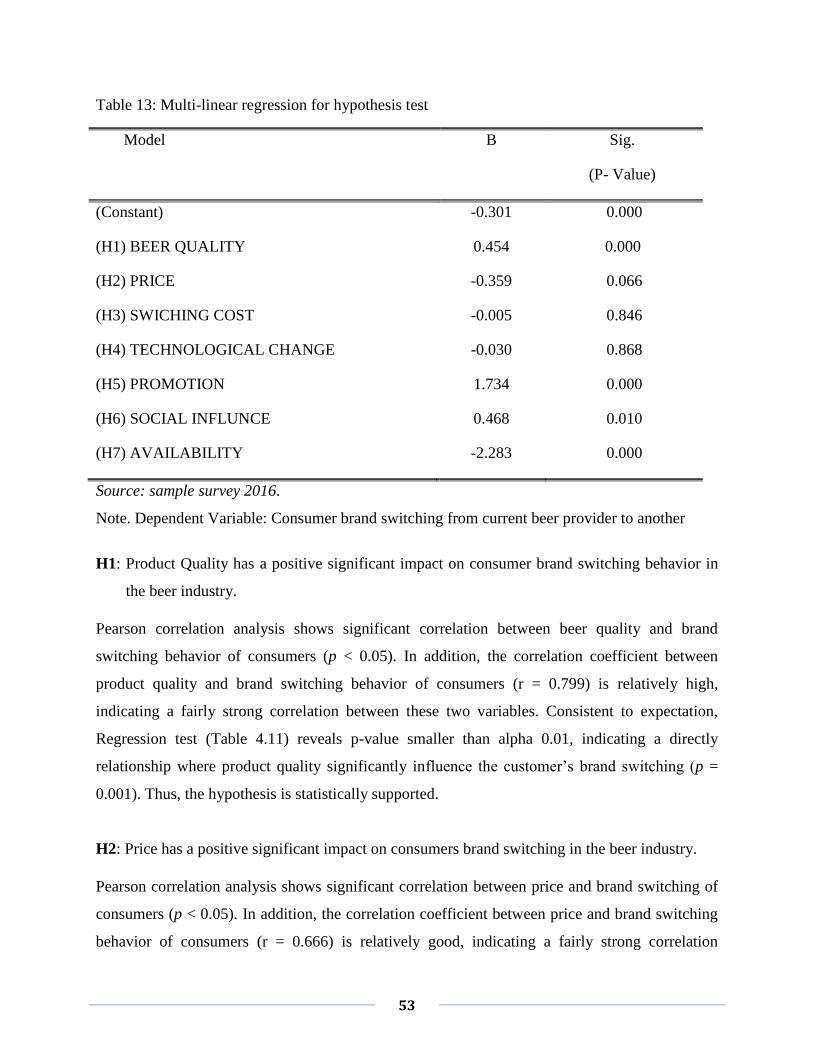
53
Table 13: Multi-linear regression for hypothesis test
Model B Sig.
(P- Value)
(Constant) -0.301 0.000
(H1) BEER QUALITY 0.454 0.000
(H2) PRICE -0.359 0.066
(H3) SWICHING COST -0.005 0.846
(H4) TECHNOLOGICAL CHANGE -0.030 0.868
(H5) PROMOTION 1.734 0.000
(H6) SOCIAL INFLUNCE 0.468 0.010
(H7) AVAILABILITY -2.283 0.000
Source: sample survey 2016.
Note. Dependent Variable: Consumer brand switching from current beer provider to another
H1: Product Quality has a positive significant impact on consumer brand switching behavior in
the beer industry.
Pearson correlation analysis shows significant correlation between beer quality and brand
switching behavior of consumers (p < 0.05). In addition, the correlation coefficient between
product quality and brand switching behavior of consumers (r = 0.799) is relatively high,
indicating a fairly strong correlation between these two variables. Consistent to expectation,
Regression test (Table 4.11) reveals p-value smaller than alpha 0.01, indicating a directly
relationship where product quality significantly influence the customer’s brand switching (p =
0.001). Thus, the hypothesis is statistically supported.
H2: Price has a positive significant impact on consumers brand switching in the beer industry.
Pearson correlation analysis shows significant correlation between price and brand switching of
consumers (p < 0.05). In addition, the correlation coefficient between price and brand switching
behavior of consumers (r = 0.666) is relatively good, indicating a fairly strong correlation
54
between these two variables. Does not Consistent to expectation, Regression test (Table 13)
reveals p-value greater than alpha 0.01(p=0.066). Thus, the hypothesis is not statistically
supported.
H3: Switching cost has a negative significant impact on consumers brand switching in the beer
industry.
Regression test (Table 13) reports no significant influence of switching cost on customer’s brand
switching behavior (p > 0.01); even if result obtained from Pearson correlation argues for a
significant correlation between these two variables (p < 0.05). Thus, the hypothesis is not
statistically supported.
The significant relationship observed from the result of Pearson correlation test may come from
the correlation of brand switching with other variables having significant directly relationship on
customer’s brand switching behavior revealed by Regression test. The correlation coefficient (r =
0.408), justifying for the significant correlation even though no significant directly influence
found between shopping atmosphere and customer’s brand switching behavior (Table 12).
H4: Change in technology has a positive significant impact on consumers brand switching in the
beer industry.
The p-value of Regression analysis (p > 0.01) exposes no significant influence between the in-
store layout and customer’s brand switching behavior (Table 13) in spite of the significant
relationship is observed from simple bivariate test (p < 0.05). Thus, the hypothesis is statistically
supported.
The significant relationship observed from the result of Pearson correlation test may come from
the correlation of change in technology with other variables having significant directly
relationship on customer’s brand switching behavior revealed by Regression test. The correlation
coefficient (r) between in-store layout and customer’s mood interaction are highest among
coefficients with other variables significantly influencing customer’s brand switching behavior
(r = 0.637), justifying for the significant correlation even though no significant direct influence
found between shopping experience and customer’s brand switching behavior (Table 12).
55
H5: Promotions have a positive significant impact on consumers brand switching in the beer
industry.
Pearson correlation analysis shows significant correlation between beer quality and brand
switching behavior of consumers (p = 0.000). Consistent to expectation, Regression test (Table
4.11) reveals p-value smaller than alpha test 0.05 (p = 0.001). Thus, the hypothesis is statistically
supported.
H6: Social influences have a positive significant impact on consumers brand switching in the
beer industry.
The p-value of Regression analysis (p= 0.01) exposes no significant influence between the
fashion and customer’s brand switching behavior (Table 13) even though the significant
relationship is observed from simple bivariate test (p < 0.05). Thus, the hypothesis is statistically
supported.
H7: Availability (Distribution) has a negative significant impact on consumers brand switching
in the beer industry.
Availability or distribution is found to be the strongest influential factor on customer’s brand
switching behavior, in that p-values generated by both Pearson correlation test (Table 12) and
Regression analysis (Table 13) are correspondingly equal to 0 (p = 0.000). In addition, the
correlation coefficient (r = 0.339) and influential coefficient (P= 0.000) are highest amongst
other variables with beer quality and promotion. The p-value of Regression analysis is less than
0.001, in conjunction with high value of (P), provide sufficient and excellent evidences about the
existence of the absolute directly relationship where in-store browsing significantly and directly
influences the customer’s brand switching behavior. Thus, the hypothesis statically supported.
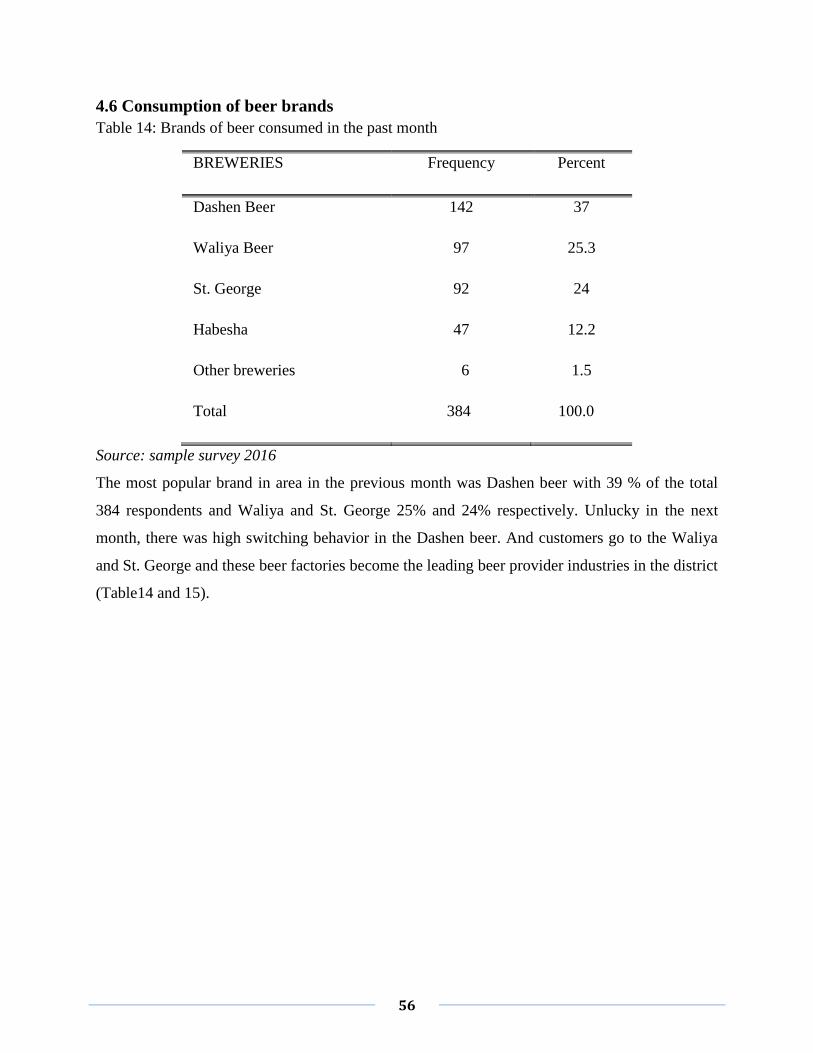
56
4.6 Consumption of beer brands
Table 14: Brands of beer consumed in the past month
BREWERIES Frequency Percent
Dashen Beer 142 37
Waliya Beer 97 25.3
St. George 92 24
Habesha 47 12.2
Other breweries 6 1.5
Total 384 100.0
Source: sample survey 2016
The most popular brand in area in the previous month was Dashen beer with 39 % of the total
384 respondents and Waliya and St. George 25% and 24% respectively. Unlucky in the next
month, there was high switching behavior in the Dashen beer. And customers go to the Waliya
and St. George and these beer factories become the leading beer provider industries in the district
(Table14 and 15).
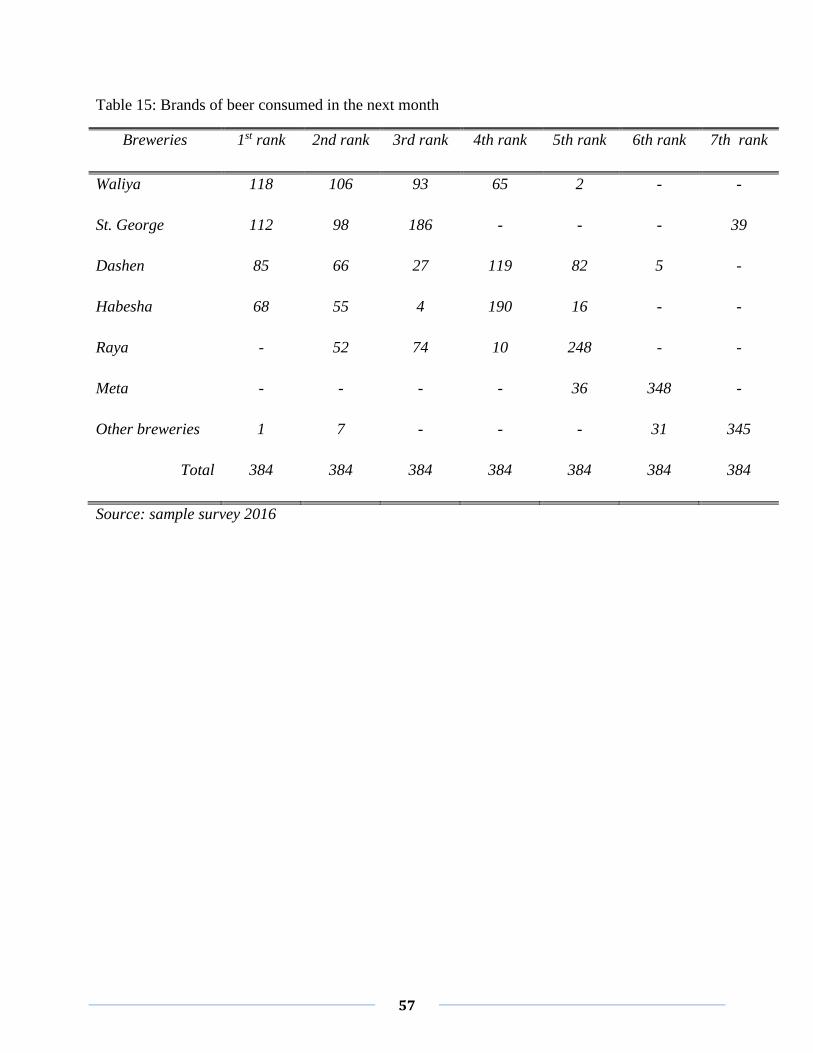
57
Table 15: Brands of beer consumed in the next month
Breweries 1st rank 2nd rank 3rd rank 4th rank 5th rank 6th rank 7th rank
Waliya 118 106 93 65 2 - -
St. George 112 98 186 - - - 39
Dashen 85 66 27 119 82 5 -
Habesha 68 55 4 190 16 - -
Raya - 52 74 10 248 - -
Meta - - - - 36 348 -
Other breweries 1 7 - - - 31 345
Total 384 384 384 384 384 384 384
Source: sample survey 2016
58
CHAPTER FIVE: SUMMARY, CONCLUSION AND RECOMMENDATION
Under these chapter the researcher employed summery, conclusion and recommendation so,
after successively collected and analyzed the data, we are finally able to draw a conclusion about
the customers’ brand switching behavior. Initially, the purpose of this thesis was to analyze the
factors affecting consumers’ brand switching behavior and to investigate the relationships
between those seven variables enabling us to predict customers’ brand switching behavior
through the studied techniques.
5.1 Summary
After successively collected and analyzed the data, we are finally able to draw a conclusion
about the customers’ brand switching behavior. Initially, the purpose of this thesis was to analyze
the factors affecting consumers’ brand switching behavior and to investigate the relationships
between those seven variables enabling us to predict customers’ brand switching behavior
through the studied techniques.
Thereby, in order to study the relationships, seven hypotheses have been stated shaping the
overall scheme of the thesis after reviewing the existing literature: (H1) Product Quality has a
significant impact on consumers brand switching in the beer industry. (H2) Price has a positive
significant impact on consumers brand switching in the beer industry. (H3) Switching cost has a
negative significant impact on consumers brand switching in the beer industry. (H4) Change in
technology has a significant impact on consumers brand switching in the beer industry.
(H5)Promotions have a significant impact on consumers brand switching in the beer industry.
(H6) Social influences have a significant impact on consumers brand switching in the beer
industry. And (H7) Availability (Distribution) has a significant impact on consumers brand
switching in the beer industry.
The analysis of the data collected among 384 respondent customers enabled us to answer the
hypothesis using the Pearson correlation and the standard multiple regression tests with the
software SPSS.
59
Among seven hypotheses, four of them have significant impact and the direction of the effect is
the same as shown in the hypotheses except promotion which goes in different direction from the
hypotheses, these accepted hypotheses are, product quality has significant difference in affecting
brand switching behavior.
The result of the study states that there is a directly relationship between customers’ brand
switching behaviors that are; promotion positively affect brand switching behavior, product
quality positively affect consumers brand switching behavior, social influence positively affect
(induces) brand switching behavior of consumers, and availability/distribution positively affect
consumers brand switching behavior .
The remaining hypotheses price, switching cost and technological change are rejected
hypotheses.
60
5.2 Conclusion
Thus, it has been concluded that usage rate of beer among the select individuals has been high
and their buying behavior is also very frequent. It has been observed that most of the people are
aware of the quality, price and etc. price, availability, promotion, and quality of the product also
plays an important role in buying the beer products. Also, it has been found that various factors
that influence the switching behavior of the consumer’s are product quality, price, switching
cost, technological change, promotion, social influence, availability, to try new option etc.
The main objective of this thesis is to identify factors affecting consumer brand switching
behavior. In order to achieve the main and other specific objectives, the researcher formulates
seven hypotheses by reviewing different researches conducted before to find out the fact in the
light of collected data in the north Gondar district.
Before collection of the whole data the validity and reliability was tested by pilot survey. And
the result was good. And by collecting the whole data using SPSS software, the data was
processed. All variables scored greater than 0.69 which was required to be incorporated in the
questionnaire.
And regarding the findings of the thesis average daily beer drink in the area is 4.24, bottle (330
ml) per day. The most popular brand in area in the previous month was Dashen beer with 39 %
of the total 384 respondents and Waliya and St. George 25% and 24% respectively. Unlucky in
the next month, there was high switching behavior in the Dashen beer. And customers go to the
Waliya and St. George and these beer factories become the leading beer provider industries in
the district.
5.3 Recommendation
By the factors for the consumer brand switching behavior, brewery industries should accompany
with the following recommendation in order to escape from Complete or fractional brand
switching before customers shut all their preference and move completely to some other service
provider.
61
One of the variables in affecting consumers brand switching behavior is product quality which
means as the quality of the beer decreases or with the introduction of other best beer the brand
switching behavior will cost beer industries losing their customers. Therefore always keeping the
quality of the beer in packaging with qualitative material, good testing, greater stimulation, better
gas and organized cooling machines from production to end users with consistent quality would
lead to serve the purpose.
Promotion also affects consumers brand switching behavior. Beer factories should take care
about the advertisements and brand ambassadors. Using different promotion mix like coupons,
product samples, point-of-purchase displays, donations to schools, hospitals and other public
service providers make the most to handle the customers of the beer product.
Beside the beer quality and promotion, beer industries should build their credibility in the society
in order to become not loser because of social influence in the brand switching. And distribution
in terms of availability in different geographic area, in every grocery, restaurant, hotel and other
like places provide on time has its own contribution in consumer brand switching behavior.
Therefore, here it needs attention regarding social influence and availability to escape form brand
switching.
In contrary to the factors affecting brand switching price, switching cost and technological
change did not have any significances influence on brand switching behavior. Due to these
regarding technological change whether use manually or without human contact, labor intensive
or not, does not matter; rather considering about only creating employment opportunity or capital
intensive to cut the budget. Also applying economic pricing or psychological pricing does not
have significant impact.
5.4 Further studies
As consumers brand switching have a universal behavior observed regardless demographical or
geographical constraints, researches with other demographical and geographical groups may
enable a deeper understanding of the phenomenon and the influences of visual merchandising
upon brand switching behavior.
62
Furthermore, the research’s segment might have affected the results to a certain extent. The
analysis is based on data collected from 384 respondents, customers ranging from 21 to 71,
residents in North Gondar district.
Among the different factors affecting consumers’ brand switching behavior only seven have
been studied through the thesis: but rest also affect brand switching behavior, studies regarding
political issue, emotional situations and health benefits can be considered for future researches.
Such as These factors do not included in the main thesis, because it would not manageable
dealing with so many variables at a single thesis.
63
Reference Aaker, D. A. (1991). Managing Brand Equity. New York, N.Y: The Free Press.
Aaker, D. A. (1996). Measuring brand equity across products and markets. California
Management Review, 38(3),102-121.
Aaker, D. A., Batra, R. and Myers, J. G. (1992), Advertising Management, 4th ed, Prentice Hall,
Englewood Cliffs, NJ.
Ajzen, I. and Fishbein, M. (1980), Understanding Attitudes and Predicting Social Behavior,
Englewood Cliffs, NJ: Prentice-Hall, Inc.
Alvarez, B. A. and Casielles, R. V. (2005), Consumer evaluations of sales promotion: the effect
on brand choice, European Journal of Marketing, Vol. 39, No. ½, pp. 54-70.
Berden, T. P. J., Brombacher, A. C., and Sander, P. C. (2000), The building bricks of product
quality: An overview of some basic concepts and principles, International Journal of
Production Economics, Vol. 67, pp. 3-15.
Babor, T. F., and Mendelson, J. H., Greenberg, I., and Kuehnle, J. (1978), Experimental analysis
of the ‘happy hour: effects of purchase price on alcohol consumption’,
Psychopharmocology, Vol. 58, pp. 35-41.
Bagozzi, R. P. (1986), Principles of Marketing Management, Science Research Associates,
Chicago, IL.
Bagozzi, R. P., Baumgartner, H., and Yi, Y. (1992), State versus action orientation and the
theory of reasoned action: application to coupon usage, Journal of Consumer Research,
Vol. 18, March, pp. 505-518.
Ballantyne, R., Warren, A., and Nobbs, K. (2006), The evolution of brand choice, Brand
Management, Vol. 13, No. 4/5, pp. 339-352.
Bandura, A. (1977). Social Learning Theory. New York: Prentice Hall.
Bearden, W. O. and Etzel, M. J. (1982), Reference group influence on product and brand
purchase decisions, Journal of Consumer Research, Vol. 9, No. 2, pp. 183-194.
Belk, R. (1974), An exploratory assessment of situational effects in buyer behavior,
Journal of Marketing Research, Vol. 11, pp. 156-163.
Bentz, Y. and Merunka, D. (2000), Neural networks and the multinomial logit for brand choice
modelling: a hybrid approach, Journal of Forecasting, Vol. 19, pp. 177-200.
64
Berden, T. P. J., Brombacher, A. C., and Sander, P. C. (2000), The building bricks of product
quality: An overview of some basic concepts and principles, International Journal of
Production Economics, Vol. 67, pp. 3-15.
Calantone, R. and Knight, G. (2000), The critical role of product quality in the international
performance of industrial firms, Industrial Marketing Management, Vol. 29, pp. 493-506.
Charlton, P. and Ehrenberg, A. S. C. (1973), McConnell’s experimental brand choice
data, Journal of Marketing Research, Vol. X, pp. 302-307.
Chib, S., Seetharaman, P. B., and Strijnev, A. (2004), Model of brand choice with a no purchase
option calibrated to scanner-panel data, Journal of Marketing Research, Vol.
XLI, pp. 184-196
Collins, R. L., Schell, T., Ellickson, P. L., and McCaffrey, D. (2003), Predictors of beer
advertising awareness among eighth graders, Addiction, Vol. 98, pp. 1297-1306.
Eagly, A. H. and Shelly, C. (1993), The Psychology of Attitudes. Orlando, FL: Harcourt Brace
Jovanovich, Inc.
Erdem, T. and Swait, J. (2004), Brand credibility, brand consideration, and choice, Journal
of Consumer Research, Vol. 31, pp. 191-198.
Faden, Vivian B. (2006), Trends in initiation of alcohol use in the United States 1975 to 2003,
Alcoholism: Clinical and Experimental Research, Vol. 30, No. 6, pp. 1011-1022, June,
from NHSDA 1998.
Feltham, T. S. (1998), Leaving home: Brand purchase influences on young adults, Journal of
Consumer Marketing, Vol. 15, No. 4, pp. 372-385.
Fornell, C., Johnson, M. D., Anderson, E. W., Cha, J. and Bryant, B. E. (1996), The
American customer satisfaction index: Nature, purpose, and findings, Journal of
Marketing, Vol. 60, pp. 7-18.
Hartford, T. C., Weschsler, H., and Rohman, M. (1983), ‘The structural context of college
drinking’, Journal of Studies on Alcohol, Vol. 44, pp. 722-732.
Hoyer, W. D. and MacInnis, D. J. (2004), Consumer Behavior, 3rd Edition, Boston: Houghton
Mifflin Company.
http://vinepair.com/wine-blog/the-10-most-popular-beers-in-the-world-2015/
http://www.ethiopian-news.com/beer-consumption-rise-ethiopia/ he Beer Globe: Which
65
Breweries Dominate All over the World
http://www.ethiopian-news.com/beer-consumption-rise-ethiopia/ The Beer Globe: Which
Breweries Dominate All Over the World
Hruschka, H. (2002), Market share analysis using semi-parametric attraction models, European
Journal of Operational Research, Vol. 138, pp. 112-225.
Lai, A. (1991), Consumption situation and product knowledge in the adoption of a new product,
European Journal of Marketing, Vol. 25, No. 10, pp. 55-67.
Lambert, Z. V. (1972), Price and choice behavior, Journal of Marketing Research,
Vol. IX, pp. 35-40.
Léger, J. and Scholz, D. (2004), The fickle beer consumer, Marketing Magazine, Vol. 109, No.
17.
Mayhew, G. E. and Winer, R. S. (1992), An empirical analysis of internal and external reference
prices using scanner data, Journal of Consumer Research, Vol. 19, June, pp. 62-70.
Miller, K. E. and Ginter, J. L. (1979), An investigation of situational variation in brand
choice behavior and attitude, Journal of Marketing Research, Vol. XVI, pp. 111-123.
O’Callaghan, F. V., Chant, D. C., Callan, V. J., and Baglioni, A. (1997), Models of
alcohol use by young adults: An examination of various attitude-behavior theories,
Journal of Studies on Alcohol, Vol. 58, No. 5, pp. 502-507.
Orth, U. R. (2005), Consumer personality and other factors in situational brand choice variation,
Brand Management, Vol. 13, No. 2, pp. 115-133.
Orth, U. R., McDaniel, M. R., Shellhammer, T., and Lopetcharat, K. (2004), Promoting brand
benefits: The role of consumer psychographics and lifestyle, Journal of Consumer
Marketing, Vol. 21, No. 4, pp. 31-47.
Orth, U. R., McGarry Wolf, M., and Dodds, T. (2005), Dimensions of wine region equity and
their impact on consumers preferences, Journal of Product and Brand Management, Vol.
14, No. 4, pp. 477-489.
Österberg, E. (1995), Do alcohol prices affect consumption and related problems? In: H. D.
Holder and G. Edwards (eds.), Alcohol and Public Policy: Evidence and Issues. New
York: Oxford University Press, pp. 145-163.
Quester, P. G. and Smart, J. (1998), The influence of consumption situation and product
66
involvement over consumers’ use of product attributes, Journal of Consumer Marketing,
Vol. 15, No. 3, pp. 220-238.
Schwartz, R. H., Farrow, J. A., Banks, B., and Giesel, A. E. (1998), Use of false ID cards and
other deceptive methods to purchase alcoholic beverages during high school, Journal of
Addictive Diseases, Vol. 17, No. 3, pp. 25-33.
Singh, V. P., Hansen, K. T., and Sachin, G. (2005), Modeling preferences for common
attributes in multicategory brand choice, Journal of Marketing Research, Vol. XLII, pp.
195-209.
Stafford, J. E. and Cocanougher, B. A. (1977), Reference group theory. Selected Aspects of
Consumer Behavior, Washington, DC: Superintendent of Documents, U.S. Government
Printing Office, pp. 361-380.
Trafimow, D. and Fishbein, M. (2001), The moderating effect of behavior type on the subjective
norm-behavior relationship, The Journal of Social Psychology, Vol. 134, No. 6, pp. 755-
763.
Vazquez, R., Belen del Rio, R., and Iglesias, V. (2002), Consumer-based brand equity:
Development and validation of a measurement instrument, Journal of Marketing
Management, Vol. 18, No. ½, pp. 27-48.
Wagner, U. and Taudes, A. (1986), A multivariate polya model of brand choice and purchase
incidence, Marketing Science, Vol. 5, No. 3, pp. 219-244.
Walsh, G. and Mitchell, V. (2005), Demographic characteristics to consumers who find it
difficult to decide, Marketing Intelligence and Planning, Vol. 23, No. 2/3, pp. 281-295.
Wilks, J. and Callan, V. J. (1990), A diary approach to analyzing young adults’ drinking events
and motivations, Australian Drug and Alcohol Review, Vol. 5, pp. 3-7.
Woodside, A. G. and Fleck Jr., R. A. (1979), The case approach to understanding brand choice,
Journal of Advertising Research, Vol. 19, No. 2, pp. 23-30.
Xiaohua, L. and Germain, R. (2003), Product quality orientation and its performance
implications in Chinese state-owned enterprises, Journal of International Marketing, Vol.
11, No. 2.

APPENDICES
Annex 1፡ Questionnaire English Version
`
Questionnaire for Brand Switching Behavior in brewery industry Survey (To be filled by North
Gondar Beer Customers)
Dear respondents,
This is a survey on Brand switching behavior in brewery industry, case of north Gondar district (Zone), Ethiopia.
And the finding of the questioner primary undertake as requirement for the fulfillment of masters of art in
marketing administration (MA). Brand switching is defined as “a situation in which someone changes from
buying one brand of a product to buying a different brand.” Allowing customers to participate in loyalty
commitment is expected to know the factors customer brand switching behavior .
The collected data will be used only for purpose of this study. Therefore, the researcher requests you to
voluntarily respond to the questionnaire and provide accurate and complete data to the data collector. The survey
is organized under four sections: these sections are about demographic information, consumer behavior, brand
switching behavior buying behavior related factors and brand choices. The information you provide will be kept
confidential & cannot be transferred to a third party.
The purposes of the study are:
I. To understand Brand switching behavior in North Gondar District (Zone) context.
II. To identify the major factors affecting brand switching behavior.
The researcher is kindly requesting you to provide the necessary information to the best of your knowledge.
Completing this questionnaire will take you about 20 minutes. Thank you in advance for spending your valuable
time to answer the questions

Section I: DEMOGRAPHIC INFORMATION
When answering this section put “X” mark on the box and in blank write the appropriate
figure.
1. Gender, Male Female
2. Age (in Years) _____________
3. Level of education:
Illiterate Primary education High school education
Diploma/certificate Bachelor degree Post-graduate degree and above
4. Occupation
Self employed/business owner Government employment
Student NGO employment
Unemployed Housewife
Other (please specify) _________________
5. Type of customer: Internal External Other
5.1 If you are external customer,
Agent Whole seller
Retailer End user (consumer)
Section II. Consumption Pattern
6. On average how many times a day do you drink beer? _____________
7. How much beer on average do you drink (bottle and/or can with 330 ml) in a one occasion?
________________
(Please do not include mixed drinks or other drinks that are not considered beer for your
answer)
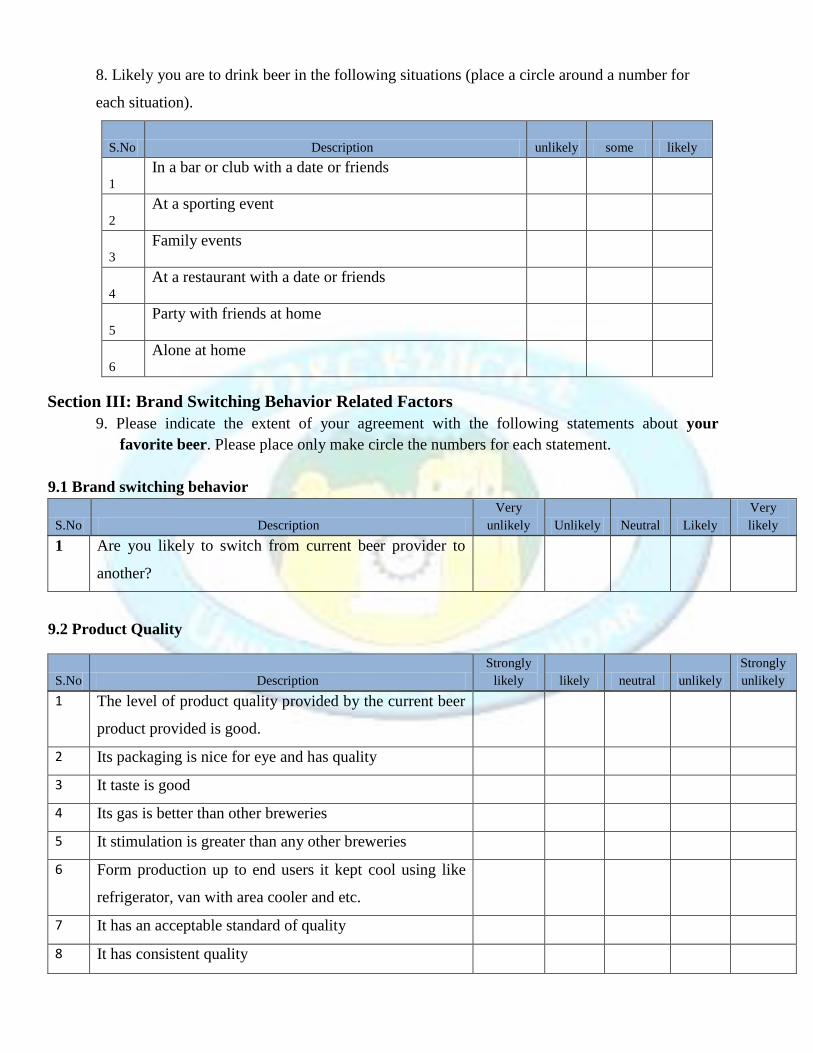
8. Likely you are to drink beer in the following situations (place a circle around a number for
each situation).
S.No Description unlikely some likely
1
In a bar or club with a date or friends
2
At a sporting event
3
Family events
4
At a restaurant with a date or friends
5
Party with friends at home
6
Alone at home
Section III: Brand Switching Behavior Related Factors
9. Please indicate the extent of your agreement with the following statements about your
favorite beer. Please place only make circle the numbers for each statement.
9.1 Brand switching behavior
S.No Description
Very
unlikely Unlikely Neutral Likely
Very
likely
1 Are you likely to switch from current beer provider to
another?
9.2 Product Quality
S.No Description
Strongly
likely likely neutral unlikely
Strongly
unlikely
1 The level of product quality provided by the current beer
product provided is good.
2 Its packaging is nice for eye and has quality
3 It taste is good
4 Its gas is better than other breweries
5 It stimulation is greater than any other breweries
6 Form production up to end users it kept cool using like
refrigerator, van with area cooler and etc.
7 It has an acceptable standard of quality
8 It has consistent quality
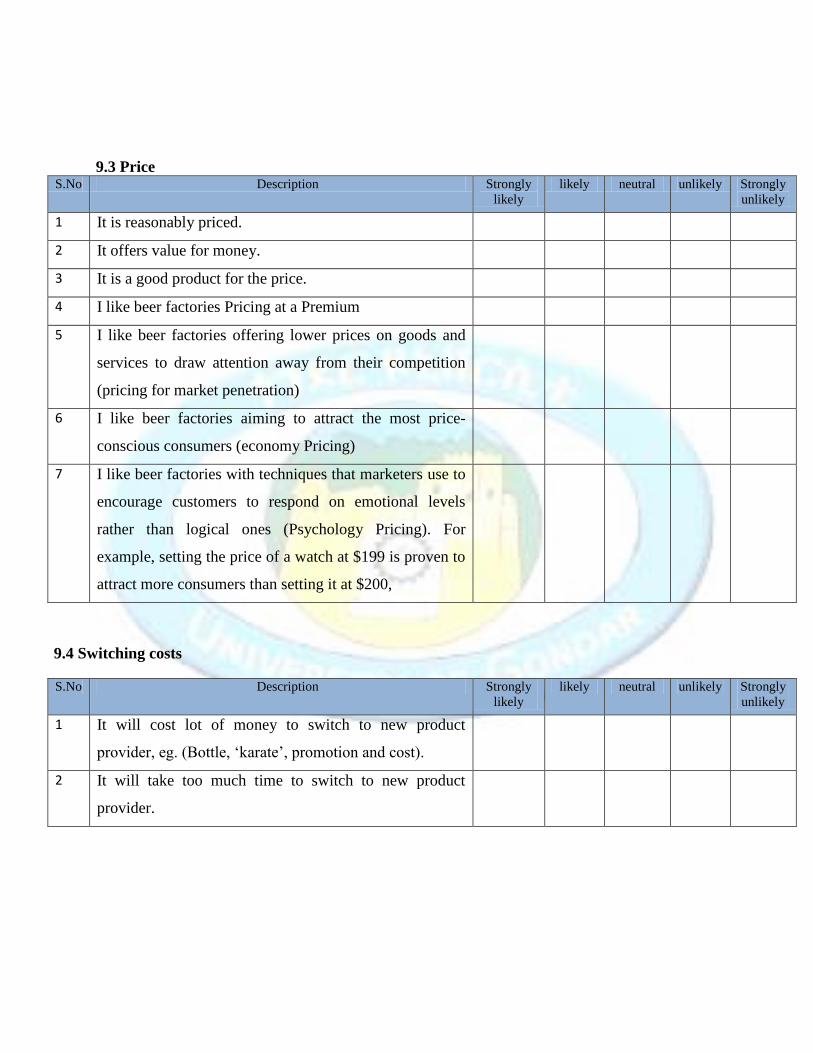
9.3 Price S.No Description Strongly
likely
likely neutral unlikely Strongly
unlikely
1 It is reasonably priced.
2 It offers value for money.
3 It is a good product for the price.
4 I like beer factories Pricing at a Premium
5 I like beer factories offering lower prices on goods and
services to draw attention away from their competition
(pricing for market penetration)
6 I like beer factories aiming to attract the most price-
conscious consumers (economy Pricing)
7 I like beer factories with techniques that marketers use to
encourage customers to respond on emotional levels
rather than logical ones (Psychology Pricing). For
example, setting the price of a watch at $199 is proven to
attract more consumers than setting it at $200,
9.4 Switching costs
S.No Description Strongly
likely
likely neutral unlikely Strongly
unlikely
1 It will cost lot of money to switch to new product
provider, eg. (Bottle, ‘karate’, promotion and cost).
2 It will take too much time to switch to new product
provider.
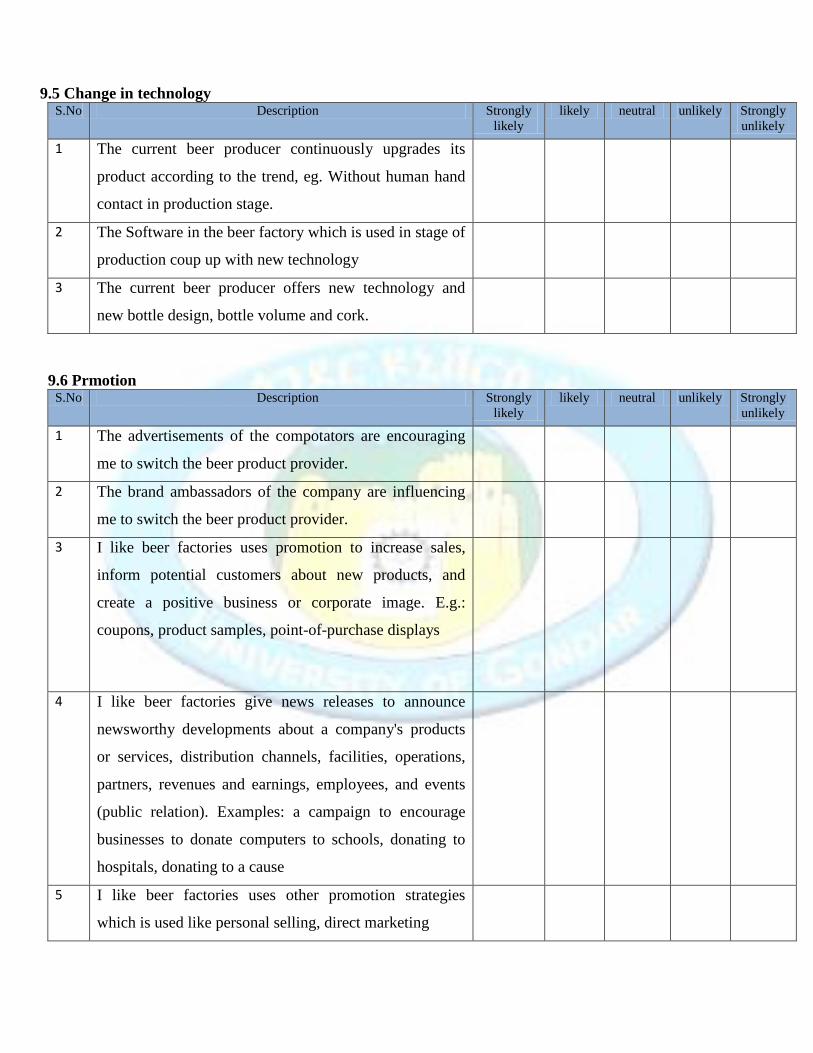
9.5 Change in technology S.No Description Strongly
likely
likely neutral unlikely Strongly
unlikely
1 The current beer producer continuously upgrades its
product according to the trend, eg. Without human hand
contact in production stage.
2 The Software in the beer factory which is used in stage of
production coup up with new technology
3 The current beer producer offers new technology and
new bottle design, bottle volume and cork.
9.6 Prmotion S.No Description Strongly
likely
likely neutral unlikely Strongly
unlikely
1 The advertisements of the compotators are encouraging
me to switch the beer product provider.
2 The brand ambassadors of the company are influencing
me to switch the beer product provider.
3 I like beer factories uses promotion to increase sales,
inform potential customers about new products, and
create a positive business or corporate image. E.g.:
coupons, product samples, point-of-purchase displays
4 I like beer factories give news releases to announce
newsworthy developments about a company's products
or services, distribution channels, facilities, operations,
partners, revenues and earnings, employees, and events
(public relation). Examples: a campaign to encourage
businesses to donate computers to schools, donating to
hospitals, donating to a cause
5 I like beer factories uses other promotion strategies
which is used like personal selling, direct marketing
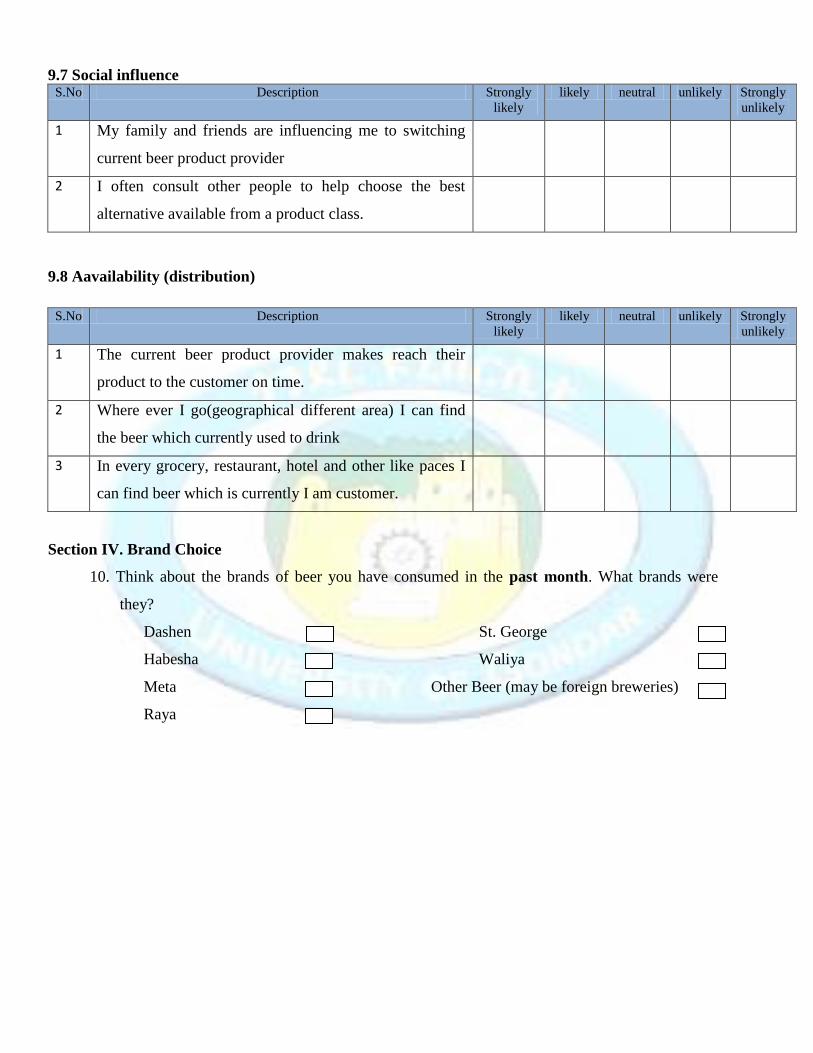
9.7 Social influence S.No Description Strongly
likely
likely neutral unlikely Strongly
unlikely
1 My family and friends are influencing me to switching
current beer product provider
2 I often consult other people to help choose the best
alternative available from a product class.
9.8 Aavailability (distribution)
S.No Description Strongly
likely
likely neutral unlikely Strongly
unlikely
1 The current beer product provider makes reach their
product to the customer on time.
2 Where ever I go(geographical different area) I can find
the beer which currently used to drink
3 In every grocery, restaurant, hotel and other like paces I
can find beer which is currently I am customer.
Section IV. Brand Choice
10. Think about the brands of beer you have consumed in the past month. What brands were
they?
Dashen
Habesha
Meta
Raya
St. George
Waliya
Other Beer (may be foreign breweries)

11. Think about the brands of beer that you plan to consume in the next month. Please rank
order the following brands of beer by placing a ‘1’ next to the brand of beer that you will
most likely consume in the next month, a ‘2’ next to the brand you feel the next likely to be
consumed, and so on up to ‘6’ .
_____Dashen
_____Habesha
_____Meta
_____Raya
_____St. Goerge
_____Waliya
_____Other breweries (if not mentioned)

12. Is there any other factors may leads to brand switching? That was not incorporated in the study,
please mention!
______________________________________________________________________________
______________________________________________________________________________
______________________________________________________________________________
13. Is there anything you would like to say regarding brand switching?
______________________________________________________________________________
______________________________________________________________________________
______________________________________________________________________________
Thank you!!!
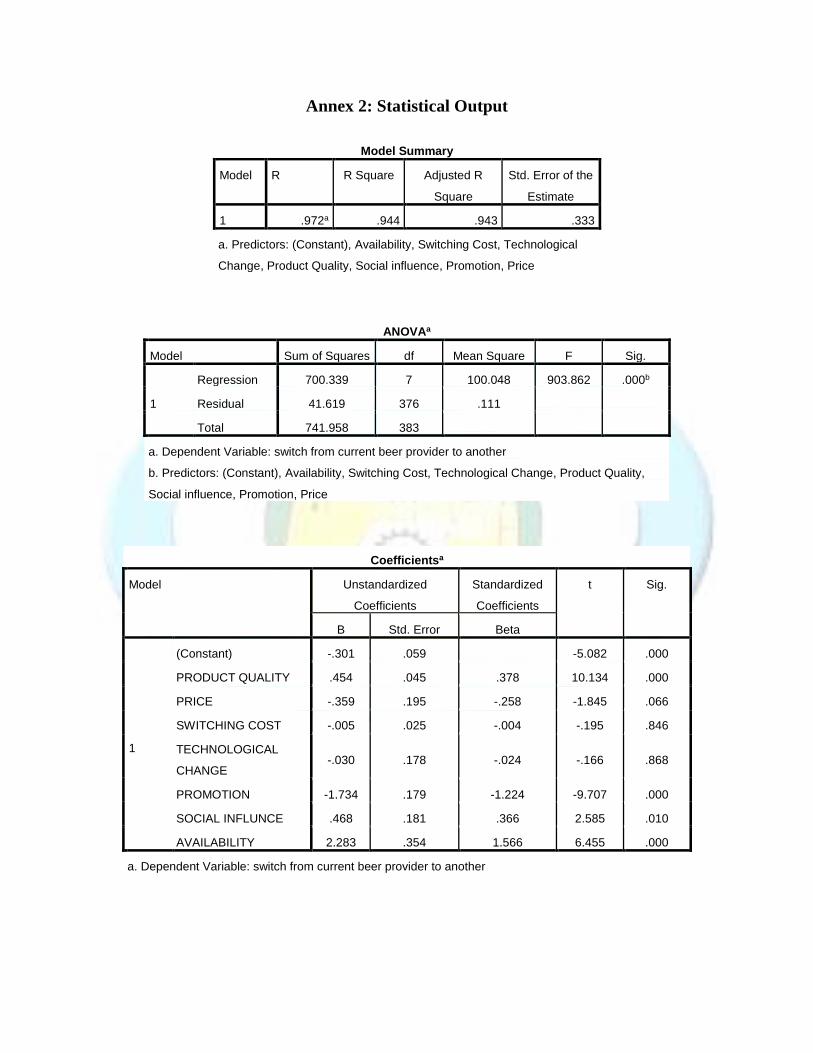
Annex 2: Statistical Output
Model Summary
Model R R Square Adjusted R
Square
Std. Error of the
Estimate
1 .972a .944 .943 .333
a. Predictors: (Constant), Availability, Switching Cost, Technological
Change, Product Quality, Social influence, Promotion, Price
ANOVAa
Model Sum of Squares df Mean Square F Sig.
1
Regression 700.339 7 100.048 903.862 .000b
Residual 41.619 376 .111
Total 741.958 383
a. Dependent Variable: switch from current beer provider to another
b. Predictors: (Constant), Availability, Switching Cost, Technological Change, Product Quality,
Social influence, Promotion, Price
Coefficientsa
Model Unstandardized
Coefficients
Standardized
Coefficients
t Sig.
B Std. Error Beta
1
(Constant) -.301 .059 -5.082 .000
PRODUCT QUALITY .454 .045 .378 10.134 .000
PRICE -.359 .195 -.258 -1.845 .066
SWITCHING COST -.005 .025 -.004 -.195 .846
TECHNOLOGICAL
CHANGE -.030 .178 -.024 -.166 .868
PROMOTION -1.734 .179 -1.224 -9.707 .000
SOCIAL INFLUNCE .468 .181 .366 2.585 .010
AVAILABILITY 2.283 .354 1.566 6.455 .000
a. Dependent Variable: switch from current beer provider to another