ASSEMBLÉE ANNUELLE DES ACTIONNAIRES - …©sentation-Assemblée... · WE WILL CONTINUE TO ADAPT...
38
ASSEMBLÉE ANNUELLE DES ACTIONNAIRES 4 mai 2017 MEETING May 4, 2017
-
Upload
duongthien -
Category
Documents
-
view
214 -
download
0
Transcript of ASSEMBLÉE ANNUELLE DES ACTIONNAIRES - …©sentation-Assemblée... · WE WILL CONTINUE TO ADAPT...

ASSEMBLÉE ANNUELLE DES ACTIONNAIRES4 mai 2017
MEETINGMay 4, 2017

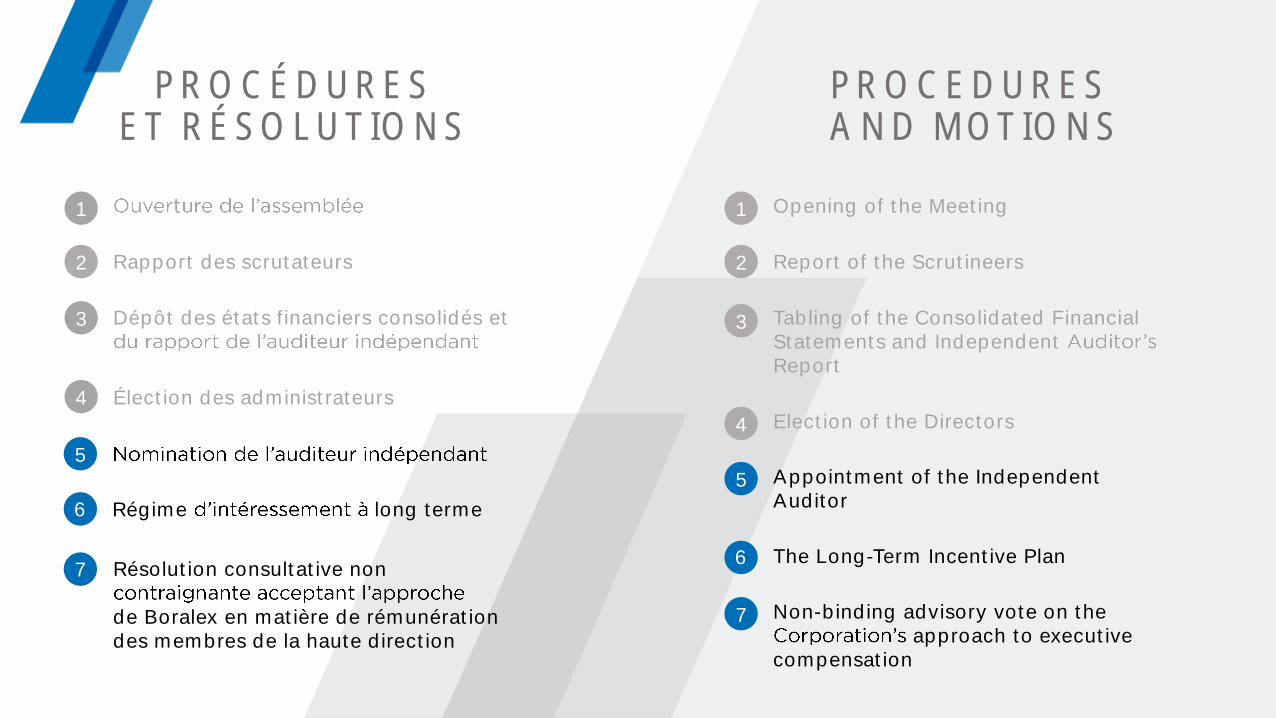
PROCÉDURESET RÉSOLUTIONS
PROCEDURESAND MOTIONS
1 Opening of the Meeting1
2 2Rapport des scrutateurs Report of the Scrutineers
3 3Dépôt des états financiers consolidés et Tabling of the Consolidated Financial Statements and Independent Report
4
4
Élection des administrateurs
Election of the Directors

Patrick Lemaire
MichelleSamson-Doel
Alain Rhéaume
YvesRheault
Alain Ducharme
Edward H. Kernaghan
RichardLemaire
PierreSeccareccia
DanySt-Pierre
ADMINISTRATEURS DIRECTORS
PROCÉDURESET RÉSOLUTIONS
PROCEDURESAND MOTIONS
Rapport des scrutateurs
Dépôt des états financiers consolidés et
Élection des administrateurs
1
2
3
4
Opening of the Meeting
Report of the Scrutineers
Tabling of the Consolidated Financial Statements and Independent Report
Election of the Directors
1
2
3
4
5Appointment of the Independent Auditor
5
6
6
Régime long terme
The Long-Term Incentive Plan7
7
Résolution consultative non
de Boralex en matière de rémunération des membres de la haute direction
Non-binding advisory vote on the approach to executive
compensation

ALLOCUTION DEPRESENTATION BY
Jean-François Thibodeau
Vice-président et chef de la direction financièreVice President and Chief Financial Officer

FAITS SAILLANTS 2016
2016 HIGHLIGHTS
EXPANSION EXPANSION
Croissance de 270 MW ou 25 % de la puissance installée 1 365 MW
Installed capacity expanded by 270 MW or 25%
Pipeline de projets Europe et Amérique du Nord 1 000 MW
In the projects pipeline for Europe and North America

2016 HIGHLIGHTS
ACQUISITIONS ACQUISITIONS
200 MW de projets éoliens en Écosse et en France
Portfolio of about 200 MW wind projectsin Scotland and France
Plus importante acquisition Boralex
Largest acquisition everfor Boralex
230 MW
Niagara RegionWind Farm
Niagara RegionWind Farm
FAITS SAILLANTS 2016

FAITS SAILLANTS 2016SOLIDITÉ ET FLEXIBILITÉ FINANCIÈRE
Structure financière et capacité de crédit rehaussées
Financial structure and credit facilityupgraded to reflectexpansion
2016 HIGHLIGHTSFINANCIAL STRENGTH AND FLEXIBILITY
Investissements de plus de 500 M$
Investments activitiesof over $500M
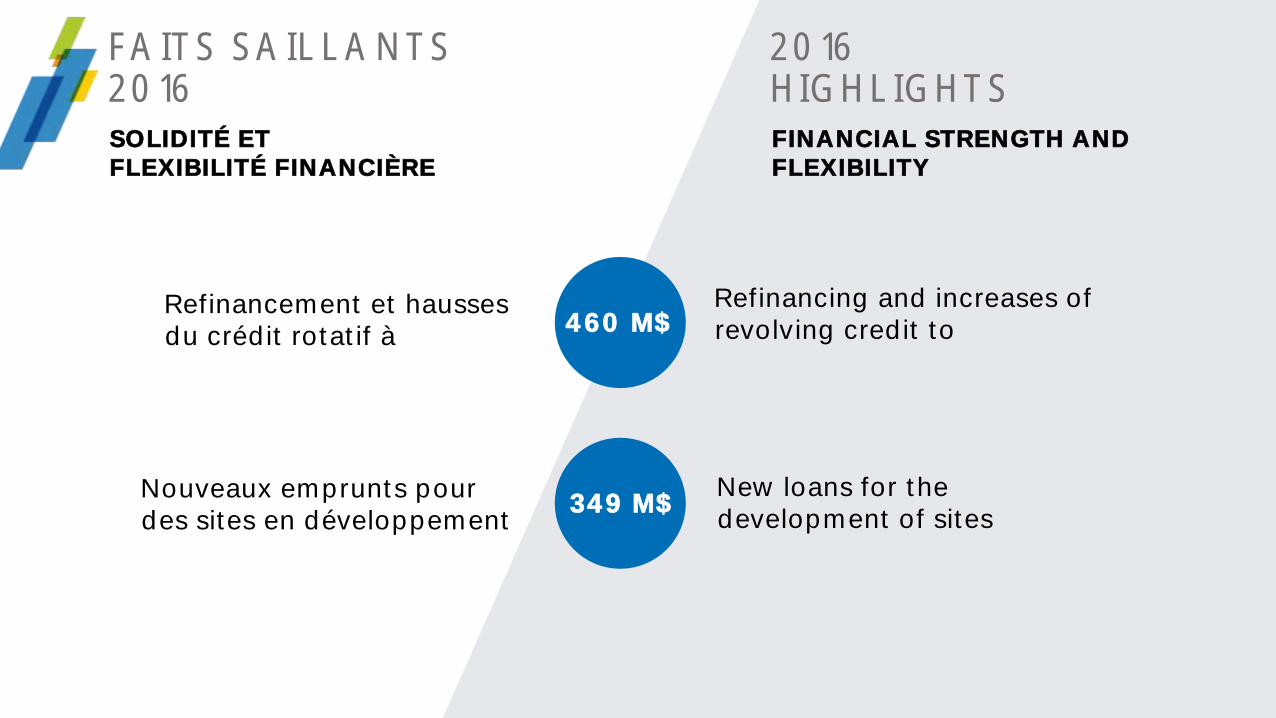
FAITS SAILLANTS 2016
2016 HIGHLIGHTS
SOLIDITÉ ET FLEXIBILITÉ FINANCIÈRE
FINANCIAL STRENGTH AND FLEXIBILITY
Refinancement et hausses du crédit rotatif à
Refinancing and increases of revolving credit to460 M$
Nouveaux emprunts pour des sites en développement
New loans for the development of sites
349 M$

FAITS SAILLANTS 2016
2016 HIGHLIGHTS
SOLIDITÉ ET FLEXIBILITÉ FINANCIÈRE
FINANCIAL STRENGTH AND FLEXIBILITY
Émission de 10,4 millions actions
du site éolien de Niagara
10.4 millions of new shares issuedfor the acquisition of the Niagara wind farm
173 M$
Marge brute Operating cash flows144 M$
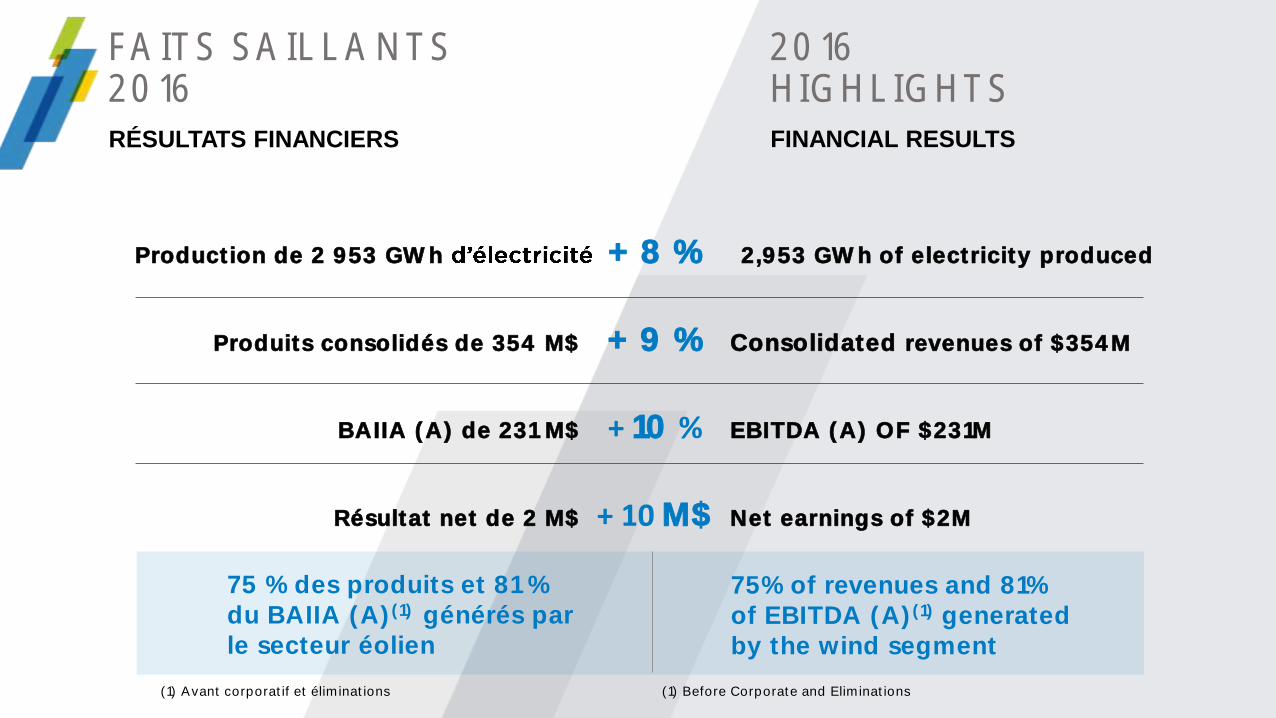
FAITS SAILLANTS 2016
2016 HIGHLIGHTS
RÉSULTATS FINANCIERS
Production de 2 953 GWh + 8 % 2,953 GWh of electricity produced
Produits consolidés de 354 M$ + 9 % Consolidated revenues of $354M
BAIIA (A) de 231 M$ + 10 % EBITDA (A) OF $231M
Résultat net de 2 M$ + 10 M$ Net earnings of $2M
FINANCIAL RESULTS
75 % des produits et 81 % du BAIIA (A)(1) générés par le secteur éolien
75% of revenues and 81% of EBITDA (A)(1) generatedby the wind segment
(1) Avant corporatif et éliminations (1) Before Corporate and Eliminations

CRÉATION DE VALEUR POUR LES ACTIONNAIRESDIVIDENDE
Dividende annuel de 0,60 $par action à partir de 2017
CREATING SHAREHOLDERS VALUE DIVIDEND
Annual dividend of $0.60 per share as of 2017
2016
2 hausses 2 increases
50 % en 2018Expected payout ratio of approximately
50% in 2018
7,1 %
7,7 %
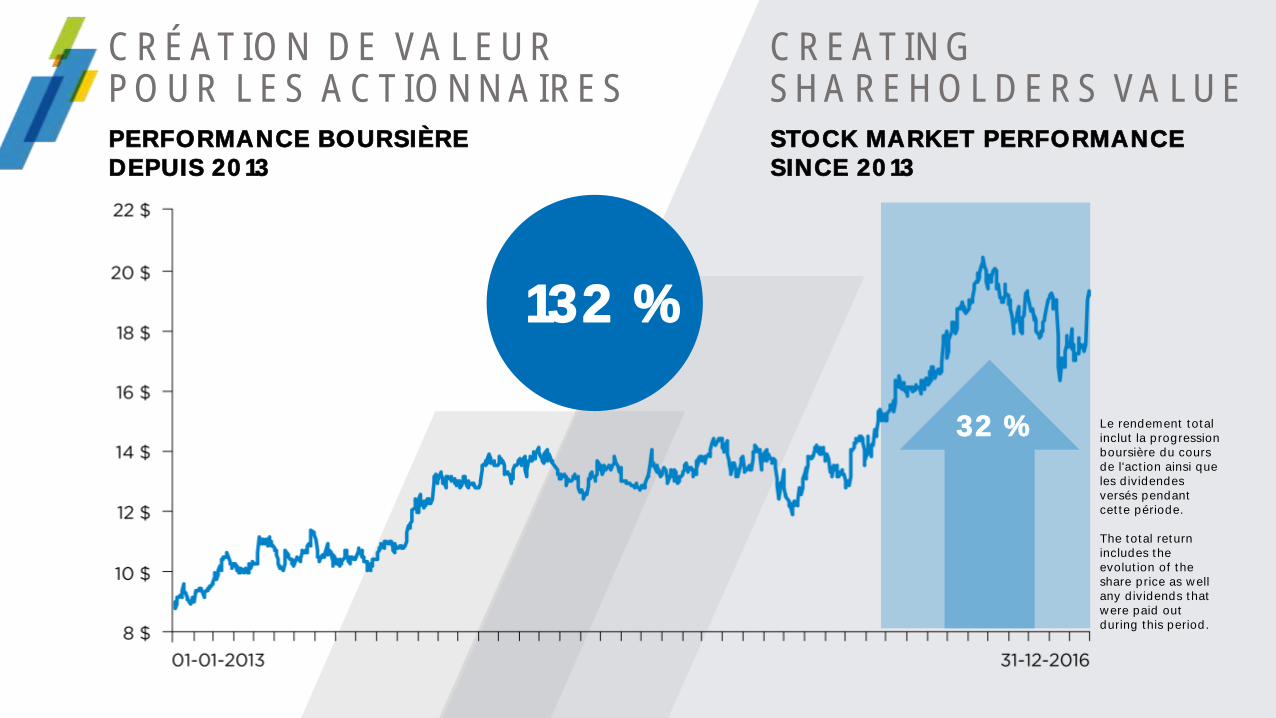
CRÉATION DE VALEUR POUR LES ACTIONNAIRESPERFORMANCE BOURSIÈRE DEPUIS 2013
CREATING SHAREHOLDERS VALUE STOCK MARKET PERFORMANCE SINCE 2013
32 % Le rendement total inclut la progression boursière du cours de l'action ainsi que les dividendes versés pendant cette période.
The total return includes the evolution of the share price as wellany dividends thatwere paid out during this period.
132 %

CRÉATION DE VALEUR POUR LES ACTIONNAIRESCAPITALISATION BOURSIÈRE
CREATING SHAREHOLDERS VALUE MARKET CAPITALIZATION OF APPROXIMATELY $1.6B
Hausse du titre + émission de 10,4 M de nouvelles actions
Stock price increase + issuanceof 10.4 M new shares
INDICE
S&P / TSX
INDEX
MARCH 17, 201717 MARS 2017
Volume quotidien de transactions : 215 000 Average daily trading volume: 215,000
% Public float of roughly 76%

RÉSULTATS ET FAITS SAILLANTSDU PREMIER TRIMESTRE DE 2017
Production de 1 063 GWh + 9 % 1,063 GWh of electricity produced
Produits consolidés de 136 M$ + 11 % Consolidated revenues of $136M
BAIIA (A) de 97 M$ + 8 % EBITDA (A) of $97M
Résultat net de 16 M$ vs 23 M$ en 2016 Net earnings of $16M vs $23M in 2016
FINANCIAL RESULTS AND HIGHLIGHTS OF THE FIRST QUARTER OF 2017
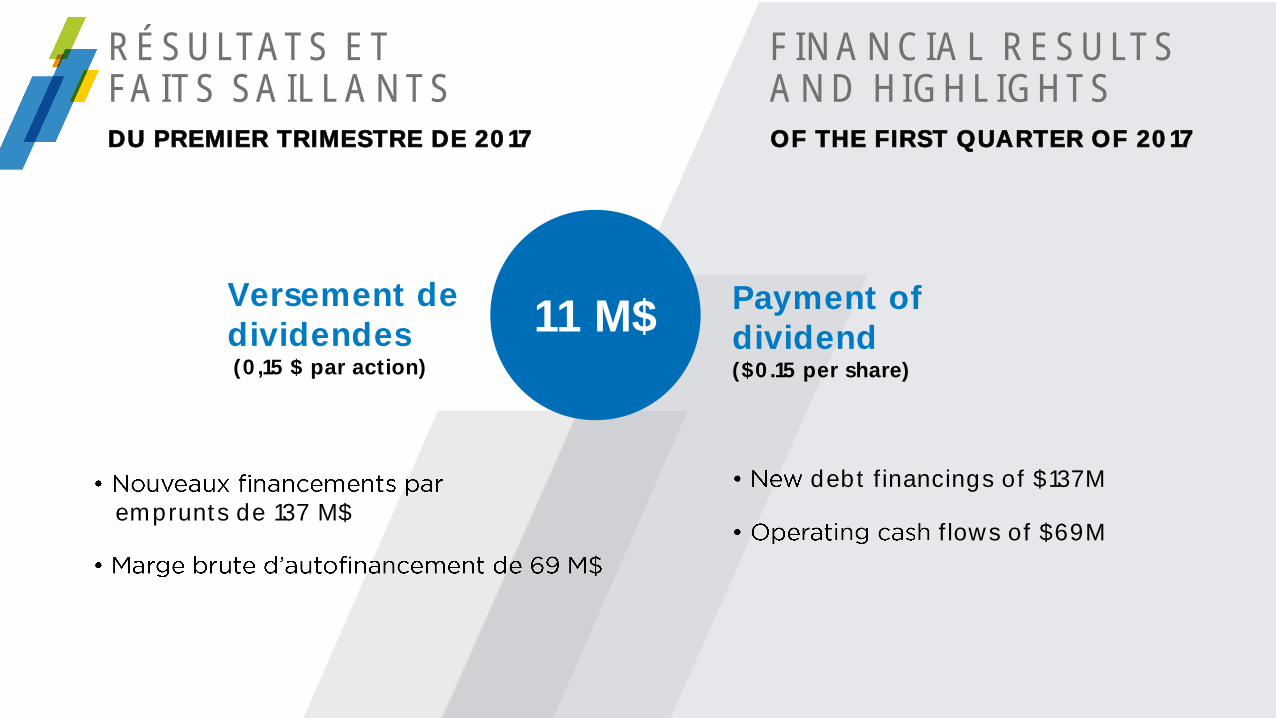
RÉSULTATS ET FAITS SAILLANTS
emprunts de 137 M$
FINANCIAL RESULTS AND HIGHLIGHTS
DU PREMIER TRIMESTRE DE 2017 OF THE FIRST QUARTER OF 2017
debt financings of $137M
Versement de dividendes (0,15 $ par action)
11 M$Payment of dividend($0.15 per share)
flows of $69M
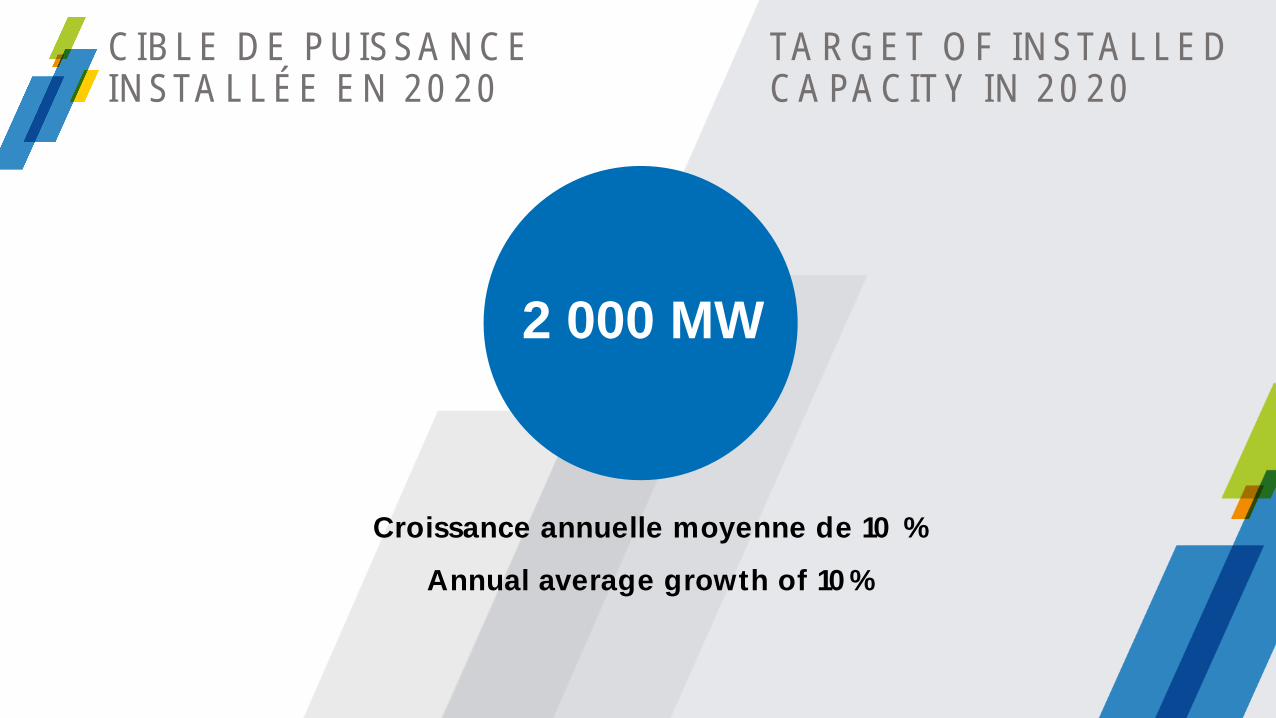
CIBLE DE PUISSANCEINSTALLÉE EN 2020
TARGET OF INSTALLED CAPACITY IN 2020
Croissance annuelle moyenne de 10 %
Annual average growth of 10%
2 000 MW

CIBLES FINANCIÈRES REHAUSSÉESBAIIA (A)
(1) Représente le BAIIA (A) annualisé estimé de tous les sites en exploitation à la fin de 2017
2013
102
2014
147
2015
211
2016
231
2017
375(1)
Hydro
Thermal
Solar
Corporate
Wind
Hydroélectrique
Thermique
Solaire
Corporatif
Éolien
EBITDA (A)
(1) Represents a year-end estimated run rate EBITDA(A)
UPGRADED FINANCIALOBJECTIVES
UNE VISION AMBITIEUSELES MOYENS DE LA RÉALISER
AN AMBITIOUS VISION AND THE MEANS TO ACHIEVE IT
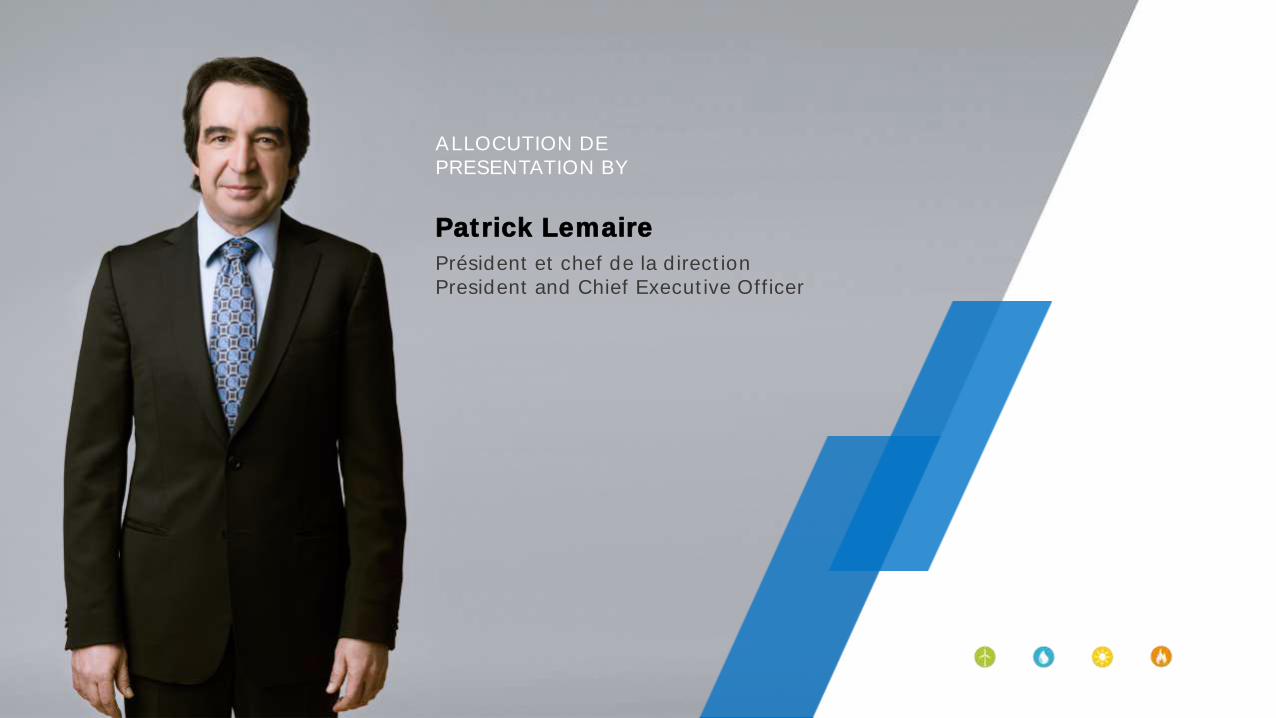
ALLOCUTION DEPRESENTATION BY
Patrick Lemaire
Président et chef de la directionPresident and Chief Executive Officer

Croissance X 2 Growth
2013 2014 2015 2016 AUJOURD’HUI
TODAY
1 135 MW(1)
652 MW
938 MW
1 094 MW
(1) (1) Before NRWF acquisition
1 365 MW
PUISSANCE INSTALLÉE2013-2017
INSTALLED CAPACITY2013-2017

BORALEX
TODAY
Producteur indépendant d’énergie
éolienne terrestre en France
Independant producer of onshore
wind power in France
1ER
ST
France
545 MW
518 MW
15 MW
12 MW

BORALEX-UNIS
TODAY IN CANADA & USA
États-Unis/USA
82 MW
82 MW
CANADA
738 MW
1 MW
628 MW
74 MW
35 MW

PUISSANCE INSTALLÉE
12 %
3 %
1 %
84 %
France 40 %
États-Unis/USA 6 %
Canada 54 %
Marché/Market 2 %
Contrats/Contracted 98 %
RÉPARTITION SECTORIELLEBY SECTOR
RÉPARTITION GÉOGRAPHIQUEBY COUNTRY
RÉPARTITION CONTRACTUELLECONTRACTED CAPACITY
1 365 MW 1 365 MW 1 365 MW
INSTALLED CAPACITY
TODAY
Durée moyenne des contrats : 15 ans
Average length of contracts: 15 years
Hydro
Thermal
Solar
Wind
Hydroélectrique
Thermique
Solaire
Éolien

Oldman4 MW
Port Ryerse10 MW
Niagara230 MW
Touvent14 MW
Plateau de Savernat I12 MW
2016 ACQUISITIONS / COMMISSIONINGS
270 MW
ACQUISITIONS / MISES EN SERVICE EN 2016

SOURCES DE CROISSANCE EN 2017MISES EN SERVICE
Moose Lake15 MW
Yellow Falls16 MW
Plateau de Savernat4 MW
Voie des Monts10 MW
Mont de Bagny24 MW
Artois23 MW
1 365 MW+
92 MW
1 457 MWAU 31 DÉCEMBRE 2017
AS AT DECEMBER 31, 2017
SOURCES OF GROWTH IN 2017COMMISSIONINGS

CAP SUR LES 2 000 MW
MOVING ON TOWARD2,000 MWBy the end of 2020
(1) Considérant
finalisée en janvier 2017/Considering the acquisition of NRWF closed in January 2017
(2) Hydro 16 MWÉolien | WIND 76 MW
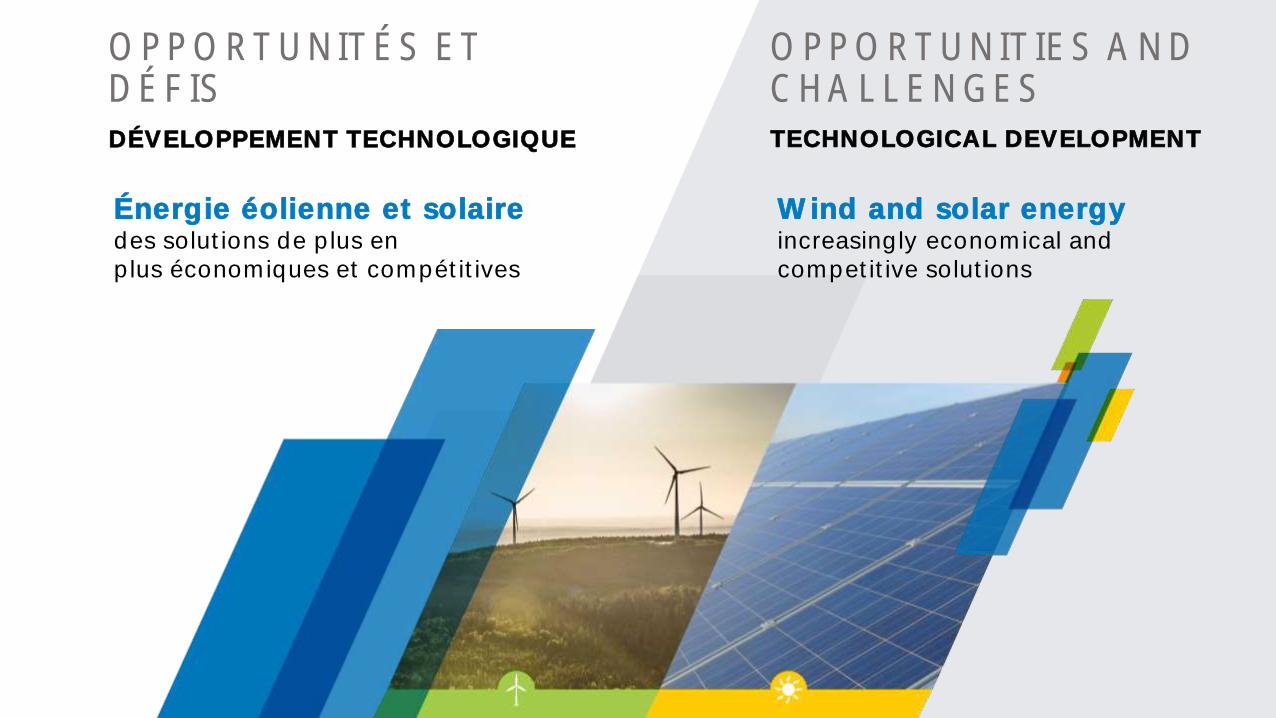
OPPORTUNITÉS ET DÉFIS DÉVELOPPEMENT TECHNOLOGIQUE
OPPORTUNITIES AND CHALLENGES TECHNOLOGICAL DEVELOPMENT
Énergie éolienne et solaire des solutions de plus en plus économiques et compétitives
Wind and solar energyincreasingly economical and competitive solutions
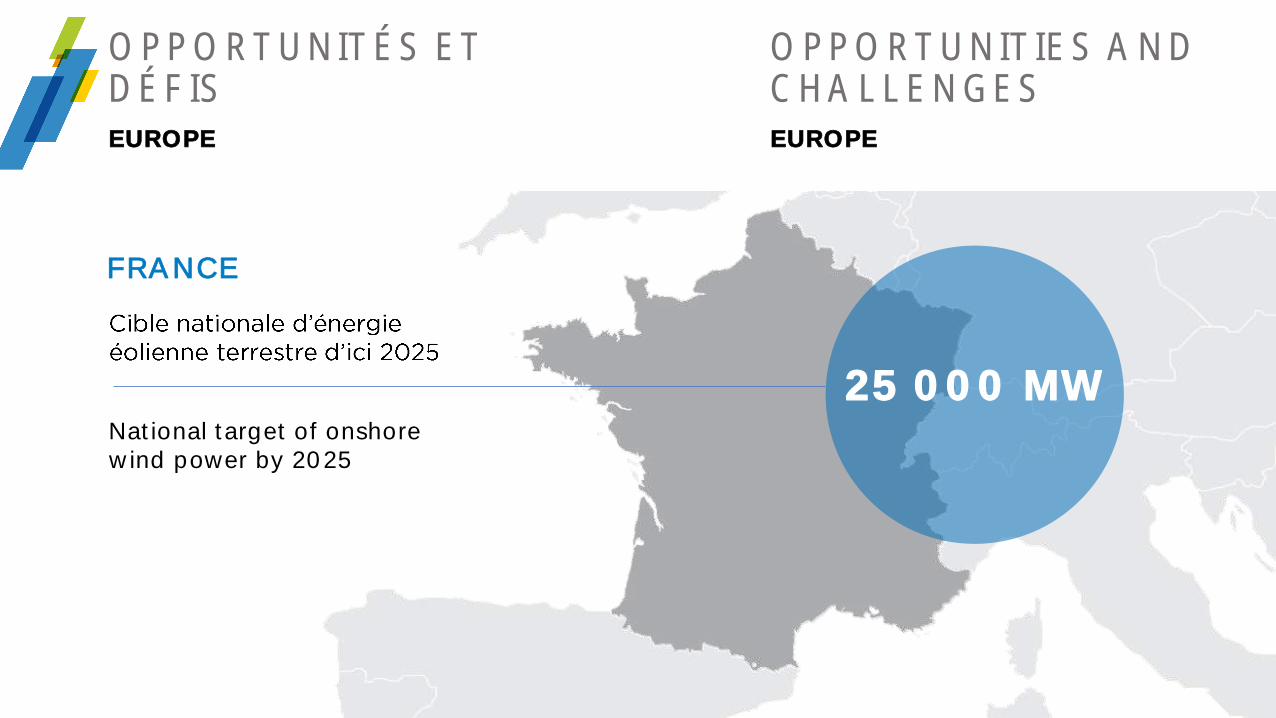
OPPORTUNITÉS ET DÉFIS EUROPE
National target of onshorewind power by 2025
OPPORTUNITIES AND CHALLENGES EUROPE
FRANCE
25 000 MW
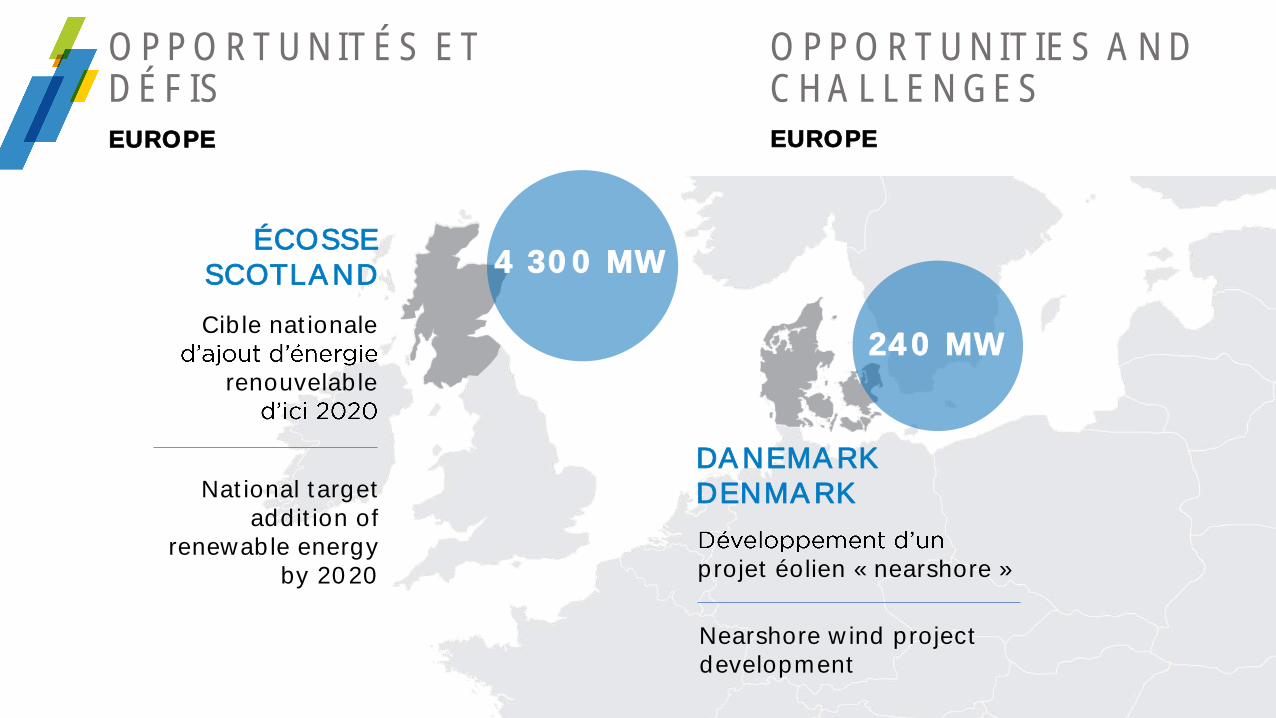
OPPORTUNITÉS ET DÉFIS EUROPE
OPPORTUNITIES AND CHALLENGES EUROPE
ÉCOSSESCOTLAND
DANEMARKDENMARK
Cible nationale
renouvelable
National targetaddition of
renewable energyby 2020
4 300 MW
projet éolien « nearshore »
Nearshore wind projectdevelopment
240 MW

OPPORTUNITÉS ET DÉFIS EUROPE
Pipeline de projets totalisant
700 MWPipeline of projectstotalling
OPPORTUNITIES AND CHALLENGES EUROPE
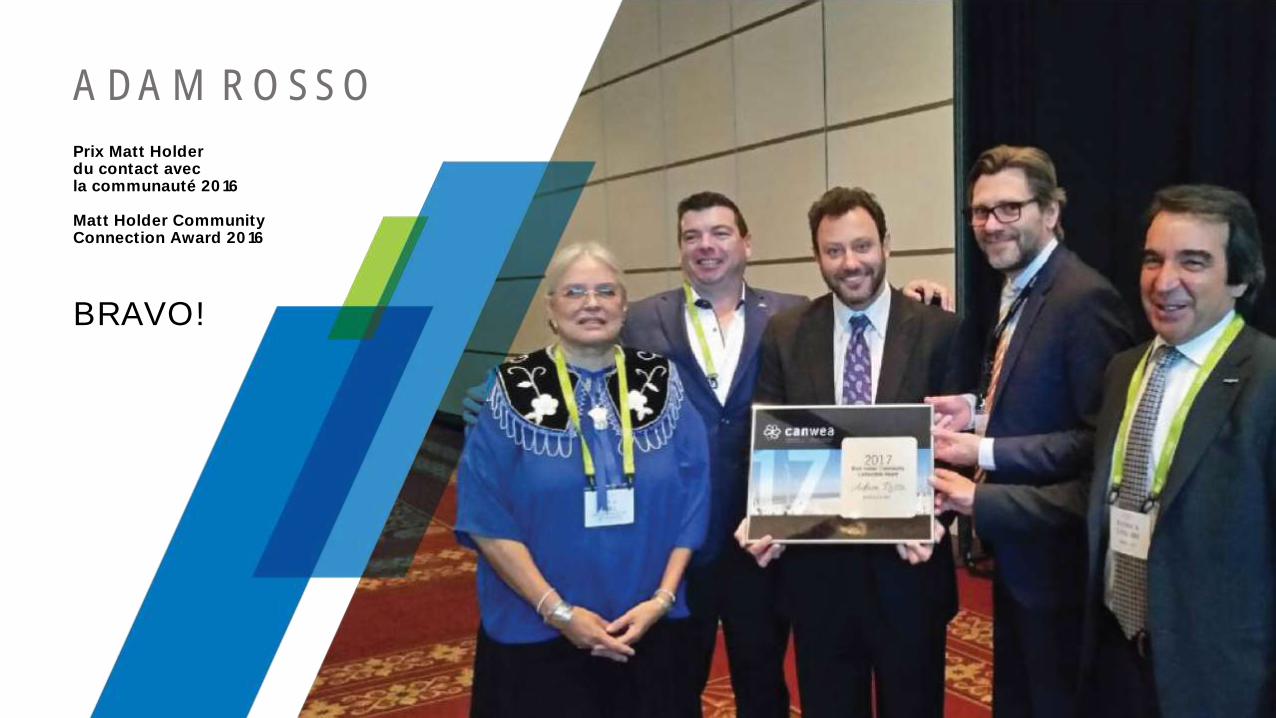
ADAM ROSSO
Prix Matt Holderdu contact avec la communauté 2016
Matt Holder CommunityConnection Award 2016
BRAVO!

OPPORTUNITÉS ET DÉFIS CANADA ET ÉTATS DU NORD-EST DES ÉTATS-UNIS
CANADA & NORTHEASTERN STATES OF USA
Sask
atc
hew
an
Alb
ert
a
Co
lom
bie
-Bri
tan
niq
ue
Bri
tish
Co
lum
bia
OPPORTUNITIES AND CHALLENGES
CIBLETARGET
5 000 MW2030
CIBLETARGET
1 600 MW2030
CIBLETARGET
+ 13 000 MW2030
NORD-EST DES ÉTATS-UNIS
NORTHEASTERN USA

OPPORTUNITÉS ET DÉFIS
CONTINUER DE NOUS ADAPTER
WE WILL CONTINUE TO ADAPT AND INNOVATE
OPPORTUNITIES AND CHALLENGES

Ensemble, on travaille aujourd'hui à bâtir demain
Together, workingtoday on building tomorrow

MISE EN GARDE
Forward-looking StatementsCertain statements contained in this presentation, including those regarding future results and performance, are forward-looking statements based on current expectations. The accuracy of such statements is subject to a number of risks, uncertainties and assumptions that could lead to a material difference between actual results and the projections, including, but not limited to, the general impact of economic conditions, currency fluctuations, volatility in the selling prices of energy,
and regulations affecting the industry, raw material price increases and availability as
commissions.
This presentation contains certain financial measures that are not in accordance with International Financial Reporting Standard ("IFRS").
Proportionate Consolidation This presentation contains results presented on a proportionate consolidation basis. Under this method, the results of Seigneurie de Beaupré
Beaupré
proportionately consolidated instead of being accounted for using the equity method as required by IFRS. Under the proportionate consolidation method, which is no longer permitted under the IFRS, the Interests in the Joint Ventures and Share in earnings (loss) of the Joint Ventures are eliminated and replaced by Boralex s share (50%) in all items in the financial statements (revenues, expenses, assets and liabilities). Since the information that Boralex uses to perform internal analyses and make strategic and operating decisions is compiled on a proportionate consolidation basis, management has considered it relevant to integrate this Proportional Consolidation section into the presentation to help investors understand the concrete impacts of decisions made by the Corporation. Moreover, tables reconciling IFRS data with data presented on a proportionate consolidation basis are included in the MD&A.
Non-IFRS MeasuresIn order to assess the performance of its assets and reporting segments, Boralex uses the terms "EBITDA(A)", "cash flows from operations", "net debt ratio" and "discretionary cash flows". For more information, please refer to MD&A.
Déclarations prospectives
Certaines déclarations contenues dans cette présentation, incluant celles ayant trait auxrésultats et au rendement pour des périodes futures, constituent des déclarationsprospectives fondées sur des prévisions actuelles. de telles déclarations estsujette à un certain nombre de risques, et pouvantoccasionner une différence significative entre les résultats réels et ceux projetés, ycompris, mais non de façon limitative, général des conditions économiques, lesfluctuations de diverses devises, les fluctuations des prix de vente la capacitéde financement de la Société, les changements négatifs dans les conditions générales dumarché et des réglementations affectant son industrie et la disponibilité etdes prix des matières premières, ainsi que certains autres facteurs énumérés dans lesdocuments déposés par la Société auprès des différentes commissions des valeursmobilières.
Cette présentation contient certaines mesures financières non conformes aux Normesinternationales d'information financière (« IFRS »).
Consolidation proportionnelle
Cette présentation comporte des résultats présentés sur une base de consolidationproportionnelle. Selon cette méthode, les résultats des Parcs éoliens de la Seigneurie deBeaupré 2 et 3 (« Coentreprise phase I ») et du Parc éolien de la Seigneurie de Beaupré 4(« Coentreprise phase II »), sociétés en nom collectif (les « Coentreprises ») détenues à50 % par Boralex sont traités comme s'ils étaient consolidés proportionnellement plutôtque d'être comptabilisés selon la méthode de la mise en équivalence requise par les IFRS.Selon la méthode de consolidation proportionnelle, qui n'est plus permise en vertu desIFRS, les postes Participation dans les Coentreprises et Quote-part des profits (pertes)des Coentreprises sont éliminés et remplacés par la part de Boralex (50 %) dans tous lespostes aux états financiers (revenus, dépenses, actifs et passifs). Étant donné quesur la base de la consolidation proportionnelle que Boralex collige surlaquelle elle fonde ses analyses internes et ses décisions stratégiques et opérationnelles,la direction a jugé pertinent cette base de comptabilisation pour cetteprésentation afin de faciliter la compréhension des investisseurs quant aux retombéesconcrètes des décisions prises par la Société. De plus, le rapport de gestion fournit destableaux qui présentent une conciliation des données conformes aux IFRS avec cellesprésentées en fonction de la consolidation proportionnelle.
Mesures non conformes aux IFRS
La Société utilise les termes « BAIIA(A) », « marge brute d'autofinancement »,« coefficient d'endettement net » et « flux de trésorerie discrétionnaires » pour évaluer laperformance de ses actifs et de ses secteurs d'activités. Pour plus de détails, se référer aurapport de gestion de Boralex.
CAUTIONARY STATEMENTS
PÉRIODE DE QUESTIONS
QUESTION PERIOD

MERCI
THANK YOU