
ASRANet 2006 · Web viewgoverning parameters (under tension: maximum stress, 0.2% proof stress,...
55
Reliability based determination of material partial safety factors for cast iron beams in jack arched construction exposed to standard and natural fires C. Maraveas 1 *, Y.C. Wang 2 & T. Swailes 2 1 University of Liege, ArGEnCO Dept., Fire Safety Unit, Belgium, formerly School of Mechanical, Aerospace and Civil Engineering, University of Manchester, UK 2 School of Mechanical, Aerospace and Civil Engineering, University of Manchester, UK * Corresponding author: [email protected] ABSTRACT Cast iron beams were extensively used in many 19th century structures, especially in fireproof flooring systems (such as jack arch). Many such structures are still in use today and it is important that they fulfil the current requirements of fire resistance when there is a change of use. These structures are 1
Transcript of ASRANet 2006 · Web viewgoverning parameters (under tension: maximum stress, 0.2% proof stress,...
Reliability based determination of material partial safety
factors for cast iron beams in jack arched construction exposed
to standard and natural fires
C. Maraveas1*, Y.C. Wang2 & T. Swailes2
1 University of Liege, ArGEnCO Dept., Fire Safety Unit, Belgium, formerly School of
Mechanical, Aerospace and Civil Engineering, University of Manchester, UK
2School of Mechanical, Aerospace and Civil Engineering, University of Manchester, UK
* Corresponding author: [email protected]
ABSTRACT
Cast iron beams were extensively used in many 19th century structures, especially in
fireproof flooring systems (such as jack arch). Many such structures are still in use today and
it is important that they fulfil the current requirements of fire resistance when there is a
change of use. These structures are out of scope of modern design codes and old design codes
do not provide guidance for fire resistance design. Furthermore, cast iron is a brittle material
weak in tension, and there are many uncertainties in its mechanical properties at ambient and
elevated temperatures due to material flaws. It is necessary to quantify the probability of
structural failure and to introduce safety factors to reduce the probability of structural failure
in fire to an acceptable level. This paper presents the results of a detailed study whose
purpose is to derive appropriate safety factors to achieve different levels of reliability, for fire
safety design of cast iron beams. In this study, a fibre analysis method has been used to
calculate the moment capacity of four different types of cast iron cross section. Using
randomized stress-strain-temperature relationships, based on variability of the different
1
governing parameters (under tension: maximum stress, 0.2% proof stress, corresponding
strains at maximum stress (strength) and failure; under compression: Young’s modulus,
proportional limit, 0.2% proof stress and the maximum stress), the probability distribution of
moment capacity has been calculated. Based on the criterion of cast iron beam failure not
exceeding probabilities of 10-1, 10-2 and 10-3, material safety factors of 1.5, 3.0 and 5.0
respectively have been obtained.
Keywords: Reliability; Material Safety Factor; Fire; Cast iron beam; Jack Arch, Monte-Carlo Simulation
1. INTRODUCTION
Many 19th century historic buildings in the UK, Central and Western Europe as well as the
US were built with cast iron structural elements, as main loadbearing columns and beams,
especially during the period of 1820-1850 [1]. Cast iron beams are typically partially fire
protected using various types of thermal insulation systems ([2], [3], [4]), with the jack arch
floor, as illustrated in Figure 1, being the most widely applied. Because of limited use of cast
iron structures in modern construction, there has been very limited research on cast iron
structures, at ambient temperature and in fire.
Cast iron structural beams exhibit different behavior from that of modern steel beams. When
cast iron beams are used as part of the jack arch construction, the temperature distribution in
the cast iron cross-section is severely non-uniform. Also, the stress-strain curve of cast iron
does not possess the same degree of plastic behavior of steel, which makes analyzing cast iron
beams using the plastic analysis method problematic. Furthermore, cast iron behaves
differently under tension and compression.
Based on extensive assessments of thermal and mechanical properties of cast iron and
associated insulation materials at ambient and elevated temperatures ([5], [6], [7]), and new
2
experimental data [8], the authors have proposed thermal properties for the relevant thermal
insulation materials, and thermal and mechanical properties for cast iron, including the
thermal expansion coefficient and stress-strain-temperature relationships [8]. More recently,
the authors have developed a simplified method to calculate the moment capacity of jack arch
beam cross-section at elevated temperatures [9]. The fire resistance of this type of flooring
systems [7] is very sensitive to variations in the mechanical properties of cast iron at elevated
temperatures. Because of large variability in these properties, there is a need to develop
material safety factors for fire safety design of cast-iron structures. This is the aim of this
paper.
The paper presents a reliability analysis in order to estimate appropriate safety factors for fire
resistance design of jacked arch cast iron beams. Four different characteristic cross section
types have been studied, using randomised stress strain temperature relationships (eight
random material property parameters per temperature) in conjunction with a fibre cross
section analysis method. From these analyses, the probability distribution of moment capacity
has been calculated and material safety factors have been proposed.
The methodology used in this paper is similar with that used successfully by others ([10],
[11]) for different types of structure.
Figure 1. Typical jack arch beam [2].
3
2. CONDITIONAL PROBABILITY OF STRUCTURAL FAILURE IN FIRE
This paper will derive material partial safety factors for cast iron under fire conditions to
achieve different levels of reliability, each with a corresponding probability of failure. To
estimate the range of acceptable structural failure probabilities in fire, consider building
Consequence Class 2 (CC2) according to EN1990 [12] for general building design. This
building class is required to achieve a target reliability index of 3.8, corresponding to a
probability of failure of 7.23x10⁻⁵. This can be taken as the total probability of failure
acceptable to the society. When determining the acceptable probability of failure of structures
in fire, it is necessary to include the probability of ignition and the probability of flashover
given fire occurrence.
i. Probability of ignition
Several equations have been proposed to quantify the probability of fire occurrence in
buildings ([13], [14], [15]). An example is Poisson distribution of the probability of ignition
of x fires during a time interval t, as follows [13]:
P ( X=x )= 1x !
λ t x e− λt (1)
where λ is the mean fire ignition rate or the average number of fire occurrences per unit time
interval and X is the number of fire occurrences during the time interval t.
The probability of fire occurrence in building is a function of many parameters (the size of the
compartment, the number of compartment etc). Values for λ are given in [16] for several
cases. For a 50-year period, considered to be the typical life-time of a building, the probability
of fire occurrence in a compartment of 500 m2 in size ranges from 10-2 to 0.2.
4

ii. Probability of flashover
Structural resistance is rarely fatally affected before flashover. Therefore, it is usually
assumed that structural failure occurs only after flashover. The probability of flashover may
be calculated using the following conditional probability equation [10]:
P ( fo )=P ( fo|ignition ) x P (ignition ) (2)
where P(fo) is the probability of flashover, P(fo|ignition) is the conditional probability of
flashover given ignition and P(ignition) is the probability of ignition.
Table 1 gives typical values of conditional probability of flashover given ignition.
Combining with typical values of probability of ignition, 10-2 to 0.2 as given in (i), the
probability of a flashover fire occurring in a typical building of 50-year life time is between
2·10-2 and 10-6.
iii. Probability of structural failure
Combining the above different probability terms, the probability of structural failure in fire is
defined as [10]:
P ( fail )=P ( fail|fo ) x P ( fo ) (3)
5

where P(fail) is the probability of structural failure in fire and P(fail|fo) is the conditional
probability of structural failure in a post-flashover fire.
Therefore, to achieve a target probability of structural failure in fire of 7.23x10⁻⁵
(corresponding to a reliability index of 3.8), the acceptable conditional probability of
structural failure, given a flashover fire, is between 10-3 and 1. Clearly a failure probability of
1.0 is not permissible so a minimum safety factor for failure probability of 0.1 is
recommended. This paper will estimate the required material partial safety factors for cast
iron to achieve conditional probabilities of structural failure of 10-3, 10-2 and 10-1 in flashover
fires.
Table 1. Conditional probability of flashover given ignition P(flashover | ignition) [17]Fire protection method P(flashover | ignition)Public fire brigade 10-1
Sprinkler 10-2
High standard fire brigade on site combined with alarm system
10-3 to 10-2
Both sprinkler and high standard residential fire brigade
10-4
3. FIRE CURVES
In this paper the standard fire curve [17] has been considered as well as two parametric fire
curves [17] for slow (O=0.02 m1/2, b=1120 J/m2s1/2K and qt,d=200 MJ/m2) and fast burning
(O=0.1 m1/2, b=1120 J/m2s1/2K and qt,d=200 MJ/m2) . The range of difference between the
parametric fires from the standard fire is large so that it enables an assessment of whether the
findings of the paper would be generally applicable. The considered fire curves, using the
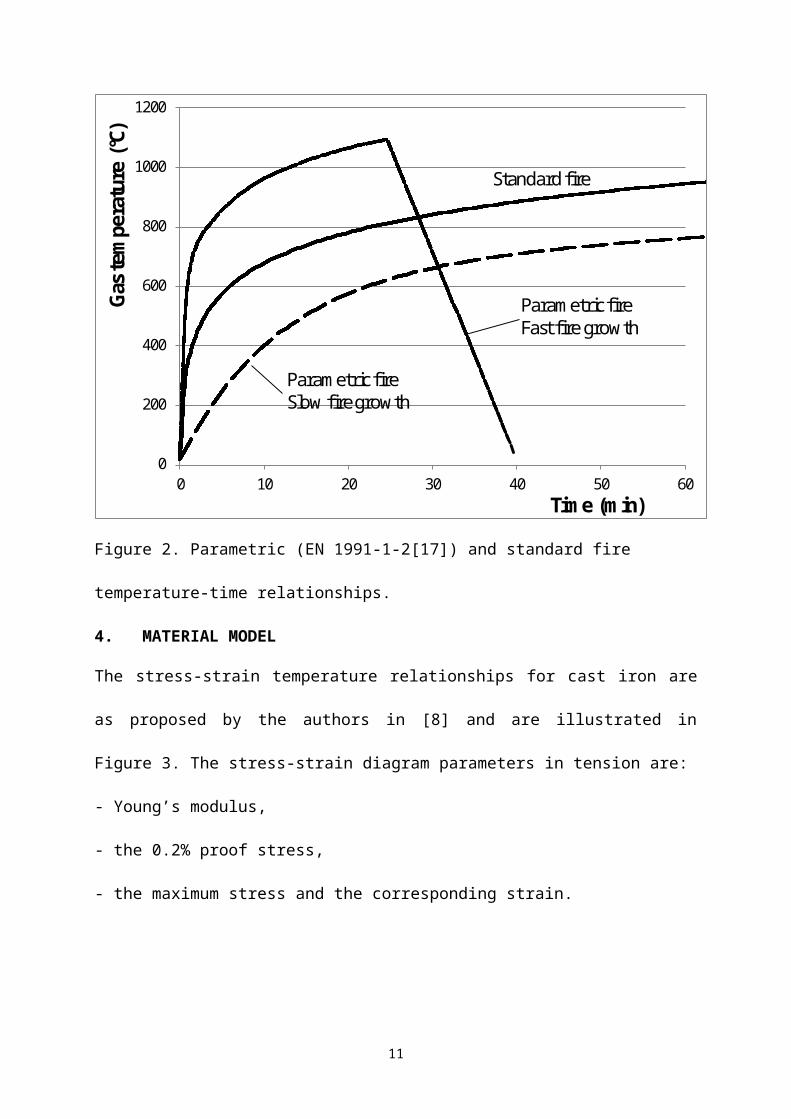
parametric fire curve equations in EN 1991-1-2 [17], are shown in Figure 2.
6
0
200
400
600
800
1000
1200
0 10 20 30 40 50 60Time (min)
Gast
empe
ratu
re(°
C)
Standard fire
Parametric fireFast fire growth
Parametric fireSlow fire growth
Figure 2. Parametric (EN 1991-1-2[17]) and standard fire temperature-time relationships.
4. MATERIAL MODEL
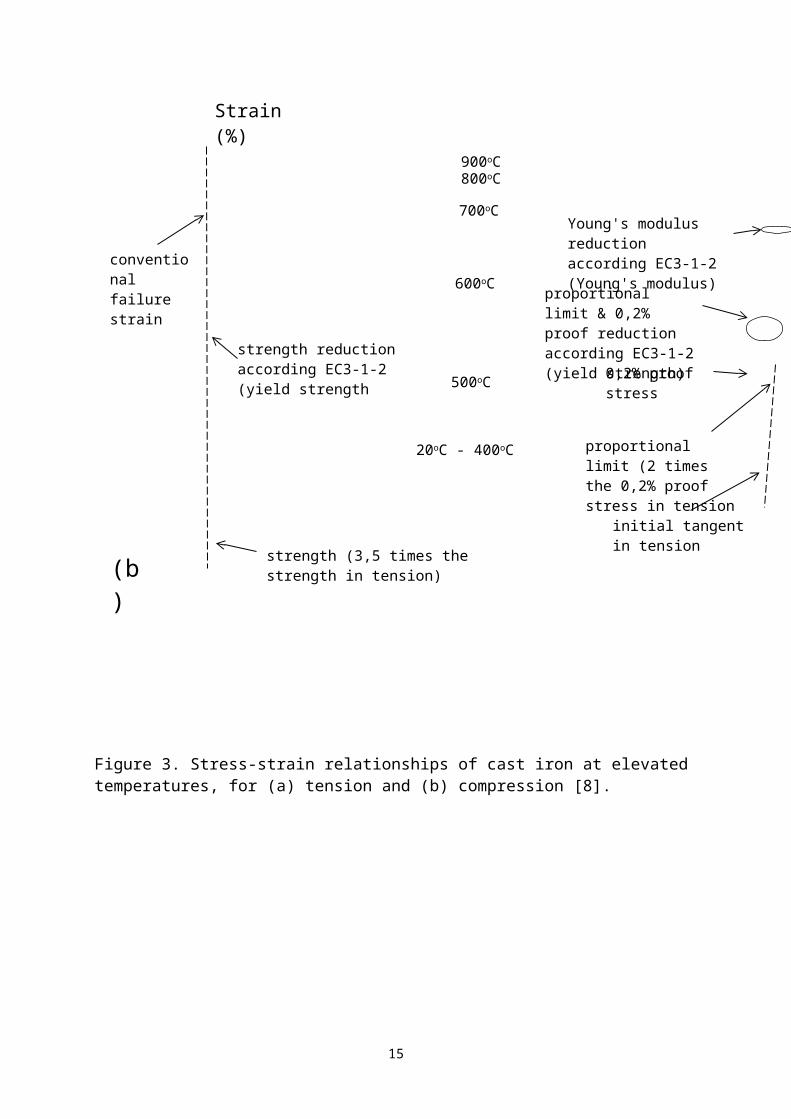
The stress-strain temperature relationships for cast iron are as proposed by the authors in [8]
and are illustrated in Figure 3. The stress-strain diagram parameters in tension are:
- Young’s modulus,
- the 0.2% proof stress,
- the maximum stress and the corresponding strain.
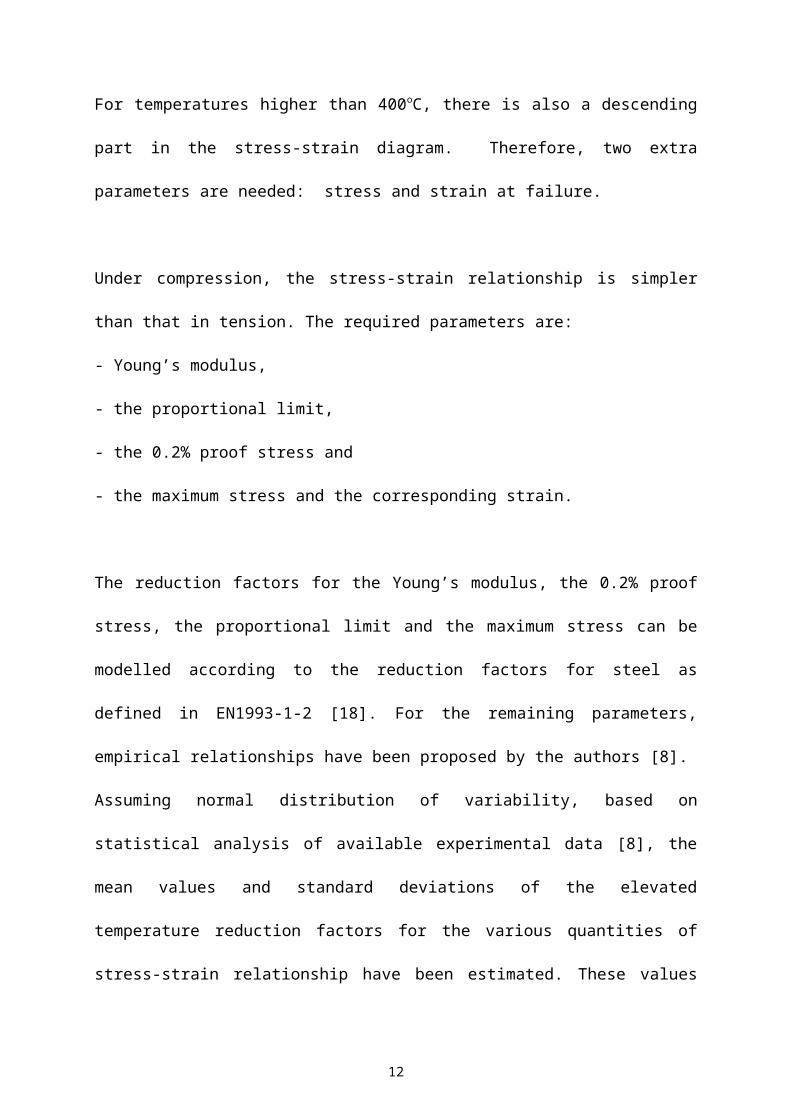
For temperatures higher than 400oC, there is also a descending part in the stress-strain
diagram. Therefore, two extra parameters are needed: stress and strain at failure.
Under compression, the stress-strain relationship is simpler than that in tension. The required
parameters are:
7
- Young’s modulus,
- the proportional limit,
- the 0.2% proof stress and
- the maximum stress and the corresponding strain.
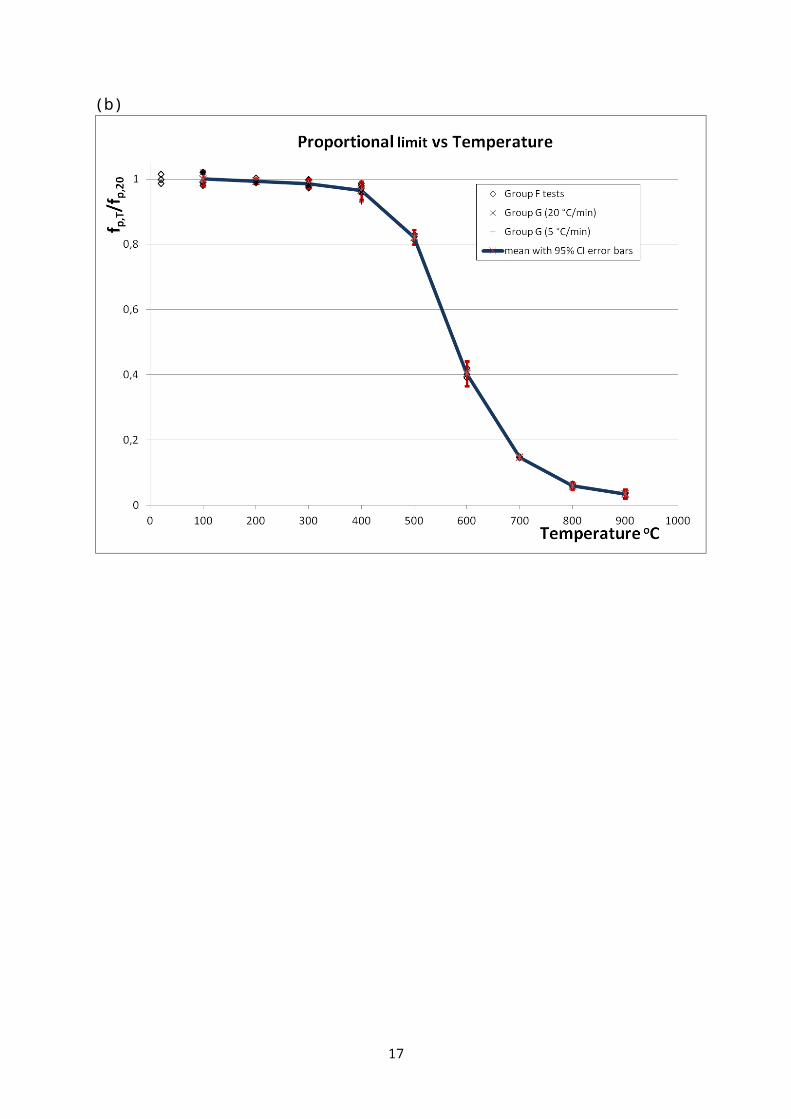
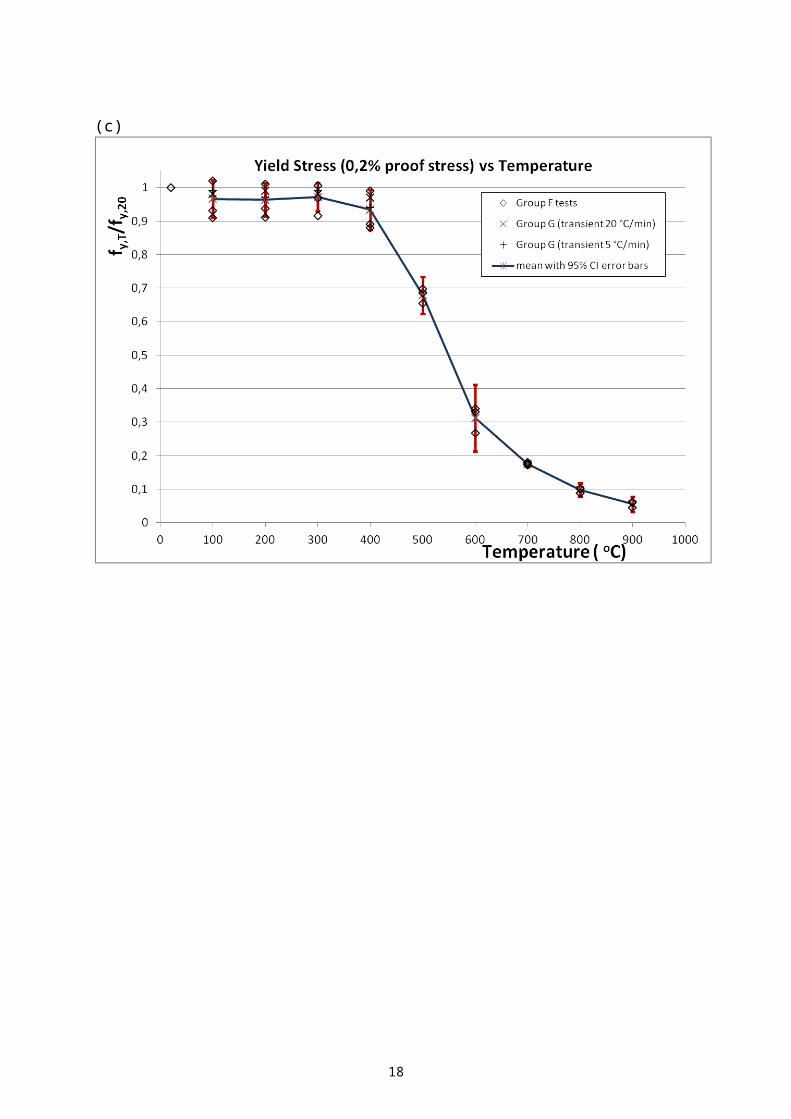
The reduction factors for the Young’s modulus, the 0.2% proof stress, the proportional limit
and the maximum stress can be modelled according to the reduction factors for steel as
defined in EN1993-1-2 [18]. For the remaining parameters, empirical relationships have been
proposed by the authors [8].
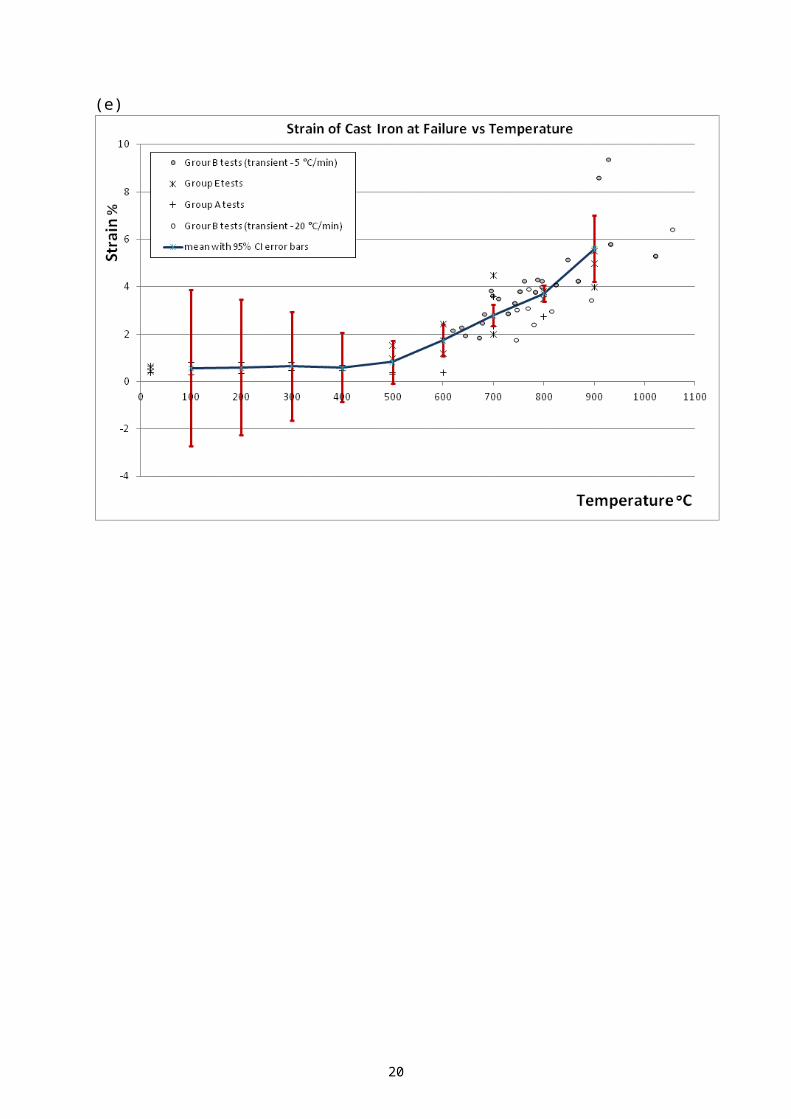
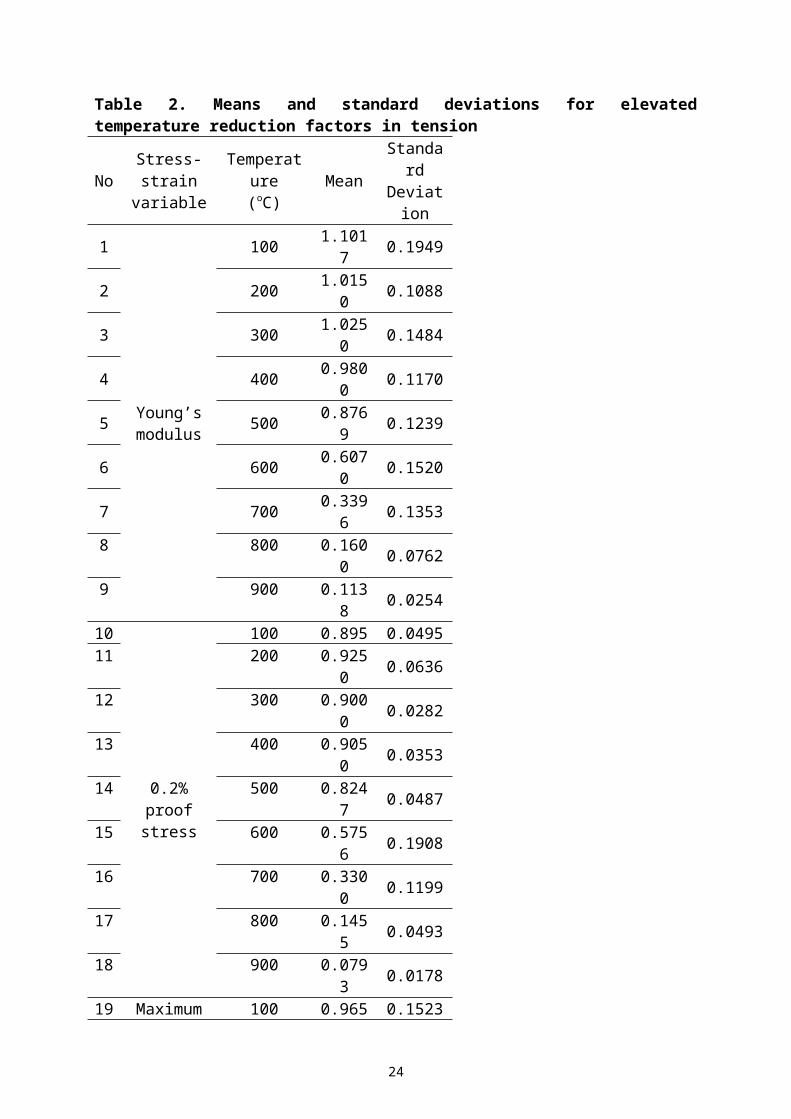
Assuming normal distribution of variability, based on statistical analysis of available
experimental data [8], the mean values and standard deviations of the elevated temperature
reduction factors for the various quantities of stress-strain relationship have been estimated.
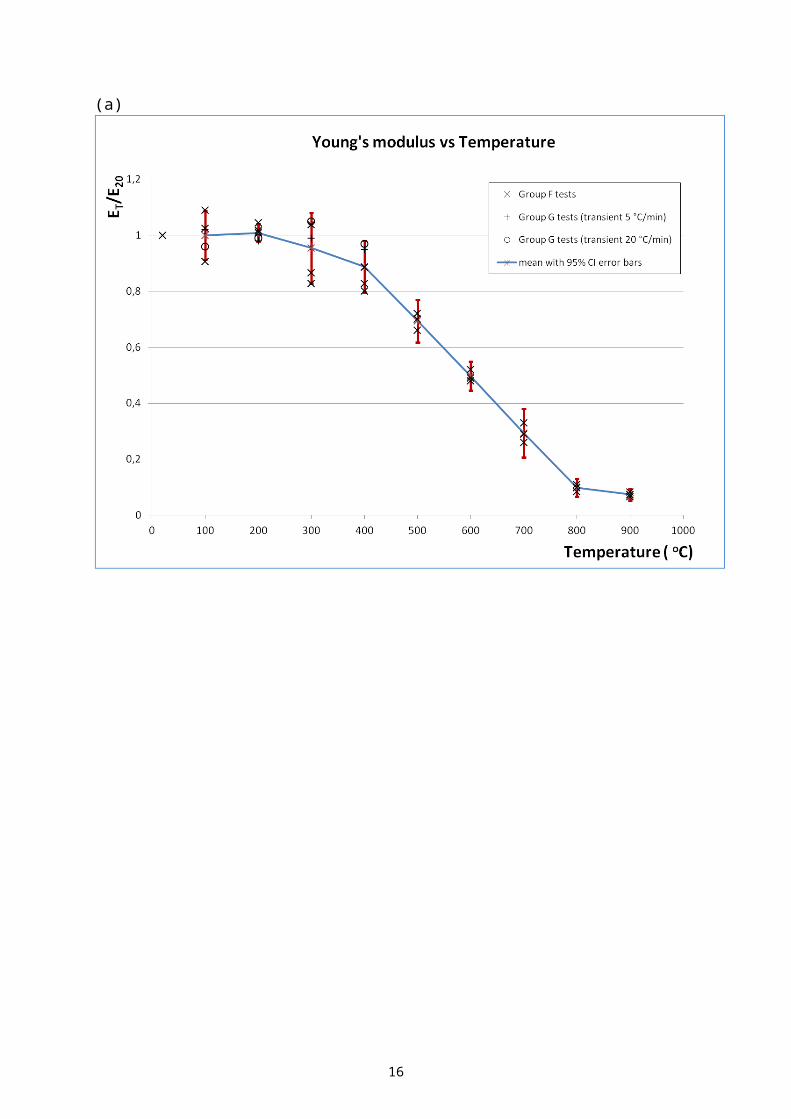
These values are presented in Tables 2 to 4. Also, typical diagrams of 95% confidence
interval vs temperature are presented in Figure 4. The uncertainties are very large because of
the nature of the material. Cast iron is a brittle material and its mechanical properties are
affected by the method of casting, including cooling and solidification. The most important
parameter, which severely affects its mechanical properties (especially in tension), is the
existence of randomly distributed graphite flakes within its mass. These graphite flakes are
microstructure flaws. Depending on the position, the number and the size of these flows
(discontinuities), cast iron may have very different properties in tension. No one specimen is
the same as the other, as they have different flaws. It is therefore important that the necessary
material safety factors are quantified to ensure that cast iron structures achieve acceptable
levels of reliability in fire.
Due to a lack of data, the mechanical properties presented in Tables 2 to 4 are considered to
be independent variables.
8

9
0,20
700oC
ambient temperature failure strain
reduction of strength per EC3-1-2 (yield strength)
failure stress: 50% of strength
reduction of 0,2% proof stress per EC3-1-2 (yield strength)
reduction of Young's modulus per EC3-1-2 (Young's modulus)500oC
600oC
800oC900oC
20oC-400oC
Strain (%)
Stre
ss
(Mpa
)strength
(a)
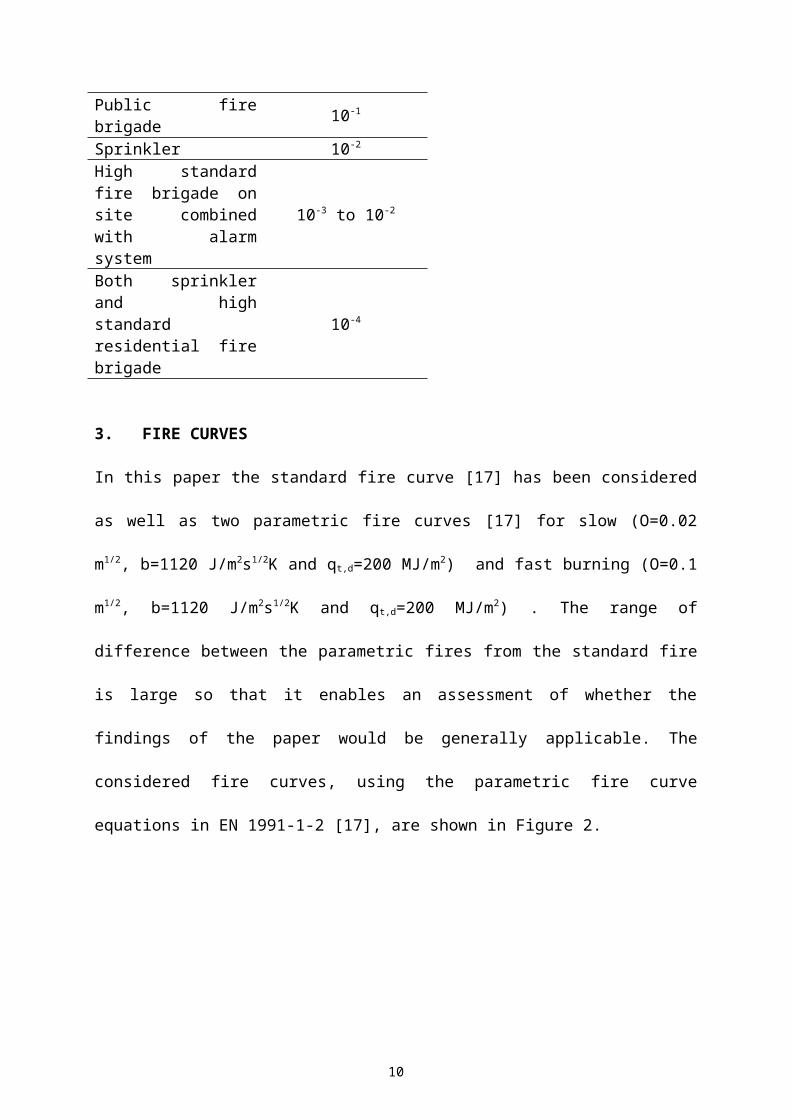
Figure 3. Stress-strain relationships of cast iron at elevated temperatures, for (a) tension and (b) compression [8].
10
strength (3,5 times the strength in tension)
strength reduction according EC3-1-2 (yield strength
conventional failure strain
initial tangent in tension
0,2% proof stress
proportional limit (2 times the 0,2% proof stress in tension
20oC - 400oC
500oC
600oC
700oC
800oC900oC
proportional limit & 0,2% proof reduction according EC3-1-2 (yield strength)
Young's modulus reduction according EC3-1-2 (Young's modulus)
Strain (%)
(b)
(a)
11
(b)
12
(c)
13

(d)
14
(e)
15
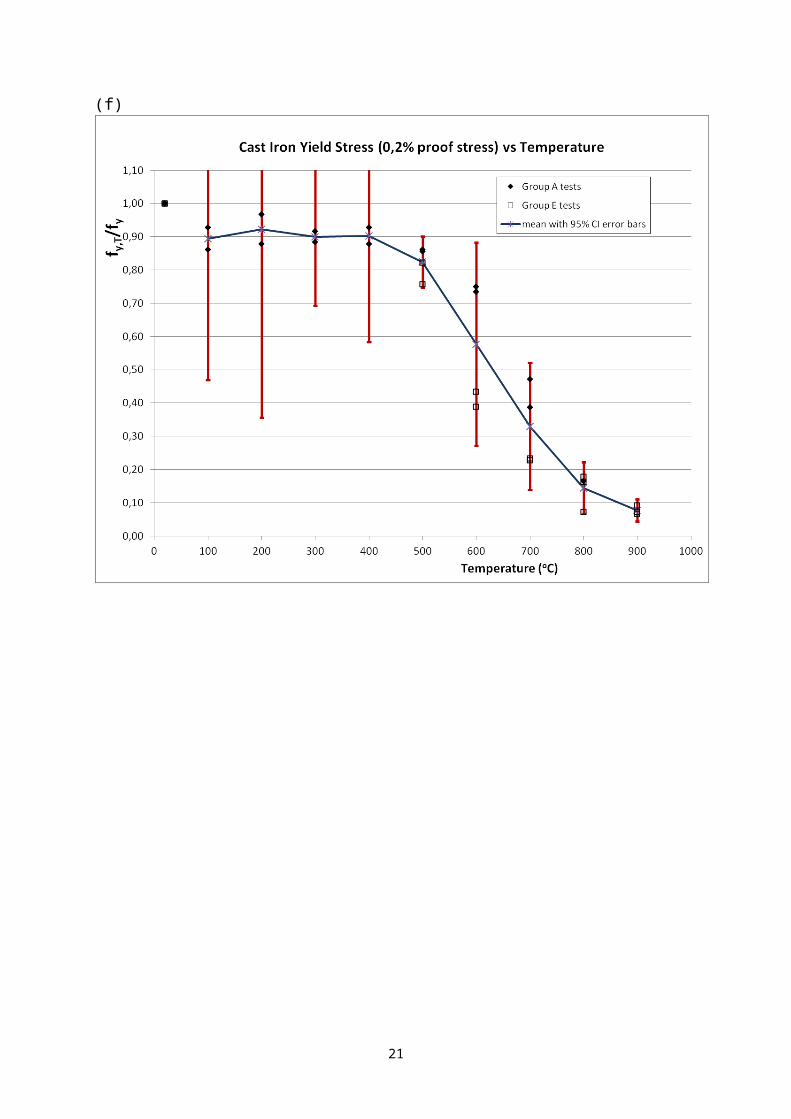
(f)
16
(g)
17
(h)
Figure 4. Scatters and 95% confidence interval (CI) vs temperature for key mechanical
properties of cast iron in tension and compression (a) Young’s modulus in compression, (b)
Proportional limit in compression, (c) 0.2% proof stress in compression, (d) Strain at tensile
strength, (e) Failure strain in tension, (f) 0.2% proof stress in tension, (g) Strength in tension
and (h) Young’s modulus in tension. Based on the test data of reference [8].
18
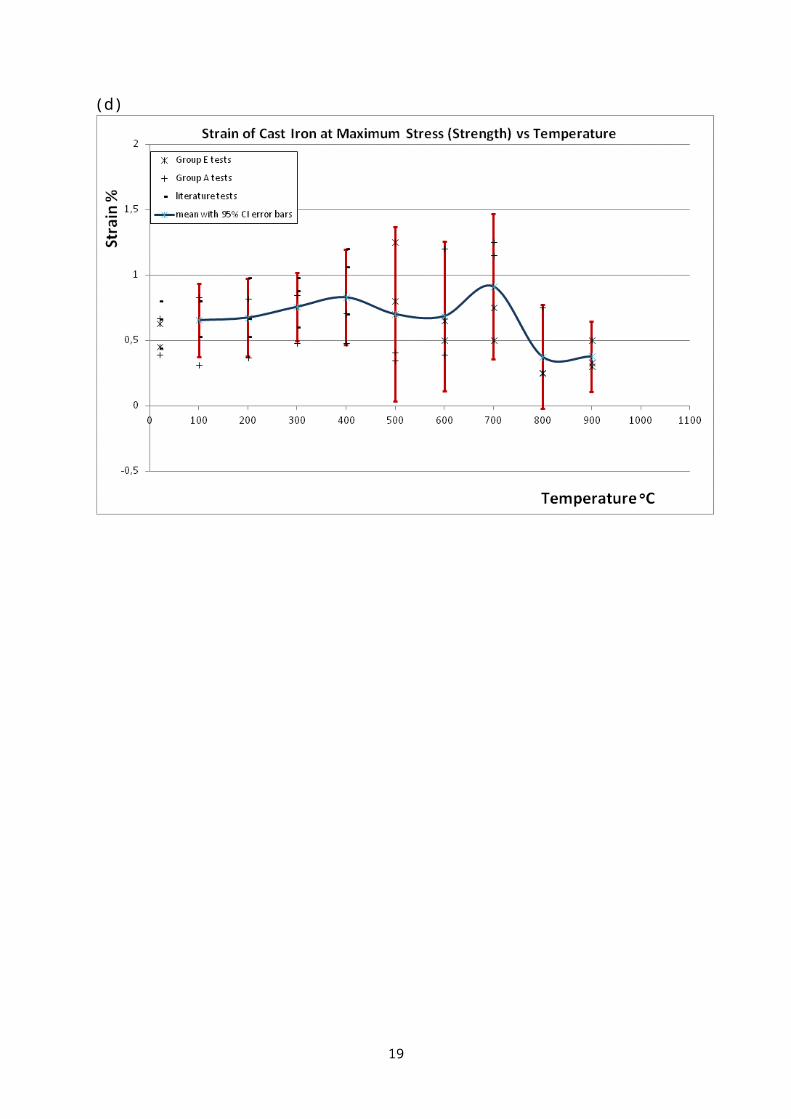
Table 2. Means and standard deviations for elevated temperature reduction factors in tension
No
Stress-strain variable
Temperature
(oC)Mean
StandardDeviatio
n1
Young’s modulus
100 1.1017 0.19492 200 1.0150 0.10883 300 1.0250 0.14844 400 0.9800 0.11705 500 0.8769 0.12396 600 0.6070 0.15207 700 0.3396 0.13538 800 0.1600 0.07629 900 0.1138 0.025410
0.2% proof stress
100 0.895 0.049511 200 0.9250 0.063612 300 0.9000 0.028213 400 0.9050 0.035314 500 0.8247 0.048715 600 0.5756 0.190816 700 0.3300 0.119917 800 0.1455 0.049318 900 0.0793 0.017819
Maximum stress
100 0.9658 0.152320 200 0.9873 0.138821 300 0.9896 0.103322 400 0.9693 0.130723 500 0.8687 0.064024 600 0.6351 0.168525 700 0.4891 0.142426 800 0.3026 0.166827 900 0.1195 0.067828 Strain at
maximum stress
100 0.97611 0.339701
29 200 1.00597 0.356418
30 300 1.12835 0.310448
31 400 1.23880 0.437463
32 500 1.04850 0.620896
33 600 1.02238 0.536567
34 700 1.41791 0.581194
35 800 0.62194 0.430896
36 900 0.5622 0.161045
19
3
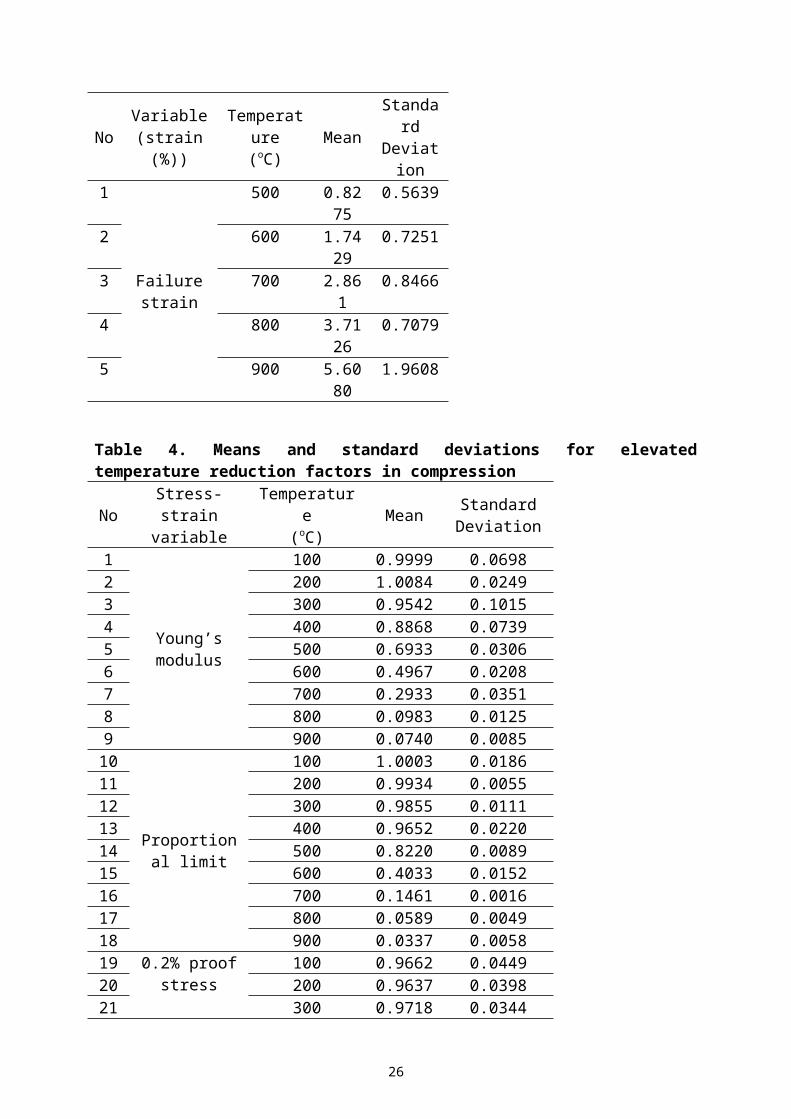
Table 3. Means and standard deviations for failure strain in tension
No Variable(strain (%))
Temperature
(oC)Mean Standard
Deviation
1
Failure strain
500 0.8275 0.56392 600 1.7429 0.72513 700 2.861 0.84664 800 3.7126 0.70795 900 5.6080 1.9608
Table 4. Means and standard deviations for elevated temperature reduction factors in compression
No Stress-strain variable
Temperature(oC) Mean Standard
Deviation1
Young’s modulus
100 0.9999 0.06982 200 1.0084 0.02493 300 0.9542 0.10154 400 0.8868 0.07395 500 0.6933 0.03066 600 0.4967 0.02087 700 0.2933 0.03518 800 0.0983 0.01259 900 0.0740 0.008510
Proportional limit
100 1.0003 0.018611 200 0.9934 0.005512 300 0.9855 0.011113 400 0.9652 0.022014 500 0.8220 0.008915 600 0.4033 0.015216 700 0.1461 0.001617 800 0.0589 0.004918 900 0.0337 0.005819
0.2% proof stress
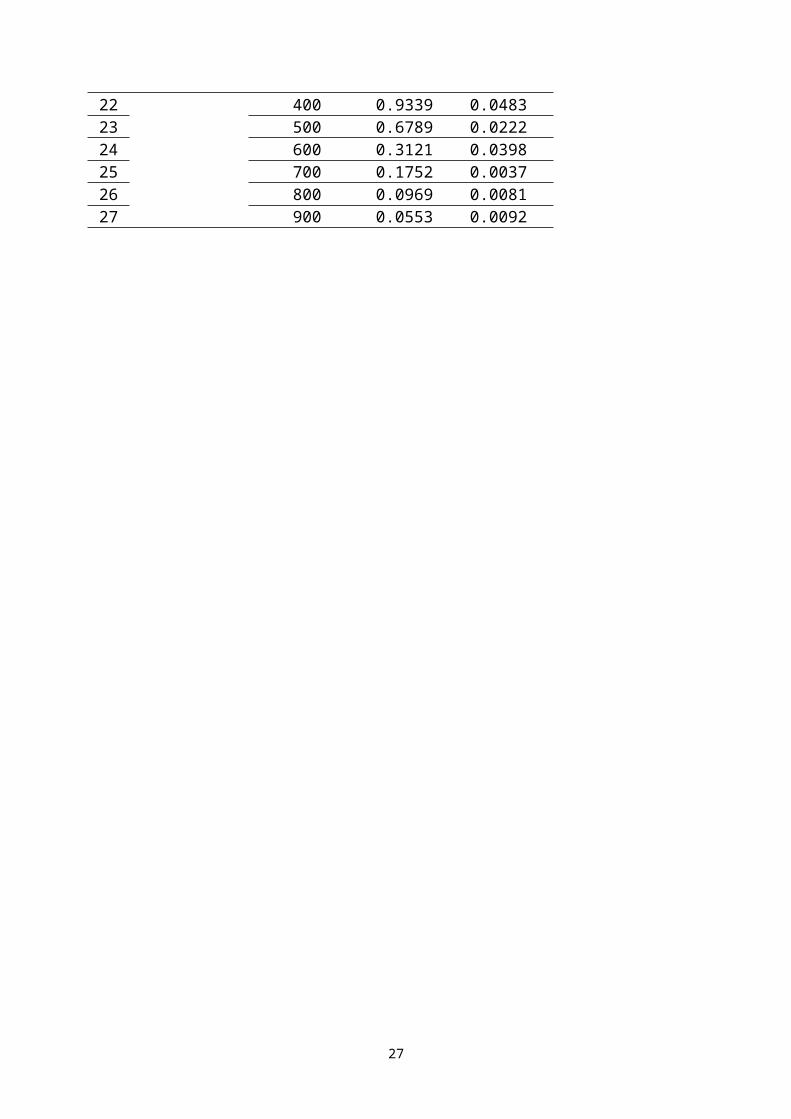
100 0.9662 0.044920 200 0.9637 0.039821 300 0.9718 0.034422 400 0.9339 0.048323 500 0.6789 0.022224 600 0.3121 0.039825 700 0.1752 0.003726 800 0.0969 0.008127 900 0.0553 0.0092
20
5. CALCULATION OF BENDING MOMENT CAPACITY: FIBRE ANALYSIS MODEL
The Monte-Carlo method has been used to evaluate the material partial safety factors for cast
iron beams at elevated temperatures. To facilitate this calculation, a quick and simplified
method should be developed to calculate the bending moment capacity of cast-iron beam
cross-section. A fibre analysis model, based on [19] and [20], has been developed and
validated against detailed finite element analysis [9]. A schematic presentation of the fibre
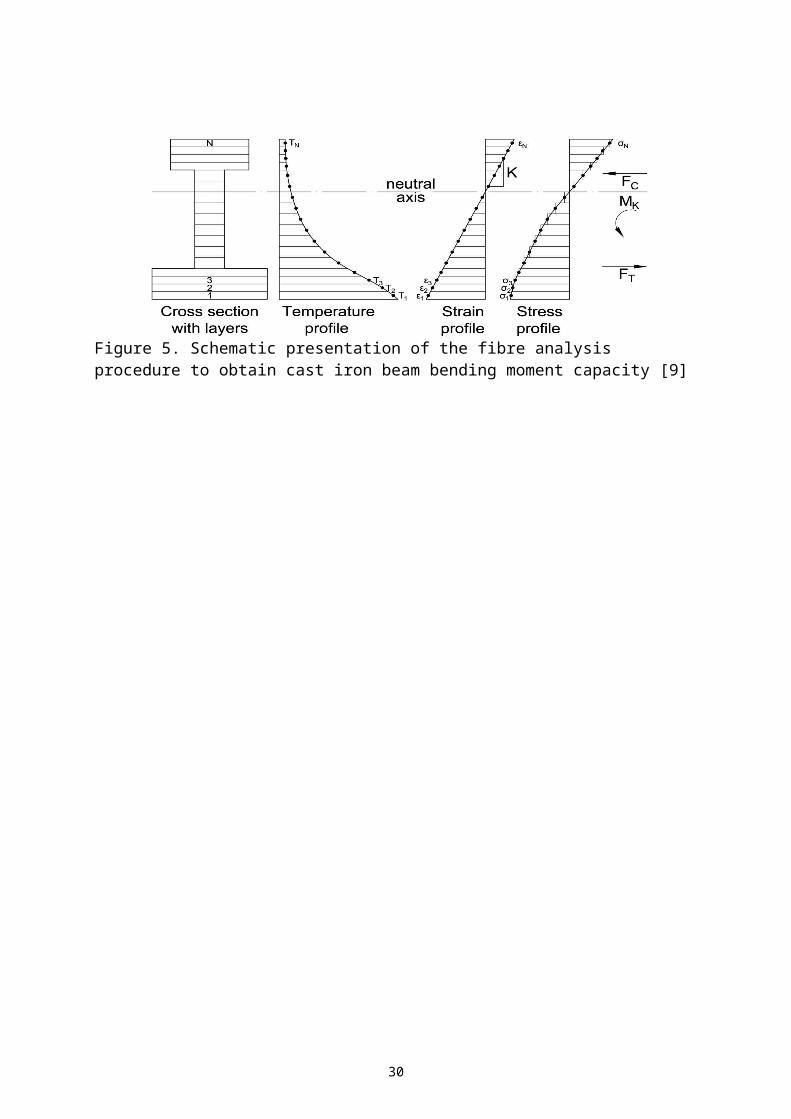
model is shown in Figure 5. A summary of the method is presented below:
At a curvature k:
1. The initial position of the neutral axis is assumed to be at the centre of gravity.
2. The cross-section is divided into a large number of fine layers.
3. The strain at the mid-depth of each layer is calculated.
4. The temperature at the mid-depth of each layer is calculated.
5. The stress at the mid-depth of each layer is calculated.
6. The force of each layer is calculated.
7. The tensile (Ft) and the compressive forces (Fc) of all layers are summed.
8. If |Ft – Fc| / Ft < r, where r is a small value (taken as 0.001 in this research), the
corresponding moment (M) is calculated.
9. If |Ft – Fc| / Ft > r, the algorithm returns to step 1 and the position of the neutral axis is
modified according to the equation yn+1=yn-((Ft-Fc)/(Ft+Fc))*yCG (where y is the distance from
the bottom of the cross section and yCG is the distance of the centre of gravity from the bottom
of the cross section).
10. If increasing the curvature gives a smaller bending moment, then the (Μ, k) result of the
previous iteration is the first point of the descending branch of the moment-curvature curve,
and the corresponding bending moment is the final (maximum) bending moment capacity of
the beam.
21

22
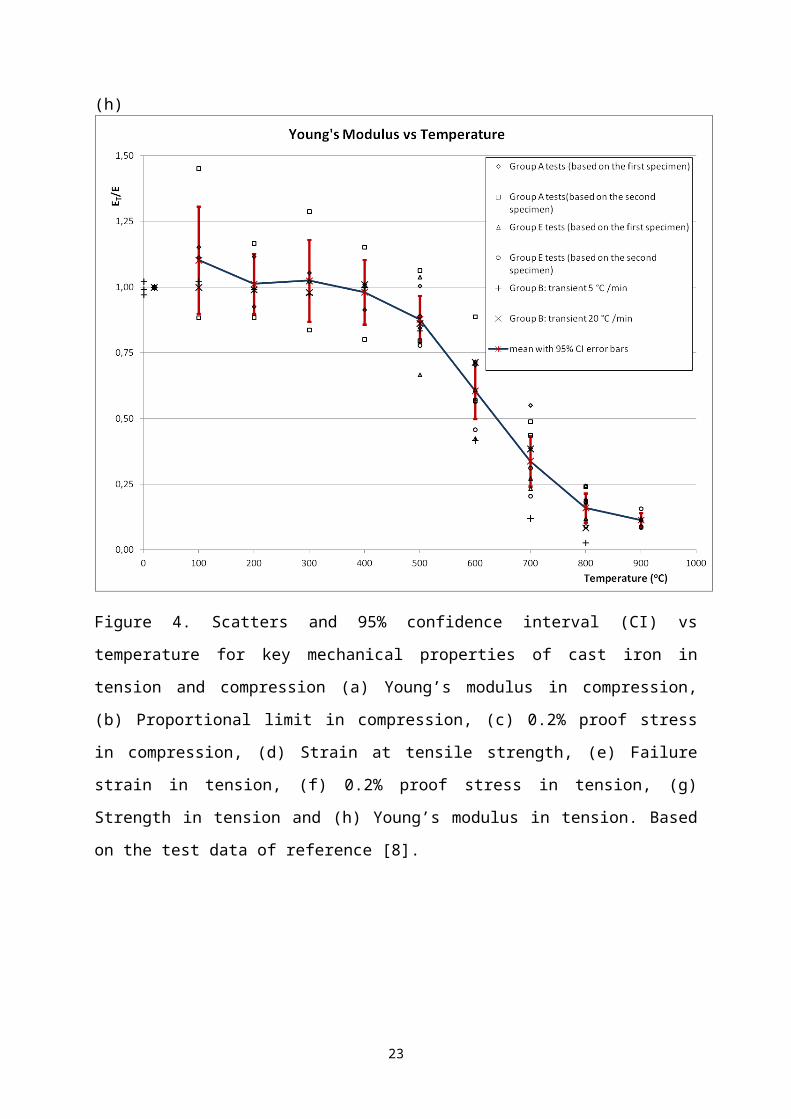
Figure 5. Schematic presentation of the fibre analysis procedure to obtain cast iron beam bending moment capacity [9]
23
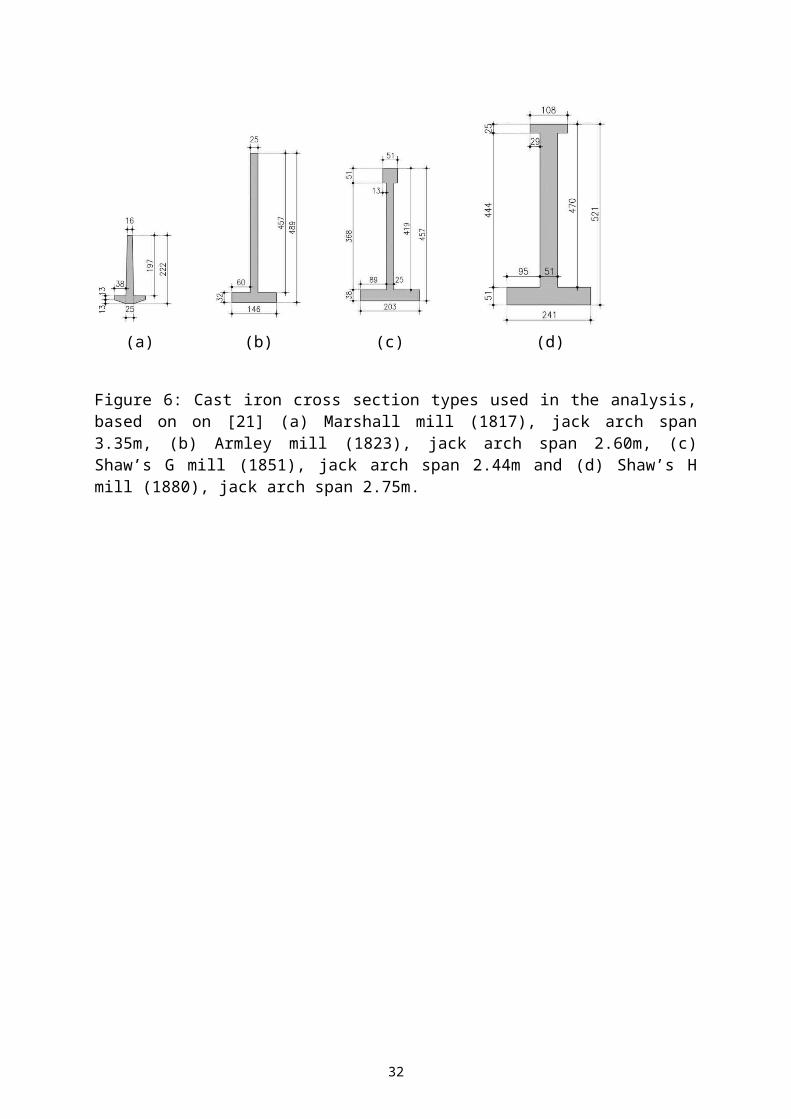
6. CROSS SECTIONS
Four cast iron cross sections were used for the analysis and they are shown in Figure 6. The
first cross section (Figure 6a), used in the Marshall Mill [21], is short and thin. Its section
factor is low (perimeter length/cross-section area for the bottom flange), so when it is exposed
to fire, it would increase temperatures rapidly. Also because it is shallow, the cross-section
temperature distribution would be relatively uniform. The last cross section (Figure 6d) is tall
and thick. Therefore, it has a low section factor and is expected to increase its temperature
slowly. Also it would experience large temperature differences in the cross-section. The cross
sections in Figure 6b and 6c are intermediate cross sections between the previous two. The
nominal dimensions of the cross sections are used in the analysis without taking into account
their variations because the focus of this study is on material partial safety factors.
(a) (b) (c) (d)
Figure 6: Cast iron cross section types used in the analysis, based on on [21] (a) Marshall mill (1817), jack arch span 3.35m, (b) Armley mill (1823), jack arch span 2.60m, (c) Shaw’s G mill (1851), jack arch span 2.44m and (d) Shaw’s H mill (1880), jack arch span 2.75m.
24

7. TEMPERATURE PROFILES
The sections were assumed to be exposed to the standard or natural (parametric) fire [17] as
presented in Section 3 and the thermal profiles of the cross-sections were calculated using the
finite element software ABAQUS. Figure 7 shows the thermal boundary conditions and
material properties used. The thermal properties of cast iron are those of steel according to
EN1993-1-2 [18] and the thermal properties of the insulation are those of concrete according
to EN1992-1-2 [22] as proposed by the authors in [5], [6] and [7]. The moment capacity of
cast iron is not sensitive to the variations of thermal properties of both the insulation materials
and cast iron as found in the previous sensitivity study of the authors [7]. Therefore, they are
not considered as random variables in this study.
The temperature profiles of the sections were used as input in subsequent calculations of
bending moment resistances of the cross-sections. This paper will present results for 30 and
60 minutes of the standard fire exposure and for parametric fires. Under parametric fires, the
minimum bending moment capacities were calculated.
Cast iron beams are simply supported at ends, therefore, it is reasonable to assume that
temperature distribution along the length of cast iron beams is uniform, in accordance with
accepted design practice.
Figure 7. Thermal boundary conditions and thermal properties of materials used for the thermal analysis
25
8. METHODOLOGY OF RELIABILITY ANALYSIS
Monte-Carlo simulations were performed to estimate the probability of failure of the cast-iron
beam cross-sections and the corresponding material safety factors.
The material safety factor is calculated by the following equation:
γ Μ ,fi=M fi ,T
M fi ,TPf
(4)
where Mfi,T is the moment capacity calculated using the nominal cast-iron mechanical
property model in [8]. M fi ,TP f is the moment capacity corresponding to the target conditional
probability of failure Pf (10-3, 10-2, 10-1) at the standard fire exposure time T or the minimum
moment capacity during a parametric fire, obtained to satisfy the following probability
condition:
M fi ,TP f =M d , fi∨Pf (5)
where Md,fi is moment capacity distribution calculated using randomised stress-strain curves
of cast iron.
In the Monte Carlo simulations, the following nine elevated temperature mechanical
properties of cast iron were varied:
Young’s modulus in tension
0.2% proof stress in tension
maximum tensile stress
strain corresponding to the maximum tensile stress
strain at failure in tension
Young’s modulus in compression
proportional limit in compression
26
0.2% proof stress in compression
maximum compressive stress
The mean and standard deviation values for these variables are given in Tables 2, 3 and 4.
The Monte Carlo simulation procedure is outlined below:
For each Monte Carlo simulation, random values of the above nine variables at the
corresponding temperatures were generated according to their distributions, assumed
to be normal with the mean and standard deviation values in Tables 2, 3 and 4. A total
of 100,000 simulations were run, based on the rule of thumb [23] that the sample size
should exceed 10/Pf, where the smallest Pf considered (10-3). Section 9 further
confirms that this total number is adequate.
Any negative property value was rejected.
After selecting the nine random mechanical properties of cast iron, the stress-strain
temperature relationships were generated.
Use the elevated temperature stress-strain temperature relationships, for a given cross
section and temperature profile, the moment resistance was calculated using the fibre
analysis model outlined in Section 5.
From the calculated moment capacity results, the normal distribution parameters
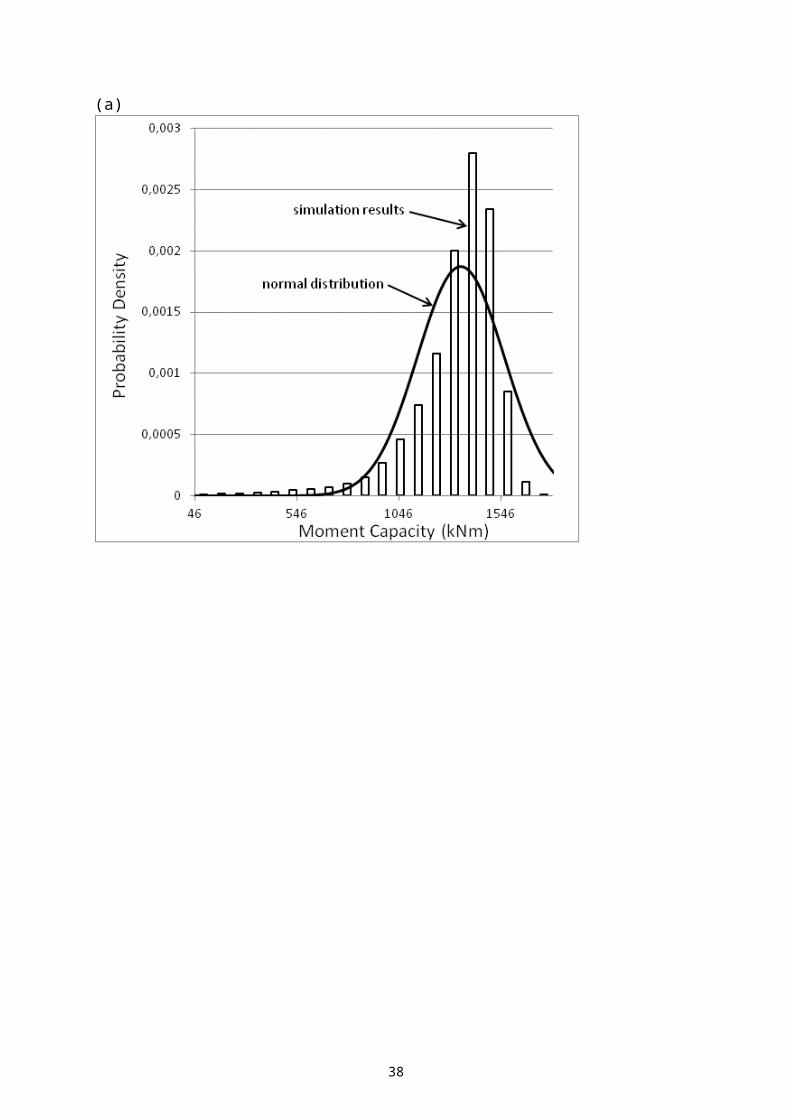
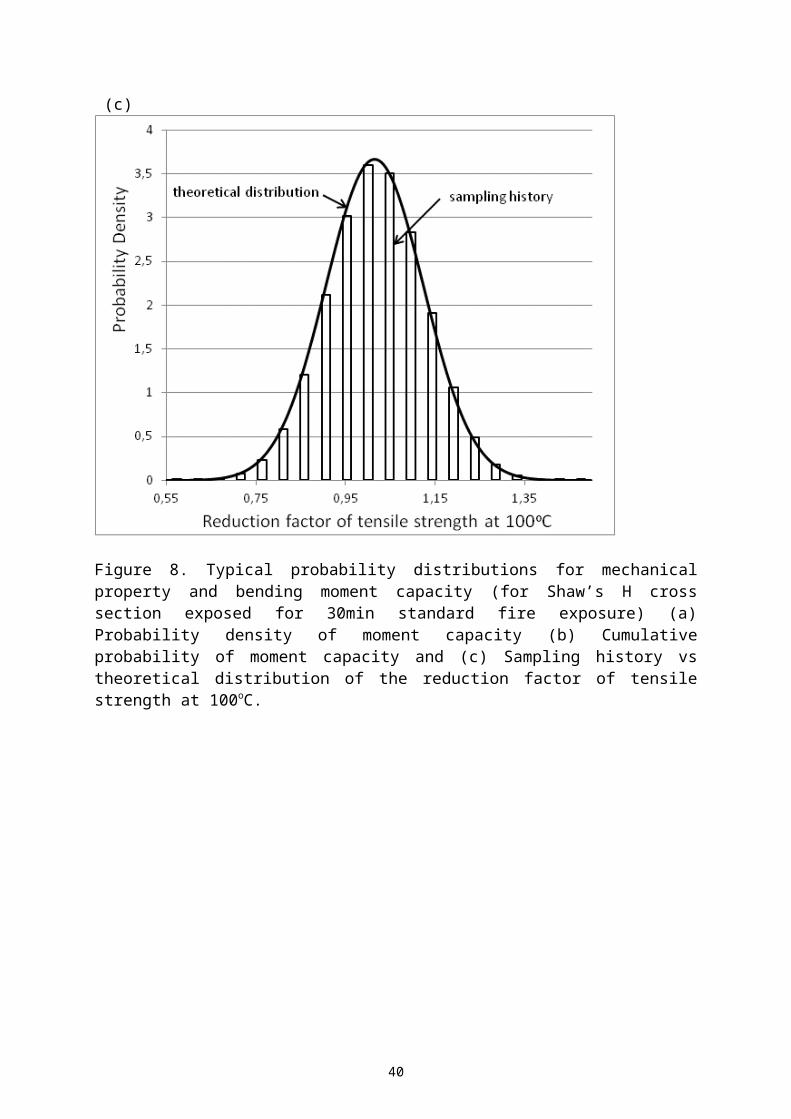
(mean, standard deviation) were calculated. Figure 8 shows typical results for Shaw’s
H cross section for 30 minutes of the standard fire exposure.
From the calculated moment capacity distribution, the corresponding moment
capacities for Pf =10-1, 10-2 and 10-3 are calculated (equation (5), based on the
cumulative probability density of bending moment capacity). Figure 9 shows an
example of this procedure.
27
(a)
28

(b)
29
(c)
Figure 8. Typical probability distributions for mechanical property and bending moment capacity (for Shaw’s H cross section exposed for 30min standard fire exposure) (a) Probability density of moment capacity (b) Cumulative probability of moment capacity and (c) Sampling history vs theoretical distribution of the reduction factor of tensile strength at 100oC.
30
Moment Capacity (kNm)
Cum
ulati
ve D
ensit
y
Pf=0
.1, M
=117
6.35
kN
m
Pf=0
.01,
M=9
53.8
3 kN
m
Pf=0
.001
, M=7
91,1
3 kN
m
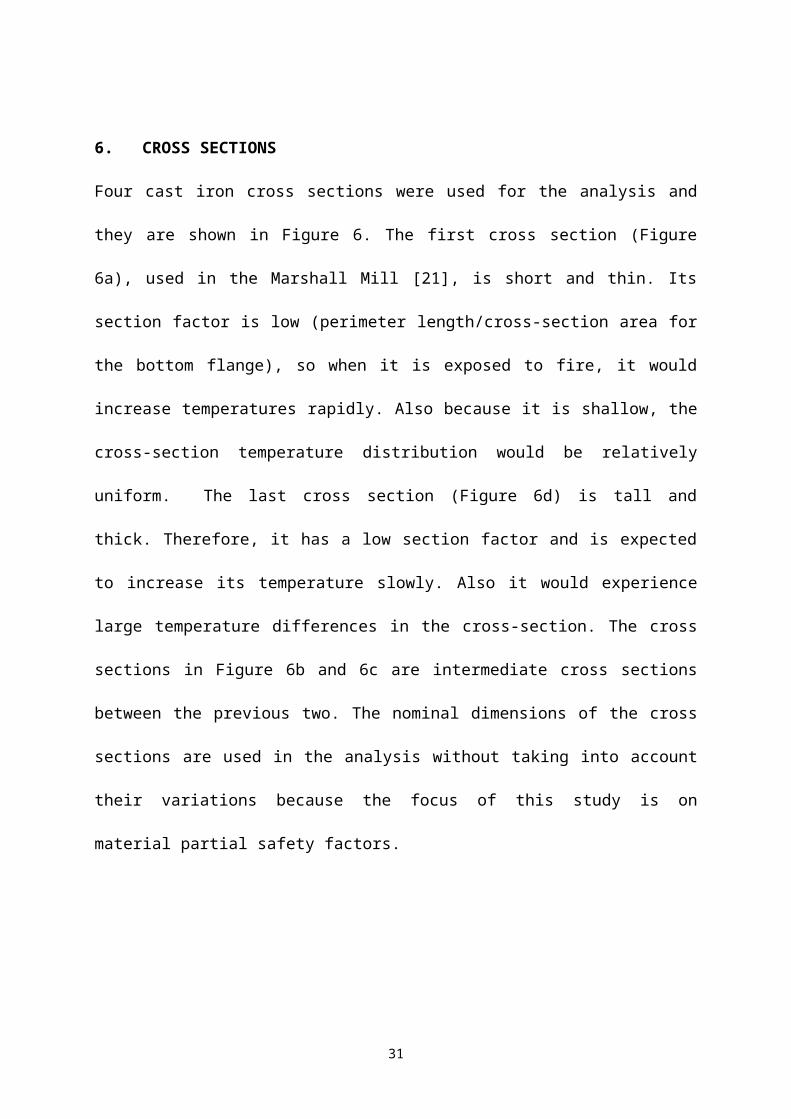
Figure 9. Moment capacities for corresponding cumulative failure probabilities (10-1, 10-2, 10-
3) for Shaw’s H cross section exposed for 30min standard fire exposure.
31
chrysanthos, 24/03/17,
I will renumber the figures bellow after your comments
9. CONVERGENCE OF RELIABILITY ANALYSIS – SAMPLE SIZE
To confirm the rule of thumb [23] for the necessary number of simulations, the cross sections
in Figure 8a and 8d were used. The thermal profile was that at 30 min of standard fire
exposure [16]. The probability of failure was 10-3. The error E is defined by the following
equation:
E=|M fi, Ti=100.000−M fi ,T
i
M fi, Ti=100.000 | (6)
where i is the sample size and i=100,000 is the sample size used for the analysis within the
paper. Figure 9 represents the error vs sample size for the two cross sections for the given
probabilities of failure. In all cases, a sample size much less than 100,000 is sufficient.
4000 6000 8000 10000 12000 14000 16000 18000 20000 220000
2
4
6
8
10
12
14
16
Sample Size
Er ro r (% )
Cross section from Mar-shall mill (Figure 8a)
Cross section from Shaw's G mill (Figure 8d)
Figure 9. Error vs sample size for Pf =10-3
32
10. RESULTS
Tables 5 to 8 present results of the reliability analysis.
From these results the short cross section (Figure 6a) needs higher material safety factors than
the tall cross section (Figure 6d). This is expected as the short cross-section has relatively
uniform temperature distribution, therefore uncertainties in cast-iron mechanical properties
affect a large part of the short cross section. In contrast, just a short part of the tall cross
section experiences elevated temperatures.
The proposed material safety factors are high compared to the proposed values in Eurocodes
for modern steel. This is expected, because the production and quality control of modern steel
follow much more strict specifications than the cast iron beams manufactured during the 19th
century when the production technology and quality control were more primitive.
For the standard fire exposure, the safety factors for the higher fire rating, R60 are slightly
higher than for the lower fire rating, R30. This is due to the larger scatter of tensile properties
at higher temperatures associated with the higher fire rating. However, the differences in the
material safety factors for the two different fire ratings with the same probability of failure are
relatively small. It is therefore possible to use the same material safety factor for different fire
ratings. The safety factor to reach a failure probability of 10 -3, being the likely lowest target
probability to achieve a reliability index of 3.7, ranges from 4.19 to 5.53. This is very close to
the ambient temperature safety factor of 5.0 [24]. The safety factors for the deeper Shaw’s
sections tend to be lower than those for the shallower Marshall cross-section. Again, this may
be explained by the more uniform and higher temperatures, which are attained in the
shallower Marshall cross-section. However, again the differences in the safety factors for the
two beam sections are relatively small. To summarise, it is possible to recommend one set of
material safety factors according to the target probability of failure, for different fire ratings
33

and cross-section types. Approximately, the following safety factors may be used: 1.5, 2.5 and
4.5 for target probabilities of 10-1, 10-2 and 10-3 respectively.
Under the parametric fire conditions, the safety factors for both the slow and fast fires are
similar, with the safety factors for the slow fire being slightly higher than those for the fast
fire. The safety factors for 60 minutes of standard fire resistance are between those for the
slow and fast fires. This may be explained by the larger variations in cast iron mechanical
properties at higher temperatures (given similar lower flange temperatures) in cast iron cross-
sections under different fire conditions. Figure 10 shows the temperature distributions in a
typical cast iron cross-section for different fires at the fire exposure times when the design
bending moments (either at the end of standard fire resistance time, or when the minimum
bending resistance is reached under the parametric fires) are calculated. The different safety
factors (slow fire > 60 minutes standard fire > fast fire) are in accordance with the cross-
section temperatures under different fires (slow fire > 60 minutes of standard fire > fast fire,
given the same lower flange temperature). Nevertheless, the safety factors for the different
fire scenarios are similar and one set of safety factors may be used for different fires.
Considering that the safety values are high, to enable one sensibly rounded single value of
safety factor to be used for different fire conditions, safety factor values of 1.5, 3.0 and 5.0 are
recommended for target probabilities of failure of 10-1, 10-2, 10-3 respectively.
34

0 100 200 300 400 500 600 700 8000
50
100
150
200
250
300
350
400
450
500
Standard fire - 60 min exposure
Slow burn Parametric fire - 120 min expo-sure
Fast burn Para-metric fire - 24.6 min exposure
Temperature °C
Dist
ance
from
the
botto
m o
f cro
ss se
ctio
n (m
m)
Figure 10. Temperature profile developed within the Armley cross section (Figure 6b) for 60
min of standard fire exposure compared with the temperature profiles (at the minimum
moment capacity) for natural fires .
35
Table 5 Material safety factors for Marshall’s cross section (Figure 6a)Probability of failure
Pf
Standard fire [17] Natural – Parametric fires [17]Moment
Capacity(kNm) after standard fire exposure
time ofM fi ,T
P f
Safety factor γΜ,fi for Minimum moment Capacity(kNm) and
safety factor for slow fire
M fi ,TP f
Safety factor γΜ,fi for slow
fire
Minimum moment Capacity(kNm) and safety factor for fast
fireM fi ,T
P f
Safety factor γΜ,fi for fast
fire
30 minutes 60 minutes
30 minutes
60 minutes
10-1 58.64 28.02 1.52 1.58 21.22 1.59 28.97 1.5510-2 35.13 15.33 2.54 2.89 11.63 2.90 16.15 2.7810-3 24.66 8.01 3.62 5.53 6.08 5.55 8.26 5.44Mfi,LT
Material model [8]
89.34 44.37 33.74 44.91
Table 6 Material safety factors for Armley’s cross section (Figure 6b)Probabilit
y of failure
Pf
Standard fire [17] Natural – Parametric fires [17]Moment
Capacity(kNm) after standard fire exposure
time ofM fi ,T
P f
Safety factor γΜ,fi for Moment Capacity(kNm) after natural fire exposure time for minimum
moment capacity ofM fi ,T
P f
Safety factor γΜ,fi for slow
fire
Minimum moment Capacity(kNm) and safety factor for fast
fireM fi ,T
P f
Safety factor γΜ,fi for fast
fire
30 minutes
60 minutes 30 minutes 60 minutes
10-1 421.40 251.09 1.40 1.51 233.87 1.51 260.35 1.5010-2 304.10 140.42 1.94 2.70 128.42 2.75 144.64 2.7010-3 209.95 76.91 2.81 4.93 71.06 4.97 79.54 4.91Mfi,LT
Material model [8]
589.96 379.15 353.15 390.52
Table 7 Material safety factors for Shaw’s G cross section (Figure 6c)Probabilit
y of Standard fire [17] Natural – Parametric fires [17]
36
10-1 566.69 295.58 1.36 1.49 272.80 1.50 307.05 1.4710-2 428.17 169.38 1.80 2.60 155.00 2.64 174.95 2.5810-3 282.30 90.62 2.73 4.86 83.34 4.91 92.87 4.86Mfi,LT
Material model [8]
770.70 440.41 409.20 451.37
Table 8 Material safety factors for Shaw’s H cross section (Figure 6d)Probabilit
y of failure
Pf
Standard fire [17] Natural – Parametric fires [17]Moment
Capacity(kNm) after standard fire exposure
time ofM fi ,T
P f
Safety factor γΜ,fi for Moment Capacity(kNm) after natural fire exposure time for minimum
moment capacity ofM fi ,T
P f
Safety factor γΜ,fi for
Minimum moment Capacity(kNm) and safety factor for fast
fireM fi ,T
P f
Safety factor γΜ,fi for fast
fire
30 minutes
60minutes
30 minutes
60 minutes
10-1 1176.35 779.40 1.33 1.44 701.56 1.44 881.69 1.4010-2 953.83 483.68 1.64 2.32 433.58 2.33 539.02 2.2910-3 791.13 267.47 1.98 4.19 241.11 4.19 586.83 4.17Mfi,LT
Material model [8]
1,565.73 1,122.39 1,010.25 1,234.36
37
11. CONCLUSIONS
This paper has presented the results of a Monte-Carlo simulation to derive material safety
factors for cast iron beams. In this study, the beam bending moment capacity was calculated
using a fibre analysis method. The mean and standard deviation values for the different key
properties of the stress-strain-temperature relationships of cast iron in both tension and
compression (Young’s modulus in tension, the 0.2% proof stress in tension, the maximum
tensile stress, the strain corresponding to the maximum tensile stress, the strain at failure in
tension, Young’s modulus in compression, the proportional limit in compression, the 0.2%
proof stress in compression, the maximum compressive stress), were estimated from an
assessment of a large amount of data collected by the authors, including the authors’ own
elevated temperature test data. These properties were treated as independent variables due to a
complete lack of data on their correlation.
Based on an analysis of the probability of fire occurrence and the conditional probability of
flashover given fire occurrence, the target conditional beam failure probability given flashover
was found to be in the range of 1.0–10-3 to achieve a reliability index of 3.8.
The safety factors tend to be higher for high standard fire rating, slow parametric fire and
shallow cast iron section. However, these variables have relatively minor influences on the
safety factors. Therefore, it is recommended that to achieve the target conditional probability of
10-1, 10-2, 10-3, the approximate safety factors are 1.50, 3.0 and 5.0 respectively. The same
material safety factors may be used for different cast iron beam cross-sections, different
standard fire ratings and parametric fires. The fire protection engineer should determine the
target conditional probability, based on analysis of the probability of fire occurrence and the
conditional probability of flashover given fire occurrence.
38

REFERENCES
1. INSTITUTION OF STRUCTURAL ENGINEERS, 1996 ‘Appraisal of existing structures’,
Second Edition, The Institution of Structural Engineers, London, UK.
2. SWAILES, T. 2003 ‘19th century “fireproof”’ buildings, their strength and robustness’, The
Structural Engineer, Vol 81, No 19, pp 27-34.
3. WERMIEL, S. 1993 ‘The development of fireproof construction in Great Britain and the
United States in the Nineteenth Century’, Construction History, Vol. 9, pp 3-26.
4. HURST, G., 1990 ‘The age of fireproof flooring’, The iron revolution, pp 35-39.
5. MARAVEAS, C., WANG, Y.C., SWAILES, T., 2013 ‘Thermal and mechanical properties
of 19th century fireproof flooring systems at elevated temperatures’, Construction and Building
Materials, Vol 48, pp 248-264.
6. MARAVEAS, C., SWAILES, T., WANG, Y.C., 2014 ‘Modeling of insulation in 19th
Century metal framed structures’, Proceedings of the 2nd International Conference on
Protection of Historical Constructions, Antalya, Turkey, pp 257-261
7. MARAVEAS, C., WANG, Y.C., SWAILES, T., 2014 ‘Fire resistance of 19th century
fireproof flooring systems: a sensitivity analysis’, Construction and Building Materials, Vol 55,
pp 69-81
8. MARAVEAS, C., WANG, Y.C., SWAILES, T., 2015 ‘An Experimental Investigation of
Mechanical Properties of Structural Cast Iron at Elevated Temperatures and after Cooling
Down, Fire Safety Journal, Vol 71, pp 340-352.
9. MARAVEAS, C., WANG, Y.C., SWAILES, T., ‘Moment capacity of cast iron beams
exposed to fire’, Proceedings of ICE: Structures and Buildings,
http://dx.doi.org/10.1680/jstbu.15.00120
10. 15. ZHANG, C., LI, G.Q., WANG, Y.C., 2014 ‘Probabilistic analysis of steel columns
protected by intumescent coatings subjected to natural fires’ Structural Safety, Vol 50, pp 16-
26.
11. Van Coile, R., Caspeele, R., Taerwe, L., Reliability-based evaluation of the inherent safety
presumptions in common fire safety design, Engineering Structures, 77, 2014, pp 181-192.
12. EN 1990, 2002 ‘Eurocode – Basis of structural design’. European Committee for
Standardization. Brussels.
13. LIE TT, 1974 ‘Probabilistic aspects of fire in buildings’ Technical Paper No. 422 of the
Division of Building Research, National Research Council Canada.
39
14. COILE V.R., CASPEELE R., TAERWE L., 2014 ‘Reliability-based evaluation of the
inherent safety presumptions in common fire safety design’ Engineering Structures, Vol. 77, pp
181–192.
15. LIN Y.S., 2005 ‘Estimations of the probability of fire occurrences in buildings’ Fire Safety
Journal Vol 40, pp 728–735
16. JCSS (Joint Committee on Structural Safety), 2001 ‘Probabilistic model code, Part II –Load
models’.
17. EN1991-1-2, 2005 ‘Eurocode 1 – Actions on structures - Part 1-2: General rules - Structural
fire design’. European Committee for Standardization. Brussels.
18. EN1993-1-2, 2005 ‘Eurocode 3 - Design of steel structures - Part 1-2: General rules -
Structural fire design’. European Committee for Standardization. Brussels.
19. BURGESS I.W., EL-RIMAWI J.A., PLANK R.J., 1990 ‘Analysis of beams with non-
uniform temperature profile due to fire exposure’, Constructional Steel Research, Vol. 16, pp
169-192.
20. BURGESS I.W., EL-RIMAWI J.A., PLANK R.J., 1988 ‘A secant stiffness approach to the
fire analysis of steel beams’, Constructional Steel Research 11, 105-120.
21. R. FITZGERALD, 1988 ‘The development of the cast iron frame in textile mills to 1850’,
Industrial Archaeology Review, Vol X, No 2, pp127-145.
22. EN1992-1-2, 2005 ‘Eurocode 2 - Design of concrete structures - Part 1-2: Actions on
structures exposed to fire’. European Committee for Standardization. Brussels.
23. Goh, A.T.C., Phoon, K.K., Kulhawy, F.H. (2009), Reliability analysis of partial safety
factor design method for cantilever retaining walls in granular soils, Journal of Geotechnical
and Geoenviromental Engineering, Vol. 135, No 5, pp 616-622.
24. BUSSELL, M.N. AND ROBINSON, M.J. 1998 ‘Investigation, appraisal, and reuse, of a
cast-iron structural frame’. The Structural Engineer, Vol. 76, Issue 3
, pp 37-42.
40


