Aspen Planning and Scheduling Seminar
49
1 © 2010 Aspen Technology, Inc. All rights reserved | 1 Agenda (17 th & 18 th Sep) – Refinery Industry Vision – Overview of PIMS software – Demonstrate Planning activities using Aspen PIMS – Discuss & demonstrate Audit findings of BORL PIMS Model and improvements – Refinery Scheduling and its significance – Q&A © 2010 Aspen Technology, Inc. All rights reserved | 2 Plan vs Actual gap: Issues & its sources 85% 90% 95% 100% 105% 1 2 3 4 5 6 7 8 9 10 11 12 13 14 15 16 17 18 19 20 21 22 23 24 25 26 27 28 29 30 31 Gross Margin (% of the plan) December Plan vs. Actual Analysis Planned Profit Actual Daily Profit Average Reconciled Actual Profit 5-10% How do you control and reduce your reconciled gap? This could be costing you millions/month
-
Upload
goutam-giri -
Category
Documents
-
view
127 -
download
16
description
Aspen Planning and Scheduling Seminar
Transcript of Aspen Planning and Scheduling Seminar

1
© 2010 Aspen Technology, Inc. All rights reserved |
1
Agenda (17th & 18th Sep)
– Refinery Industry Vision
– Overview of PIMS software
– Demonstrate Planning activities using Aspen PIMS
– Discuss & demonstrate Audit findings of BORL PIMS Model and improvements
– Refinery Scheduling and its significance
– Q&A
© 2010 Aspen Technology, Inc. All rights reserved |
2
Plan vs Actual gap: Issues & its sources
85%
90%
95%
100%
105%
1 2 3 4 5 6 7 8 9 10 11 12 13 14 15 16 17 18 19 20 21 22 23 24 25 26 27 28 29 30 31
Gro
ss M
arg
in (
% o
f th
e p
lan
)
December
Plan vs. Actual Analysis
Planned Profit Actual Daily Profit Average Reconciled Actual Profit
5-1
0%
How do you control and reduce your reconciled gap?
This could be costing you
millions/month

2
© 2010 Aspen Technology, Inc. All rights reserved |
3
Issue 1: No methodology to analyze it.
Inventory
Gap
General Operations Issues
Operational & Hardware Trouble
Variant Constraints
Blending Issues
Off-spec &
reprocessing
Non-economic blending
Logistics Constraints
Improper timing of unloading or shipping Pipeline
Occupation
• There is no or limited KPI and visualization(notification). • It is hard to find its reasons and resolution with logical frame.
Schedule vs Operations Differences
Process model inconsistency
Demand Qty,
Mode Change
Change OP. Conditions.
© 2010 Aspen Technology, Inc. All rights reserved |
4
Report on Findings Manual data mapping, correlation and analysis
Issue 2 : Performance appraisal process is manual
Manual Data Collection
Analyst
Laboratory (Quality)
Marketing (pricing)
Yield Accounting
Planning
Operations Accounting
Scheduling / Blending
1 – 2 Weeks
Summary
Manual process
- Very time intensive
- Very complex
- Requires expertise
Prone to error
- Data manually mapped and interpreted each time
- Potential for missed analysis
- Inconsistent results
Purely retrospective
- Identify issues that may have occurred 10-40 days ago
- Bleeding profits during this time

3
© 2010 Aspen Technology, Inc. All rights reserved |
5
Issue 3 : No Common Communication and Method to solve issue.
Management
Process Department Operations Planning & Scheduling Performance Mgmt
Why are we not
performing to plan?
I don’t know, I’m still
collecting data
Plan from HQ is
unrealistic, we will
never reach the plan
You are giving me
continuously changing
targets Your LP models are not
representing the reality
© 2010 Aspen Technology, Inc. All rights reserved |
6
Refinery Industry Vision
Margin Maximization by setting the KPI’s for :
Crude and feedstock supply
Product slate
Crude/Product logistics
Refinery asset utilization
Decision support on margin & cash-flow
Maximize margins from Refining Business
Margin Management
Primary
Distribution
Crude
Chartering/logistics
Refining Blending Crude
Trading

4
© 2010 Aspen Technology, Inc. All rights reserved |
7
What are Typical Planning Horizons ?
Long term (1-5 years or more) – Strategic investment planning – Supply/demand strategy – New units/debottlenecking
Medium term (up to 18 months)
– Six-quarter rolling plan/annual budget
– Feedstock selection
– Product market targets
Short term (up to 3 months)
– Plant optimization
– Inventory management
– Products blending
Immediate
– Production planning
– Performance monitoring
© 2010 Aspen Technology, Inc. All rights reserved |
8
Refinery Model
(Aspen PIMS)
Plan Recommendations
Crude selection.
Crude indifference values.
Crude arrival sequencing
Production plan.
Marketing plan
Operating strategies
Constraints
Processing constraints
Blending constraints
Inventory levels.
Feed availability
Product demand
Export term contracts
Product specifications
Refinery Process Models
Base vectors
Shift vectors
Stream property data
Drivers
Performance targets
KPIs
Scheduling
Economics
Feed-stock prices
Product prices
Data flow in Planning

5
© 2010 Aspen Technology, Inc. All rights reserved
Dharmendra Sah, Principal Business Consultant
17th & 18th Sep 2012
Aspen PIMS™ Seminar
Advanced Refinery Planning for Better and quicker Decision Making
© 2010 Aspen Technology, Inc. All rights reserved |
10
Agenda
Refinery Best Practices
Planning Key Activities
Why Refinery Planning
The Basics
LP Concepts
PIMS Features & Options
Study Areas
Optimization Areas / Economic Studies / Profit Improvement Plans / Investment Options
When to use Aspen PIMS
Aspen Petroleum Scheduler

6
© 2010 Aspen Technology, Inc. All rights reserved |
11
Refining Best Practises
Emphasis on operational excellence
Lowering of feedstock acquisition costs
Increasing use of technology
Better utilization of supply chain assets
© 2010 Aspen Technology, Inc. All rights reserved |
12
Aspen Solutions in Space and Time to support Industry Best Practices
Daily Weekly Seasonal Annual
Ou
tsid
e
the
Fe
nce
Geogra
phy
Insid
e
Th
e F
en
ce
M
ark
et
Wid
e
Primary Distribution (IMOS)
Historical
Refinery Planning (PIMS)
Refinery Scheduling
(APS)
Collaborative Demand Manager
(CDM)
Yield Accounting (Advisor)
Fleet Optimizer
(AFO)
Distribution Planning
(DPO/PSCP)
TIME

7
© 2010 Aspen Technology, Inc. All rights reserved |
13
Selects Crudes
Plans Operations
Optimizes Sets
Targets for schedulers
Delivers profits
What is PIMS?
Planning
© 2010 Aspen Technology, Inc. All rights reserved |
14
Schedules Crude
Schedules Units
Schedules &
Optimizes Blends
Sets Targets for Operations
Delivers profits
What is APS and MBO?
Scheduling

8
© 2010 Aspen Technology, Inc. All rights reserved |
15
Leaders in Planning & Scheduling
70%
11% 9%
10%
PIMS Honeywell
Haverly No/Unknown
36%
7% 0% 0%
55%
APS
M3
Honeywell
Haverly
Excel based/Unknown
Planning Scheduling
© 2010 Aspen Technology, Inc. All rights reserved |
16
Refinery Planning Key Activities
Evaluate Crude Feedstocks
Create Regional Plan
Create Production Plan
Maintain On-going Models
Create Long-Term Strategic Plan

9
© 2010 Aspen Technology, Inc. All rights reserved |
17
Why Refinery Planning ??
Monthly Refinery Operating Plan
– Determine next month’s production plan for feedstock, operating parameters, modes of operation, blend flexibility, and sales
– Shutdown planning
– Inventory optimization
– Cost of constraint
– Cost of QGA
Performance Management
– Compare plan vs. actual operation for on-going improvement
Capital Investment and Long-Term Plan
– Decide whether to invest in new plant or shutdown assets
– Determine production plans for multiple months or years
– Technology evaluation
Feedstock Evaluation
– Requires running dozens or hundreds of scenarios to evaluate optimal purchases and sales
© 2010 Aspen Technology, Inc. All rights reserved
Dharmendra Sah, Principal Business Consultant
The Basics

10
© 2010 Aspen Technology, Inc. All rights reserved |
19
aspenONE Application Integration
aspenONE Planning & Scheduling is a Key Component of Integrated Supply Chain Management…
Collaborativ
e Demand
Mgmt (CDM)
ERP
Historical
Demand
30/60/90Day
Inventory Mgmt
& Operations
Scheduling
Demand
•Product
•Date
•Location
•Channel
of Trade
30/60/90Day
Actualized Movements
Daily
3rd Party Nominations
-Pipeline Companies
-Vessel Providers
-Inspection Companies
-Rail
Terminal
Inventories
Daily
Secondary
Distribution
(Retail)
Short
Term
Demand
Next 50 lifting
Deal
Capture Deals – Spot,
Term, Exchange
Daily
Production Plan
30/60/90/120
Day
Refinery
Planning
Fwd
Demand
Terminal Demand
& Inventories
30 Day Distribution
Planning
Transportation Loading
Plan (Sourcing priorities
for a given location)
30 Day
Product Nominations &
Scheduled movements
Daily
Production Schedule, Refinery
Inventories
30/60/90/120 Day Refinery
Scheduling
Production Plan
Long Term &
Short Term
30/60/90/120 Day
© 2010 Aspen Technology, Inc. All rights reserved |
20
Operational Excellence – The Next Challenge
Supply Chain Engineering Manufacturing
Demand
Concept
Operations
Supply
Plan
Produce

11
© 2010 Aspen Technology, Inc. All rights reserved |
21
What is Aspen PIMS?
Process Industry Modeling System
LP-based Optimization Tool, but it can handle non-linearity as well.
Short-Term and Long-Term Economic Evaluations
Primary Applications in Petroleum, Petrochemical, and Related Industries
Offers the flexibility of a scalable, single or multi-user system that facilitates enterprise-wide planning for refineries and petrochemical industries
Solve for single / multi-plant and single / multi-period planning requirements
Uses spreadsheet or data tables for data input
Standard PIMS reports and custom reports using ARW
Multi case capability and comparability reporting
© 2010 Aspen Technology, Inc. All rights reserved |
22
Background
• Development began in Oct.,1984 based PC
• Presented at the 1985 NPRA Computer Conference
• First Site : Phibro Texas City, Nov. 1985
• Today, more than 300 petroleum, petrochemical and engineering companies (over 500 sites) use Aspen PIMS suite of software for planning and scheduling

12
© 2010 Aspen Technology, Inc. All rights reserved |
23
How is PIMS Used?
Aspen PIMS is a powerful LP optimization tool for economic planning in the Process Industries.
The main applications of PIMS in Refinery are:
– Optimized production plan (short term and long term)
– Feed stock optimization / product mix optimization
– Product blending formulation
– Planning of feedstock and product inventory
– Strategic or tactical decision support
– Back Casting / Performance Monitoring
– Evaluation of various alternate economic scenarios for nil or minor modifications within existing facilities
– Technology evaluation
– New plant / Refinery configuration
– Sizing of plant units in grass root as well as expansion studies
– Feed Stock costing / New product pricing
© 2010 Aspen Technology, Inc. All rights reserved |
24
Who* Uses PIMS ?
• BP
• Exxon/Mobil
• Shell
• Marathon
• Valero
• COP
• Pemex
• Adnoc
• Aramco
• Total
• Bapco
• McKenzie
• Basf
• Bechtel
• Jacobs
• Chevron (Caltex)
• Citgo
• Pdvsa
• Jacobs
• Petrobras
• Petronas
• Premcor
• Repsol
• Sinopec
• Statoil
• Sunoco
• Tesoro
• Murphy
• Hpcl
• Lyondell
• Ecopetrol
• Bpcl
• Giant
• Koa
• FlintHills
• Fortum
• Alon
• HMEL
• NRL
* Partial List – Over 450 Sites

13
© 2010 Aspen Technology, Inc. All rights reserved
Dharmendra Sah, Principal Business Consultant
LP Concepts
© 2010 Aspen Technology, Inc. All rights reserved |
26
LP Concept
Objective Function = Products - Raw Materials - Utilities - Catalysts - Chemicals -
Labor - Any Other Costs - Penalties
Subject to Linear Constraints
Raw Material Limits
Product Limits
Capacities
Specifications
Other Constraints

14
© 2010 Aspen Technology, Inc. All rights reserved |
27
Simplified LP problem
I have a plant that produces RUL, RUP and FOL. There are 3 Crudes available with the following yields: Yield From Crude A B C PRICE ($/bbl) RUL 50% 20% 20% 90 RUP 20% 50% 20% 100 FOL 30% 30% 60% 50 Cost Crude ($/bbl) 60 65 55 In addition, the plant can only produce 120k Bbls of RUL and RUP and 60K Bbls of FOL
© 2010 Aspen Technology, Inc. All rights reserved |
28
Simplified LP problem
LINEAR EQUATIONS:
RUL = .5 * A + .2 * B + .2 * C
RUP = .2 * A + .5 * B + .2 * C
FOL = .3 * A + .3 * B + .6 * C
Constraint 1: RUL + RUP < 120
Constraint 2: FOL < 60
Maximize Objective Function: 90 * RUL + 100 * RUP + 50 FOL - 60 * A - 65 * B - 55 * C

15
© 2010 Aspen Technology, Inc. All rights reserved |
29
Single feedstock economics Case A B C
OBJECTIVE FUNCTION VALUE 3428.6 3085.7 1300.0
Yield
RUL 0.5 0.2 0.2
RUP 0.2 0.5 0.2
FOL 0.3 0.3 0.6
Margin 20.0 18.0 13.0
FEEDSTOCK PURCHASES
AAA 171.4
BBB 171.4
CCC 100.0
PRODUCT SALES
RUL 85.7 34.3 20.0
RUP 34.3 85.7 20.0
FOL 51.4 51.4 60.0
CAPACITY UTILIZATION
RUL & RUP Limit 120.0 120.0 40.0
FUEL OIL LIMIT 51.4 51.4 60.0
© 2010 Aspen Technology, Inc. All rights reserved |
30
Optimum Economics

16
© 2010 Aspen Technology, Inc. All rights reserved
Dharmendra Sah, Principal Business Consultant
PIMS Features
© 2010 Aspen Technology, Inc. All rights reserved |
32
What are Key PIMS Features?
Powerful non-linear distributive recursion
Automated flowsheeting
Comprehensive diagnostics
Sophisticated blending technology
Powerful optimization engine
Integrate with Rigorous Process Simulator for greater fidelity
Builds realistic and credible models

17
© 2010 Aspen Technology, Inc. All rights reserved |
33
What is a PIMS Model ?
A Set of Data Tables (Spreadsheets) Define the Model
Data Tables Have a Prescribed Form
Data Tables Can Be a Single Spreadsheet, a Sheet From a Multi-sheet Table
A Data Table Can Be Shared by Models or Be in a Library
A Model Is a Subdirectory Under the PIMS (Home Directory)
Base PIMS includes PIMS, ABML, PPIMS, MIP, REPORT WRITER
© 2010 Aspen Technology, Inc. All rights reserved |
34
What Are Data Sources for Configuring a New PIMS Model?
Old LP model database
Current and historic plant data
Process unit simulators
Licensor data
Published, public domain data
Generic databases
– Refinery technology database delivered with PIMS
– Crude assay databases such as BP or Chevron (separately licensed)

18
© 2010 Aspen Technology, Inc. All rights reserved |
35
What Data Is Included with PIMS?
Delivered with system in the form of sample models / data libraries
Process units
– Reforming, Isomerization
– Hydrocracking, Catalytic Cracking
– Alkylation, Coking
Property index correlations
Typical physical property data
© 2010 Aspen Technology, Inc. All rights reserved |
36
PIMS Sample Models
WEIGHT VOLUME MIP RFG LIBRARY
PIMS SAMPLE VOLSAMP MIPSAMP VOLRFG PETROLIB
PCHEMLIB
PPIMS PSAMPLE PVOLSAMP PMIPSAMP PVOLRFG
MPIMS MODELA
MODELB
GLOBAL
MIPA
MIPB MIPG
XPIMS XMODELA
XMODELB
XGLOBAL

19
© 2010 Aspen Technology, Inc. All rights reserved |
37
The PIMS Work flow
VALIDATION & MATRIX GENERATION
DATA
MANAGER MENUS
SOLUTION
REPORTS RECURSION OPTIMIZATION
PIMS EXCEL
Non-Converged
PIMS
XPRESS PIMS PIMS
SummarySolution.LST
FullSolution.LST
IterationLog.LST PrimalDual.LST
© 2010 Aspen Technology, Inc. All rights reserved |
38
Why You Have Recursion – The Pooling Problem
Tank
Stream A at 10 with
a quality of 20
Stream B at 20
with a quality of 10
Product from Tank,
Flow at 30 with quality
of 13.334
• Quality is an average. Average implies division.
• LPs Do not divide, only add, subtract and multiply.
• How do you divide in an LP.
• Guess quality, Solve LP, then compare guess to actual.
• The Pooling Problem.

20
© 2010 Aspen Technology, Inc. All rights reserved
Dharmendra Sah, Principal Business Consultant
PIMS Options
© 2010 Aspen Technology, Inc. All rights reserved |
40
Solution Tracking Data Assistance

21
© 2010 Aspen Technology, Inc. All rights reserved |
41
HTML Reports
Synchronized Scrolling The synchronized scrolling feature is now available with the Go to command.
© 2010 Aspen Technology, Inc. All rights reserved |
42
Enhancement of Data Assistances

22
© 2010 Aspen Technology, Inc. All rights reserved |
43
43
Use of KPI’s
* TABLE SOLNKPIS
* Solution KPIs
TEXT YELLOW RED ***
*
CCAPCCU Cat Cracker Capacity 32 30
ZLIMSEV Reformer Severity 96 100
PURCARL Purchased Arab Light 55 20
MARGVALU Marginal Values 1.00E+03 1.00E+06
XRVIURG RVI of Unleaded Regular 15 13
*** End
Table of Contents
© 2010 Aspen Technology, Inc. All rights reserved |
44
44
First Time
Period
Second Time
Period
Third Time
Period
Inventory
Inventory
PPIMS Periodic PIMS

23
© 2010 Aspen Technology, Inc. All rights reserved |
45
Aspen Report Writer
What does it do? – Provides a Excel Add-in which implements new cell functions that
can be used in template workbooks to design report images
– Provides a function wizard to help create the Report Writer add-in functions in a template workbook
– Provides an execution interface to create a finished report workbook from a template workbook
Report Writer
© 2010 Aspen Technology, Inc. All rights reserved |
46
MIP - Mixed Integer Programming
Typical modeling uses are:
– Mutually exclusive process operations, such as ... Feeds from multiple tanks requiring use of a common
feed pipe Model real blender capability where there are more
components than available pumps
– Threshold purchases/sales, such as ... Pipeline tenders or tanker shipments
– Threshold process throughputs, such as ... zero or minimum blending rate for specific components Minimum blend size Minimum turn down rate
MIP

24
© 2010 Aspen Technology, Inc. All rights reserved |
47
47
MIP
© 2010 Aspen Technology, Inc. All rights reserved |
48
Powerful Modeling and Visualization
Accurate representation of refinery operations
– Use real tower crude assay data
– Support various modeling for process submodels
– Sophisticated blending technology
Powerful optimization technology
– Non-linear distributive recursion
– Extended SLP
Automated flowsheeting
Global Optimization with Parallel Processing
Various Reports (Text, HTML, Excel, DB) and customized reports by Aspen RW
Multiple periods and sites optimization
Solution KPIs and comprehensive diagnostics
Determines optimal economic breakpoint for shifting refinery operating mode
Integration between Planning and Scheduling
Aspen PIMS™ Family

25
© 2010 Aspen Technology, Inc. All rights reserved |
49
Synergies of an integrated approach based on a Common Model Environment (CME)
Improve PIMS models
Integrated Refinery
Scheduling & Blend
Optimization
Rigorous Simulation
Improving shared sub-models provides more accurate planning & scheduling.
RefSys models can be used to provide data to retune shared P&S models as
necessary
APS has functionality to monitor model accuracy on ongoing basis.
Sustained Model
Accuracy
CME
© 2010 Aspen Technology, Inc. All rights reserved |
50
Integrated Assay Management tool with PIMS
PIMS Assay Management has unique capabilities that set it apart from the competition
Tight integration with PIMS
– Read, Characterize, and Re-Cut data from PIMS Assay tables
– All results are written directly to PIMS Assay tables
Formulas and references are preserved and mapped to new crudes
Standard and Deferred cuts are supported
CM
Calcs
Output
Copy Paste
PIMS
Assay Management
PIMS

26
© 2010 Aspen Technology, Inc. All rights reserved |
51
Molecular characterization by PIMS Assay Manager
Available systems perform characterization calculations using statistical and/or engineering equations
Only PIMS employs a new, patented molecular characterization process that provides superior property calculations and extrapolations into all crude regions
© 2010 Aspen Technology, Inc. All rights reserved |
52
52
Workflow for improving accuracy of PIMS model
Data from Data Historian,
Laboratory, etc
RefSYS Reactor
Calibration Mode
(one or more base cases)
RefSYS Reactor
Simulation Mode
Generate Case Studies
using Aspen Simulation Workbook
or Delta base Utility of RefSYS
What-if
Analysis
Aspen
PIMS
Update LP vectors or
sub-model calculator

27
© 2010 Aspen Technology, Inc. All rights reserved |
53
Challenge Challenge Challenge Impact
Maintain On-going Models
Process unit performance changes with time
Hard to keep planning & scheduling models accurate
Schedulers don’t trust the plan
Large gap between plan and actual operation
Major economic decisions based on inaccurate model
Solution
Planning models are maintained regularly to reflect accurate process
performance
More accurate plans – better economic decisions Adherence to the plan–reduced Planning vs. Actual gap
Lost Margin
© 2010 Aspen Technology, Inc. All rights reserved |
54
Integration Planning and Scheduling Data
Use real tower crude assay data
– Integration with crude assay management tools
– Rigorous process simulation technology of Aspen HYSYS Petroleum Refining (REFSYS)
Support various modeling techniques for process submodels
– Vector or Delta base model
– Non-linear modeling
– External model by process engineering technology
Standard Blending Correlations (ABML)
Share process submodel with Scheduling
Planning & Scheduling Model Accuracy (Model Accuracy capabilities in Petroleum Scheduler can indicate need to update models)

28
© 2010 Aspen Technology, Inc. All rights reserved |
55
Aspen Reporting Framework enables effective Performance Management
Automatically combine information from different applications for plan vs.
schedule vs. actual analysis. 777
© 2010 Aspen Technology, Inc. All rights reserved |
56
Today: Plan vs. Schedule vs. Actual
Separate spreadsheets from disparate sources
Variations from plan, scheduled and actual often not
caught during real time leading to monetary losses
Lack of real-time feedback and audit of changes

29
© 2010 Aspen Technology, Inc. All rights reserved |
57
Now: P&S Synergies
PIMS user sends targets to APS
Scheduler can plot planned, scheduled and actual
Scheduler can now see variances as they are occurring
and can correct as necessary
Real-Time Feedback between PIMS and APS
© 2010 Aspen Technology, Inc. All rights reserved |
58
CEPSA Evaluation and planning for increased margins
Challenge Solution Result Challenge
Analyze multiple crudes for multiple modes of operation
Increase frequency of assessing crudes and refinery performance
Ref: Angel Morales Morales, CEPSA, and Maria Jesus Guerra, AspenTech, “Process Simulation for Planning”, Hydrocarbon Engineering, Nov. 2006

30
© 2010 Aspen Technology, Inc. All rights reserved |
59
CEPSA Evaluation and planning for increased margins
aspenONE Process Engineering for Refining and Marketing with Aspen RefSYS
Improved workflow
− Generate yield and properties for all crudes and modes for LP
− Required crude blends
RefSYS model with Excel interface for planners and schedulers
− Predict yields and properties to help operators
− Assist schedulers and planners to improve model accuracy
Challenge Result Solution
Ref: Angel Morales Morales, CEPSA, and Maria Jesus Guerra, AspenTech, “Process Simulation for Planning”, Hydrocarbon Engineering, Nov. 2006
© 2010 Aspen Technology, Inc. All rights reserved |
60
CEPSA Evaluation and planning for increased margins
Better planning with higher confidence
Reduced gap in plan vs. actual performance
− Products available on spec and on time
− Less reprocessing off-spec products
Challenge Solution Result
Ref: Angel Morales Morales, CEPSA, and Maria Jesus Guerra, AspenTech, “Process Simulation for Planning”, Hydrocarbon Engineering, Nov. 2006
Ref: Angel Morales Morales, CEPSA, and Maria Jesus Guerra, AspenTech, “Process Simulation for Planning”, Hydrocarbon Engineering, Nov. 2006

31
© 2010 Aspen Technology, Inc. All rights reserved |
61
Technology Services
Global Professional Services Manufacturing and Supply Chain
aspenONE Solutions
Supply Chain
APC
MES
Modeling
Enterprise
Solution/Architectural Design
Process optimization
Decision support
Workflow automation
Data visualization
Database
Installation, Configuration & Commissioning
Post “Go Live” support
Supply Chain
Forecasting
Planning and Scheduling
Distribution
Advanced Process Control
Control strategy
Performance Monitoring
Sustainability
Production Management & Execution
Performance Management
KPIs
Batch & genealogy
Mass balance
Unlocking greater business value
© 2010 Aspen Technology, Inc. All rights reserved |
62
AspenTech’s Expertise in Process Industry Consulting & Project Delivery
Breadth of experience Business Process Analysis, Design and Modeling Implementation and Deployment Support and Enhancement Program Evaluation and Audit
Depth of experience 70% of AT consultants have more than 10 yrs industry
experience and a third have more than 20 years A third have been at AspenTech at least 10 years 60% have post-baccalaureate degrees in relevant fields
(chemical engineering, operations research, industrial engineering, etc.)
Team has almost 400 professional publications/ patents
Global delivery About 250 consultants worldwide APAC team around 55 and in rapid growth mode. Large teams
in Singapore, India and China. Strong emphasis on Project Management (Nearly all Project
Managers are PMP Certified) and Local delivery.

32
© 2010 Aspen Technology, Inc. All rights reserved |
63
Aspen PIMS™ Support
Software Maintenance and Support (SMS) Services - defined by the “Aspen Premier Support” package and covered by SMS contracts:
– Maintenance Services (Bug Fixes and Upgrades)
– Technical Support
Technical Hotline Support (phone/email/web)
Remote access & diagnostics
Online Support Center (Web Self Service Support)
Technical Knowledgebase
Local support resources with local language
– Chinese, Korean, English, Japanese, Indian, etc
Email Support : [email protected]
© 2010 Aspen Technology, Inc. All rights reserved |
64
Profit Improvement Plans
Sr. No.
Description
1 TGO has the highest value to the Hydrocrackers. Consider designing
Hydrocracker for maximum TGO processing.
2 CGO is most valuable as HCR feed stock. Next best routing is to ARDS Unit.
CGO to FCC is the lowest value.
3 Consider routing of CDU Heavy Diesel to Diesel Hydrotreater to the extent it
meets cold flow properties.
4 Heavy diesel should be recovered and routed to the DHTU than dropping it
in the CDU to AR and processing it in the ARDS unit.
5 Consider recovering iC5 from HCR LN & Light St. run Naphtha for MOGAS
blending.

33
© 2010 Aspen Technology, Inc. All rights reserved |
65
Analyze Investment Options
Sr. No. Description
1 New Refinery - configuration of Refinery and sizing of new units are
decided, as per results from PIMS.
2
Up gradation study of the existing Refinery for meeting future
specification – flow scheme (configuration) and sizing of new units are
fixed, as per results from PIMS.
3 Gasoline blending study - the selection of components / new units are decided, as per results from PIMS – Add DIP for IC5
4 Diesel blending study - the selection of components / new units are decided, as per results from PIMS - 2 DHT verses 1 DHT
5 Optimized production rate from the above can be utilized in project economics work sheet for calculating IRR & NPV values, which helps management to take decisions on Investment
© 2010 Aspen Technology, Inc. All rights reserved |
66
Recap - When to use PIMS ?
Determine constraints in streams disposal (qualities, units' capacities, etc.) and analyze the commercial impact of cost of constraints e.g. RON/MON, RVP, Benzene in Gasoline.
Analyze the cost of Quality Give away.
Analyze the impact of various modes of operation and cut point optimization.
Determine the available blend flexibility and constraints, impact of seasonality etc.
Fine-tune regularly and maintain an updated and accurate LP model for the Refining Complex and work with SCO.
Refining margin analysis - Short-term.
Determine minor hardware modifications for removal of process/ logistical constraints.
Concentrate on "Quick Wins" and push for their implementation.
Monitor the Market and cash in on possible short-term opportunities.
Use real time prices for accurate economics and analyze quick-wins.
Absolute results are less significant than deltas

34
© 2010 Aspen Technology, Inc. All rights reserved |
67
PIMS
SAYS
PIMS
Optimizes
&
You Say
© 2010 Aspen Technology, Inc. All rights reserved |
68
Planning and Scheduling Best Practices
Improve supply chain
visibility
Improve operational efficiency

35
© 2010 Aspen Technology, Inc. All rights reserved |
69
Refinery Scheduling Best Practices
Integrate planning & scheduling
Collaborative scheduling
Align refining & logistics
Monitor & maintain
model accuracy
Optimize product blending
© 2010 Aspen Technology, Inc. All rights reserved |
70
Why Refinery Scheduling
Gap between monthly plan and operations is narrowed
Scheduling determines ‘how and when’
Coordination among groups increases operating margins
Improved Refinery Margins
Advanced Process Control
Distributed Control System & Plant
Scheduling
Planning
Scheduling
Advanced Process Control
Distributed Control System & Plant
Scheduling bridges the gap between the monthly plan and daily operations.
– Planning determines ‘what’ to do (what crude to buy, what products to make)
– Scheduling determines ‘how and when’
Managing the daily operation of a refinery using spreadsheets is now widey recognised as inadequate.
Implementing a scheduling solution improves coordination, resulting in increased margins.

36
© 2010 Aspen Technology, Inc. All rights reserved |
71
Refinery Scheduling Key Activities
Synchronize Refinery & Logistics Schedules
Manage Refinery-Wide Schedule
Optimize Product Blending
Evaluate ‘What-If’ Scenarios
Monitor & Maintain Model Accuracy
© 2010 Aspen Technology, Inc. All rights reserved |
72
Challenge Challenge Challenge Impact
Manage Refinery-wide Schedule
Multiple schedulers using disconnected spreadsheets
No ‘models’ of process units
Unable to properly understand impact of changes
Many data inputs
Lost Margin
Solution
Multi-user scheduling system having refinery-
wide visibility
Improved collaboration and visibility
Lower Production costs, Higher Margin
Lack of coordination and visibility
Continuous ‘fire-fighting’
Instability in refinery operations
Excess safety stock
37
© 2010 Aspen Technology, Inc. All rights reserved |
73
Visibility into Refinery-wide Schedules
Single system for crude, process unit and product scheduling
All data stored in shared database
Icon that alerts Schedulers to changes made by others
Direct updates to share crude assays, process unit submodels, and blending correlations with planning model
Visibility into receipts, shipments, quality and inventories
Import of Planning targets to assist with schedule creation
© 2010 Aspen Technology, Inc. All rights reserved |
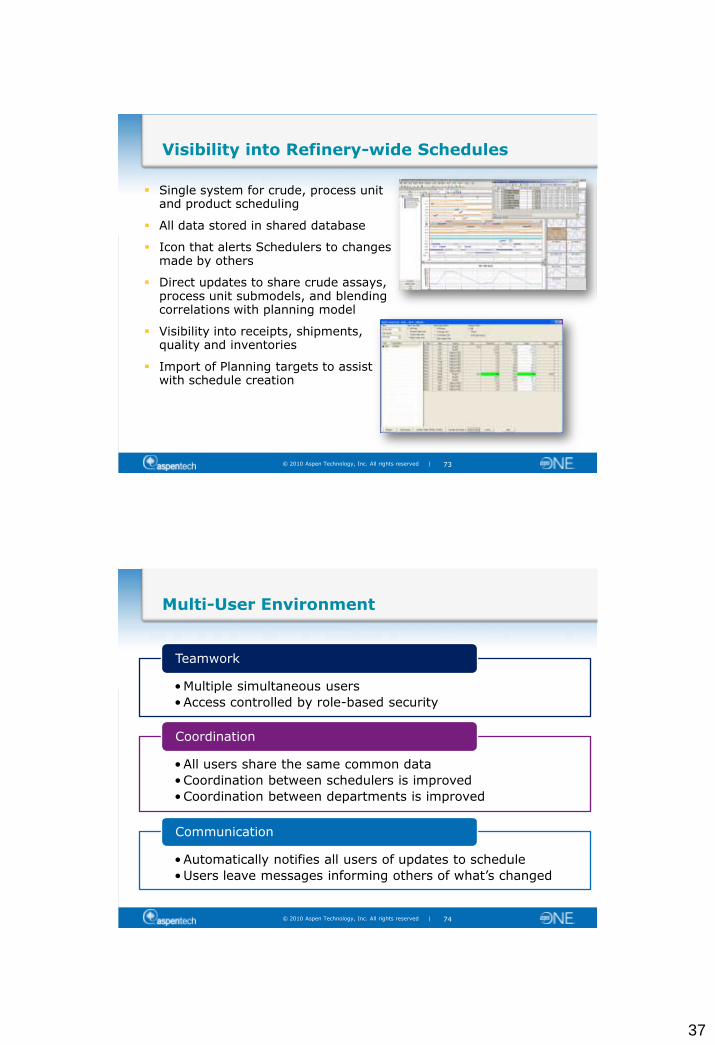
74
Multi-User Environment
•Multiple simultaneous users
•Access controlled by role-based security
Teamwork
•All users share the same common data
•Coordination between schedulers is improved
•Coordination between departments is improved
Coordination
•Automatically notifies all users of updates to schedule
•Users leave messages informing others of what’s changed
Communication

38
© 2010 Aspen Technology, Inc. All rights reserved |
75
Data Import and Audit
Automatically import inventory data and compare Actual vs. Scheduled highlighting potential problems.
Automatically import logistic events (receipts, shipments) and automatically see changes to the schedule.
© 2010 Aspen Technology, Inc. All rights reserved |
76
Challenge Challenge Challenge Impact
Synchronize Refinery & Logistics Schedules
Logistics schedule constantly changing
Unplanned outages and shutdowns
Difficult to coordinate refinery & logistics activities
High demurrage costs
Instability/slowdown of refinery operation
Friction between refinery & logistics
Lost Margin
Solution
Refinery scheduling system integrated with logistics information
Improved refinery & logistics coordination
Reduced demurrage & more stable refinery operation

39
© 2010 Aspen Technology, Inc. All rights reserved |
77
Synchronization of Shipment Data for Scheduling
Built-in interface for shipment events (crude & product)
Shares crude assays, process unit submodels, and blending correlations with planning model
Productized integration with IMOS
Visibility of schedule to logistics and other HQ groups
Scheduling
DB
Feedstock Scheduling Process Unit Scheduling Product Scheduling Feedstock Receipts
Product Shipments
Refinery
© 2010 Aspen Technology, Inc. All rights reserved |
79
Challenge Challenge Challenge Impact
Optimize Product Blending
Tighter and more complex specs
Difficult to determine most profitable recipes using spreadsheets
Sub-optimal blending (quality/recipe giveaway)
Frequent reblending
Shipments delayed
Lost Margin
Solution
Blending solution to meet product specs and maximize margins
Higher blending margins
Shipments made on-time

40
© 2010 Aspen Technology, Inc. All rights reserved |
80
Blend Visualization over time
Aspen Petroleum Scheduler is fully integrated with MBO sharing a common database and GUI
Sophisticated, non-linear optimizer for all blends across the scheduling horizon
Uses event based time, not fixed time
Easy to use interface for optimizing blends
Applicable to gasoline, diesel & fuel oil
Built-in interface for on-line blend controllers
Tank heels and re-blending capability
Batch and in-line blending capability
© 2010 Aspen Technology, Inc. All rights reserved |
81
Solves Tighter and Complex Specifications
Aspen Blend Model Library (ABML) can handle a variety of property calculations
• Index Blending (Component Volume)
•RVP, Viscosity, Flash, Pour, Cloud Index Calculations
•Calculated from other Properties
•Road Octane, Cetane Index Derived
Calculations
•Calculated from multiple properties
•Distillation, VOC, RBOB, CARBOB Complex
Calculations
Users can also defined their own blending correlations in the User Blend Model Library (UBML)

41
© 2010 Aspen Technology, Inc. All rights reserved |
82
Planning, Scheduling & Blending
Aspen PIMS
Refinery Planning
Aspen Petroleum Scheduler
Refinery Scheduling
Aspen MBO
Blending and Scheduling
Unit Activities and Planned Recipes
Rundowns, Qualities, and Shipments
Optimized Blend Recipes
Integrated with Petroleum Scheduler and provides event based multi-blend optimization for blending
of products.
Can be used for gasoline, diesel and fuel oil blending
© 2010 Aspen Technology, Inc. All rights reserved |
83
Challenge Solution Results
ExxonMobil Optimize Gasoline Blending
Challenge
For three refineries, determine which refinery should supply which demand center(s) and the amount of that demand.
Some demand centers can be supplied by more than one refinery. Others supplied by a single refinery.
Gasoline components can be potentially be bought, sold, or transferred between refineries.

42
© 2010 Aspen Technology, Inc. All rights reserved |
84
Challenge Solution Results
ExxonMobil Optimize Gasoline Blending
Challenge
Use M-PIMS for gasoline circuit blend planning for time period “M+1”.
Use MBO Site Blend Planning for “M” time horizon.
Use MBO Blend Scheduling for week time horizon.
Perform validations between what PIMS and MBO models “predicted” versus “actuals” so future model predictions will be more accurate.
© 2010 Aspen Technology, Inc. All rights reserved |
85
Challenge Solution Results
ExxonMobil Optimize Gasoline Blending
Challenge
Consistency checks between the refinery planning (PIMS) and scheduling (MBO) models narrow the gap between plan vs. Actual, improving planning accuracy.
This allows better crude purchase decisions and determination of what gasoline grades should be made at which refinery to supply given demand centers.
Ref: “Gasoline Blending and Validation”, Frank Kelly, ExxonMobil ; AspenTech Global
Conference Washington, DC, May 2011

43
© 2010 Aspen Technology, Inc. All rights reserved |
86
Refinery Scheduling Best Practices
Integration between
Planning & Scheduling
Collaborative scheduling
Align refining & logistics
Monitor & maintain
Model Accuracy
Optimize product blending
© 2010 Aspen Technology, Inc. All rights reserved |
87
Why Aspen Petroleum Scheduler
Advanced scheduling to meet demands
with higher margins
Improved coordination among schedules
Proactive decision making rather than constant ‘fire-fighting’
Reduced gap between plan & actual operation
Benefits typically ~$0.19 per barrel of crude throughput

44
© 2010 Aspen Technology, Inc. All rights reserved |
88
Business Case studies
Case studies for improved scheduling and blending
across 12 refineries
© 2010 Aspen Technology, Inc. All rights reserved |
89
Aspen Petroleum Scheduler Benefits
Fewer production disruptions and extended production runs
Integrated planning and scheduling for increased accuracy and better decisions
Reduction of working capital requirements due to inventory reductions
Increased yields through better unit scheduling
Reduced stock-outs and distressed purchases through improved visibility
Improved Refinery
Efficiency

45
© 2010 Aspen Technology, Inc. All rights reserved |
90
Key Product Features
Aspen Petroleum Scheduler
Schedules that balance equipment constraints, feedstock availability and product lifting requirements for greater accuracy
Integration for better synchronization between refinery and distribution
A 5% reduction in inventory results in a one time savings of
$8M of working capital for a 200,000 BPD refinery
© 2010 Aspen Technology, Inc. All rights reserved |
91
Integration of Planning and Scheduling Data
Use real tower crude assay data
– Rigorous process simulation technology of Aspen HYSYS Petroleum Refining (REFSYS)
Support various modeling techniques for process submodels
– Vector or Delta base model
– Non-linear modeling
– External model by process engineering technology
Standard Blending Correlations (ABML)
Share process submodel with Scheduling
Planning & Scheduling Model Accuracy (Model Accuracy capabilities in Petroleum Scheduler can indicate need to update models)

46
© 2010 Aspen Technology, Inc. All rights reserved |
92
Improve Supply Chain Visibility
Challenge Challenge Challenge Impact
Performed in silos
Spreadsheets can’t handle complexity and business constraints
Difficult to align supply and demand profitably
Procure less optimal crudes
Produce less profitable products
Solution
Buy the right crude and sell product more profitably
Greater visibility and agility
yield higher margin
Lost Margin
© 2010 Aspen Technology, Inc. All rights reserved |
93
Challenge Solution Results
Shell Improve Integrated Petroleum Supply Chain
Challenge
Creation and standardization of demand forecast business process integrated with Collaborative Demand Management tool.
Forecasting tool with:
State of the art statistical forecasting algorithms.
Flexible hierarchy with fast aggregation and disaggregation
EO
Demand
Mgmt
(DM)
Sales to
Customer
(ERP)
EO
Primary
Distribution
Planning
(DPO)
Optimised
Plan
RPS
Refinery
Planning
(PIMS)
Pricing
engine
Product
Prices
EO
Primary
Distribution
Scheduling
RPS
Refinery
Scheduling
(Orion)
Latest
Estimate
Constraints
&
Contracts
Actual
Sales
(Demand)
Crude
Prices
Transport
Plan
Demand
Scheduled
Liftings
Refinery
Production
Scheduled
Stocks
Integration is
KEY

47
© 2010 Aspen Technology, Inc. All rights reserved |
94
Challenge Solution Results
Shell Improve Integrated Petroleum Supply Chain
Challenge
Different demand forecasts across different departments (marketing, finance, supply, distribution).
Many local forecasting processes or no process at all.
Different forecasting tools used in different countries.
Desire to have one global process using one standard global tool with one volume forecast across the supply chain.
Demand Focal Point
Pricing Engine
Regional Price
Strategists
Collaborative
Forecasting
Demand Cell
Owners
Handshake PIMS
Refinery
Planners
Consolidated Demand
Forward
Prices
Call on
Refinery
Envelope
Plan
DPO
Envelope
Planner
Production
Scheduling
Tool
Schedulers Latest Estimate
© 2010 Aspen Technology, Inc. All rights reserved |
95
Challenge Solution Results
Shell Improve Integrated Petroleum Supply Chain
Challenge
Demand planners liked the changes:
More accurate visibility of months 2/3 in future to aid refinery PIMS planning decisions. Couldn’t see beyond first month previously.
Can visualize where sales are deviating from forecast.
More timely and accurate lifting plans from refinery Supply schedulers.
Ref: “Demand Forecasting & Management - Collaborative Demand Management Improves
Shell’s Integrated Supply Chain”, Jeannie Gardner, Shell: AspenTech Global Conference
Washington, DC, May 2011
“The commissioning of the EO Demand
Forecasting Tool was used as a
springboard to strongly drive methods to
sustainably improve the overall demand
forecasting result. The outcome has
exceeded expectations in the timeframe
with an absolute demand forecasting
result now consistently exceeds previous
limits”

48
© 2010 Aspen Technology, Inc. All rights reserved |
96
Total Petroleum New scheduling system yields higher margins
Each refinery had their own scheduling model and database
Need to integrate 12 separate models into one standard model
Convert older version of scheduling software to reduce IT costs
Challenge Solution Result Challenge
© 2010 Aspen Technology, Inc. All rights reserved |
97
Total Petroleum New scheduling system yields higher margins
Upgrade to Aspen Petroleum Scheduler
Standardize on one extensive Aspen Petroleum Scheduler refinery model
Standardize interfaces, databases and plug-ins
Create a data warehouse
Challenge Solution Result

49
© 2010 Aspen Technology, Inc. All rights reserved |
98
Total Petroleum New scheduling system yields higher margins
Reduce IT costs significantly with one model versus twelve
Reduce training costs and time with common model and user interface
Expect additional benefits as users learn the new system
“The project is expected to significantly reduce our IT support and user training costs. Additionally, the schedulers will be using one standard model utilizing the latest Orion version.”
Magali Peysson Total Petroleum
Ref: “Management of the Migration to a New Orion”, Magali Peysson, Total; PIMS User Conference, Seattle, WA, November 6, 2008
Challenge Solution Result
© 2010 Aspen Technology, Inc. All rights reserved |
99
Thank You for your attention