ASPE R ESEARCH B RIEF · ASPE Research Brief 2 Page ASPE Office of Health Policy October 2018 Key...
44
2019 HEALTH PLAN CHOICE AND PREMIUMS IN HEALTHCARE.GOV STATES October 26, 2018 Note: Average premiums in this brief may differ from data released by the Centers for Medicare & Medicaid Services (CMS) on October 11, 2018. 1 These discrepancies are a result of two methodological differences: 1) average premiums presented in this brief are weighted by county- level plan selections as of the end of the Open Enrollment period (using PY18 plan selections to calculate PY19 average premiums) while the October 11, 2018 released data for PY 18 and PY 19 were both weighted by county-level plan selections as of May 31, 2018; and 2) average premiums presented in this brief include the portion of the premium attributable to coverage in addition to essential health benefits, while the October 11, 2018 released average premium data were only the portion of the premium attributable to essential health benefits. This brief presents information on qualified health plans (QHPs) available in states that rely on the HealthCare.gov eligibility and enrollment platform (HealthCare.gov states), including estimates for issuer participation, consumer options, average premiums, and subsidies in the upcoming open enrollment period (OEP), and trends since the first OEP. National estimates and summary tables are presented in each section of the text. State-specific estimates are in the Appendix. Unless otherwise specified, all estimates reflect all states using the HealthCare.gov platform for each given year. 1 https://www.cms.gov/newsroom/press-releases/premiums-federally-facilitated-exchanges-drop-2019 Department of Health and Human Services Office of the Assistant Secretary for Planning and Evaluation hhtp:aspe.hhs.gov ASPE R ESEARCH B RIEF
Transcript of ASPE R ESEARCH B RIEF · ASPE Research Brief 2 Page ASPE Office of Health Policy October 2018 Key...

2019 HEALTH PLAN CHOICE AND PREMIUMS
IN HEALTHCARE.GOV STATES
October 26, 2018
Note: Average premiums in this brief may differ from data released by the Centers for Medicare
& Medicaid Services (CMS) on October 11, 2018.1 These discrepancies are a result of two
methodological differences: 1) average premiums presented in this brief are weighted by county-
level plan selections as of the end of the Open Enrollment period (using PY18 plan selections to
calculate PY19 average premiums) while the October 11, 2018 released data for PY 18 and
PY 19 were both weighted by county-level plan selections as of May 31, 2018; and 2) average
premiums presented in this brief include the portion of the premium attributable to coverage in
addition to essential health benefits, while the October 11, 2018 released average premium data
were only the portion of the premium attributable to essential health benefits.
This brief presents information on qualified health plans (QHPs) available in states that rely on
the HealthCare.gov eligibility and enrollment platform (HealthCare.gov states), including
estimates for issuer participation, consumer options, average premiums, and subsidies in the
upcoming open enrollment period (OEP), and trends since the first OEP. National estimates and
summary tables are presented in each section of the text. State-specific estimates are in the
Appendix. Unless otherwise specified, all estimates reflect all states using the HealthCare.gov
platform for each given year.
1 https://www.cms.gov/newsroom/press-releases/premiums-federally-facilitated-exchanges-drop-2019
Department of Health and Human Services
Office of the Assistant Secretary for Planning and Evaluation
hhtp:aspe.hhs.gov
ASPE
R ESEARCH
B RIEF
ASPE Research Brief Page 2
ASPE Office of Health Policy October 2018
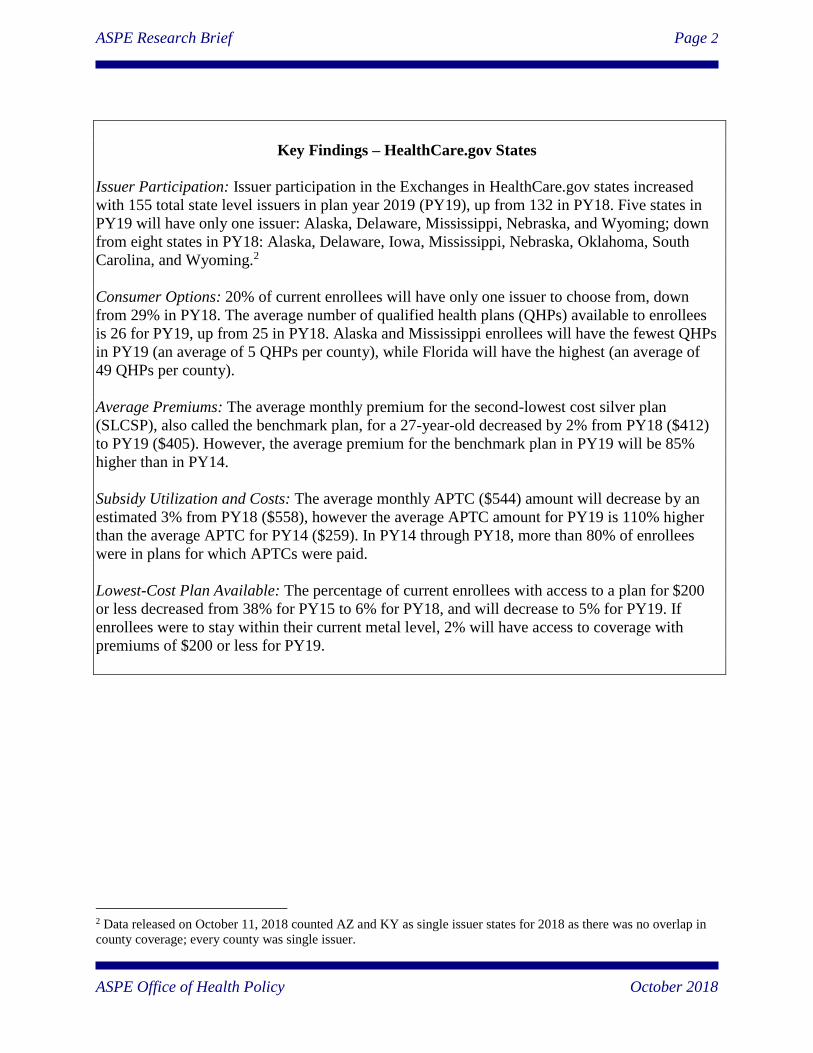
Key Findings – HealthCare.gov States
Issuer Participation: Issuer participation in the Exchanges in HealthCare.gov states increased
with 155 total state level issuers in plan year 2019 (PY19), up from 132 in PY18. Five states in
PY19 will have only one issuer: Alaska, Delaware, Mississippi, Nebraska, and Wyoming; down
from eight states in PY18: Alaska, Delaware, Iowa, Mississippi, Nebraska, Oklahoma, South
Carolina, and Wyoming.2
Consumer Options: 20% of current enrollees will have only one issuer to choose from, down
from 29% in PY18. The average number of qualified health plans (QHPs) available to enrollees
is 26 for PY19, up from 25 in PY18. Alaska and Mississippi enrollees will have the fewest QHPs
in PY19 (an average of 5 QHPs per county), while Florida will have the highest (an average of
49 QHPs per county).
Average Premiums: The average monthly premium for the second-lowest cost silver plan
(SLCSP), also called the benchmark plan, for a 27-year-old decreased by 2% from PY18 ($412)
to PY19 ($405). However, the average premium for the benchmark plan in PY19 will be 85%
higher than in PY14.
Subsidy Utilization and Costs: The average monthly APTC ($544) amount will decrease by an
estimated 3% from PY18 ($558), however the average APTC amount for PY19 is 110% higher
than the average APTC for PY14 ($259). In PY14 through PY18, more than 80% of enrollees
were in plans for which APTCs were paid.
Lowest-Cost Plan Available: The percentage of current enrollees with access to a plan for $200
or less decreased from 38% for PY15 to 6% for PY18, and will decrease to 5% for PY19. If
enrollees were to stay within their current metal level, 2% will have access to coverage with
premiums of $200 or less for PY19.
2 Data released on October 11, 2018 counted AZ and KY as single issuer states for 2018 as there was no overlap in
county coverage; every county was single issuer.
ASPE Research Brief Page 3
ASPE Office of Health Policy October 2018
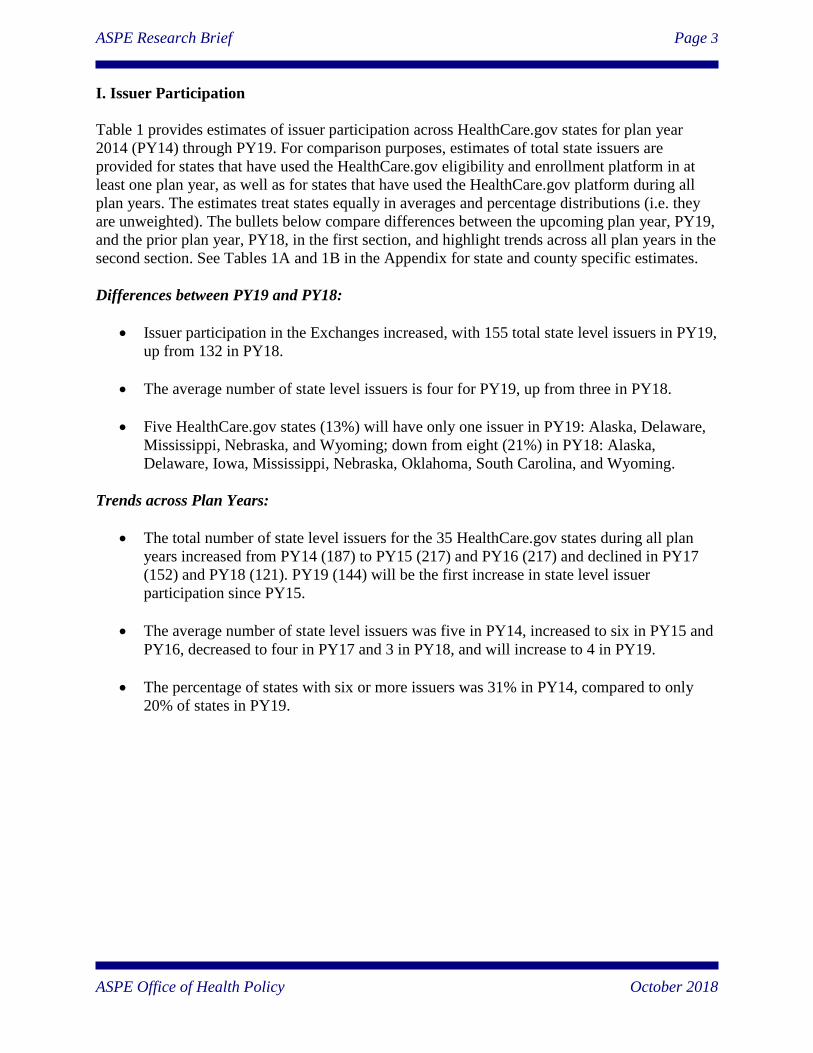
I. Issuer Participation
Table 1 provides estimates of issuer participation across HealthCare.gov states for plan year
2014 (PY14) through PY19. For comparison purposes, estimates of total state issuers are
provided for states that have used the HealthCare.gov eligibility and enrollment platform in at
least one plan year, as well as for states that have used the HealthCare.gov platform during all
plan years. The estimates treat states equally in averages and percentage distributions (i.e. they
are unweighted). The bullets below compare differences between the upcoming plan year, PY19,
and the prior plan year, PY18, in the first section, and highlight trends across all plan years in the
second section. See Tables 1A and 1B in the Appendix for state and county specific estimates.
Differences between PY19 and PY18:
Issuer participation in the Exchanges increased, with 155 total state level issuers in PY19,
up from 132 in PY18.
The average number of state level issuers is four for PY19, up from three in PY18.
Five HealthCare.gov states (13%) will have only one issuer in PY19: Alaska, Delaware,
Mississippi, Nebraska, and Wyoming; down from eight (21%) in PY18: Alaska,
Delaware, Iowa, Mississippi, Nebraska, Oklahoma, South Carolina, and Wyoming.
Trends across Plan Years:
The total number of state level issuers for the 35 HealthCare.gov states during all plan
years increased from PY14 (187) to PY15 (217) and PY16 (217) and declined in PY17
(152) and PY18 (121). PY19 (144) will be the first increase in state level issuer
participation since PY15.
The average number of state level issuers was five in PY14, increased to six in PY15 and
PY16, decreased to four in PY17 and 3 in PY18, and will increase to 4 in PY19.
The percentage of states with six or more issuers was 31% in PY14, compared to only
20% of states in PY19.
ASPE Research Brief Page 4
ASPE Office of Health Policy October 2018
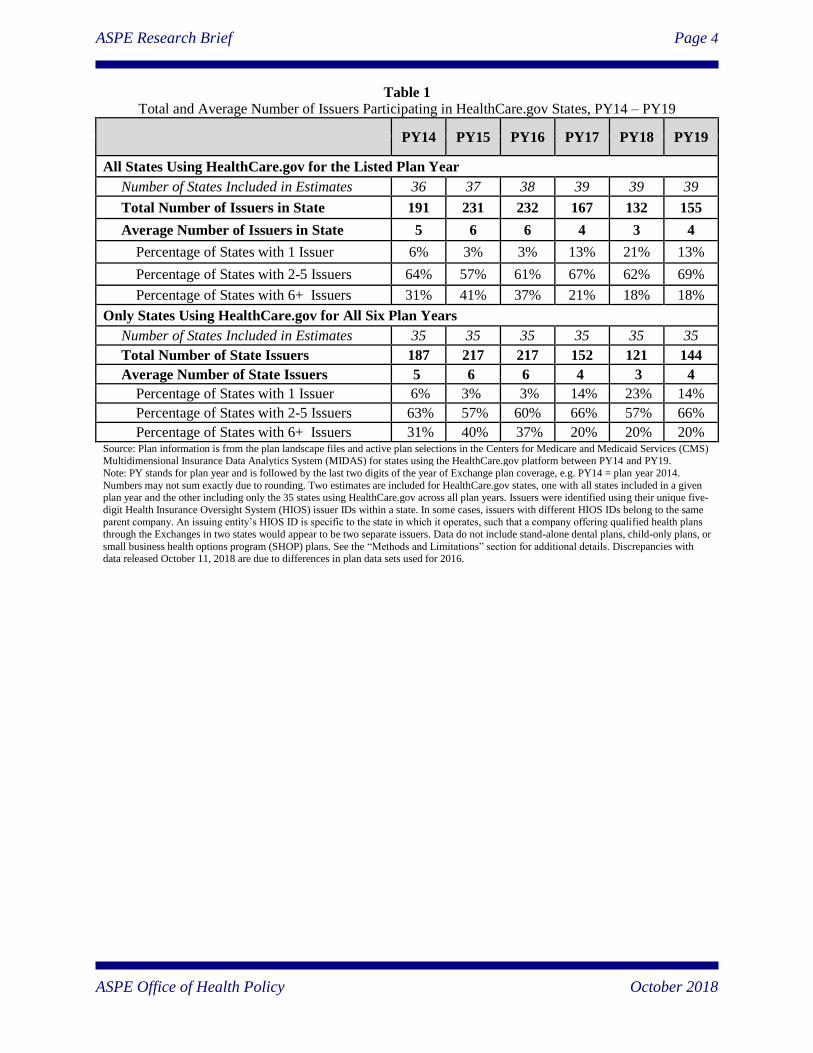
Table 1
Total and Average Number of Issuers Participating in HealthCare.gov States, PY14 – PY19
PY14 PY15 PY16 PY17 PY18 PY19
All States Using HealthCare.gov for the Listed Plan Year
Number of States Included in Estimates 36 37 38 39 39 39
Total Number of Issuers in State 191 231 232 167 132 155
Average Number of Issuers in State 5 6 6 4 3 4
Percentage of States with 1 Issuer 6% 3% 3% 13% 21% 13%
Percentage of States with 2-5 Issuers 64% 57% 61% 67% 62% 69%
Percentage of States with 6+ Issuers 31% 41% 37% 21% 18% 18%
Only States Using HealthCare.gov for All Six Plan Years
Number of States Included in Estimates 35 35 35 35 35 35
Total Number of State Issuers 187 217 217 152 121 144
Average Number of State Issuers 5 6 6 4 3 4
Percentage of States with 1 Issuer 6% 3% 3% 14% 23% 14%
Percentage of States with 2-5 Issuers 63% 57% 60% 66% 57% 66%
Percentage of States with 6+ Issuers 31% 40% 37% 20% 20% 20% Source: Plan information is from the plan landscape files and active plan selections in the Centers for Medicare and Medicaid Services (CMS) Multidimensional Insurance Data Analytics System (MIDAS) for states using the HealthCare.gov platform between PY14 and PY19.
Note: PY stands for plan year and is followed by the last two digits of the year of Exchange plan coverage, e.g. PY14 = plan year 2014.
Numbers may not sum exactly due to rounding. Two estimates are included for HealthCare.gov states, one with all states included in a given plan year and the other including only the 35 states using HealthCare.gov across all plan years. Issuers were identified using their unique five-
digit Health Insurance Oversight System (HIOS) issuer IDs within a state. In some cases, issuers with different HIOS IDs belong to the same parent company. An issuing entity’s HIOS ID is specific to the state in which it operates, such that a company offering qualified health plans
through the Exchanges in two states would appear to be two separate issuers. Data do not include stand-alone dental plans, child-only plans, or
small business health options program (SHOP) plans. See the “Methods and Limitations” section for additional details. Discrepancies with data released October 11, 2018 are due to differences in plan data sets used for 2016.
ASPE Research Brief Page 5
ASPE Office of Health Policy October 2018
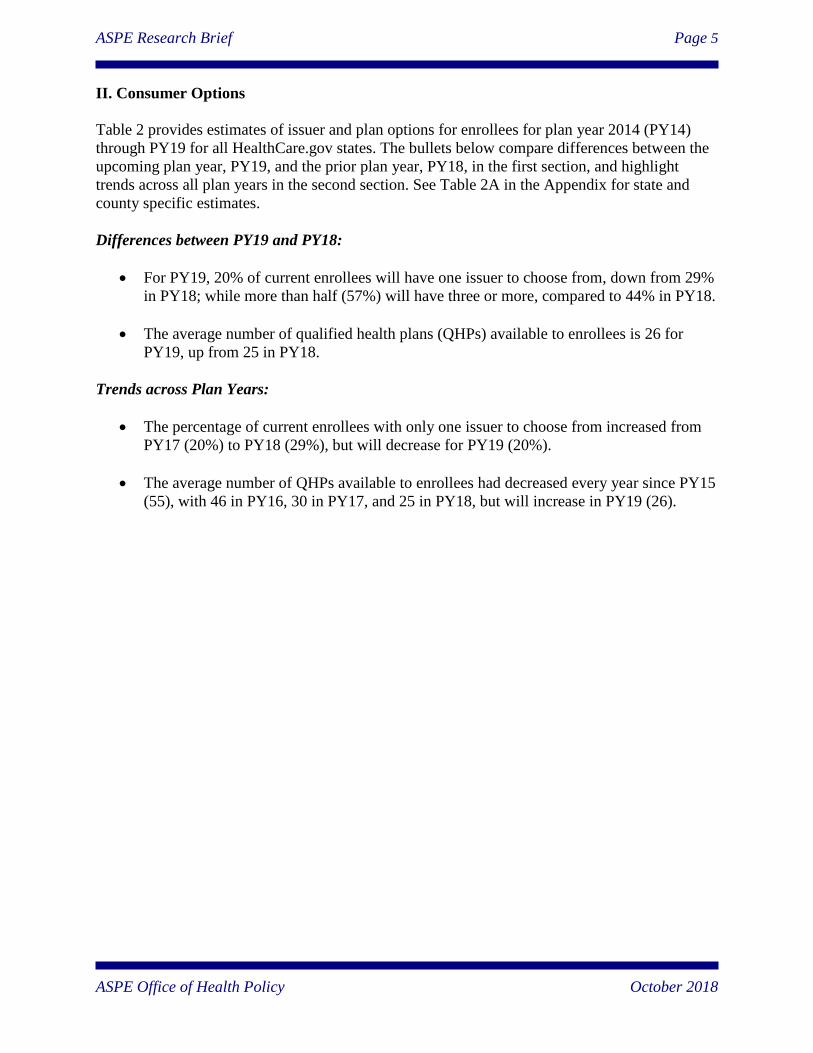
II. Consumer Options
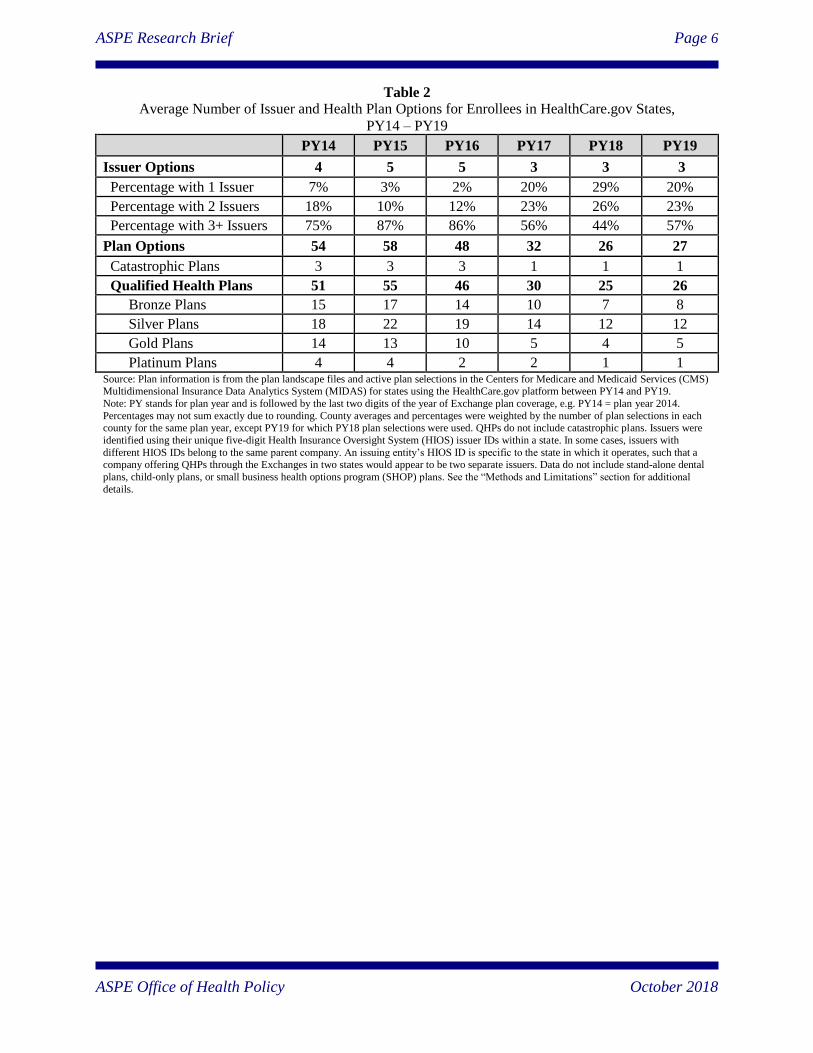
Table 2 provides estimates of issuer and plan options for enrollees for plan year 2014 (PY14)
through PY19 for all HealthCare.gov states. The bullets below compare differences between the
upcoming plan year, PY19, and the prior plan year, PY18, in the first section, and highlight
trends across all plan years in the second section. See Table 2A in the Appendix for state and
county specific estimates.
Differences between PY19 and PY18:
For PY19, 20% of current enrollees will have one issuer to choose from, down from 29%
in PY18; while more than half (57%) will have three or more, compared to 44% in PY18.
The average number of qualified health plans (QHPs) available to enrollees is 26 for
PY19, up from 25 in PY18.
Trends across Plan Years:
The percentage of current enrollees with only one issuer to choose from increased from
PY17 (20%) to PY18 (29%), but will decrease for PY19 (20%).
The average number of QHPs available to enrollees had decreased every year since PY15
(55), with 46 in PY16, 30 in PY17, and 25 in PY18, but will increase in PY19 (26).
ASPE Research Brief Page 6
ASPE Office of Health Policy October 2018
Table 2
Average Number of Issuer and Health Plan Options for Enrollees in HealthCare.gov States,
PY14 – PY19
PY14 PY15 PY16 PY17 PY18 PY19
Issuer Options 4 5 5 3 3 3
Percentage with 1 Issuer 7% 3% 2% 20% 29% 20%
Percentage with 2 Issuers 18% 10% 12% 23% 26% 23%
Percentage with 3+ Issuers 75% 87% 86% 56% 44% 57%
Plan Options 54 58 48 32 26 27
Catastrophic Plans 3 3 3 1 1 1
Qualified Health Plans 51 55 46 30 25 26
Bronze Plans 15 17 14 10 7 8
Silver Plans 18 22 19 14 12 12
Gold Plans 14 13 10 5 4 5
Platinum Plans 4 4 2 2 1 1 Source: Plan information is from the plan landscape files and active plan selections in the Centers for Medicare and Medicaid Services (CMS) Multidimensional Insurance Data Analytics System (MIDAS) for states using the HealthCare.gov platform between PY14 and PY19.
Note: PY stands for plan year and is followed by the last two digits of the year of Exchange plan coverage, e.g. PY14 = plan year 2014.
Percentages may not sum exactly due to rounding. County averages and percentages were weighted by the number of plan selections in each county for the same plan year, except PY19 for which PY18 plan selections were used. QHPs do not include catastrophic plans. Issuers were
identified using their unique five-digit Health Insurance Oversight System (HIOS) issuer IDs within a state. In some cases, issuers with
different HIOS IDs belong to the same parent company. An issuing entity’s HIOS ID is specific to the state in which it operates, such that a company offering QHPs through the Exchanges in two states would appear to be two separate issuers. Data do not include stand-alone dental
plans, child-only plans, or small business health options program (SHOP) plans. See the “Methods and Limitations” section for additional
details.
ASPE Research Brief Page 7
ASPE Office of Health Policy October 2018
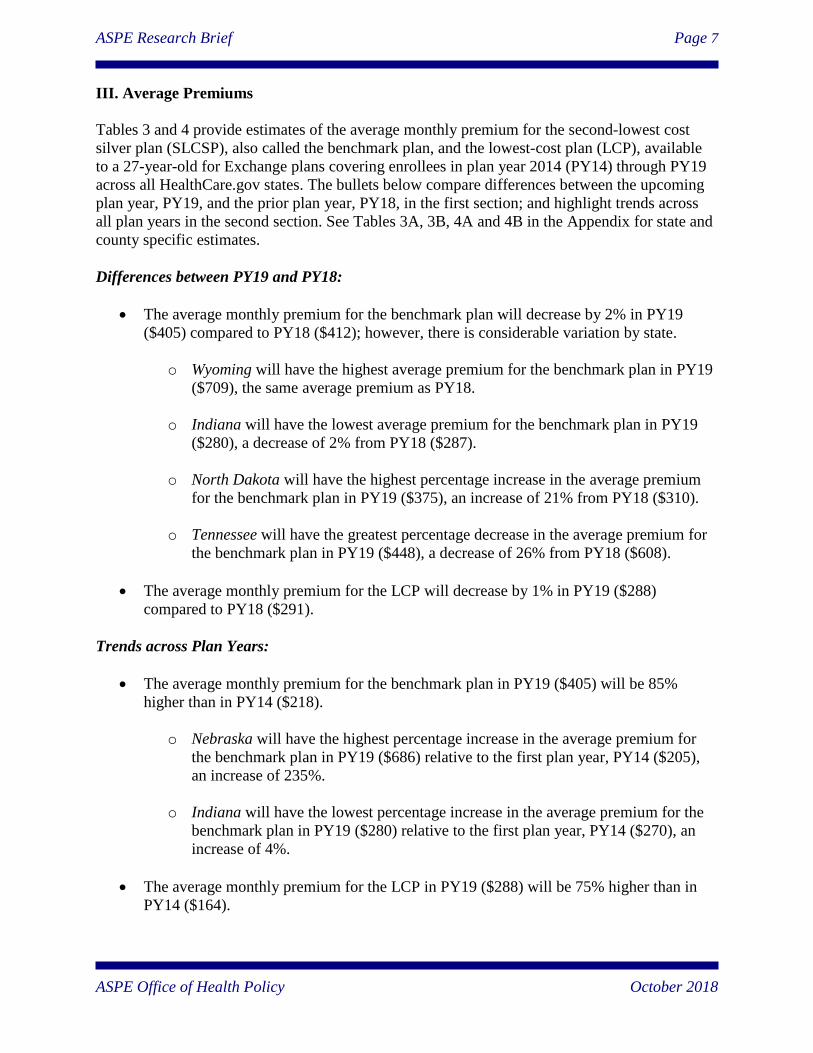
III. Average Premiums
Tables 3 and 4 provide estimates of the average monthly premium for the second-lowest cost
silver plan (SLCSP), also called the benchmark plan, and the lowest-cost plan (LCP), available
to a 27-year-old for Exchange plans covering enrollees in plan year 2014 (PY14) through PY19
across all HealthCare.gov states. The bullets below compare differences between the upcoming
plan year, PY19, and the prior plan year, PY18, in the first section; and highlight trends across
all plan years in the second section. See Tables 3A, 3B, 4A and 4B in the Appendix for state and
county specific estimates.
Differences between PY19 and PY18:
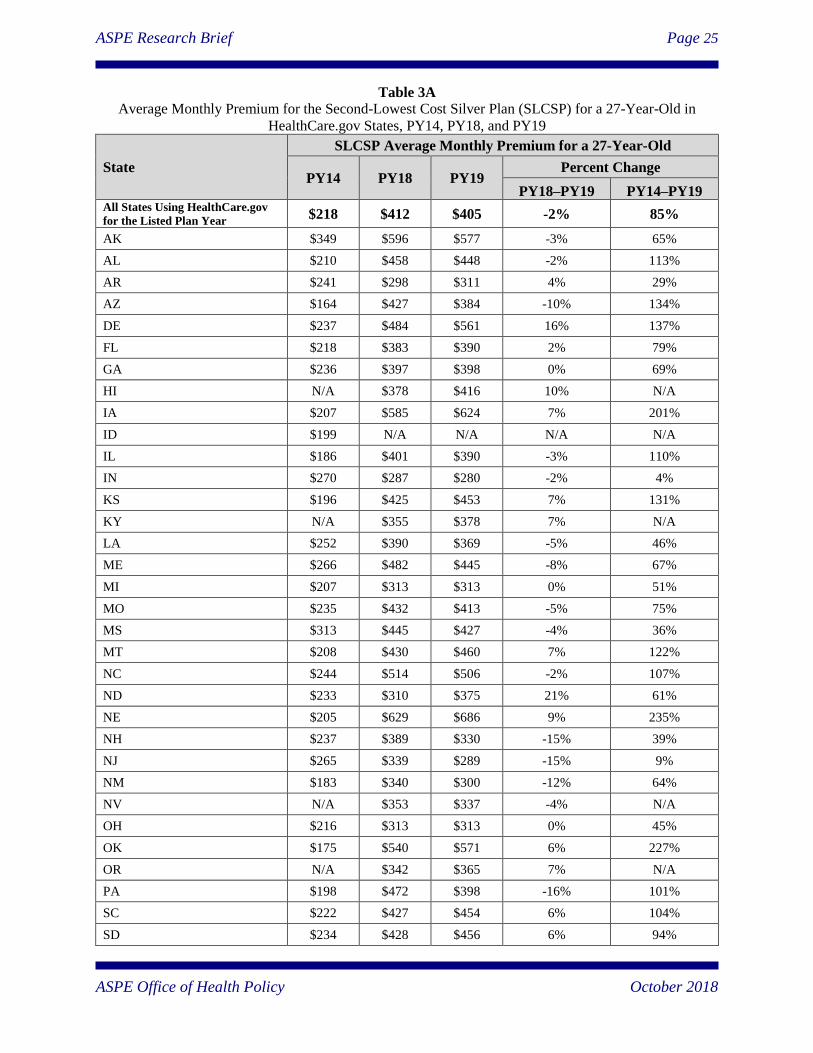
The average monthly premium for the benchmark plan will decrease by 2% in PY19
($405) compared to PY18 ($412); however, there is considerable variation by state.
o Wyoming will have the highest average premium for the benchmark plan in PY19
($709), the same average premium as PY18.
o Indiana will have the lowest average premium for the benchmark plan in PY19
($280), a decrease of 2% from PY18 ($287).
o North Dakota will have the highest percentage increase in the average premium
for the benchmark plan in PY19 ($375), an increase of 21% from PY18 ($310).
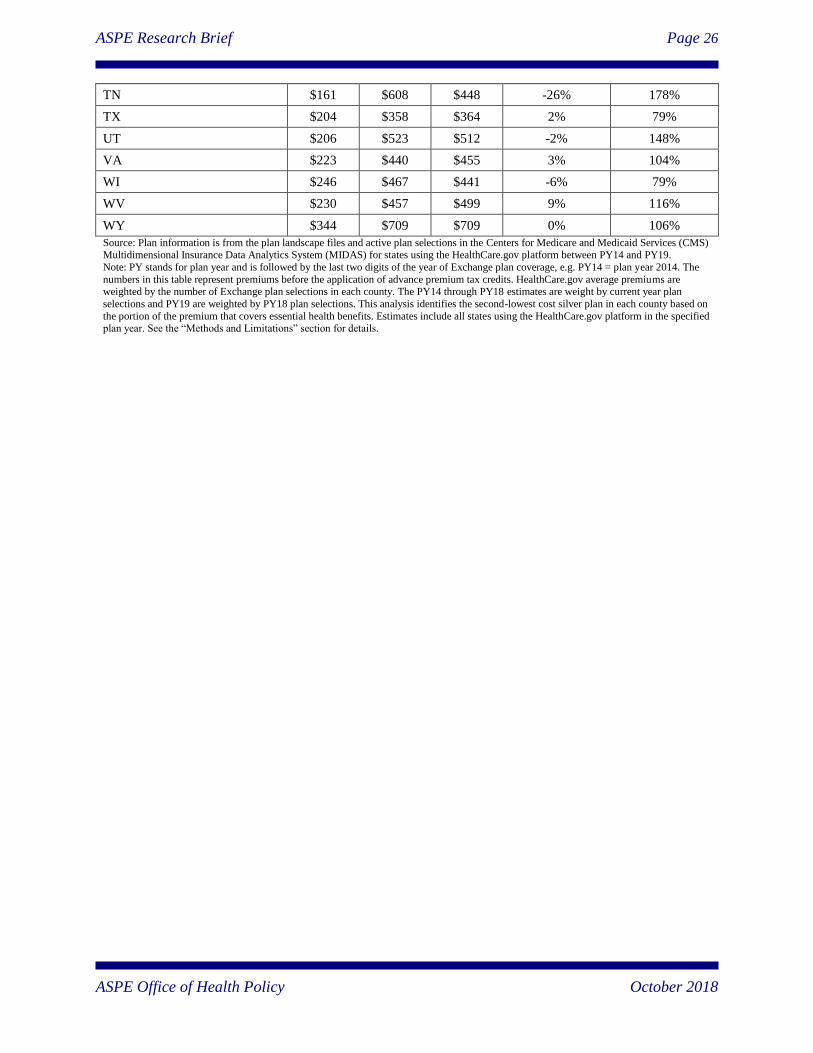
o Tennessee will have the greatest percentage decrease in the average premium for
the benchmark plan in PY19 ($448), a decrease of 26% from PY18 ($608).
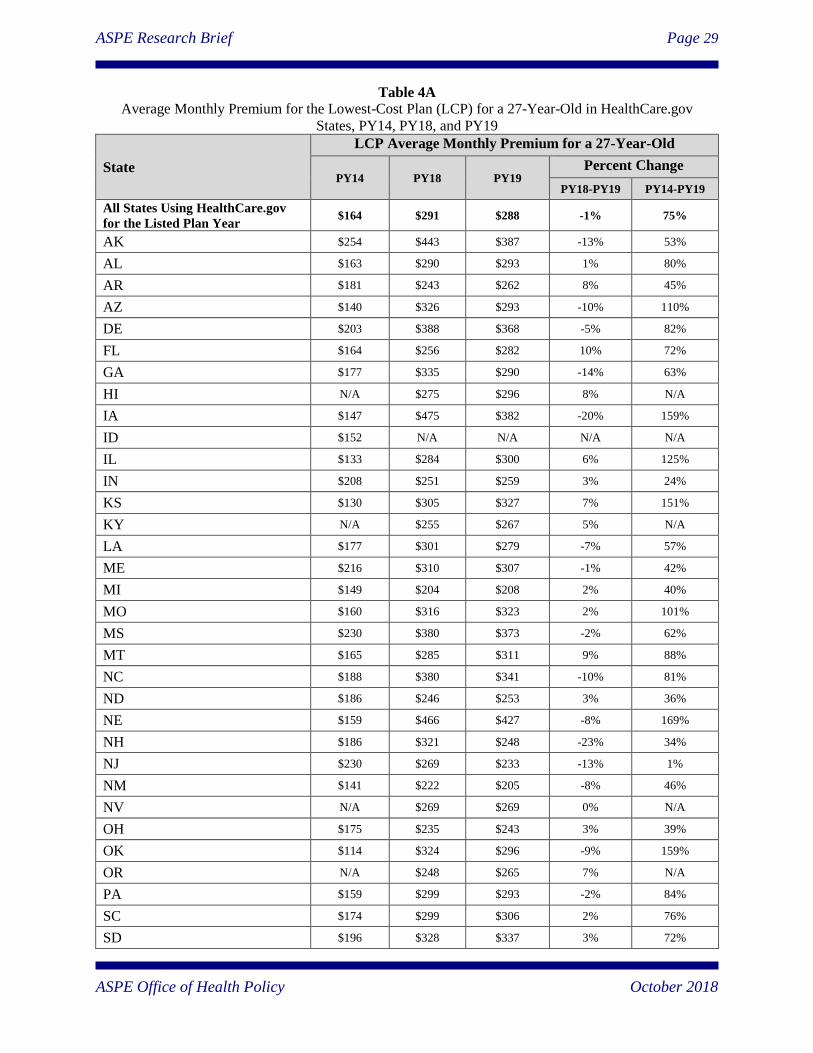
The average monthly premium for the LCP will decrease by 1% in PY19 ($288)
compared to PY18 ($291).
Trends across Plan Years:
The average monthly premium for the benchmark plan in PY19 ($405) will be 85%
higher than in PY14 ($218).
o Nebraska will have the highest percentage increase in the average premium for
the benchmark plan in PY19 ($686) relative to the first plan year, PY14 ($205),
an increase of 235%.
o Indiana will have the lowest percentage increase in the average premium for the
benchmark plan in PY19 ($280) relative to the first plan year, PY14 ($270), an
increase of 4%.
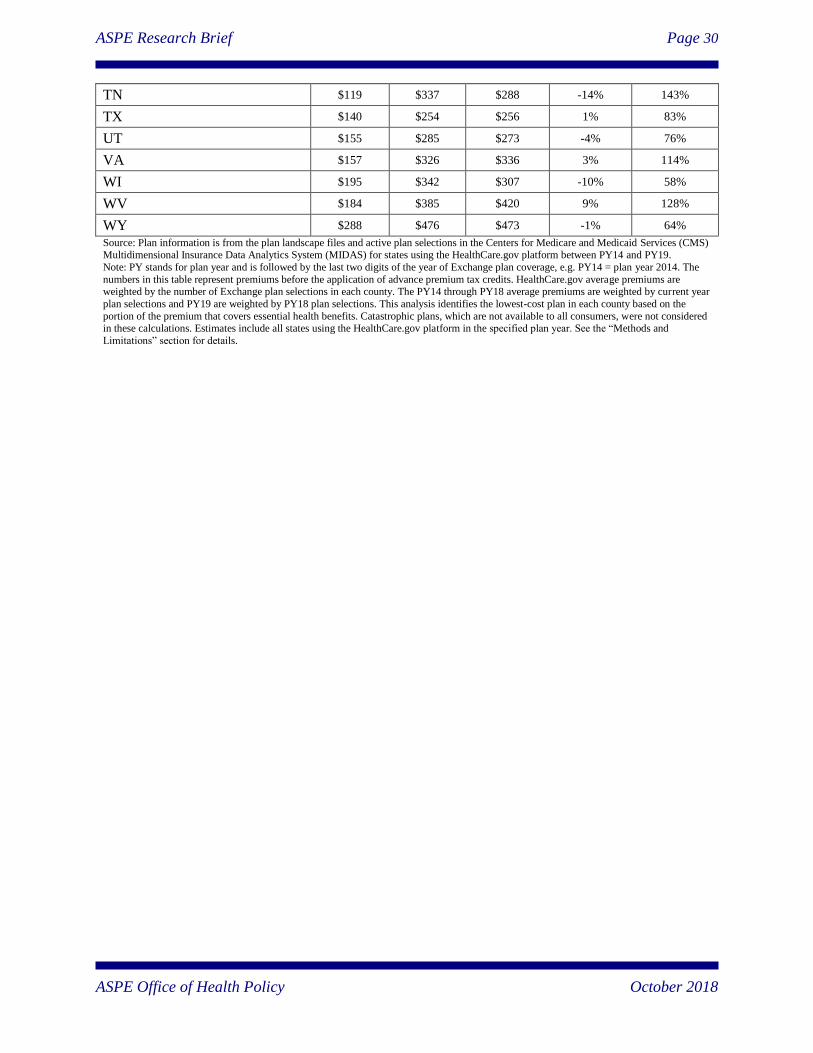
The average monthly premium for the LCP in PY19 ($288) will be 75% higher than in
PY14 ($164).
ASPE Research Brief Page 8
ASPE Office of Health Policy October 2018
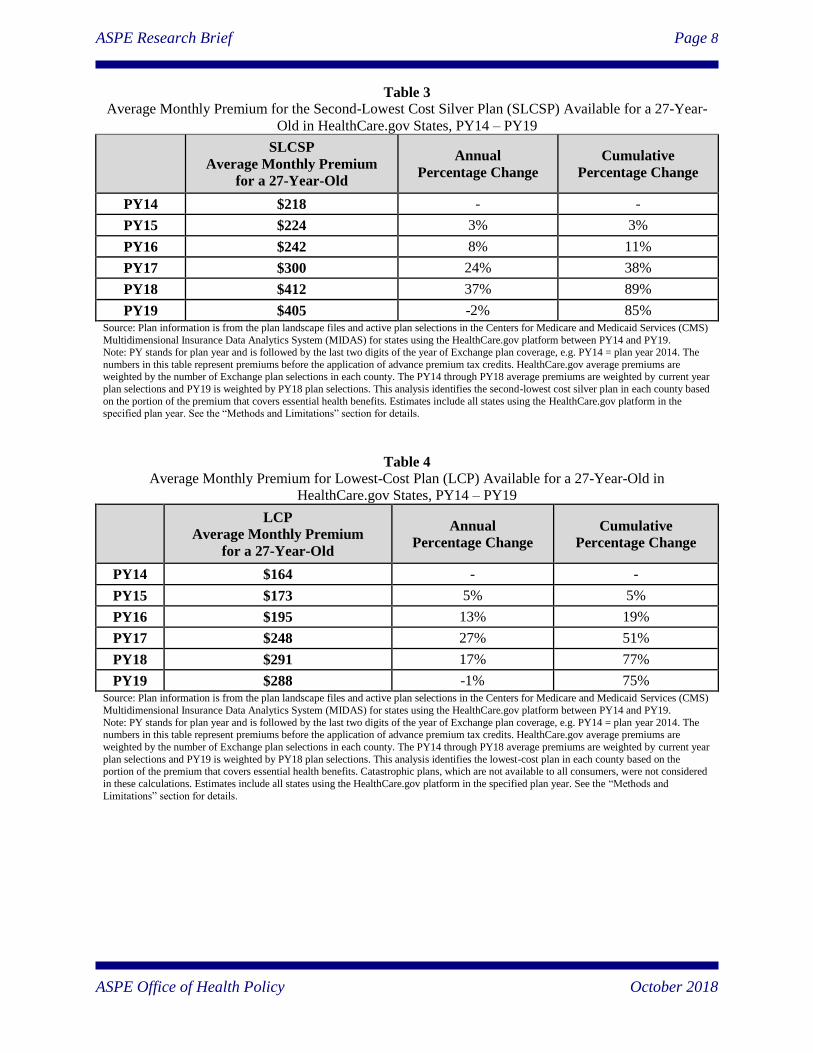
Table 3
Average Monthly Premium for the Second-Lowest Cost Silver Plan (SLCSP) Available for a 27-Year-
Old in HealthCare.gov States, PY14 – PY19
SLCSP
Average Monthly Premium
for a 27-Year-Old
Annual
Percentage Change
Cumulative
Percentage Change
PY14 $218 - -
PY15 $224 3% 3%
PY16 $242 8% 11%
PY17 $300 24% 38%
PY18 $412 37% 89%
PY19 $405 -2% 85% Source: Plan information is from the plan landscape files and active plan selections in the Centers for Medicare and Medicaid Services (CMS)
Multidimensional Insurance Data Analytics System (MIDAS) for states using the HealthCare.gov platform between PY14 and PY19.
Note: PY stands for plan year and is followed by the last two digits of the year of Exchange plan coverage, e.g. PY14 = plan year 2014. The
numbers in this table represent premiums before the application of advance premium tax credits. HealthCare.gov average premiums are weighted by the number of Exchange plan selections in each county. The PY14 through PY18 average premiums are weighted by current year
plan selections and PY19 is weighted by PY18 plan selections. This analysis identifies the second-lowest cost silver plan in each county based
on the portion of the premium that covers essential health benefits. Estimates include all states using the HealthCare.gov platform in the specified plan year. See the “Methods and Limitations” section for details.
Table 4
Average Monthly Premium for Lowest-Cost Plan (LCP) Available for a 27-Year-Old in
HealthCare.gov States, PY14 – PY19
LCP
Average Monthly Premium
for a 27-Year-Old
Annual
Percentage Change
Cumulative
Percentage Change
PY14 $164 - -
PY15 $173 5% 5%
PY16 $195 13% 19%
PY17 $248 27% 51%
PY18 $291 17% 77%
PY19 $288 -1% 75% Source: Plan information is from the plan landscape files and active plan selections in the Centers for Medicare and Medicaid Services (CMS)
Multidimensional Insurance Data Analytics System (MIDAS) for states using the HealthCare.gov platform between PY14 and PY19.
Note: PY stands for plan year and is followed by the last two digits of the year of Exchange plan coverage, e.g. PY14 = plan year 2014. The numbers in this table represent premiums before the application of advance premium tax credits. HealthCare.gov average premiums are
weighted by the number of Exchange plan selections in each county. The PY14 through PY18 average premiums are weighted by current year
plan selections and PY19 is weighted by PY18 plan selections. This analysis identifies the lowest-cost plan in each county based on the portion of the premium that covers essential health benefits. Catastrophic plans, which are not available to all consumers, were not considered
in these calculations. Estimates include all states using the HealthCare.gov platform in the specified plan year. See the “Methods and
Limitations” section for details.
ASPE Research Brief Page 9
ASPE Office of Health Policy October 2018
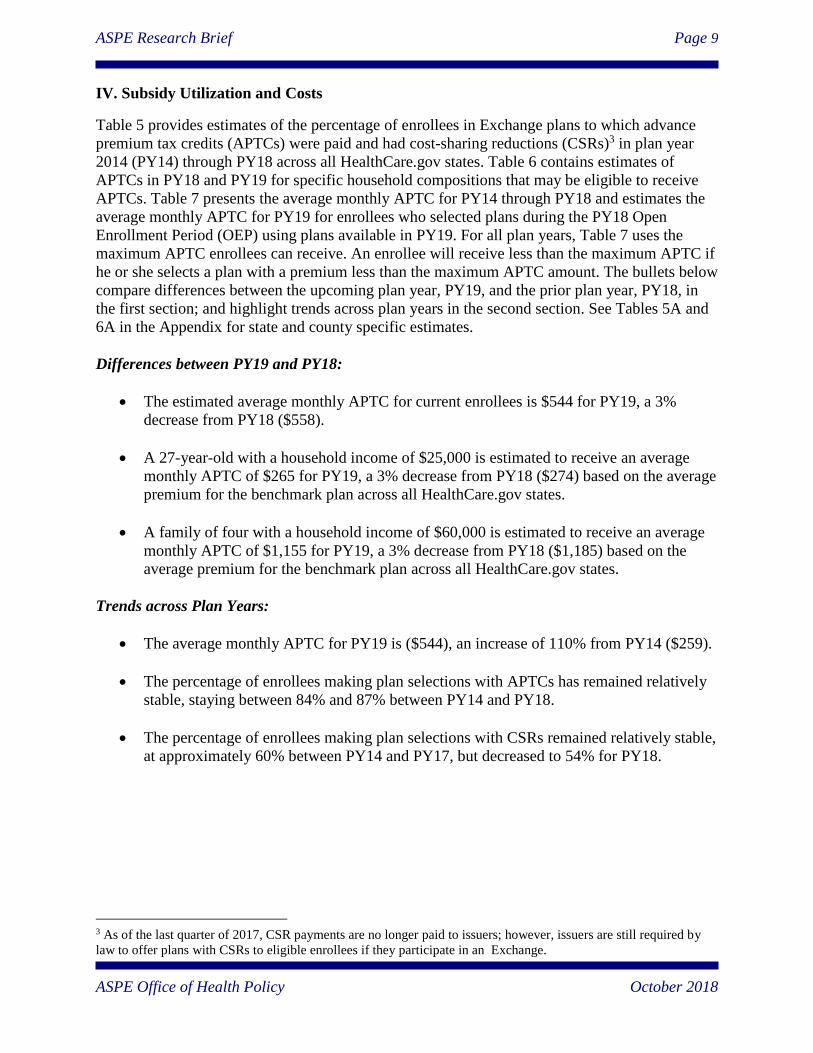
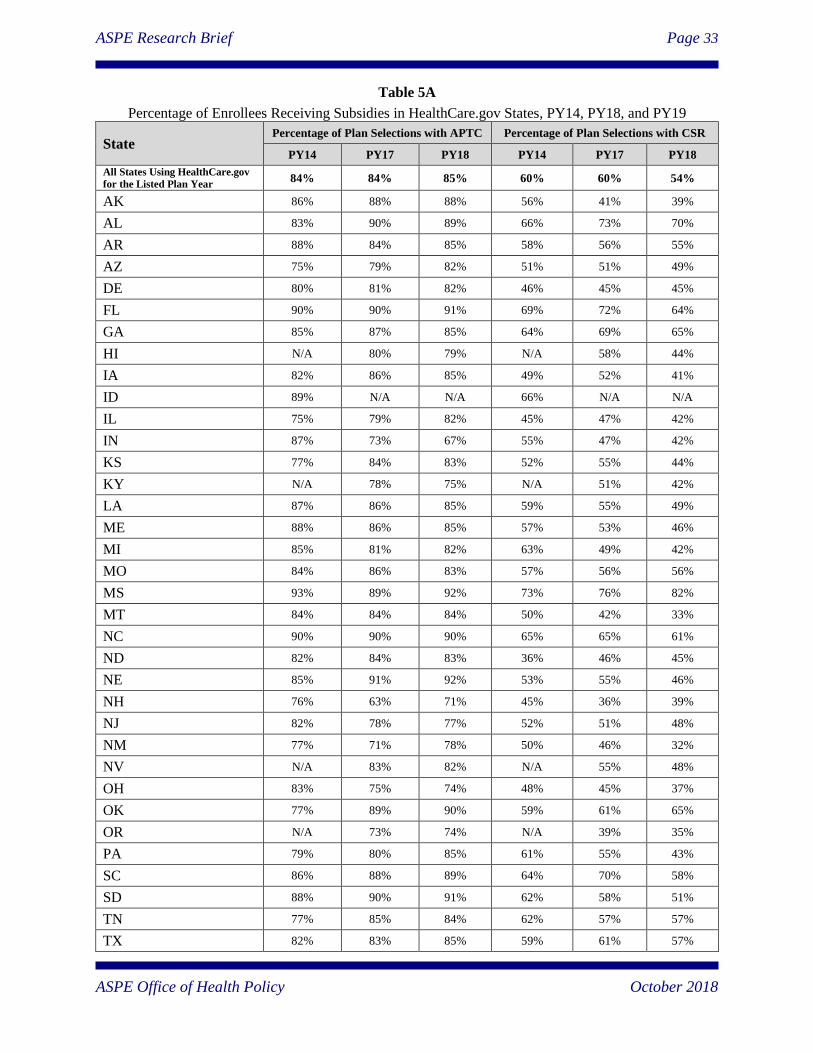
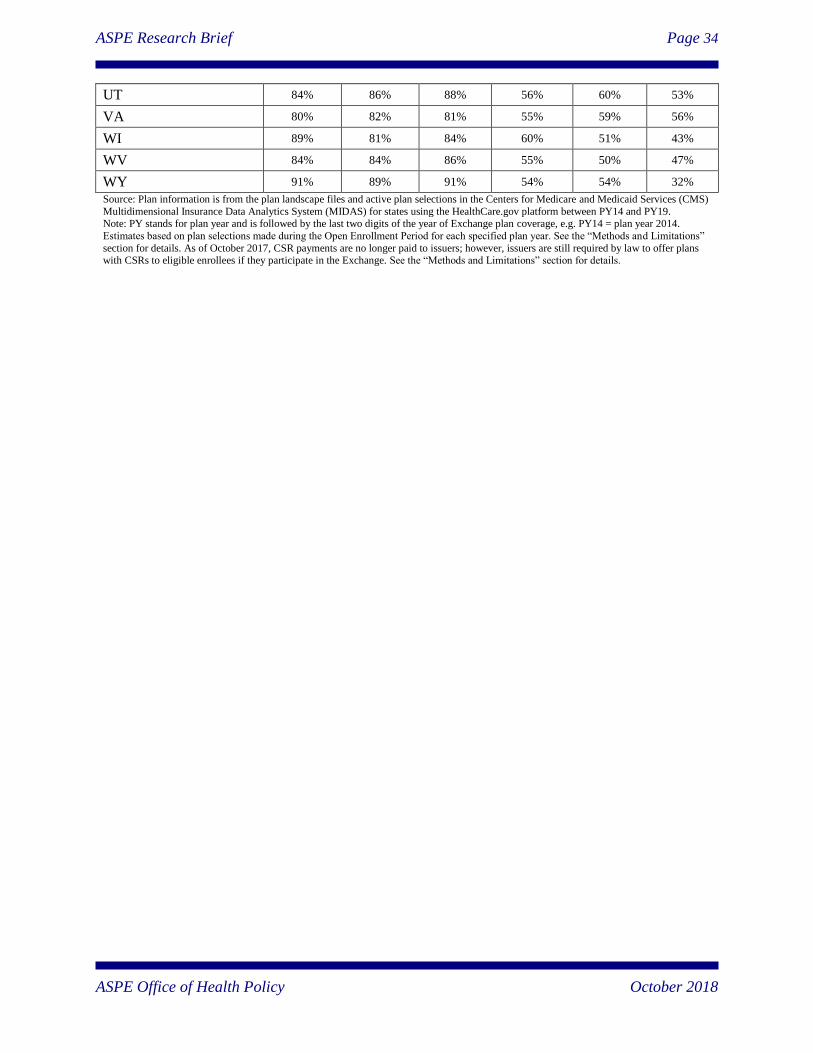
IV. Subsidy Utilization and Costs
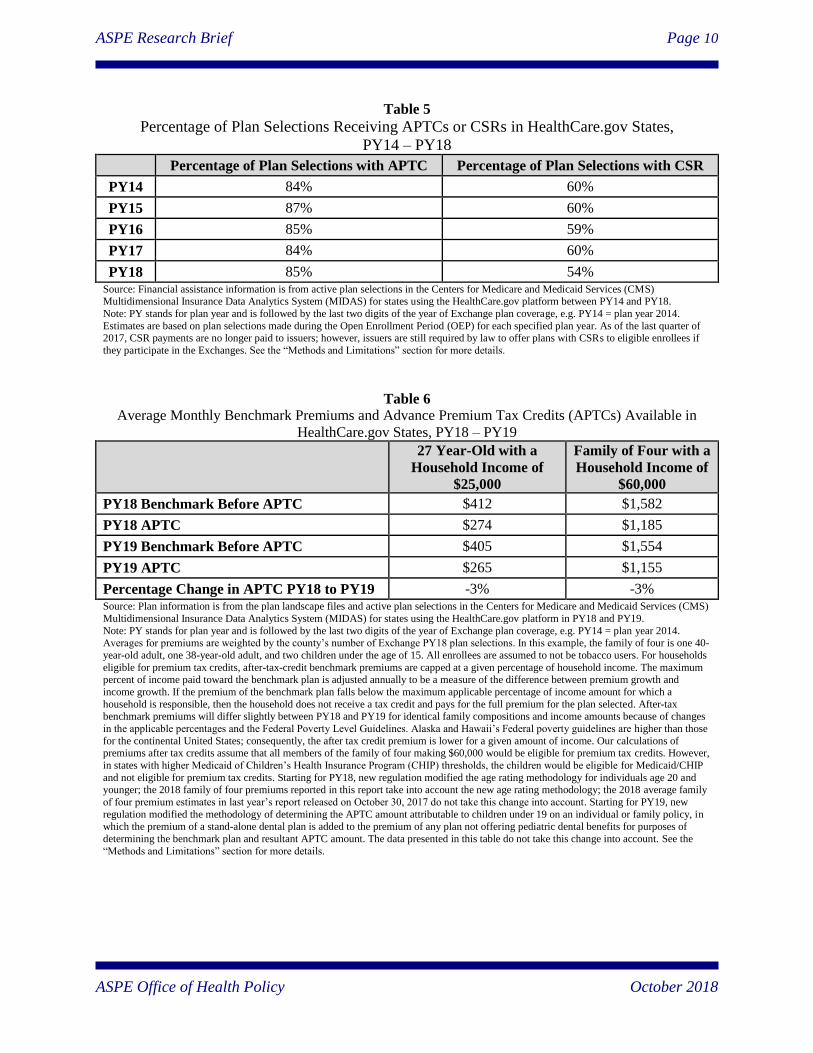
Table 5 provides estimates of the percentage of enrollees in Exchange plans to which advance
premium tax credits (APTCs) were paid and had cost-sharing reductions (CSRs)3 in plan year
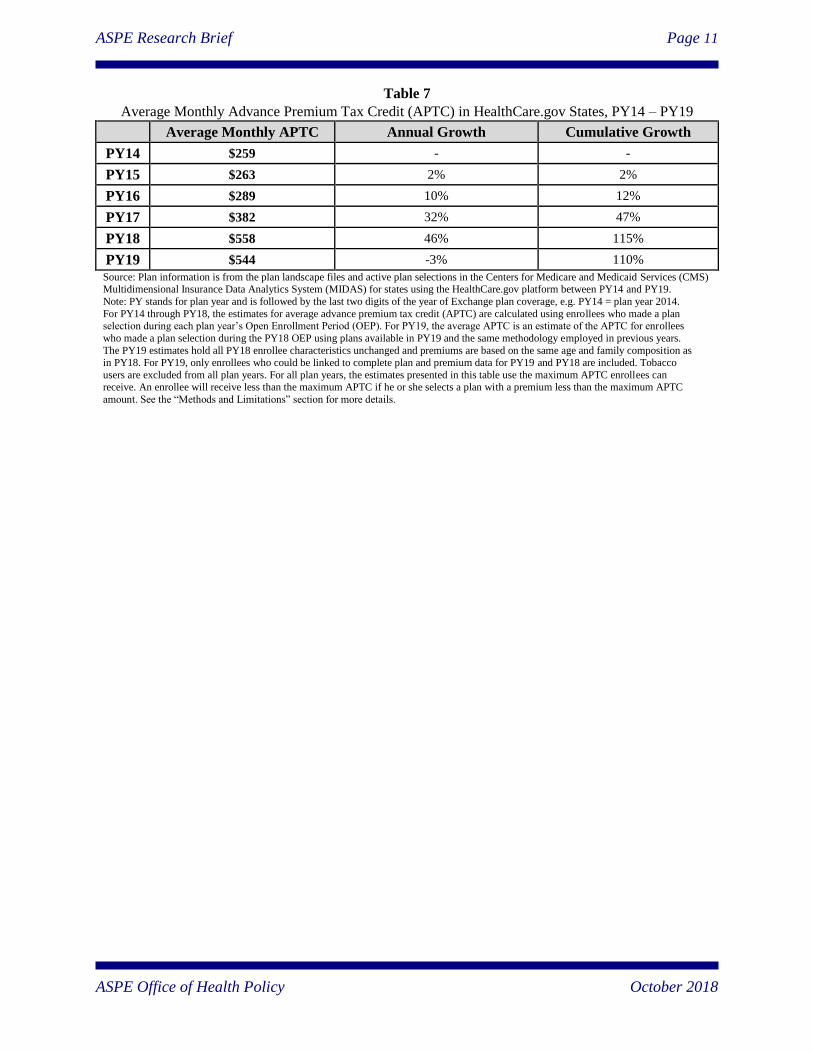
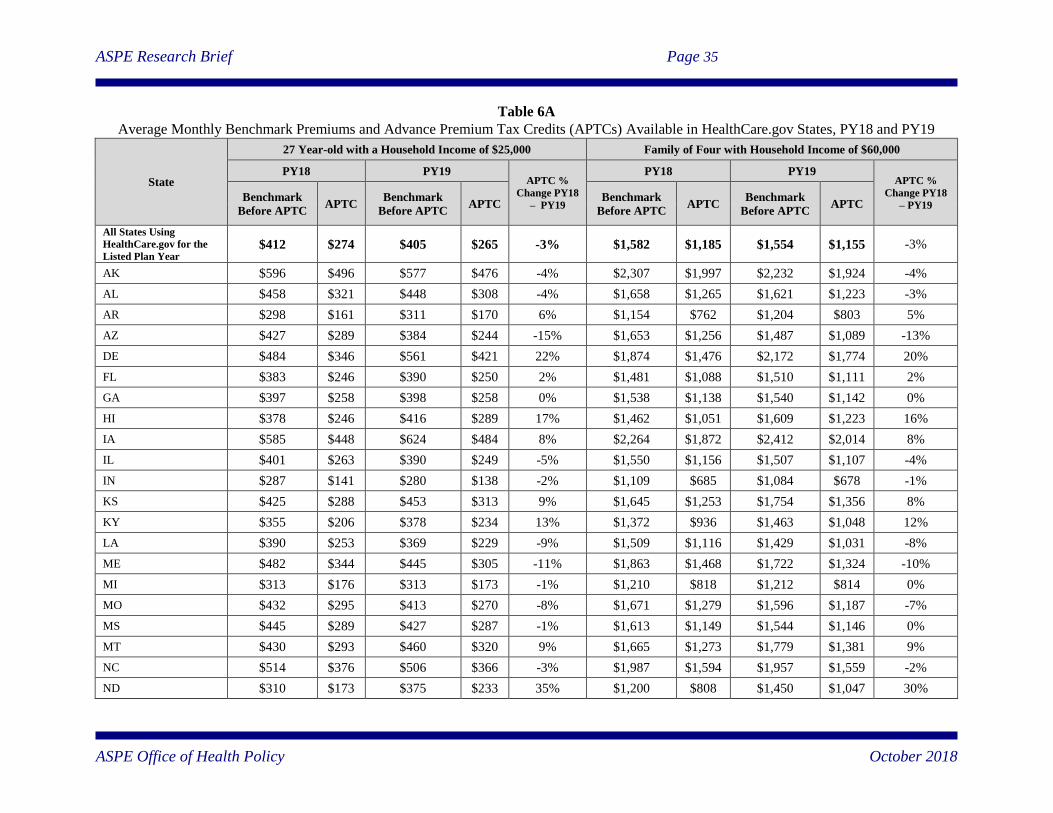
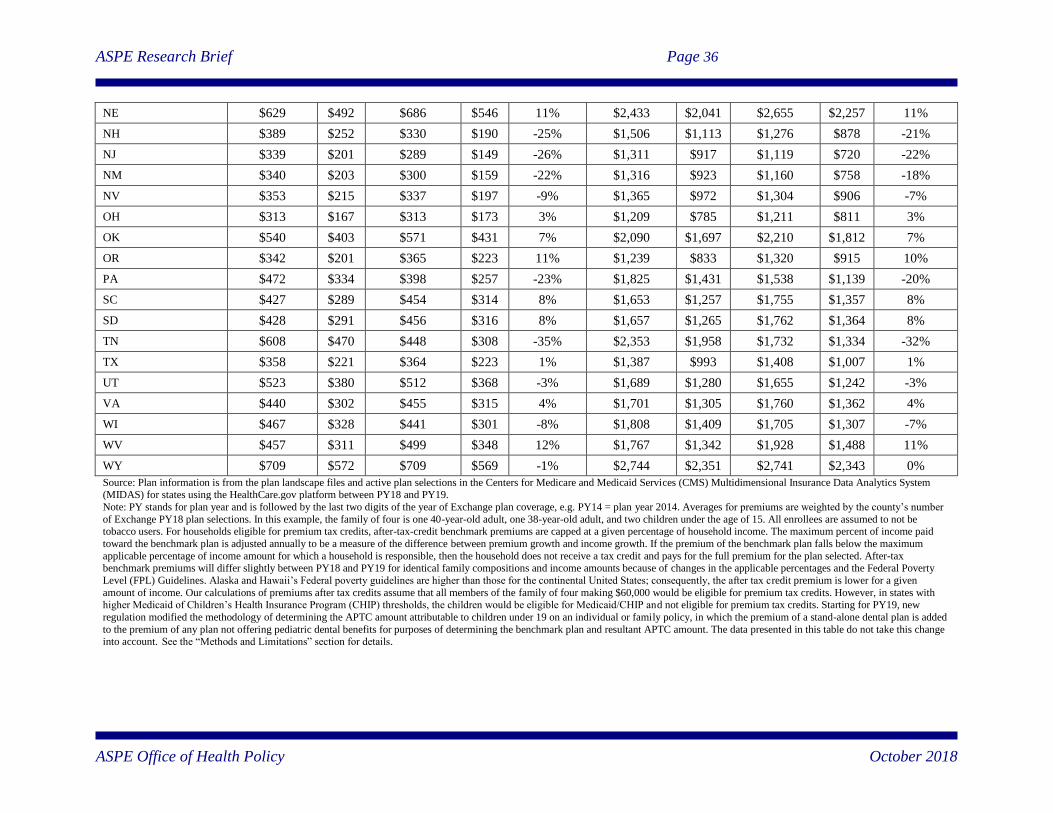
2014 (PY14) through PY18 across all HealthCare.gov states. Table 6 contains estimates of
APTCs in PY18 and PY19 for specific household compositions that may be eligible to receive
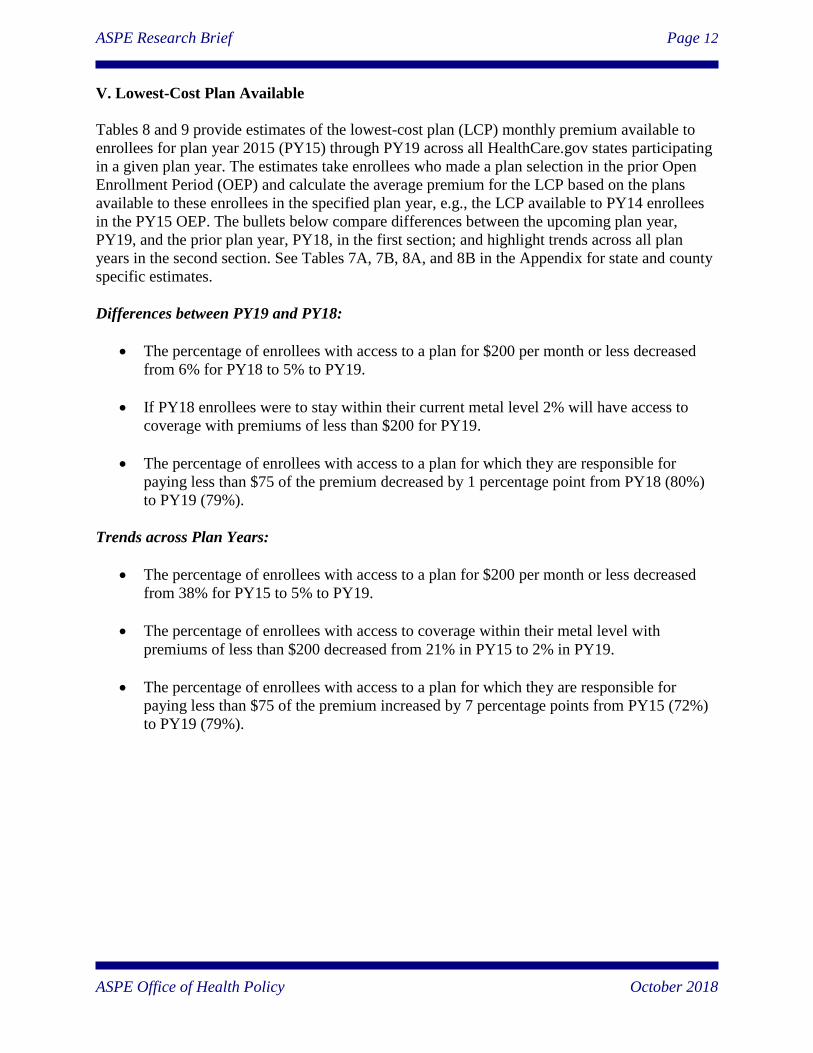
APTCs. Table 7 presents the average monthly APTC for PY14 through PY18 and estimates the
average monthly APTC for PY19 for enrollees who selected plans during the PY18 Open
Enrollment Period (OEP) using plans available in PY19. For all plan years, Table 7 uses the
maximum APTC enrollees can receive. An enrollee will receive less than the maximum APTC if
he or she selects a plan with a premium less than the maximum APTC amount. The bullets below
compare differences between the upcoming plan year, PY19, and the prior plan year, PY18, in
the first section; and highlight trends across plan years in the second section. See Tables 5A and
6A in the Appendix for state and county specific estimates.
Differences between PY19 and PY18:
The estimated average monthly APTC for current enrollees is $544 for PY19, a 3%
decrease from PY18 ($558).
A 27-year-old with a household income of $25,000 is estimated to receive an average
monthly APTC of $265 for PY19, a 3% decrease from PY18 ($274) based on the average
premium for the benchmark plan across all HealthCare.gov states.
A family of four with a household income of $60,000 is estimated to receive an average
monthly APTC of $1,155 for PY19, a 3% decrease from PY18 ($1,185) based on the
average premium for the benchmark plan across all HealthCare.gov states.
Trends across Plan Years:
The average monthly APTC for PY19 is ($544), an increase of 110% from PY14 ($259).
The percentage of enrollees making plan selections with APTCs has remained relatively
stable, staying between 84% and 87% between PY14 and PY18.
The percentage of enrollees making plan selections with CSRs remained relatively stable,
at approximately 60% between PY14 and PY17, but decreased to 54% for PY18.
3 As of the last quarter of 2017, CSR payments are no longer paid to issuers; however, issuers are still required by
law to offer plans with CSRs to eligible enrollees if they participate in an Exchange.
ASPE Research Brief Page 10
ASPE Office of Health Policy October 2018
Table 5
Percentage of Plan Selections Receiving APTCs or CSRs in HealthCare.gov States,
PY14 – PY18
Percentage of Plan Selections with APTC Percentage of Plan Selections with CSR
PY14 84% 60%
PY15 87% 60%
PY16 85% 59%
PY17 84% 60%
PY18 85% 54% Source: Financial assistance information is from active plan selections in the Centers for Medicare and Medicaid Services (CMS) Multidimensional Insurance Data Analytics System (MIDAS) for states using the HealthCare.gov platform between PY14 and PY18.
Note: PY stands for plan year and is followed by the last two digits of the year of Exchange plan coverage, e.g. PY14 = plan year 2014.
Estimates are based on plan selections made during the Open Enrollment Period (OEP) for each specified plan year. As of the last quarter of 2017, CSR payments are no longer paid to issuers; however, issuers are still required by law to offer plans with CSRs to eligible enrollees if
they participate in the Exchanges. See the “Methods and Limitations” section for more details.
Table 6
Average Monthly Benchmark Premiums and Advance Premium Tax Credits (APTCs) Available in
HealthCare.gov States, PY18 – PY19
27 Year-Old with a
Household Income of
$25,000
Family of Four with a
Household Income of
$60,000
PY18 Benchmark Before APTC $412 $1,582
PY18 APTC $274 $1,185
PY19 Benchmark Before APTC $405 $1,554
PY19 APTC $265 $1,155
Percentage Change in APTC PY18 to PY19 -3% -3% Source: Plan information is from the plan landscape files and active plan selections in the Centers for Medicare and Medicaid Services (CMS)
Multidimensional Insurance Data Analytics System (MIDAS) for states using the HealthCare.gov platform in PY18 and PY19.
Note: PY stands for plan year and is followed by the last two digits of the year of Exchange plan coverage, e.g. PY14 = plan year 2014. Averages for premiums are weighted by the county’s number of Exchange PY18 plan selections. In this example, the family of four is one 40-
year-old adult, one 38-year-old adult, and two children under the age of 15. All enrollees are assumed to not be tobacco users. For households
eligible for premium tax credits, after-tax-credit benchmark premiums are capped at a given percentage of household income. The maximum percent of income paid toward the benchmark plan is adjusted annually to be a measure of the difference between premium growth and
income growth. If the premium of the benchmark plan falls below the maximum applicable percentage of income amount for which a
household is responsible, then the household does not receive a tax credit and pays for the full premium for the plan selected. After-tax benchmark premiums will differ slightly between PY18 and PY19 for identical family compositions and income amounts because of changes
in the applicable percentages and the Federal Poverty Level Guidelines. Alaska and Hawaii’s Federal poverty guidelines are higher than those
for the continental United States; consequently, the after tax credit premium is lower for a given amount of income. Our calculations of premiums after tax credits assume that all members of the family of four making $60,000 would be eligible for premium tax credits. However,
in states with higher Medicaid of Children’s Health Insurance Program (CHIP) thresholds, the children would be eligible for Medicaid/CHIP
and not eligible for premium tax credits. Starting for PY18, new regulation modified the age rating methodology for individuals age 20 and younger; the 2018 family of four premiums reported in this report take into account the new age rating methodology; the 2018 average family
of four premium estimates in last year’s report released on October 30, 2017 do not take this change into account. Starting for PY19, new
regulation modified the methodology of determining the APTC amount attributable to children under 19 on an individual or family policy, in
which the premium of a stand-alone dental plan is added to the premium of any plan not offering pediatric dental benefits for purposes of
determining the benchmark plan and resultant APTC amount. The data presented in this table do not take this change into account. See the
“Methods and Limitations” section for more details.
ASPE Research Brief Page 11
ASPE Office of Health Policy October 2018
Table 7
Average Monthly Advance Premium Tax Credit (APTC) in HealthCare.gov States, PY14 – PY19
Average Monthly APTC Annual Growth Cumulative Growth
PY14 $259 - -
PY15 $263 2% 2%
PY16 $289 10% 12%
PY17 $382 32% 47%
PY18 $558 46% 115%
PY19 $544 -3% 110%
Source: Plan information is from the plan landscape files and active plan selections in the Centers for Medicare and Medicaid Services (CMS) Multidimensional Insurance Data Analytics System (MIDAS) for states using the HealthCare.gov platform between PY14 and PY19.
Note: PY stands for plan year and is followed by the last two digits of the year of Exchange plan coverage, e.g. PY14 = plan year 2014.
For PY14 through PY18, the estimates for average advance premium tax credit (APTC) are calculated using enrollees who made a plan selection during each plan year’s Open Enrollment Period (OEP). For PY19, the average APTC is an estimate of the APTC for enrollees
who made a plan selection during the PY18 OEP using plans available in PY19 and the same methodology employed in previous years.
The PY19 estimates hold all PY18 enrollee characteristics unchanged and premiums are based on the same age and family composition as
in PY18. For PY19, only enrollees who could be linked to complete plan and premium data for PY19 and PY18 are included. Tobacco
users are excluded from all plan years. For all plan years, the estimates presented in this table use the maximum APTC enrollees can receive. An enrollee will receive less than the maximum APTC if he or she selects a plan with a premium less than the maximum APTC
amount. See the “Methods and Limitations” section for more details.
ASPE Research Brief Page 12
ASPE Office of Health Policy October 2018
V. Lowest-Cost Plan Available
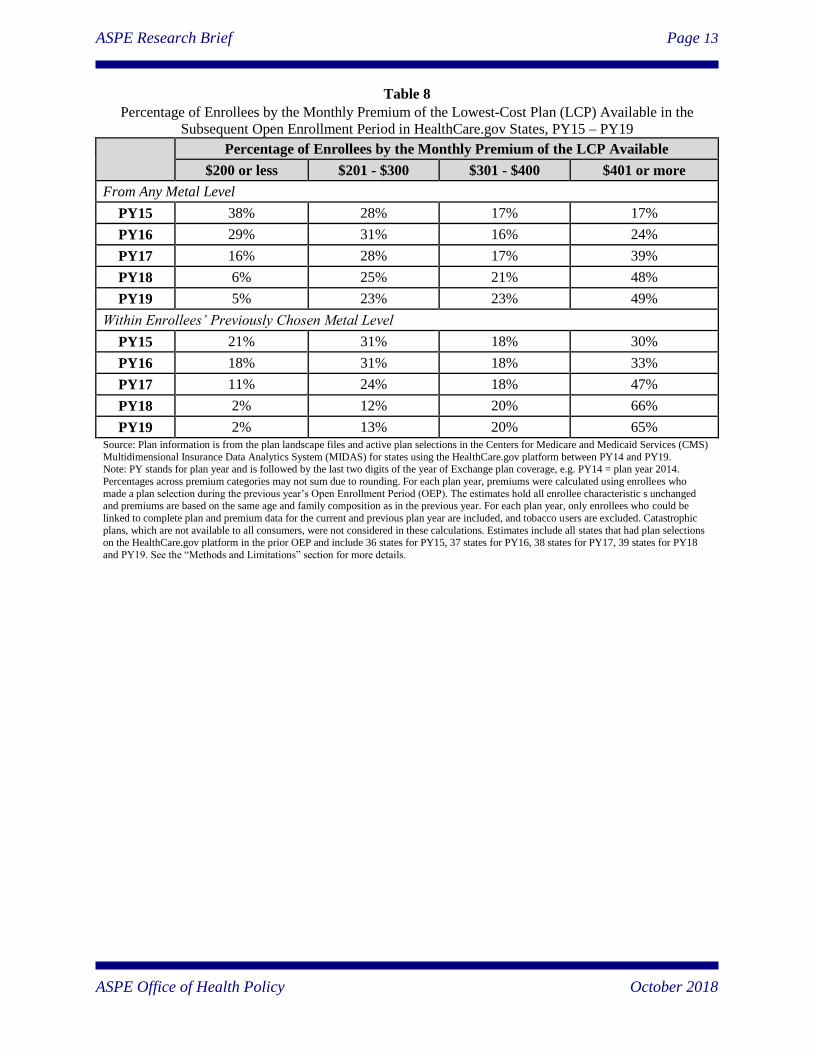
Tables 8 and 9 provide estimates of the lowest-cost plan (LCP) monthly premium available to
enrollees for plan year 2015 (PY15) through PY19 across all HealthCare.gov states participating
in a given plan year. The estimates take enrollees who made a plan selection in the prior Open
Enrollment Period (OEP) and calculate the average premium for the LCP based on the plans
available to these enrollees in the specified plan year, e.g., the LCP available to PY14 enrollees
in the PY15 OEP. The bullets below compare differences between the upcoming plan year,
PY19, and the prior plan year, PY18, in the first section; and highlight trends across all plan
years in the second section. See Tables 7A, 7B, 8A, and 8B in the Appendix for state and county
specific estimates.
Differences between PY19 and PY18:
The percentage of enrollees with access to a plan for $200 per month or less decreased
from 6% for PY18 to 5% to PY19.
If PY18 enrollees were to stay within their current metal level 2% will have access to
coverage with premiums of less than $200 for PY19.
The percentage of enrollees with access to a plan for which they are responsible for
paying less than $75 of the premium decreased by 1 percentage point from PY18 (80%)
to PY19 (79%).
Trends across Plan Years:
The percentage of enrollees with access to a plan for $200 per month or less decreased
from 38% for PY15 to 5% to PY19.
The percentage of enrollees with access to coverage within their metal level with
premiums of less than $200 decreased from 21% in PY15 to 2% in PY19.
The percentage of enrollees with access to a plan for which they are responsible for
paying less than $75 of the premium increased by 7 percentage points from PY15 (72%)
to PY19 (79%).
ASPE Research Brief Page 13
ASPE Office of Health Policy October 2018
Table 8
Percentage of Enrollees by the Monthly Premium of the Lowest-Cost Plan (LCP) Available in the
Subsequent Open Enrollment Period in HealthCare.gov States, PY15 – PY19
Percentage of Enrollees by the Monthly Premium of the LCP Available
$200 or less $201 - $300 $301 - $400 $401 or more
From Any Metal Level
PY15 38% 28% 17% 17%
PY16 29% 31% 16% 24%
PY17 16% 28% 17% 39%
PY18 6% 25% 21% 48%
PY19 5% 23% 23% 49%
Within Enrollees’ Previously Chosen Metal Level
PY15 21% 31% 18% 30%
PY16 18% 31% 18% 33%
PY17 11% 24% 18% 47%
PY18 2% 12% 20% 66%
PY19 2% 13% 20% 65% Source: Plan information is from the plan landscape files and active plan selections in the Centers for Medicare and Medicaid Services (CMS)
Multidimensional Insurance Data Analytics System (MIDAS) for states using the HealthCare.gov platform between PY14 and PY19. Note: PY stands for plan year and is followed by the last two digits of the year of Exchange plan coverage, e.g. PY14 = plan year 2014.
Percentages across premium categories may not sum due to rounding. For each plan year, premiums were calculated using enrollees who
made a plan selection during the previous year’s Open Enrollment Period (OEP). The estimates hold all enrollee characteristic s unchanged and premiums are based on the same age and family composition as in the previous year. For each plan year, only enrollees who could be
linked to complete plan and premium data for the current and previous plan year are included, and tobacco users are excluded. Catastrophic
plans, which are not available to all consumers, were not considered in these calculations. Estimates include all states that had plan selections on the HealthCare.gov platform in the prior OEP and include 36 states for PY15, 37 states for PY16, 38 states for PY17, 39 states for PY18
and PY19. See the “Methods and Limitations” section for more details.

ASPE Research Brief Page 14
ASPE Office of Health Policy October 2018
Table 9
Percentage of Enrollees by the Portion of the Monthly Premium Paid by the Enrollee for the Lowest-
Cost Plan (LCP) Available in the Subsequent Open Enrollment Period (OEP) in HealthCare.gov States,
PY14 – PY19
Percentage of Enrollees by the Portion of the Monthly Premium Paid by the
Enrollee for the LCP Available
$75 or less $76 - $150 $151 - $200 $201 or more
From Any Metal Level
PY15 72% 13% 6% 8%
PY16 72% 13% 6% 9%
PY17 71% 13% 5% 12%
PY18 80% 6% 3% 11%
PY19 79% 6% 3% 12%
Within Enrollees’ Previously Chosen Metal Level
PY15 56% 20% 8% 16%
PY16 57% 20% 7% 15%
PY17 58% 18% 6% 17%
PY18 60% 18% 6% 17%
PY19 62% 15% 5% 17% Source: Plan information is from the plan landscape files and active plan selections in the Centers for Medicare and Medicaid Services (CMS)
Multidimensional Insurance Data Analytics System (MIDAS) for states using the HealthCare.gov platform between PY14 and PY19.
Note: PY stands for plan year and is followed by the last two digits of the year of Exchange plan coverage, e.g. PY14 = plan year 2014. Percentages across premium categories may not sum due to rounding. For each plan year, premiums after subsidy were calculated using
enrollees who made a plan selection during the previous year’s Open Enrollment Period (OEP). This analysis holds all enrollee characteristics
unchanged and calculates premiums and tax credits based on the same age, family composition, and household income as in the previous year. For each plan year, this analysis includes only enrollees who could be linked to complete plan and premium data for the current and previous
plan year, and excludes tobacco users. Catastrophic plans, which are not available to all consumers, were not considered in these calculations.
Estimates include all states that had plan selections on the HealthCare.gov platform in the prior OEP and include 36 states for PY15, 37 states for PY16, 38 states for PY17, 39 states for PY18 and PY19. See the “Methods and Limitations” section for more details.
ASPE Research Brief Page 15
ASPE Office of Health Policy October 2018
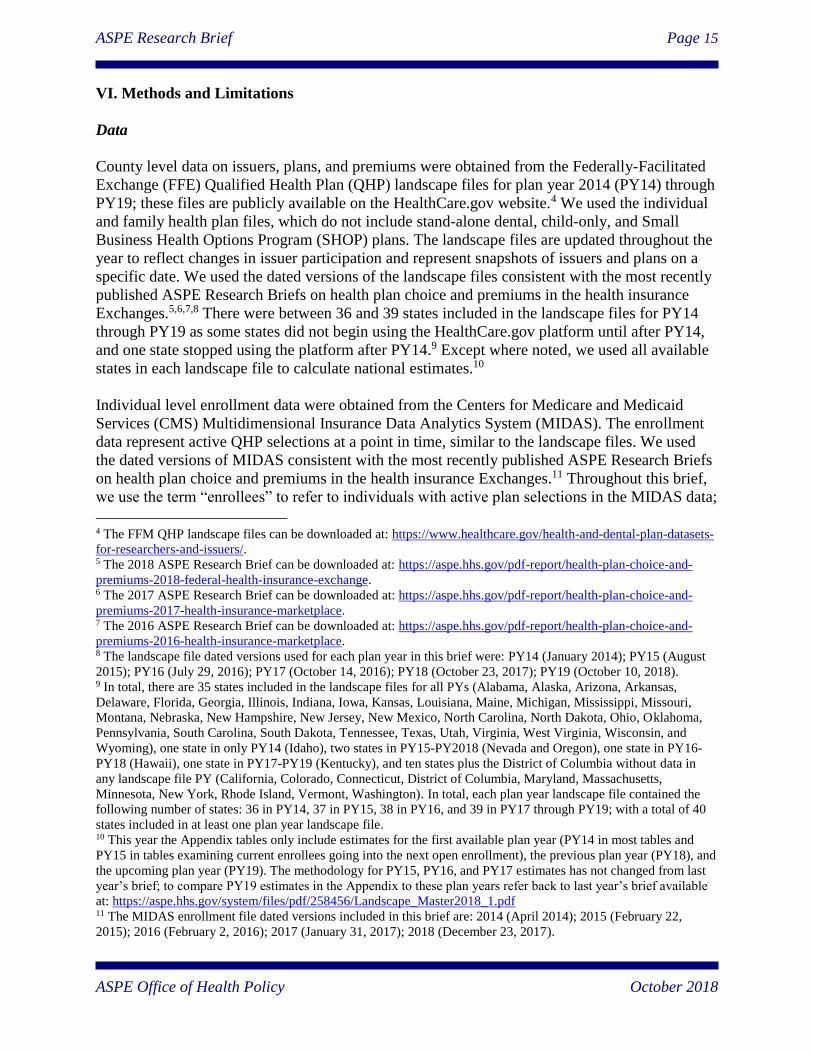
VI. Methods and Limitations
Data
County level data on issuers, plans, and premiums were obtained from the Federally-Facilitated
Exchange (FFE) Qualified Health Plan (QHP) landscape files for plan year 2014 (PY14) through
PY19; these files are publicly available on the HealthCare.gov website.4 We used the individual
and family health plan files, which do not include stand-alone dental, child-only, and Small
Business Health Options Program (SHOP) plans. The landscape files are updated throughout the
year to reflect changes in issuer participation and represent snapshots of issuers and plans on a
specific date. We used the dated versions of the landscape files consistent with the most recently
published ASPE Research Briefs on health plan choice and premiums in the health insurance
Exchanges.5,6,7,8 There were between 36 and 39 states included in the landscape files for PY14
through PY19 as some states did not begin using the HealthCare.gov platform until after PY14,
and one state stopped using the platform after PY14.9 Except where noted, we used all available
states in each landscape file to calculate national estimates.10
Individual level enrollment data were obtained from the Centers for Medicare and Medicaid
Services (CMS) Multidimensional Insurance Data Analytics System (MIDAS). The enrollment
data represent active QHP selections at a point in time, similar to the landscape files. We used
the dated versions of MIDAS consistent with the most recently published ASPE Research Briefs
on health plan choice and premiums in the health insurance Exchanges.11 Throughout this brief,
we use the term “enrollees” to refer to individuals with active plan selections in the MIDAS data;
4 The FFM QHP landscape files can be downloaded at: https://www.healthcare.gov/health-and-dental-plan-datasets-
for-researchers-and-issuers/. 5 The 2018 ASPE Research Brief can be downloaded at: https://aspe.hhs.gov/pdf-report/health-plan-choice-and-
premiums-2018-federal-health-insurance-exchange. 6 The 2017 ASPE Research Brief can be downloaded at: https://aspe.hhs.gov/pdf-report/health-plan-choice-and-
premiums-2017-health-insurance-marketplace. 7 The 2016 ASPE Research Brief can be downloaded at: https://aspe.hhs.gov/pdf-report/health-plan-choice-and-
premiums-2016-health-insurance-marketplace. 8 The landscape file dated versions used for each plan year in this brief were: PY14 (January 2014); PY15 (August
2015); PY16 (July 29, 2016); PY17 (October 14, 2016); PY18 (October 23, 2017); PY19 (October 10, 2018). 9 In total, there are 35 states included in the landscape files for all PYs (Alabama, Alaska, Arizona, Arkansas,
Delaware, Florida, Georgia, Illinois, Indiana, Iowa, Kansas, Louisiana, Maine, Michigan, Mississippi, Missouri,
Montana, Nebraska, New Hampshire, New Jersey, New Mexico, North Carolina, North Dakota, Ohio, Oklahoma,
Pennsylvania, South Carolina, South Dakota, Tennessee, Texas, Utah, Virginia, West Virginia, Wisconsin, and
Wyoming), one state in only PY14 (Idaho), two states in PY15-PY2018 (Nevada and Oregon), one state in PY16-
PY18 (Hawaii), one state in PY17-PY19 (Kentucky), and ten states plus the District of Columbia without data in
any landscape file PY (California, Colorado, Connecticut, District of Columbia, Maryland, Massachusetts,
Minnesota, New York, Rhode Island, Vermont, Washington). In total, each plan year landscape file contained the
following number of states: 36 in PY14, 37 in PY15, 38 in PY16, and 39 in PY17 through PY19; with a total of 40
states included in at least one plan year landscape file. 10 This year the Appendix tables only include estimates for the first available plan year (PY14 in most tables and
PY15 in tables examining current enrollees going into the next open enrollment), the previous plan year (PY18), and
the upcoming plan year (PY19). The methodology for PY15, PY16, and PY17 estimates has not changed from last
year’s brief; to compare PY19 estimates in the Appendix to these plan years refer back to last year’s brief available
at: https://aspe.hhs.gov/system/files/pdf/258456/Landscape_Master2018_1.pdf 11 The MIDAS enrollment file dated versions included in this brief are: 2014 (April 2014); 2015 (February 22,
2015); 2016 (February 2, 2016); 2017 (January 31, 2017); 2018 (December 23, 2017).
ASPE Research Brief Page 16
ASPE Office of Health Policy October 2018
the term does not refer to “effectuated enrollees” – individuals who selected plans and paid the
premium. As a result, estimates in this brief may differ from those calculated using effectuated
enrollment.
Plan data not available in the landscape files or MIDAS were obtained from the CMS Health
Insurance Marketplace Public Use Files (Marketplace PUFs).12 The Benefits and Cost Sharing
PUFs were used to identify the percentage of premiums covering essential health benefits
(EHBs) in PY14 and PY15, as they were absent from the landscape files for these years.
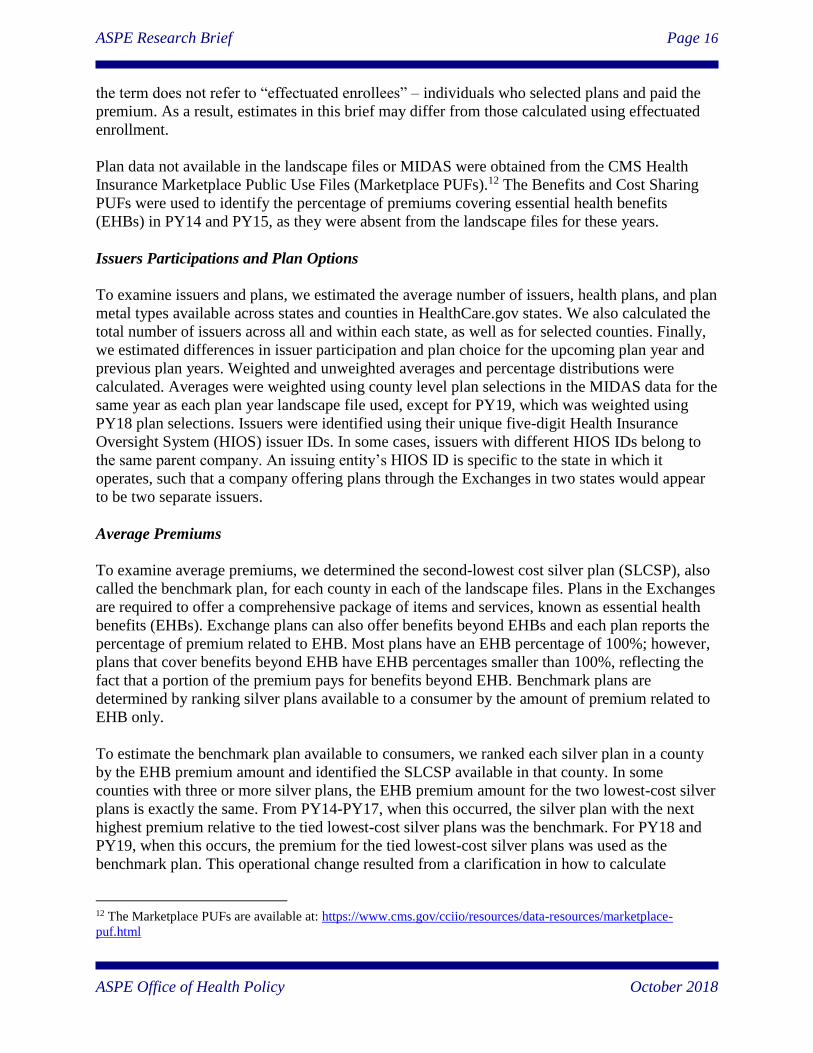
Issuers Participations and Plan Options
To examine issuers and plans, we estimated the average number of issuers, health plans, and plan
metal types available across states and counties in HealthCare.gov states. We also calculated the
total number of issuers across all and within each state, as well as for selected counties. Finally,
we estimated differences in issuer participation and plan choice for the upcoming plan year and
previous plan years. Weighted and unweighted averages and percentage distributions were
calculated. Averages were weighted using county level plan selections in the MIDAS data for the
same year as each plan year landscape file used, except for PY19, which was weighted using
PY18 plan selections. Issuers were identified using their unique five-digit Health Insurance
Oversight System (HIOS) issuer IDs. In some cases, issuers with different HIOS IDs belong to
the same parent company. An issuing entity’s HIOS ID is specific to the state in which it
operates, such that a company offering plans through the Exchanges in two states would appear
to be two separate issuers.
Average Premiums
To examine average premiums, we determined the second-lowest cost silver plan (SLCSP), also
called the benchmark plan, for each county in each of the landscape files. Plans in the Exchanges
are required to offer a comprehensive package of items and services, known as essential health
benefits (EHBs). Exchange plans can also offer benefits beyond EHBs and each plan reports the
percentage of premium related to EHB. Most plans have an EHB percentage of 100%; however,
plans that cover benefits beyond EHB have EHB percentages smaller than 100%, reflecting the
fact that a portion of the premium pays for benefits beyond EHB. Benchmark plans are
determined by ranking silver plans available to a consumer by the amount of premium related to
EHB only.
To estimate the benchmark plan available to consumers, we ranked each silver plan in a county
by the EHB premium amount and identified the SLCSP available in that county. In some
counties with three or more silver plans, the EHB premium amount for the two lowest-cost silver
plans is exactly the same. From PY14-PY17, when this occurred, the silver plan with the next
highest premium relative to the tied lowest-cost silver plans was the benchmark. For PY18 and
PY19, when this occurs, the premium for the tied lowest-cost silver plans was used as the
benchmark plan. This operational change resulted from a clarification in how to calculate
12 The Marketplace PUFs are available at: https://www.cms.gov/cciio/resources/data-resources/marketplace-
puf.html

ASPE Research Brief Page 17
ASPE Office of Health Policy October 2018
advance premium tax credits (APTCs) released by Internal Revenue Service (IRS).13
Additionally, when a county only has a single silver plan it is used as the benchmark. In this
brief, the terms “SLCSP” and “benchmark plan” are used interchangeably to refer to the second-
lowest cost silver plan in a county, which may not be the actual benchmark plan for all individual
consumers in a county.
We calculated the average premium and the annual and cumulative percentage change in these
for the SLCSP and the lowest-cost plan (LCP) available to a 27-year-old for Exchange plans
covering enrollees in plan year 2014 (PY14) through PY19 across all HealthCare.gov states.
In addition to reweighting PY18 estimates using county level open enrollment plan selections
from 2018 rather than 2017, the premium estimates for a Family of Four with Household Income
of $60,000 in PY18 differ from last year’s report released on October 30, 2017 due to a change
in the age bands for children in states using the federal default standard curve. The change
included moving from the single age band of 0.635 used in PY17 and prior plan years to seven
bands with higher premium ratios. The new bands are effective in PY18 and PY19 and following
years for each age group: ages 0-14 = 0.765; age 15 = 0.833; age 16 = 0.859; age 17 = 0.885; age
18 = 0.913; age 19 = 0.941; age 20 = 0.970. In last year’s brief the estimates for a Family of Four
with Household Income of $60,000 were applicable to the family of four being composed of two
adults, one age 40 and one age 38, and two children under age 21. For this year’s brief we used
the age band for ages 0-14 (0.765) in these estimates and therefore the two children are assumed
to be under age 15.
Subsidy Utilization and Cost
To examine subsidies, we calculated the percentage of MIDAS plan selections receiving
financial assistance for APTCs and with cost-sharing reductions (CSRs) in PY14 through PY18.
Additionally, we calculated the average benchmark plan premium and APTC for PY18 and
PY19 under two scenarios for household compositions eligible for APTC: 1) a 27-year-old with
household income of $25,000, and 2) a family of four with a household income of $60,000.
Estimates of average before and after APTC average premium, average APTC amount, and the
percentage change in the average APTC amount were calculated. Finally, we estimated the
average APTC and growth in APTC for PY14 through PY19. For PY14-PY18, we estimated the
average maximum APTC using plan selections made during each plan year’s Open Enrollment
Period (OEP). For PY19, we estimated the average APTC for enrollees who selected plans
during the PY18 OEP using the benchmark plan available in their county in PY19. See Lowest-
Cost Premiums Available below for details of how enrollees in PY18 were linked to PY19. Note,
here we use the maximum APTC enrollees can receive. An enrollee will receive less than the
maximum APTC if he or she selects a plan with a premium less than the maximum APTC
amount.
APTCs were calculated using the maximum applicable amount determined annually by the IRS
and based on household income. The maximum applicable amount is the amount of premium an
APTC eligible consumer in the Exchanges is expected to pay toward their benchmark premium.
13 IRS Questions and Answers on Premium Tax Credits are available at: https://www.irs.gov/affordable-care-
act/individuals-and-families/questions-and-answers-on-the-premium-tax-credit
ASPE Research Brief Page 18
ASPE Office of Health Policy October 2018
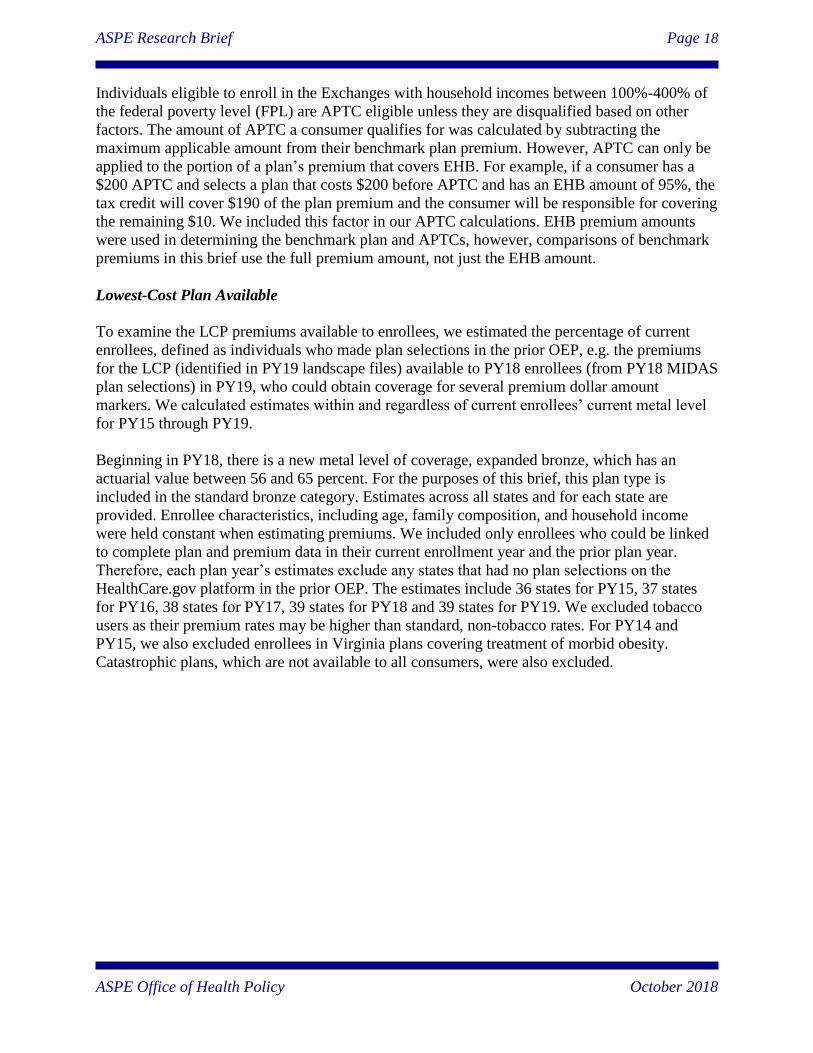
Individuals eligible to enroll in the Exchanges with household incomes between 100%-400% of
the federal poverty level (FPL) are APTC eligible unless they are disqualified based on other
factors. The amount of APTC a consumer qualifies for was calculated by subtracting the
maximum applicable amount from their benchmark plan premium. However, APTC can only be
applied to the portion of a plan’s premium that covers EHB. For example, if a consumer has a
$200 APTC and selects a plan that costs $200 before APTC and has an EHB amount of 95%, the
tax credit will cover $190 of the plan premium and the consumer will be responsible for covering
the remaining $10. We included this factor in our APTC calculations. EHB premium amounts
were used in determining the benchmark plan and APTCs, however, comparisons of benchmark
premiums in this brief use the full premium amount, not just the EHB amount.
Lowest-Cost Plan Available
To examine the LCP premiums available to enrollees, we estimated the percentage of current
enrollees, defined as individuals who made plan selections in the prior OEP, e.g. the premiums
for the LCP (identified in PY19 landscape files) available to PY18 enrollees (from PY18 MIDAS
plan selections) in PY19, who could obtain coverage for several premium dollar amount
markers. We calculated estimates within and regardless of current enrollees’ current metal level
for PY15 through PY19.
Beginning in PY18, there is a new metal level of coverage, expanded bronze, which has an
actuarial value between 56 and 65 percent. For the purposes of this brief, this plan type is
included in the standard bronze category. Estimates across all states and for each state are
provided. Enrollee characteristics, including age, family composition, and household income
were held constant when estimating premiums. We included only enrollees who could be linked
to complete plan and premium data in their current enrollment year and the prior plan year.
Therefore, each plan year’s estimates exclude any states that had no plan selections on the
HealthCare.gov platform in the prior OEP. The estimates include 36 states for PY15, 37 states
for PY16, 38 states for PY17, 39 states for PY18 and 39 states for PY19. We excluded tobacco
users as their premium rates may be higher than standard, non-tobacco rates. For PY14 and
PY15, we also excluded enrollees in Virginia plans covering treatment of morbid obesity.
Catastrophic plans, which are not available to all consumers, were also excluded.
ASPE Research Brief Page 19
ASPE Office of Health Policy October 2018
Appendix: State and County Tables
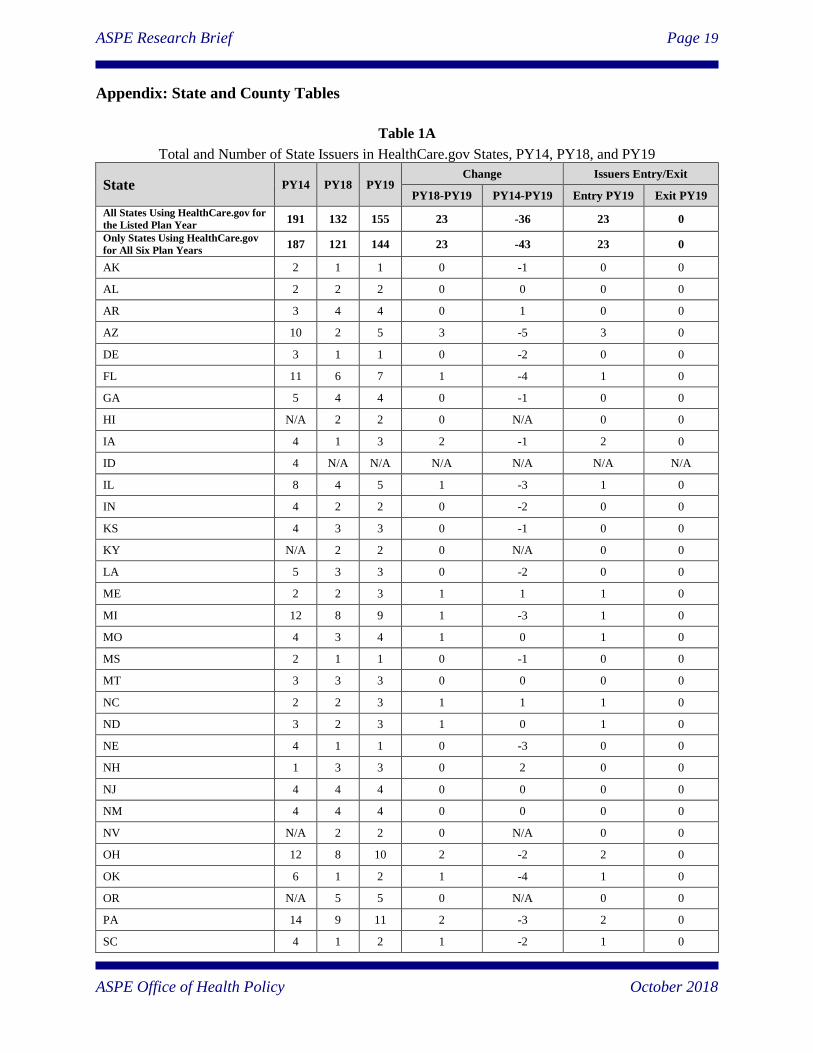
Table 1A
Total and Number of State Issuers in HealthCare.gov States, PY14, PY18, and PY19
State PY14 PY18 PY19 Change Issuers Entry/Exit
PY18-PY19 PY14-PY19 Entry PY19 Exit PY19
All States Using HealthCare.gov for
the Listed Plan Year 191 132 155 23 -36 23 0
Only States Using HealthCare.gov
for All Six Plan Years 187 121 144 23 -43 23 0
AK 2 1 1 0 -1 0 0
AL 2 2 2 0 0 0 0
AR 3 4 4 0 1 0 0
AZ 10 2 5 3 -5 3 0
DE 3 1 1 0 -2 0 0
FL 11 6 7 1 -4 1 0
GA 5 4 4 0 -1 0 0
HI N/A 2 2 0 N/A 0 0
IA 4 1 3 2 -1 2 0
ID 4 N/A N/A N/A N/A N/A N/A
IL 8 4 5 1 -3 1 0
IN 4 2 2 0 -2 0 0
KS 4 3 3 0 -1 0 0
KY N/A 2 2 0 N/A 0 0
LA 5 3 3 0 -2 0 0
ME 2 2 3 1 1 1 0
MI 12 8 9 1 -3 1 0
MO 4 3 4 1 0 1 0
MS 2 1 1 0 -1 0 0
MT 3 3 3 0 0 0 0
NC 2 2 3 1 1 1 0
ND 3 2 3 1 0 1 0
NE 4 1 1 0 -3 0 0
NH 1 3 3 0 2 0 0
NJ 4 4 4 0 0 0 0
NM 4 4 4 0 0 0 0
NV N/A 2 2 0 N/A 0 0
OH 12 8 10 2 -2 2 0
OK 6 1 2 1 -4 1 0
OR N/A 5 5 0 N/A 0 0
PA 14 9 11 2 -3 2 0
SC 4 1 2 1 -2 1 0
ASPE Research Brief Page 20
ASPE Office of Health Policy October 2018
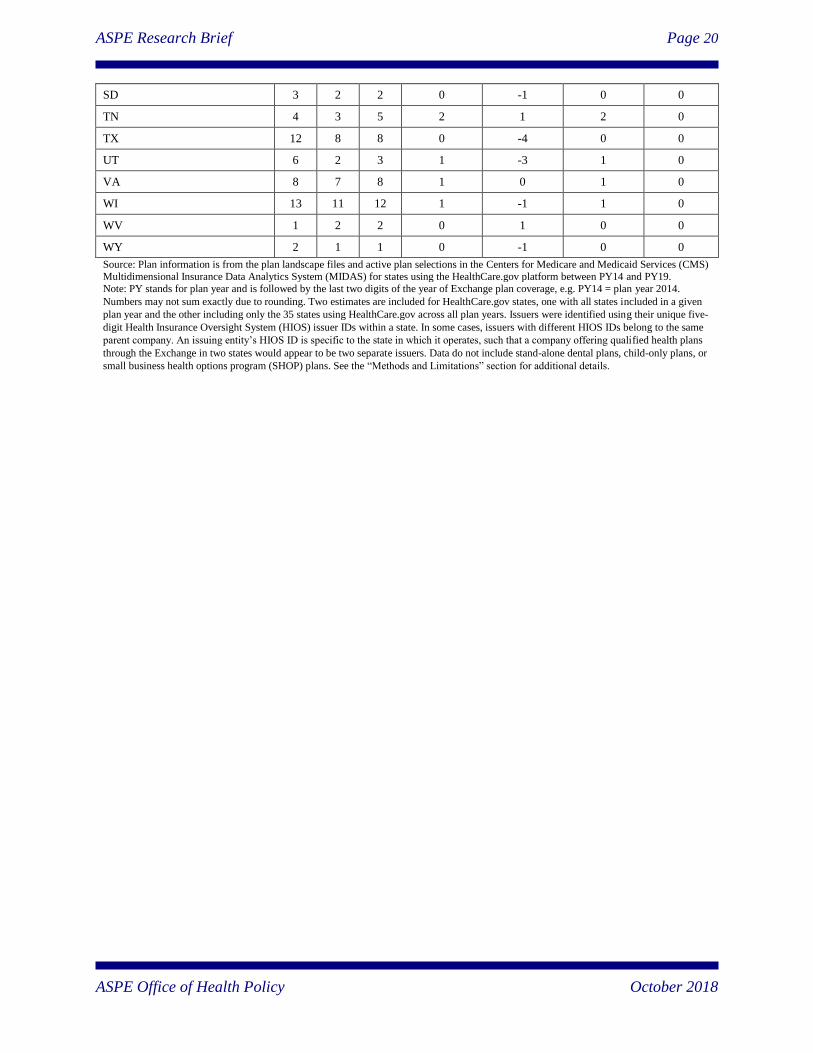
SD 3 2 2 0 -1 0 0
TN 4 3 5 2 1 2 0
TX 12 8 8 0 -4 0 0
UT 6 2 3 1 -3 1 0
VA 8 7 8 1 0 1 0
WI 13 11 12 1 -1 1 0
WV 1 2 2 0 1 0 0
WY 2 1 1 0 -1 0 0
Source: Plan information is from the plan landscape files and active plan selections in the Centers for Medicare and Medicaid Services (CMS) Multidimensional Insurance Data Analytics System (MIDAS) for states using the HealthCare.gov platform between PY14 and PY19. Note: PY stands for plan year and is followed by the last two digits of the year of Exchange plan coverage, e.g. PY14 = plan year 2014.
Numbers may not sum exactly due to rounding. Two estimates are included for HealthCare.gov states, one with all states included in a given
plan year and the other including only the 35 states using HealthCare.gov across all plan years. Issuers were identified using their unique five-
digit Health Insurance Oversight System (HIOS) issuer IDs within a state. In some cases, issuers with different HIOS IDs belong to the same
parent company. An issuing entity’s HIOS ID is specific to the state in which it operates, such that a company offering qualified health plans
through the Exchange in two states would appear to be two separate issuers. Data do not include stand-alone dental plans, child-only plans, or
small business health options program (SHOP) plans. See the “Methods and Limitations” section for additional details.

ASPE Research Brief Page 21
ASPE Office of Health Policy October 2018
Table 1B
Number of Issuers in Selected Counties in HealthCare.gov States, PY14, PY18, and PY19
State County City in County Number of Issuers Change
PY14 PY18 PY19 PY18-PY19 PY14-PY19
AL Jefferson Birmingham 2 2 2 0 0
AK Anchorage Anchorage 2 1 1 0 -1
AK Juneau Juneau 2 1 1 0 -1
AZ Maricopa Phoenix 10 1 4 3 -6
AZ Pima Tucson 10 1 3 2 -7
AR Pulaski Little Rock 3 4 4 0 1
DE New Castle Wilmington 3 1 1 0 -2
FL Broward Ft. Lauderdale 8 4 4 0 -4
FL Duval Jacksonville 4 4 4 0 0
FL Hillsborough Tampa 6 4 4 0 -2
FL Miami-Dade Miami 9 4 4 0 -5
FL Orange Orlando 5 3 4 1 -1
FL Palm Beach West Palm Beach 8 4 4 0 -4
GA Fulton Atlanta 4 2 3 1 -1
HI Honolulu Honolulu N/A 2 2 0 N/A
IL Cook Chicago 6 3 3 0 -3
IN Marion Indianapolis 2 2 2 0 0
IA Linn Cedar Rapids 2 1 2 1 0
KS Sedgwick Wichita 3 2 2 0 -1
KS Wyandotte Kansas City 2 2 2 0 0
KY Fayette Lexington N/A 1 2 1 N/A
KY Jefferson Louisville N/A 1 2 1 N/A
LA Orleans New Orleans 4 3 3 0 -1
ME Cumberland Portland 2 2 3 1 1
MI Wayne Detroit 11 7 8 1 -3
MS Jackson Jackson 1 1 1 0 0
MO Saint Louis St. Louis 2 2 2 0 0
MT Gallatin Bozeman 3 3 3 0 0
NE Douglas Omaha 4 1 1 0 -3
NV Clark Las Vegas N/A 2 2 0 N/A
NH Hillsborough Manchester 1 3 3 0 2
NJ Essex Newark 4 4 4 0 0
NM Bernalillo Albuquerque 4 4 4 0 0
NC Guilford Greensboro 2 1 1 0 -1
NC Mecklenburg Charlotte 2 1 1 0 -1
NC Wake Raleigh-Durham 2 2 3 1 1
ASPE Research Brief Page 22
ASPE Office of Health Policy October 2018
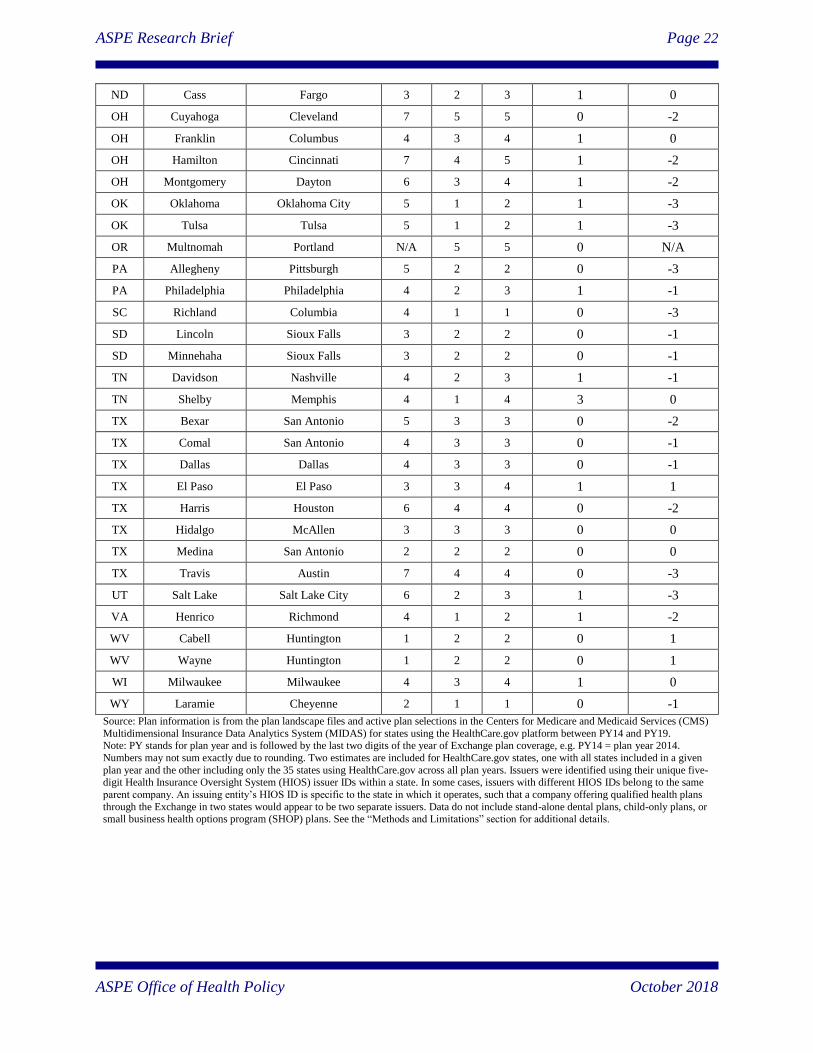
ND Cass Fargo 3 2 3 1 0
OH Cuyahoga Cleveland 7 5 5 0 -2
OH Franklin Columbus 4 3 4 1 0
OH Hamilton Cincinnati 7 4 5 1 -2
OH Montgomery Dayton 6 3 4 1 -2
OK Oklahoma Oklahoma City 5 1 2 1 -3
OK Tulsa Tulsa 5 1 2 1 -3
OR Multnomah Portland N/A 5 5 0 N/A
PA Allegheny Pittsburgh 5 2 2 0 -3
PA Philadelphia Philadelphia 4 2 3 1 -1
SC Richland Columbia 4 1 1 0 -3
SD Lincoln Sioux Falls 3 2 2 0 -1
SD Minnehaha Sioux Falls 3 2 2 0 -1
TN Davidson Nashville 4 2 3 1 -1
TN Shelby Memphis 4 1 4 3 0
TX Bexar San Antonio 5 3 3 0 -2
TX Comal San Antonio 4 3 3 0 -1
TX Dallas Dallas 4 3 3 0 -1
TX El Paso El Paso 3 3 4 1 1
TX Harris Houston 6 4 4 0 -2
TX Hidalgo McAllen 3 3 3 0 0
TX Medina San Antonio 2 2 2 0 0
TX Travis Austin 7 4 4 0 -3
UT Salt Lake Salt Lake City 6 2 3 1 -3
VA Henrico Richmond 4 1 2 1 -2
WV Cabell Huntington 1 2 2 0 1
WV Wayne Huntington 1 2 2 0 1
WI Milwaukee Milwaukee 4 3 4 1 0
WY Laramie Cheyenne 2 1 1 0 -1
Source: Plan information is from the plan landscape files and active plan selections in the Centers for Medicare and Medicaid Services (CMS)
Multidimensional Insurance Data Analytics System (MIDAS) for states using the HealthCare.gov platform between PY14 and PY19. Note: PY stands for plan year and is followed by the last two digits of the year of Exchange plan coverage, e.g. PY14 = plan year 2014.
Numbers may not sum exactly due to rounding. Two estimates are included for HealthCare.gov states, one with all states included in a given
plan year and the other including only the 35 states using HealthCare.gov across all plan years. Issuers were identified using their unique five-digit Health Insurance Oversight System (HIOS) issuer IDs within a state. In some cases, issuers with different HIOS IDs belong to the same
parent company. An issuing entity’s HIOS ID is specific to the state in which it operates, such that a company offering qualified health plans
through the Exchange in two states would appear to be two separate issuers. Data do not include stand-alone dental plans, child-only plans, or small business health options program (SHOP) plans. See the “Methods and Limitations” section for additional details.
ASPE Research Brief Page 23
ASPE Office of Health Policy October 2018
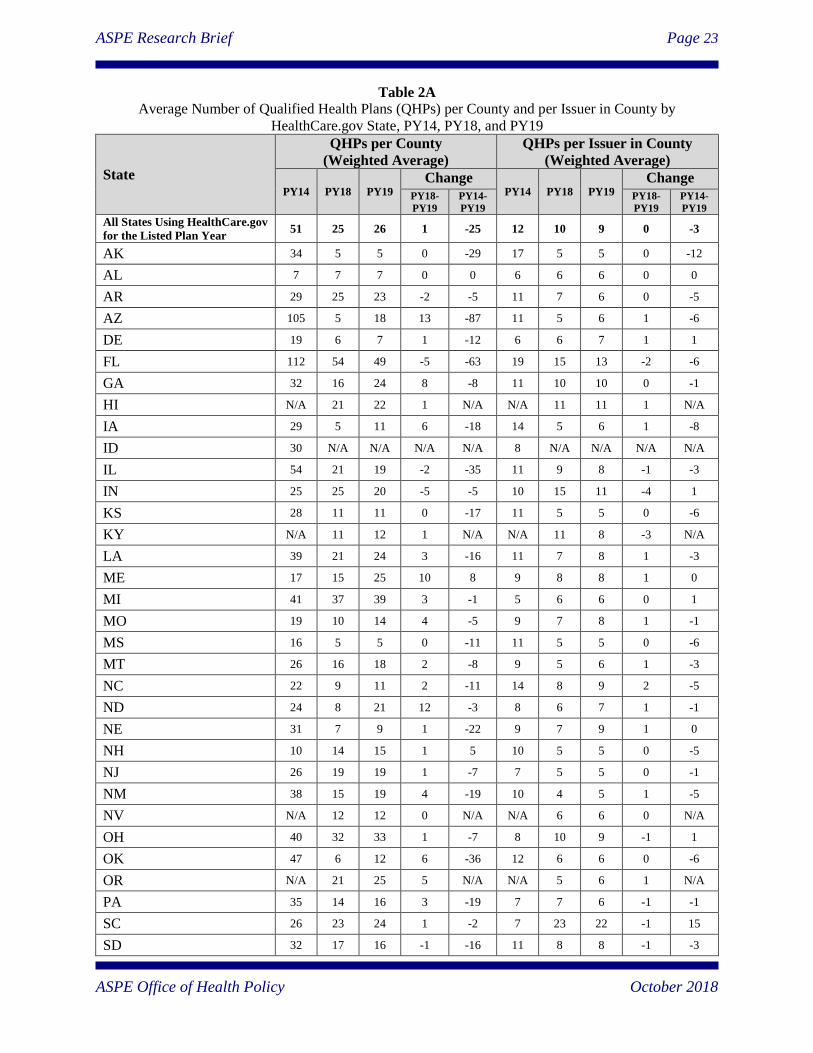
Table 2A
Average Number of Qualified Health Plans (QHPs) per County and per Issuer in County by
HealthCare.gov State, PY14, PY18, and PY19
State
QHPs per County
(Weighted Average)
QHPs per Issuer in County
(Weighted Average)
PY14 PY18 PY19
Change PY14 PY18 PY19
Change
PY18-
PY19
PY14-
PY19
PY18-
PY19
PY14-
PY19
All States Using HealthCare.gov
for the Listed Plan Year 51 25 26 1 -25 12 10 9 0 -3
AK 34 5 5 0 -29 17 5 5 0 -12
AL 7 7 7 0 0 6 6 6 0 0
AR 29 25 23 -2 -5 11 7 6 0 -5
AZ 105 5 18 13 -87 11 5 6 1 -6
DE 19 6 7 1 -12 6 6 7 1 1
FL 112 54 49 -5 -63 19 15 13 -2 -6
GA 32 16 24 8 -8 11 10 10 0 -1
HI N/A 21 22 1 N/A N/A 11 11 1 N/A
IA 29 5 11 6 -18 14 5 6 1 -8
ID 30 N/A N/A N/A N/A 8 N/A N/A N/A N/A
IL 54 21 19 -2 -35 11 9 8 -1 -3
IN 25 25 20 -5 -5 10 15 11 -4 1
KS 28 11 11 0 -17 11 5 5 0 -6
KY N/A 11 12 1 N/A N/A 11 8 -3 N/A
LA 39 21 24 3 -16 11 7 8 1 -3
ME 17 15 25 10 8 9 8 8 1 0
MI 41 37 39 3 -1 5 6 6 0 1
MO 19 10 14 4 -5 9 7 8 1 -1
MS 16 5 5 0 -11 11 5 5 0 -6
MT 26 16 18 2 -8 9 5 6 1 -3
NC 22 9 11 2 -11 14 8 9 2 -5
ND 24 8 21 12 -3 8 6 7 1 -1
NE 31 7 9 1 -22 9 7 9 1 0
NH 10 14 15 1 5 10 5 5 0 -5
NJ 26 19 19 1 -7 7 5 5 0 -1
NM 38 15 19 4 -19 10 4 5 1 -5
NV N/A 12 12 0 N/A N/A 6 6 0 N/A
OH 40 32 33 1 -7 8 10 9 -1 1
OK 47 6 12 6 -36 12 6 6 0 -6
OR N/A 21 25 5 N/A N/A 5 6 1 N/A
PA 35 14 16 3 -19 7 7 6 -1 -1
SC 26 23 24 1 -2 7 23 22 -1 15
SD 32 17 16 -1 -16 11 8 8 -1 -3
ASPE Research Brief Page 24
ASPE Office of Health Policy October 2018
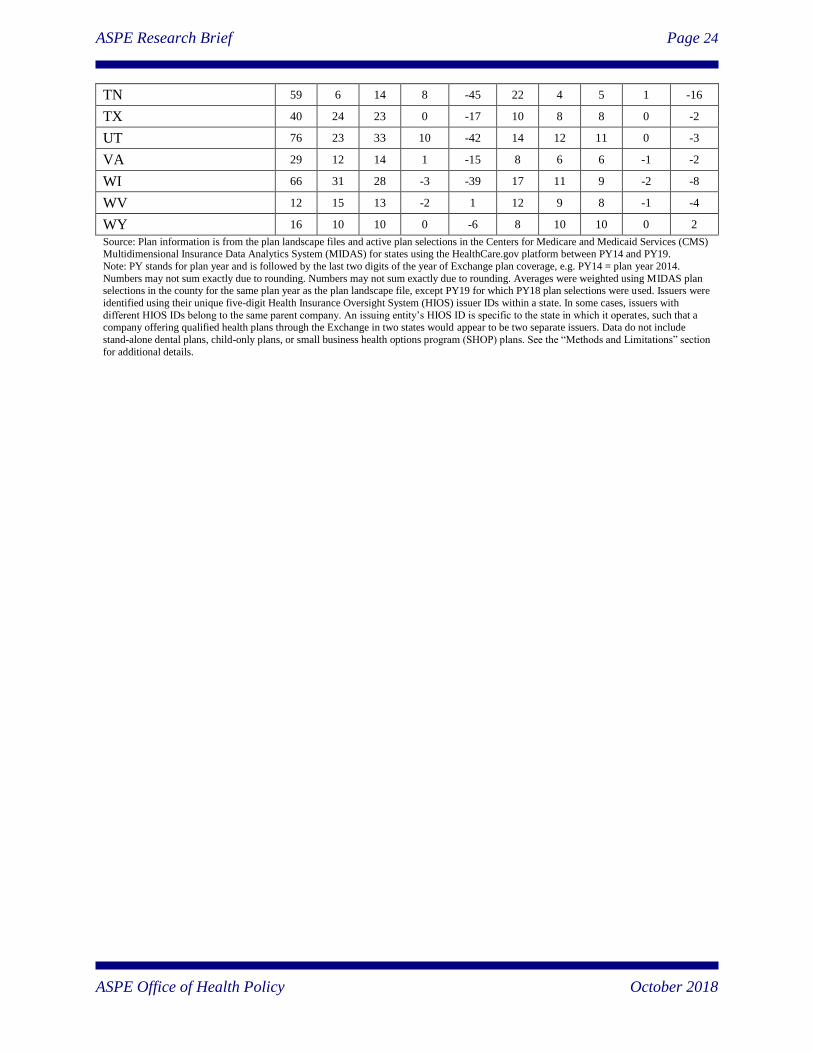
TN 59 6 14 8 -45 22 4 5 1 -16
TX 40 24 23 0 -17 10 8 8 0 -2
UT 76 23 33 10 -42 14 12 11 0 -3
VA 29 12 14 1 -15 8 6 6 -1 -2
WI 66 31 28 -3 -39 17 11 9 -2 -8
WV 12 15 13 -2 1 12 9 8 -1 -4
WY 16 10 10 0 -6 8 10 10 0 2
Source: Plan information is from the plan landscape files and active plan selections in the Centers for Medicare and Medicaid Services (CMS) Multidimensional Insurance Data Analytics System (MIDAS) for states using the HealthCare.gov platform between PY14 and PY19.
Note: PY stands for plan year and is followed by the last two digits of the year of Exchange plan coverage, e.g. PY14 = plan year 2014.
Numbers may not sum exactly due to rounding. Numbers may not sum exactly due to rounding. Averages were weighted using MIDAS plan selections in the county for the same plan year as the plan landscape file, except PY19 for which PY18 plan selections were used. Issuers were
identified using their unique five-digit Health Insurance Oversight System (HIOS) issuer IDs within a state. In some cases, issuers with
different HIOS IDs belong to the same parent company. An issuing entity’s HIOS ID is specific to the state in which it operates, such that a company offering qualified health plans through the Exchange in two states would appear to be two separate issuers. Data do not include
stand-alone dental plans, child-only plans, or small business health options program (SHOP) plans. See the “Methods and Limitations” section
for additional details.
ASPE Research Brief Page 25
ASPE Office of Health Policy October 2018
Table 3A
Average Monthly Premium for the Second-Lowest Cost Silver Plan (SLCSP) for a 27-Year-Old in
HealthCare.gov States, PY14, PY18, and PY19
State
SLCSP Average Monthly Premium for a 27-Year-Old
PY14 PY18 PY19 Percent Change
PY18–PY19 PY14–PY19 All States Using HealthCare.gov
for the Listed Plan Year $218 $412 $405 -2% 85%
AK $349 $596 $577 -3% 65%
AL $210 $458 $448 -2% 113%
AR $241 $298 $311 4% 29%
AZ $164 $427 $384 -10% 134%
DE $237 $484 $561 16% 137%
FL $218 $383 $390 2% 79%
GA $236 $397 $398 0% 69%
HI N/A $378 $416 10% N/A
IA $207 $585 $624 7% 201%
ID $199 N/A N/A N/A N/A
IL $186 $401 $390 -3% 110%
IN $270 $287 $280 -2% 4%
KS $196 $425 $453 7% 131%
KY N/A $355 $378 7% N/A
LA $252 $390 $369 -5% 46%
ME $266 $482 $445 -8% 67%
MI $207 $313 $313 0% 51%
MO $235 $432 $413 -5% 75%
MS $313 $445 $427 -4% 36%
MT $208 $430 $460 7% 122%
NC $244 $514 $506 -2% 107%
ND $233 $310 $375 21% 61%
NE $205 $629 $686 9% 235%
NH $237 $389 $330 -15% 39%
NJ $265 $339 $289 -15% 9%
NM $183 $340 $300 -12% 64%
NV N/A $353 $337 -4% N/A
OH $216 $313 $313 0% 45%
OK $175 $540 $571 6% 227%
OR N/A $342 $365 7% N/A
PA $198 $472 $398 -16% 101%
SC $222 $427 $454 6% 104%
SD $234 $428 $456 6% 94%
ASPE Research Brief Page 26
ASPE Office of Health Policy October 2018
TN $161 $608 $448 -26% 178%
TX $204 $358 $364 2% 79%
UT $206 $523 $512 -2% 148%
VA $223 $440 $455 3% 104%
WI $246 $467 $441 -6% 79%
WV $230 $457 $499 9% 116%
WY $344 $709 $709 0% 106%
Source: Plan information is from the plan landscape files and active plan selections in the Centers for Medicare and Medicaid Services (CMS) Multidimensional Insurance Data Analytics System (MIDAS) for states using the HealthCare.gov platform between PY14 and PY19.
Note: PY stands for plan year and is followed by the last two digits of the year of Exchange plan coverage, e.g. PY14 = plan year 2014. The
numbers in this table represent premiums before the application of advance premium tax credits. HealthCare.gov average premiums are weighted by the number of Exchange plan selections in each county. The PY14 through PY18 estimates are weight by current year plan
selections and PY19 are weighted by PY18 plan selections. This analysis identifies the second-lowest cost silver plan in each county based on
the portion of the premium that covers essential health benefits. Estimates include all states using the HealthCare.gov platform in the specified plan year. See the “Methods and Limitations” section for details.
ASPE Research Brief Page 27
ASPE Office of Health Policy October 2018
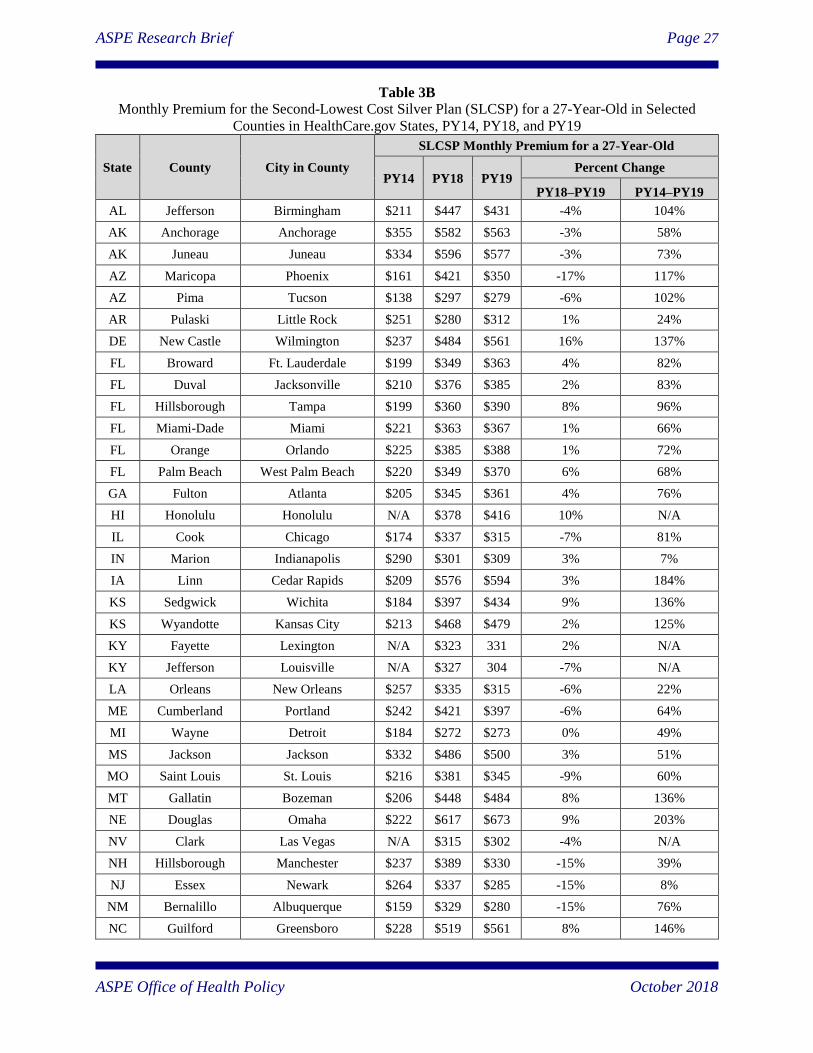
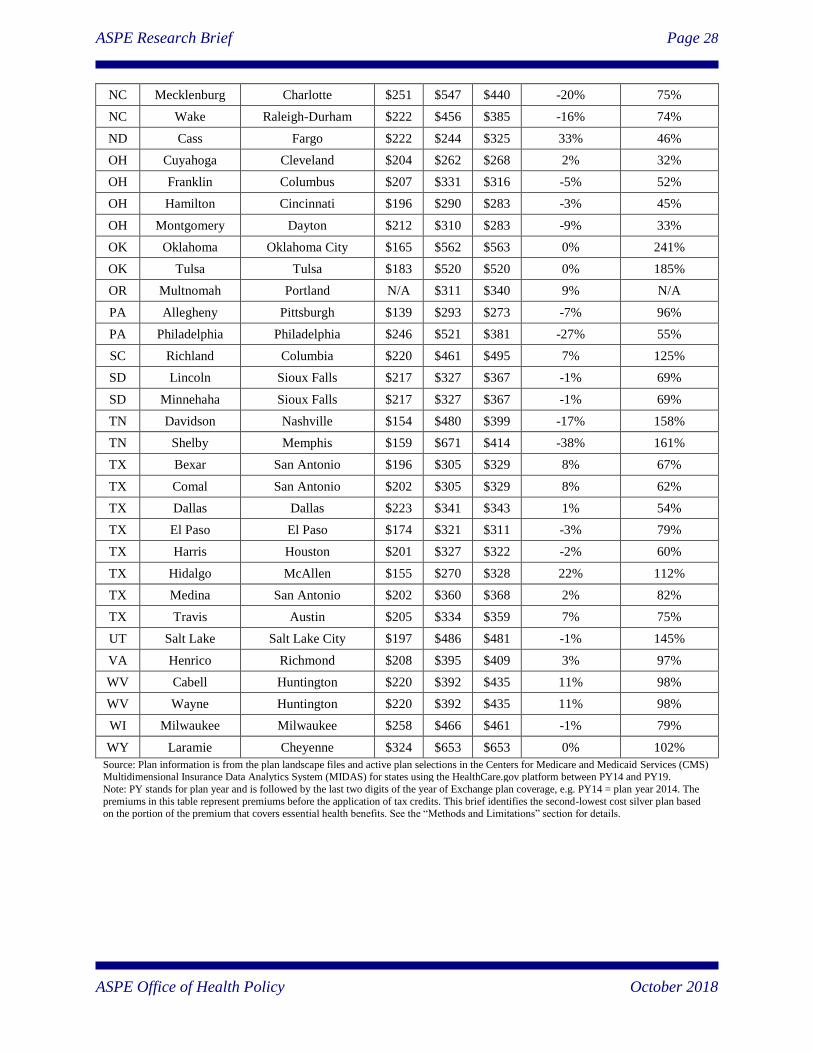
Table 3B
Monthly Premium for the Second-Lowest Cost Silver Plan (SLCSP) for a 27-Year-Old in Selected
Counties in HealthCare.gov States, PY14, PY18, and PY19
State County City in County
SLCSP Monthly Premium for a 27-Year-Old
PY14 PY18 PY19 Percent Change
PY18–PY19 PY14–PY19
AL Jefferson Birmingham $211 $447 $431 -4% 104%
AK Anchorage Anchorage $355 $582 $563 -3% 58%
AK Juneau Juneau $334 $596 $577 -3% 73%
AZ Maricopa Phoenix $161 $421 $350 -17% 117%
AZ Pima Tucson $138 $297 $279 -6% 102%
AR Pulaski Little Rock $251 $280 $312 1% 24%
DE New Castle Wilmington $237 $484 $561 16% 137%
FL Broward Ft. Lauderdale $199 $349 $363 4% 82%
FL Duval Jacksonville $210 $376 $385 2% 83%
FL Hillsborough Tampa $199 $360 $390 8% 96%
FL Miami-Dade Miami $221 $363 $367 1% 66%
FL Orange Orlando $225 $385 $388 1% 72%
FL Palm Beach West Palm Beach $220 $349 $370 6% 68%
GA Fulton Atlanta $205 $345 $361 4% 76%
HI Honolulu Honolulu N/A $378 $416 10% N/A
IL Cook Chicago $174 $337 $315 -7% 81%
IN Marion Indianapolis $290 $301 $309 3% 7%
IA Linn Cedar Rapids $209 $576 $594 3% 184%
KS Sedgwick Wichita $184 $397 $434 9% 136%
KS Wyandotte Kansas City $213 $468 $479 2% 125%
KY Fayette Lexington N/A $323 331 2% N/A
KY Jefferson Louisville N/A $327 304 -7% N/A
LA Orleans New Orleans $257 $335 $315 -6% 22%
ME Cumberland Portland $242 $421 $397 -6% 64%
MI Wayne Detroit $184 $272 $273 0% 49%
MS Jackson Jackson $332 $486 $500 3% 51%
MO Saint Louis St. Louis $216 $381 $345 -9% 60%
MT Gallatin Bozeman $206 $448 $484 8% 136%
NE Douglas Omaha $222 $617 $673 9% 203%
NV Clark Las Vegas N/A $315 $302 -4% N/A
NH Hillsborough Manchester $237 $389 $330 -15% 39%
NJ Essex Newark $264 $337 $285 -15% 8%
NM Bernalillo Albuquerque $159 $329 $280 -15% 76%
NC Guilford Greensboro $228 $519 $561 8% 146%
ASPE Research Brief Page 28
ASPE Office of Health Policy October 2018
NC Mecklenburg Charlotte $251 $547 $440 -20% 75%
NC Wake Raleigh-Durham $222 $456 $385 -16% 74%
ND Cass Fargo $222 $244 $325 33% 46%
OH Cuyahoga Cleveland $204 $262 $268 2% 32%
OH Franklin Columbus $207 $331 $316 -5% 52%
OH Hamilton Cincinnati $196 $290 $283 -3% 45%
OH Montgomery Dayton $212 $310 $283 -9% 33%
OK Oklahoma Oklahoma City $165 $562 $563 0% 241%
OK Tulsa Tulsa $183 $520 $520 0% 185%
OR Multnomah Portland N/A $311 $340 9% N/A
PA Allegheny Pittsburgh $139 $293 $273 -7% 96%
PA Philadelphia Philadelphia $246 $521 $381 -27% 55%
SC Richland Columbia $220 $461 $495 7% 125%
SD Lincoln Sioux Falls $217 $327 $367 -1% 69%
SD Minnehaha Sioux Falls $217 $327 $367 -1% 69%
TN Davidson Nashville $154 $480 $399 -17% 158%
TN Shelby Memphis $159 $671 $414 -38% 161%
TX Bexar San Antonio $196 $305 $329 8% 67%
TX Comal San Antonio $202 $305 $329 8% 62%
TX Dallas Dallas $223 $341 $343 1% 54%
TX El Paso El Paso $174 $321 $311 -3% 79%
TX Harris Houston $201 $327 $322 -2% 60%
TX Hidalgo McAllen $155 $270 $328 22% 112%
TX Medina San Antonio $202 $360 $368 2% 82%
TX Travis Austin $205 $334 $359 7% 75%
UT Salt Lake Salt Lake City $197 $486 $481 -1% 145%
VA Henrico Richmond $208 $395 $409 3% 97%
WV Cabell Huntington $220 $392 $435 11% 98%
WV Wayne Huntington $220 $392 $435 11% 98%
WI Milwaukee Milwaukee $258 $466 $461 -1% 79%
WY Laramie Cheyenne $324 $653 $653 0% 102%
Source: Plan information is from the plan landscape files and active plan selections in the Centers for Medicare and Medicaid Services (CMS) Multidimensional Insurance Data Analytics System (MIDAS) for states using the HealthCare.gov platform between PY14 and PY19.
Note: PY stands for plan year and is followed by the last two digits of the year of Exchange plan coverage, e.g. PY14 = plan year 2014. The
premiums in this table represent premiums before the application of tax credits. This brief identifies the second-lowest cost silver plan based on the portion of the premium that covers essential health benefits. See the “Methods and Limitations” section for details.
ASPE Research Brief Page 29
ASPE Office of Health Policy October 2018
Table 4A
Average Monthly Premium for the Lowest-Cost Plan (LCP) for a 27-Year-Old in HealthCare.gov
States, PY14, PY18, and PY19
State
LCP Average Monthly Premium for a 27-Year-Old
PY14 PY18 PY19 Percent Change
PY18-PY19 PY14-PY19
All States Using HealthCare.gov
for the Listed Plan Year $164 $291 $288 -1% 75%
AK $254 $443 $387 -13% 53%
AL $163 $290 $293 1% 80%
AR $181 $243 $262 8% 45%
AZ $140 $326 $293 -10% 110%
DE $203 $388 $368 -5% 82%
FL $164 $256 $282 10% 72%
GA $177 $335 $290 -14% 63%
HI N/A $275 $296 8% N/A
IA $147 $475 $382 -20% 159%
ID $152 N/A N/A N/A N/A
IL $133 $284 $300 6% 125%
IN $208 $251 $259 3% 24%
KS $130 $305 $327 7% 151%
KY N/A $255 $267 5% N/A
LA $177 $301 $279 -7% 57%
ME $216 $310 $307 -1% 42%
MI $149 $204 $208 2% 40%
MO $160 $316 $323 2% 101%
MS $230 $380 $373 -2% 62%
MT $165 $285 $311 9% 88%
NC $188 $380 $341 -10% 81%
ND $186 $246 $253 3% 36%
NE $159 $466 $427 -8% 169%
NH $186 $321 $248 -23% 34%
NJ $230 $269 $233 -13% 1%
NM $141 $222 $205 -8% 46%
NV N/A $269 $269 0% N/A
OH $175 $235 $243 3% 39%
OK $114 $324 $296 -9% 159%
OR N/A $248 $265 7% N/A
PA $159 $299 $293 -2% 84%
SC $174 $299 $306 2% 76%
SD $196 $328 $337 3% 72%
ASPE Research Brief Page 30
ASPE Office of Health Policy October 2018
TN $119 $337 $288 -14% 143%
TX $140 $254 $256 1% 83%
UT $155 $285 $273 -4% 76%
VA $157 $326 $336 3% 114%
WI $195 $342 $307 -10% 58%
WV $184 $385 $420 9% 128%
WY $288 $476 $473 -1% 64%
Source: Plan information is from the plan landscape files and active plan selections in the Centers for Medicare and Medicaid Services (CMS) Multidimensional Insurance Data Analytics System (MIDAS) for states using the HealthCare.gov platform between PY14 and PY19.
Note: PY stands for plan year and is followed by the last two digits of the year of Exchange plan coverage, e.g. PY14 = plan year 2014. The
numbers in this table represent premiums before the application of advance premium tax credits. HealthCare.gov average premiums are weighted by the number of Exchange plan selections in each county. The PY14 through PY18 average premiums are weighted by current year
plan selections and PY19 are weighted by PY18 plan selections. This analysis identifies the lowest-cost plan in each county based on the
portion of the premium that covers essential health benefits. Catastrophic plans, which are not available to all consumers, were not considered in these calculations. Estimates include all states using the HealthCare.gov platform in the specified plan year. See the “Methods and
Limitations” section for details.
ASPE Research Brief Page 31
ASPE Office of Health Policy October 2018
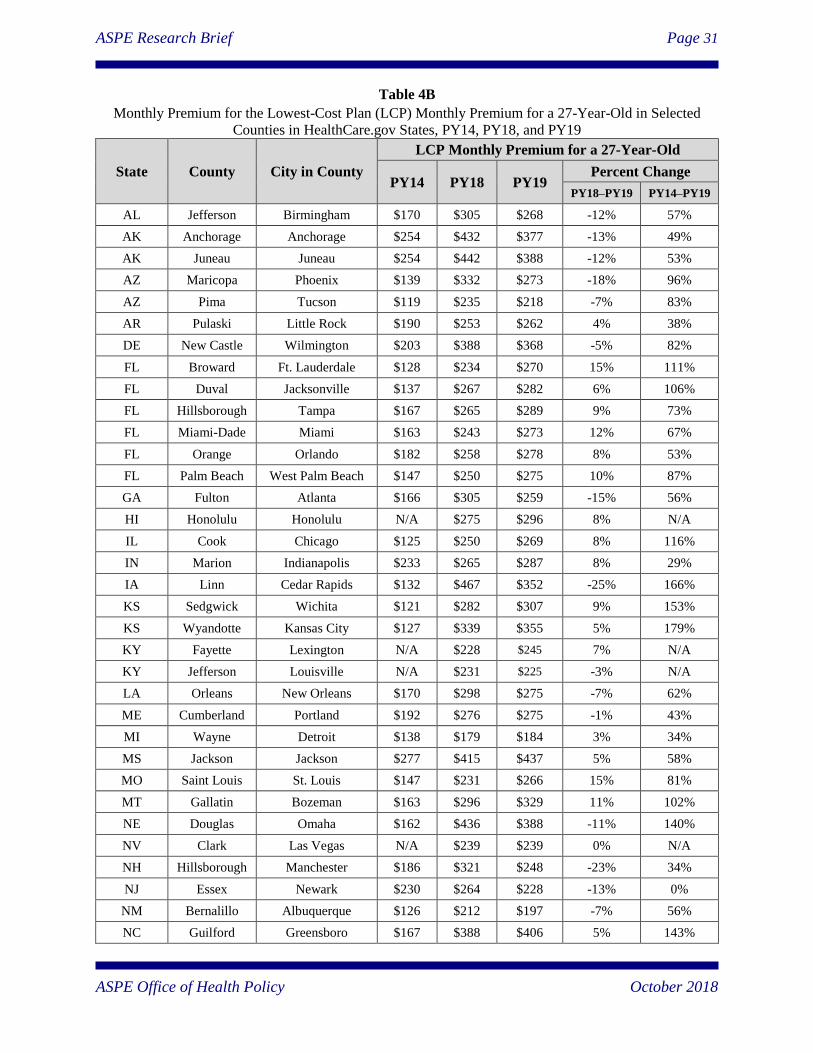
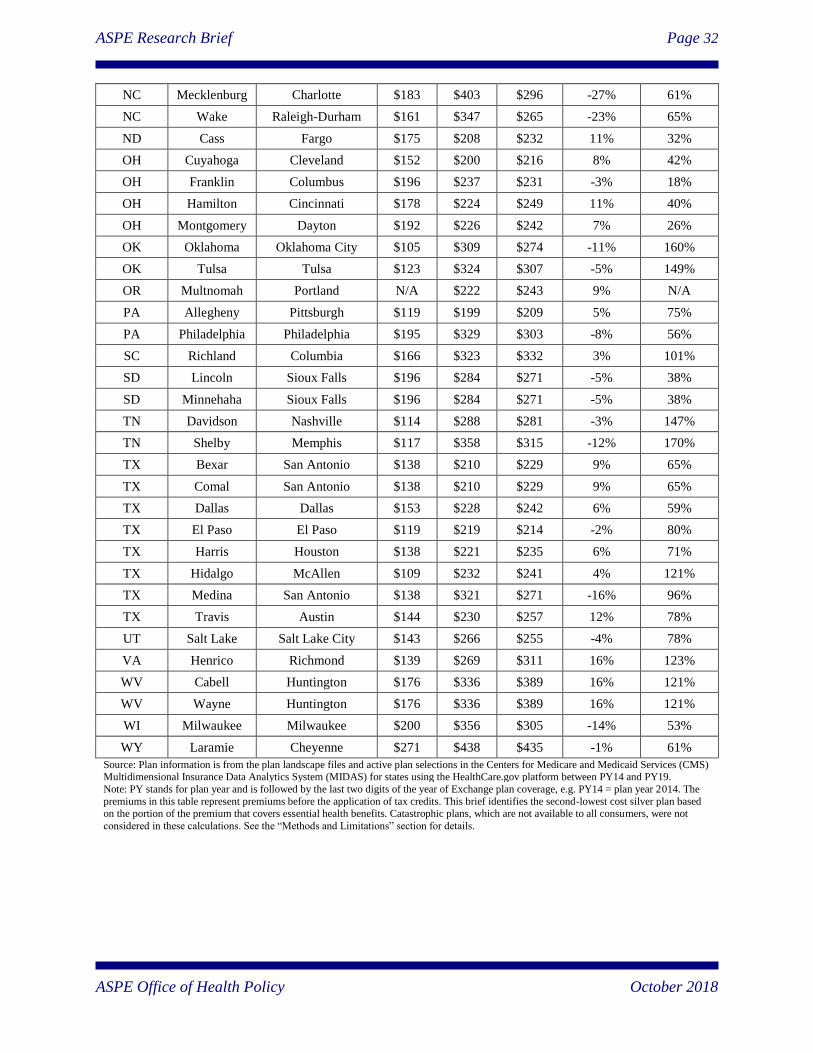
Table 4B
Monthly Premium for the Lowest-Cost Plan (LCP) Monthly Premium for a 27-Year-Old in Selected
Counties in HealthCare.gov States, PY14, PY18, and PY19
State County City in County
LCP Monthly Premium for a 27-Year-Old
PY14 PY18 PY19 Percent Change
PY18–PY19 PY14–PY19
AL Jefferson Birmingham $170 $305 $268 -12% 57%
AK Anchorage Anchorage $254 $432 $377 -13% 49%
AK Juneau Juneau $254 $442 $388 -12% 53%
AZ Maricopa Phoenix $139 $332 $273 -18% 96%
AZ Pima Tucson $119 $235 $218 -7% 83%
AR Pulaski Little Rock $190 $253 $262 4% 38%
DE New Castle Wilmington $203 $388 $368 -5% 82%
FL Broward Ft. Lauderdale $128 $234 $270 15% 111%
FL Duval Jacksonville $137 $267 $282 6% 106%
FL Hillsborough Tampa $167 $265 $289 9% 73%
FL Miami-Dade Miami $163 $243 $273 12% 67%
FL Orange Orlando $182 $258 $278 8% 53%
FL Palm Beach West Palm Beach $147 $250 $275 10% 87%
GA Fulton Atlanta $166 $305 $259 -15% 56%
HI Honolulu Honolulu N/A $275 $296 8% N/A
IL Cook Chicago $125 $250 $269 8% 116%
IN Marion Indianapolis $233 $265 $287 8% 29%
IA Linn Cedar Rapids $132 $467 $352 -25% 166%
KS Sedgwick Wichita $121 $282 $307 9% 153%
KS Wyandotte Kansas City $127 $339 $355 5% 179%
KY Fayette Lexington N/A $228 $245 7% N/A
KY Jefferson Louisville N/A $231 $225 -3% N/A
LA Orleans New Orleans $170 $298 $275 -7% 62%
ME Cumberland Portland $192 $276 $275 -1% 43%
MI Wayne Detroit $138 $179 $184 3% 34%
MS Jackson Jackson $277 $415 $437 5% 58%
MO Saint Louis St. Louis $147 $231 $266 15% 81%
MT Gallatin Bozeman $163 $296 $329 11% 102%
NE Douglas Omaha $162 $436 $388 -11% 140%
NV Clark Las Vegas N/A $239 $239 0% N/A
NH Hillsborough Manchester $186 $321 $248 -23% 34%
NJ Essex Newark $230 $264 $228 -13% 0%
NM Bernalillo Albuquerque $126 $212 $197 -7% 56%
NC Guilford Greensboro $167 $388 $406 5% 143%
ASPE Research Brief Page 32
ASPE Office of Health Policy October 2018
NC Mecklenburg Charlotte $183 $403 $296 -27% 61%
NC Wake Raleigh-Durham $161 $347 $265 -23% 65%
ND Cass Fargo $175 $208 $232 11% 32%
OH Cuyahoga Cleveland $152 $200 $216 8% 42%
OH Franklin Columbus $196 $237 $231 -3% 18%
OH Hamilton Cincinnati $178 $224 $249 11% 40%
OH Montgomery Dayton $192 $226 $242 7% 26%
OK Oklahoma Oklahoma City $105 $309 $274 -11% 160%
OK Tulsa Tulsa $123 $324 $307 -5% 149%
OR Multnomah Portland N/A $222 $243 9% N/A
PA Allegheny Pittsburgh $119 $199 $209 5% 75%
PA Philadelphia Philadelphia $195 $329 $303 -8% 56%
SC Richland Columbia $166 $323 $332 3% 101%
SD Lincoln Sioux Falls $196 $284 $271 -5% 38%
SD Minnehaha Sioux Falls $196 $284 $271 -5% 38%
TN Davidson Nashville $114 $288 $281 -3% 147%
TN Shelby Memphis $117 $358 $315 -12% 170%
TX Bexar San Antonio $138 $210 $229 9% 65%
TX Comal San Antonio $138 $210 $229 9% 65%
TX Dallas Dallas $153 $228 $242 6% 59%
TX El Paso El Paso $119 $219 $214 -2% 80%
TX Harris Houston $138 $221 $235 6% 71%
TX Hidalgo McAllen $109 $232 $241 4% 121%
TX Medina San Antonio $138 $321 $271 -16% 96%
TX Travis Austin $144 $230 $257 12% 78%
UT Salt Lake Salt Lake City $143 $266 $255 -4% 78%
VA Henrico Richmond $139 $269 $311 16% 123%
WV Cabell Huntington $176 $336 $389 16% 121%
WV Wayne Huntington $176 $336 $389 16% 121%
WI Milwaukee Milwaukee $200 $356 $305 -14% 53%
WY Laramie Cheyenne $271 $438 $435 -1% 61%
Source: Plan information is from the plan landscape files and active plan selections in the Centers for Medicare and Medicaid Services (CMS) Multidimensional Insurance Data Analytics System (MIDAS) for states using the HealthCare.gov platform between PY14 and PY19.
Note: PY stands for plan year and is followed by the last two digits of the year of Exchange plan coverage, e.g. PY14 = plan year 2014. The
premiums in this table represent premiums before the application of tax credits. This brief identifies the second-lowest cost silver plan based on the portion of the premium that covers essential health benefits. Catastrophic plans, which are not available to all consumers, were not
considered in these calculations. See the “Methods and Limitations” section for details.
ASPE Research Brief Page 33
ASPE Office of Health Policy October 2018
Table 5A
Percentage of Enrollees Receiving Subsidies in HealthCare.gov States, PY14, PY18, and PY19
State Percentage of Plan Selections with APTC Percentage of Plan Selections with CSR
PY14 PY17 PY18 PY14 PY17 PY18
All States Using HealthCare.gov
for the Listed Plan Year 84% 84% 85% 60% 60% 54%
AK 86% 88% 88% 56% 41% 39%
AL 83% 90% 89% 66% 73% 70%
AR 88% 84% 85% 58% 56% 55%
AZ 75% 79% 82% 51% 51% 49%
DE 80% 81% 82% 46% 45% 45%
FL 90% 90% 91% 69% 72% 64%
GA 85% 87% 85% 64% 69% 65%
HI N/A 80% 79% N/A 58% 44%
IA 82% 86% 85% 49% 52% 41%
ID 89% N/A N/A 66% N/A N/A
IL 75% 79% 82% 45% 47% 42%
IN 87% 73% 67% 55% 47% 42%
KS 77% 84% 83% 52% 55% 44%
KY N/A 78% 75% N/A 51% 42%
LA 87% 86% 85% 59% 55% 49%
ME 88% 86% 85% 57% 53% 46%
MI 85% 81% 82% 63% 49% 42%
MO 84% 86% 83% 57% 56% 56%
MS 93% 89% 92% 73% 76% 82%
MT 84% 84% 84% 50% 42% 33%
NC 90% 90% 90% 65% 65% 61%
ND 82% 84% 83% 36% 46% 45%
NE 85% 91% 92% 53% 55% 46%
NH 76% 63% 71% 45% 36% 39%
NJ 82% 78% 77% 52% 51% 48%
NM 77% 71% 78% 50% 46% 32%
NV N/A 83% 82% N/A 55% 48%
OH 83% 75% 74% 48% 45% 37%
OK 77% 89% 90% 59% 61% 65%
OR N/A 73% 74% N/A 39% 35%
PA 79% 80% 85% 61% 55% 43%
SC 86% 88% 89% 64% 70% 58%
SD 88% 90% 91% 62% 58% 51%
TN 77% 85% 84% 62% 57% 57%
TX 82% 83% 85% 59% 61% 57%
ASPE Research Brief Page 34
ASPE Office of Health Policy October 2018
UT 84% 86% 88% 56% 60% 53%
VA 80% 82% 81% 55% 59% 56%
WI 89% 81% 84% 60% 51% 43%
WV 84% 84% 86% 55% 50% 47%
WY 91% 89% 91% 54% 54% 32%
Source: Plan information is from the plan landscape files and active plan selections in the Centers for Medicare and Medicaid Services (CMS)
Multidimensional Insurance Data Analytics System (MIDAS) for states using the HealthCare.gov platform between PY14 and PY19. Note: PY stands for plan year and is followed by the last two digits of the year of Exchange plan coverage, e.g. PY14 = plan year 2014.
Estimates based on plan selections made during the Open Enrollment Period for each specified plan year. See the “Methods and Limitations”
section for details. As of October 2017, CSR payments are no longer paid to issuers; however, issuers are still required by law to offer plans with CSRs to eligible enrollees if they participate in the Exchange. See the “Methods and Limitations” section for details.
ASPE Research Brief Page 35
ASPE Office of Health Policy October 2018
Table 6A
Average Monthly Benchmark Premiums and Advance Premium Tax Credits (APTCs) Available in HealthCare.gov States, PY18 and PY19
State
27 Year-old with a Household Income of $25,000 Family of Four with Household Income of $60,000
PY18 PY19 APTC %
Change PY18
– PY19
PY18 PY19 APTC %
Change PY18
– PY19 Benchmark
Before APTC APTC
Benchmark
Before APTC APTC
Benchmark
Before APTC APTC
Benchmark
Before APTC APTC
All States Using
HealthCare.gov for the
Listed Plan Year $412 $274 $405 $265 -3% $1,582 $1,185 $1,554 $1,155 -3%
AK $596 $496 $577 $476 -4% $2,307 $1,997 $2,232 $1,924 -4%
AL $458 $321 $448 $308 -4% $1,658 $1,265 $1,621 $1,223 -3%
AR $298 $161 $311 $170 6% $1,154 $762 $1,204 $803 5%
AZ $427 $289 $384 $244 -15% $1,653 $1,256 $1,487 $1,089 -13%
DE $484 $346 $561 $421 22% $1,874 $1,476 $2,172 $1,774 20%
FL $383 $246 $390 $250 2% $1,481 $1,088 $1,510 $1,111 2%
GA $397 $258 $398 $258 0% $1,538 $1,138 $1,540 $1,142 0%
HI $378 $246 $416 $289 17% $1,462 $1,051 $1,609 $1,223 16%
IA $585 $448 $624 $484 8% $2,264 $1,872 $2,412 $2,014 8%
IL $401 $263 $390 $249 -5% $1,550 $1,156 $1,507 $1,107 -4%
IN $287 $141 $280 $138 -2% $1,109 $685 $1,084 $678 -1%
KS $425 $288 $453 $313 9% $1,645 $1,253 $1,754 $1,356 8%
KY $355 $206 $378 $234 13% $1,372 $936 $1,463 $1,048 12%
LA $390 $253 $369 $229 -9% $1,509 $1,116 $1,429 $1,031 -8%
ME $482 $344 $445 $305 -11% $1,863 $1,468 $1,722 $1,324 -10%
MI $313 $176 $313 $173 -1% $1,210 $818 $1,212 $814 0%
MO $432 $295 $413 $270 -8% $1,671 $1,279 $1,596 $1,187 -7%
MS $445 $289 $427 $287 -1% $1,613 $1,149 $1,544 $1,146 0%
MT $430 $293 $460 $320 9% $1,665 $1,273 $1,779 $1,381 9%
NC $514 $376 $506 $366 -3% $1,987 $1,594 $1,957 $1,559 -2%
ND $310 $173 $375 $233 35% $1,200 $808 $1,450 $1,047 30%
ASPE Research Brief Page 36
ASPE Office of Health Policy October 2018
NE $629 $492 $686 $546 11% $2,433 $2,041 $2,655 $2,257 11%
NH $389 $252 $330 $190 -25% $1,506 $1,113 $1,276 $878 -21%
NJ $339 $201 $289 $149 -26% $1,311 $917 $1,119 $720 -22%
NM $340 $203 $300 $159 -22% $1,316 $923 $1,160 $758 -18%
NV $353 $215 $337 $197 -9% $1,365 $972 $1,304 $906 -7%
OH $313 $167 $313 $173 3% $1,209 $785 $1,211 $811 3%
OK $540 $403 $571 $431 7% $2,090 $1,697 $2,210 $1,812 7%
OR $342 $201 $365 $223 11% $1,239 $833 $1,320 $915 10%
PA $472 $334 $398 $257 -23% $1,825 $1,431 $1,538 $1,139 -20%
SC $427 $289 $454 $314 8% $1,653 $1,257 $1,755 $1,357 8%
SD $428 $291 $456 $316 8% $1,657 $1,265 $1,762 $1,364 8%
TN $608 $470 $448 $308 -35% $2,353 $1,958 $1,732 $1,334 -32%
TX $358 $221 $364 $223 1% $1,387 $993 $1,408 $1,007 1%
UT $523 $380 $512 $368 -3% $1,689 $1,280 $1,655 $1,242 -3%
VA $440 $302 $455 $315 4% $1,701 $1,305 $1,760 $1,362 4%
WI $467 $328 $441 $301 -8% $1,808 $1,409 $1,705 $1,307 -7%
WV $457 $311 $499 $348 12% $1,767 $1,342 $1,928 $1,488 11%
WY $709 $572 $709 $569 -1% $2,744 $2,351 $2,741 $2,343 0%
Source: Plan information is from the plan landscape files and active plan selections in the Centers for Medicare and Medicaid Services (CMS) Multidimensional Insurance Data Analytics System (MIDAS) for states using the HealthCare.gov platform between PY18 and PY19.
Note: PY stands for plan year and is followed by the last two digits of the year of Exchange plan coverage, e.g. PY14 = plan year 2014. Averages for premiums are weighted by the county’s number
of Exchange PY18 plan selections. In this example, the family of four is one 40-year-old adult, one 38-year-old adult, and two children under the age of 15. All enrollees are assumed to not be tobacco users. For households eligible for premium tax credits, after-tax-credit benchmark premiums are capped at a given percentage of household income. The maximum percent of income paid
toward the benchmark plan is adjusted annually to be a measure of the difference between premium growth and income growth. If the premium of the benchmark plan falls below the maximum
applicable percentage of income amount for which a household is responsible, then the household does not receive a tax credit and pays for the full premium for the plan selected. After-tax benchmark premiums will differ slightly between PY18 and PY19 for identical family compositions and income amounts because of changes in the applicable percentages and the Federal Poverty
Level (FPL) Guidelines. Alaska and Hawaii’s Federal poverty guidelines are higher than those for the continental United States; consequently, the after tax credit premium is lower for a given
amount of income. Our calculations of premiums after tax credits assume that all members of the family of four making $60,000 would be eligible for premium tax credits. However, in states with higher Medicaid of Children’s Health Insurance Program (CHIP) thresholds, the children would be eligible for Medicaid/CHIP and not eligible for premium tax credits. Starting for PY19, new
regulation modified the methodology of determining the APTC amount attributable to children under 19 on an individual or family policy, in which the premium of a stand-alone dental plan is added
to the premium of any plan not offering pediatric dental benefits for purposes of determining the benchmark plan and resultant APTC amount. The data presented in this table do not take this change into account. See the “Methods and Limitations” section for details.
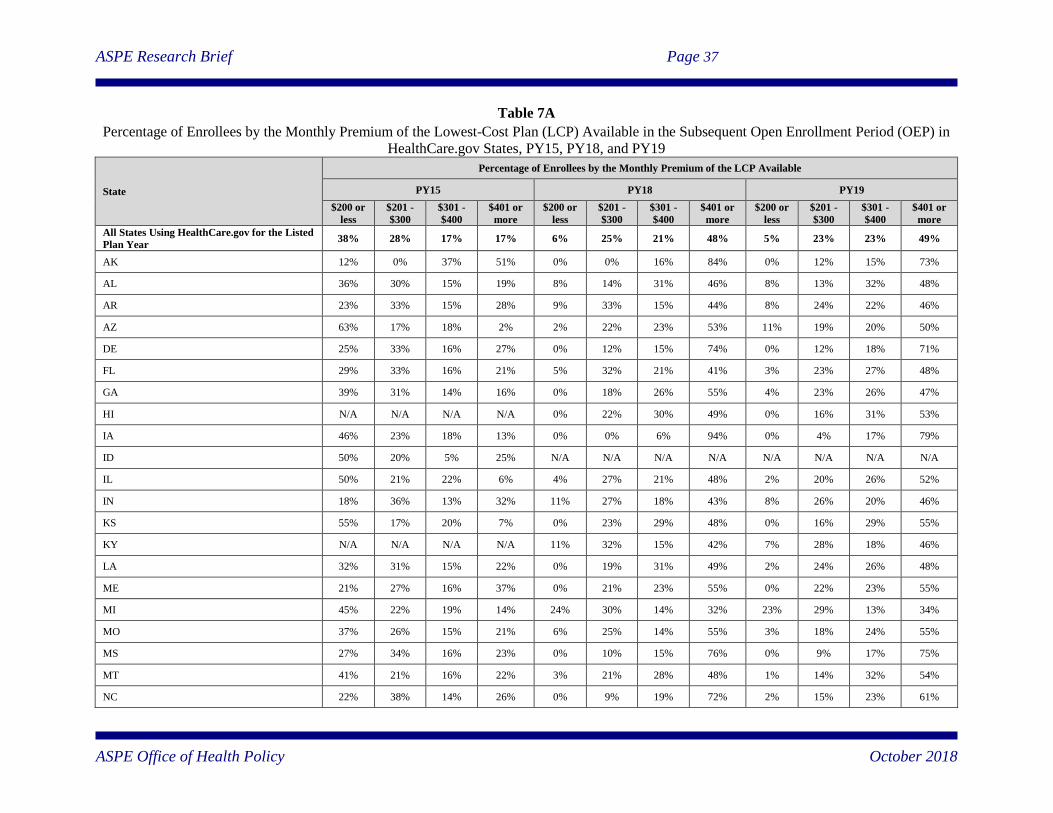
ASPE Research Brief Page 37
ASPE Office of Health Policy October 2018
Table 7A
Percentage of Enrollees by the Monthly Premium of the Lowest-Cost Plan (LCP) Available in the Subsequent Open Enrollment Period (OEP) in
HealthCare.gov States, PY15, PY18, and PY19
State
Percentage of Enrollees by the Monthly Premium of the LCP Available
PY15 PY18 PY19
$200 or
less
$201 -
$300
$301 -
$400
$401 or
more
$200 or
less
$201 -
$300
$301 -
$400
$401 or
more
$200 or
less
$201 -
$300
$301 -
$400
$401 or
more
All States Using HealthCare.gov for the Listed
Plan Year 38% 28% 17% 17% 6% 25% 21% 48% 5% 23% 23% 49%
AK 12% 0% 37% 51% 0% 0% 16% 84% 0% 12% 15% 73%
AL 36% 30% 15% 19% 8% 14% 31% 46% 8% 13% 32% 48%
AR 23% 33% 15% 28% 9% 33% 15% 44% 8% 24% 22% 46%
AZ 63% 17% 18% 2% 2% 22% 23% 53% 11% 19% 20% 50%
DE 25% 33% 16% 27% 0% 12% 15% 74% 0% 12% 18% 71%
FL 29% 33% 16% 21% 5% 32% 21% 41% 3% 23% 27% 48%
GA 39% 31% 14% 16% 0% 18% 26% 55% 4% 23% 26% 47%
HI N/A N/A N/A N/A 0% 22% 30% 49% 0% 16% 31% 53%
IA 46% 23% 18% 13% 0% 0% 6% 94% 0% 4% 17% 79%
ID 50% 20% 5% 25% N/A N/A N/A N/A N/A N/A N/A N/A
IL 50% 21% 22% 6% 4% 27% 21% 48% 2% 20% 26% 52%
IN 18% 36% 13% 32% 11% 27% 18% 43% 8% 26% 20% 46%
KS 55% 17% 20% 7% 0% 23% 29% 48% 0% 16% 29% 55%
KY N/A N/A N/A N/A 11% 32% 15% 42% 7% 28% 18% 46%
LA 32% 31% 15% 22% 0% 19% 31% 49% 2% 24% 26% 48%
ME 21% 27% 16% 37% 0% 21% 23% 55% 0% 22% 23% 55%
MI 45% 22% 19% 14% 24% 30% 14% 32% 23% 29% 13% 34%
MO 37% 26% 15% 21% 6% 25% 14% 55% 3% 18% 24% 55%
MS 27% 34% 16% 23% 0% 10% 15% 76% 0% 9% 17% 75%
MT 41% 21% 16% 22% 3% 21% 28% 48% 1% 14% 32% 54%
NC 22% 38% 14% 26% 0% 9% 19% 72% 2% 15% 23% 61%
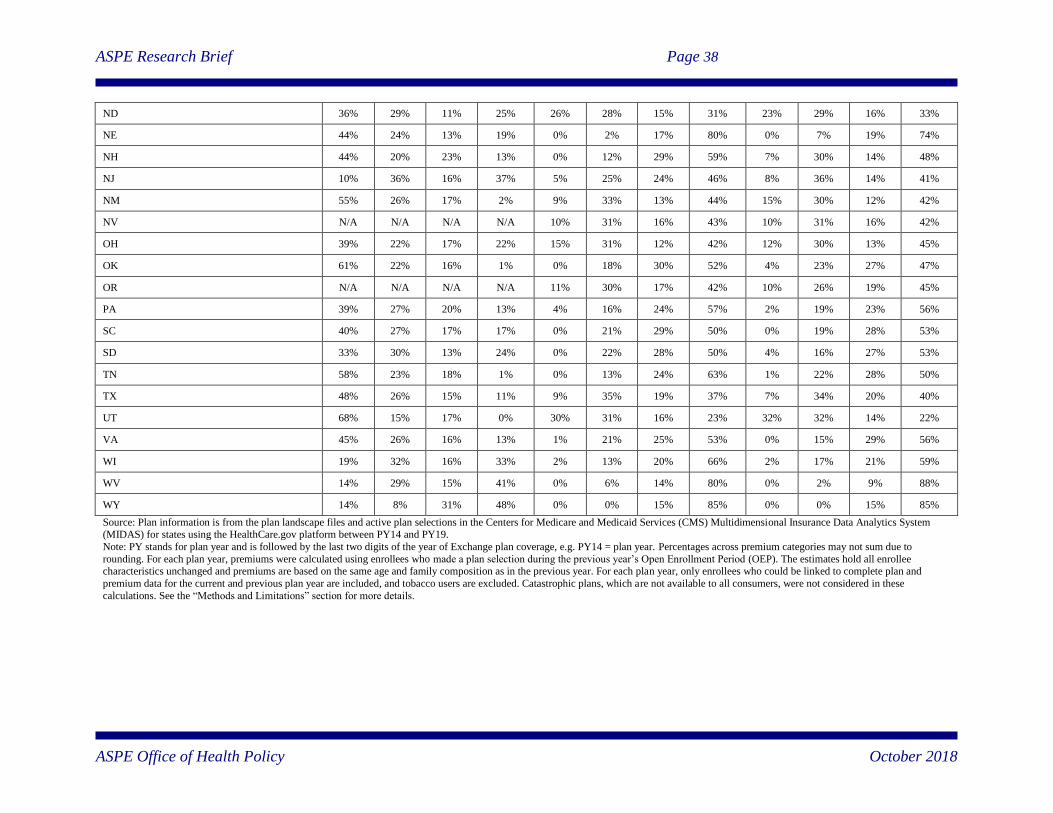
ASPE Research Brief Page 38
ASPE Office of Health Policy October 2018
ND 36% 29% 11% 25% 26% 28% 15% 31% 23% 29% 16% 33%
NE 44% 24% 13% 19% 0% 2% 17% 80% 0% 7% 19% 74%
NH 44% 20% 23% 13% 0% 12% 29% 59% 7% 30% 14% 48%
NJ 10% 36% 16% 37% 5% 25% 24% 46% 8% 36% 14% 41%
NM 55% 26% 17% 2% 9% 33% 13% 44% 15% 30% 12% 42%
NV N/A N/A N/A N/A 10% 31% 16% 43% 10% 31% 16% 42%
OH 39% 22% 17% 22% 15% 31% 12% 42% 12% 30% 13% 45%
OK 61% 22% 16% 1% 0% 18% 30% 52% 4% 23% 27% 47%
OR N/A N/A N/A N/A 11% 30% 17% 42% 10% 26% 19% 45%
PA 39% 27% 20% 13% 4% 16% 24% 57% 2% 19% 23% 56%
SC 40% 27% 17% 17% 0% 21% 29% 50% 0% 19% 28% 53%
SD 33% 30% 13% 24% 0% 22% 28% 50% 4% 16% 27% 53%
TN 58% 23% 18% 1% 0% 13% 24% 63% 1% 22% 28% 50%
TX 48% 26% 15% 11% 9% 35% 19% 37% 7% 34% 20% 40%
UT 68% 15% 17% 0% 30% 31% 16% 23% 32% 32% 14% 22%
VA 45% 26% 16% 13% 1% 21% 25% 53% 0% 15% 29% 56%
WI 19% 32% 16% 33% 2% 13% 20% 66% 2% 17% 21% 59%
WV 14% 29% 15% 41% 0% 6% 14% 80% 0% 2% 9% 88%
WY 14% 8% 31% 48% 0% 0% 15% 85% 0% 0% 15% 85%
Source: Plan information is from the plan landscape files and active plan selections in the Centers for Medicare and Medicaid Services (CMS) Multidimensional Insurance Data Analytics System (MIDAS) for states using the HealthCare.gov platform between PY14 and PY19.
Note: PY stands for plan year and is followed by the last two digits of the year of Exchange plan coverage, e.g. PY14 = plan year. Percentages across premium categories may not sum due to
rounding. For each plan year, premiums were calculated using enrollees who made a plan selection during the previous year’s Open Enrollment Period (OEP). The estimates hold all enrollee characteristics unchanged and premiums are based on the same age and family composition as in the previous year. For each plan year, only enrollees who could be linked to complete plan and
premium data for the current and previous plan year are included, and tobacco users are excluded. Catastrophic plans, which are not available to all consumers, were not considered in these
calculations. See the “Methods and Limitations” section for more details.
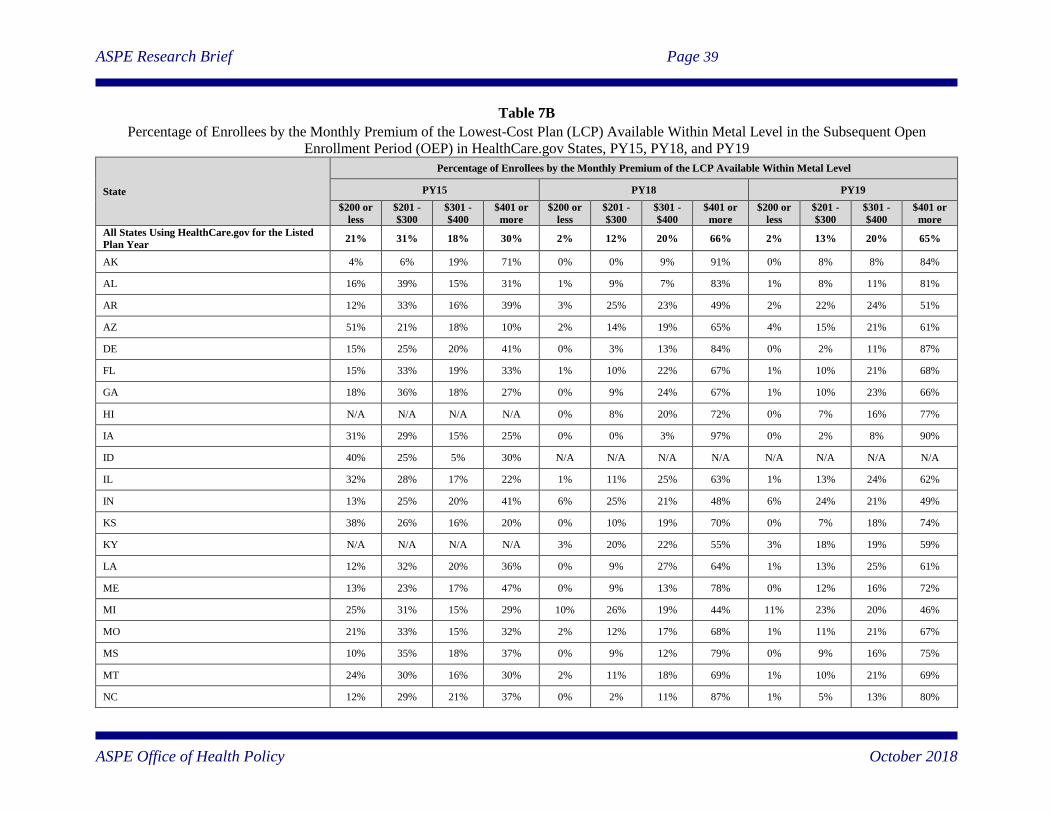
ASPE Research Brief Page 39
ASPE Office of Health Policy October 2018
Table 7B
Percentage of Enrollees by the Monthly Premium of the Lowest-Cost Plan (LCP) Available Within Metal Level in the Subsequent Open
Enrollment Period (OEP) in HealthCare.gov States, PY15, PY18, and PY19
State
Percentage of Enrollees by the Monthly Premium of the LCP Available Within Metal Level
PY15 PY18 PY19
$200 or
less
$201 -
$300
$301 -
$400
$401 or
more
$200 or
less
$201 -
$300
$301 -
$400
$401 or
more
$200 or
less
$201 -
$300
$301 -
$400
$401 or
more
All States Using HealthCare.gov for the Listed
Plan Year 21% 31% 18% 30% 2% 12% 20% 66% 2% 13% 20% 65%
AK 4% 6% 19% 71% 0% 0% 9% 91% 0% 8% 8% 84%
AL 16% 39% 15% 31% 1% 9% 7% 83% 1% 8% 11% 81%
AR 12% 33% 16% 39% 3% 25% 23% 49% 2% 22% 24% 51%
AZ 51% 21% 18% 10% 2% 14% 19% 65% 4% 15% 21% 61%
DE 15% 25% 20% 41% 0% 3% 13% 84% 0% 2% 11% 87%
FL 15% 33% 19% 33% 1% 10% 22% 67% 1% 10% 21% 68%
GA 18% 36% 18% 27% 0% 9% 24% 67% 1% 10% 23% 66%
HI N/A N/A N/A N/A 0% 8% 20% 72% 0% 7% 16% 77%
IA 31% 29% 15% 25% 0% 0% 3% 97% 0% 2% 8% 90%
ID 40% 25% 5% 30% N/A N/A N/A N/A N/A N/A N/A N/A
IL 32% 28% 17% 22% 1% 11% 25% 63% 1% 13% 24% 62%
IN 13% 25% 20% 41% 6% 25% 21% 48% 6% 24% 21% 49%
KS 38% 26% 16% 20% 0% 10% 19% 70% 0% 7% 18% 74%
KY N/A N/A N/A N/A 3% 20% 22% 55% 3% 18% 19% 59%
LA 12% 32% 20% 36% 0% 9% 27% 64% 1% 13% 25% 61%
ME 13% 23% 17% 47% 0% 9% 13% 78% 0% 12% 16% 72%
MI 25% 31% 15% 29% 10% 26% 19% 44% 11% 23% 20% 46%
MO 21% 33% 15% 32% 2% 12% 17% 68% 1% 11% 21% 67%
MS 10% 35% 18% 37% 0% 9% 12% 79% 0% 9% 16% 75%
MT 24% 30% 16% 30% 2% 11% 18% 69% 1% 10% 21% 69%
NC 12% 29% 21% 37% 0% 2% 11% 87% 1% 5% 13% 80%
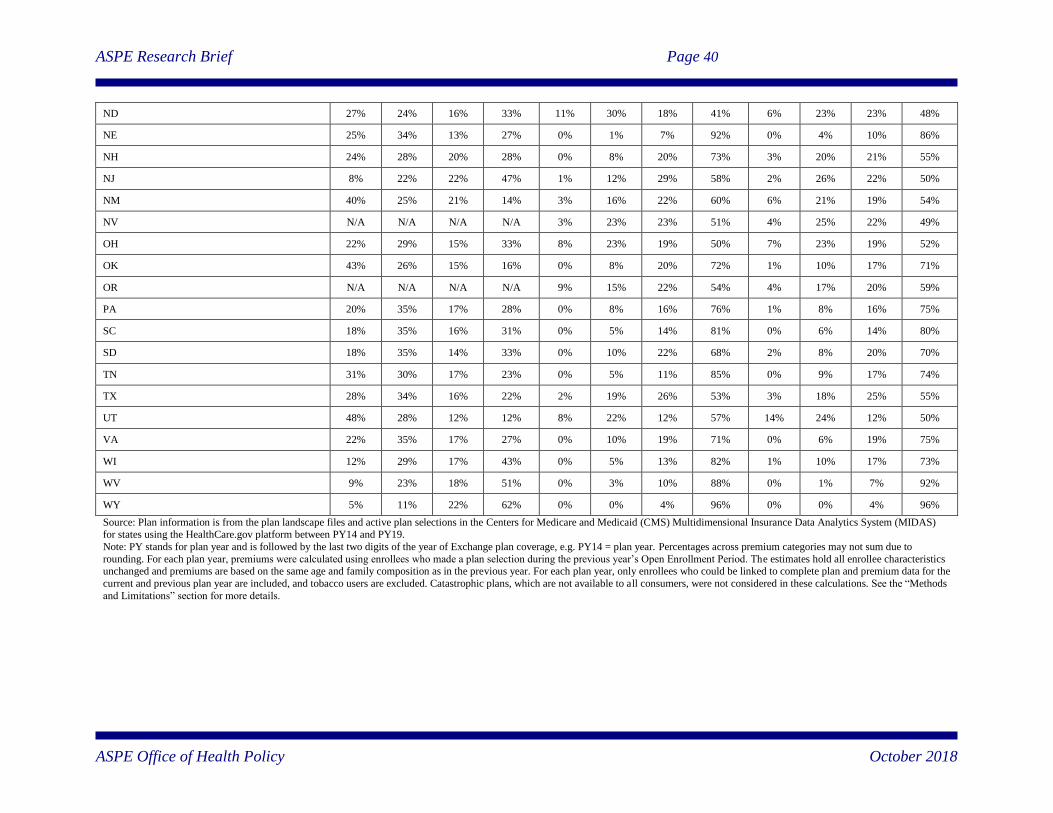
ASPE Research Brief Page 40
ASPE Office of Health Policy October 2018
ND 27% 24% 16% 33% 11% 30% 18% 41% 6% 23% 23% 48%
NE 25% 34% 13% 27% 0% 1% 7% 92% 0% 4% 10% 86%
NH 24% 28% 20% 28% 0% 8% 20% 73% 3% 20% 21% 55%
NJ 8% 22% 22% 47% 1% 12% 29% 58% 2% 26% 22% 50%
NM 40% 25% 21% 14% 3% 16% 22% 60% 6% 21% 19% 54%
NV N/A N/A N/A N/A 3% 23% 23% 51% 4% 25% 22% 49%
OH 22% 29% 15% 33% 8% 23% 19% 50% 7% 23% 19% 52%
OK 43% 26% 15% 16% 0% 8% 20% 72% 1% 10% 17% 71%
OR N/A N/A N/A N/A 9% 15% 22% 54% 4% 17% 20% 59%
PA 20% 35% 17% 28% 0% 8% 16% 76% 1% 8% 16% 75%
SC 18% 35% 16% 31% 0% 5% 14% 81% 0% 6% 14% 80%
SD 18% 35% 14% 33% 0% 10% 22% 68% 2% 8% 20% 70%
TN 31% 30% 17% 23% 0% 5% 11% 85% 0% 9% 17% 74%
TX 28% 34% 16% 22% 2% 19% 26% 53% 3% 18% 25% 55%
UT 48% 28% 12% 12% 8% 22% 12% 57% 14% 24% 12% 50%
VA 22% 35% 17% 27% 0% 10% 19% 71% 0% 6% 19% 75%
WI 12% 29% 17% 43% 0% 5% 13% 82% 1% 10% 17% 73%
WV 9% 23% 18% 51% 0% 3% 10% 88% 0% 1% 7% 92%
WY 5% 11% 22% 62% 0% 0% 4% 96% 0% 0% 4% 96%
Source: Plan information is from the plan landscape files and active plan selections in the Centers for Medicare and Medicaid (CMS) Multidimensional Insurance Data Analytics System (MIDAS) for states using the HealthCare.gov platform between PY14 and PY19.
Note: PY stands for plan year and is followed by the last two digits of the year of Exchange plan coverage, e.g. PY14 = plan year. Percentages across premium categories may not sum due to
rounding. For each plan year, premiums were calculated using enrollees who made a plan selection during the previous year’s Open Enrollment Period. The estimates hold all enrollee characteristics unchanged and premiums are based on the same age and family composition as in the previous year. For each plan year, only enrollees who could be linked to complete plan and premium data for the
current and previous plan year are included, and tobacco users are excluded. Catastrophic plans, which are not available to all consumers, were not considered in these calculations. See the “Methods
and Limitations” section for more details.
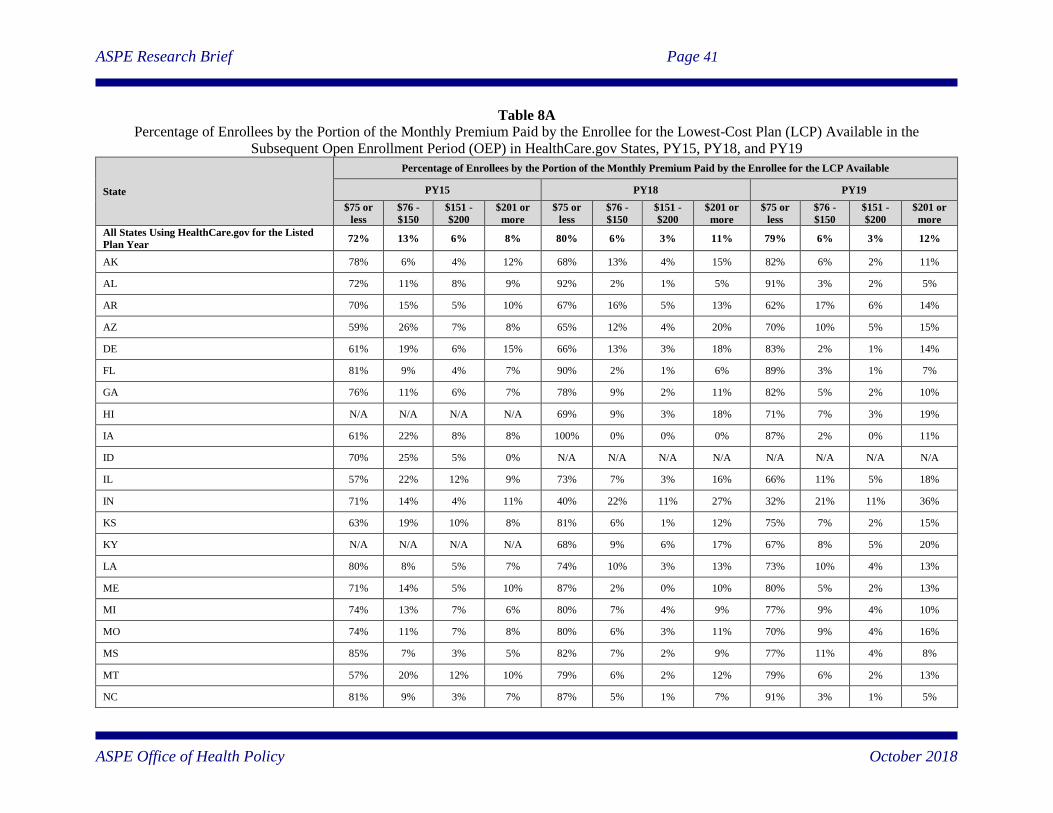
ASPE Research Brief Page 41
ASPE Office of Health Policy October 2018
Table 8A
Percentage of Enrollees by the Portion of the Monthly Premium Paid by the Enrollee for the Lowest-Cost Plan (LCP) Available in the
Subsequent Open Enrollment Period (OEP) in HealthCare.gov States, PY15, PY18, and PY19
State
Percentage of Enrollees by the Portion of the Monthly Premium Paid by the Enrollee for the LCP Available
PY15 PY18 PY19
$75 or
less
$76 -
$150
$151 -
$200
$201 or
more
$75 or
less
$76 -
$150
$151 -
$200
$201 or
more
$75 or
less
$76 -
$150
$151 -
$200
$201 or
more
All States Using HealthCare.gov for the Listed
Plan Year 72% 13% 6% 8% 80% 6% 3% 11% 79% 6% 3% 12%
AK 78% 6% 4% 12% 68% 13% 4% 15% 82% 6% 2% 11%
AL 72% 11% 8% 9% 92% 2% 1% 5% 91% 3% 2% 5%
AR 70% 15% 5% 10% 67% 16% 5% 13% 62% 17% 6% 14%
AZ 59% 26% 7% 8% 65% 12% 4% 20% 70% 10% 5% 15%
DE 61% 19% 6% 15% 66% 13% 3% 18% 83% 2% 1% 14%
FL 81% 9% 4% 7% 90% 2% 1% 6% 89% 3% 1% 7%
GA 76% 11% 6% 7% 78% 9% 2% 11% 82% 5% 2% 10%
HI N/A N/A N/A N/A 69% 9% 3% 18% 71% 7% 3% 19%
IA 61% 22% 8% 8% 100% 0% 0% 0% 87% 2% 0% 11%
ID 70% 25% 5% 0% N/A N/A N/A N/A N/A N/A N/A N/A
IL 57% 22% 12% 9% 73% 7% 3% 16% 66% 11% 5% 18%
IN 71% 14% 4% 11% 40% 22% 11% 27% 32% 21% 11% 36%
KS 63% 19% 10% 8% 81% 6% 1% 12% 75% 7% 2% 15%
KY N/A N/A N/A N/A 68% 9% 6% 17% 67% 8% 5% 20%
LA 80% 8% 5% 7% 74% 10% 3% 13% 73% 10% 4% 13%
ME 71% 14% 5% 10% 87% 2% 0% 10% 80% 5% 2% 13%
MI 74% 13% 7% 6% 80% 7% 4% 9% 77% 9% 4% 10%
MO 74% 11% 7% 8% 80% 6% 3% 11% 70% 9% 4% 16%
MS 85% 7% 3% 5% 82% 7% 2% 9% 77% 11% 4% 8%
MT 57% 20% 12% 10% 79% 6% 2% 12% 79% 6% 2% 13%
NC 81% 9% 3% 7% 87% 5% 1% 7% 91% 3% 1% 5%
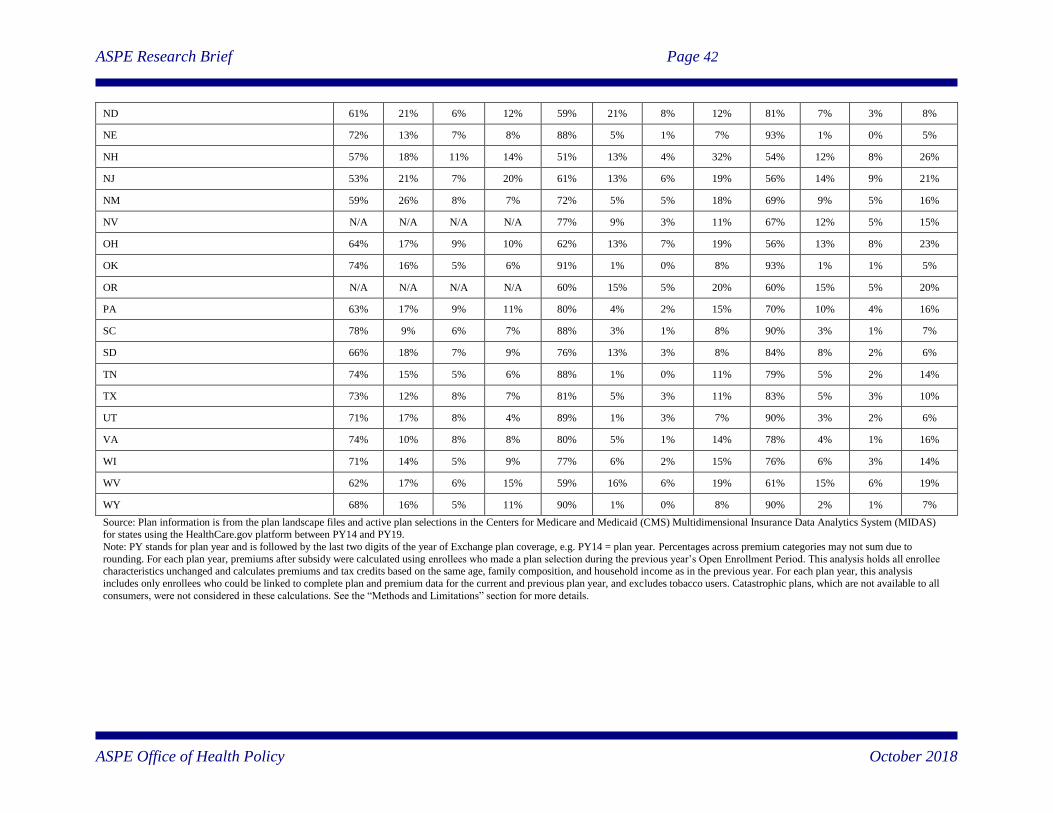
ASPE Research Brief Page 42
ASPE Office of Health Policy October 2018
ND 61% 21% 6% 12% 59% 21% 8% 12% 81% 7% 3% 8%
NE 72% 13% 7% 8% 88% 5% 1% 7% 93% 1% 0% 5%
NH 57% 18% 11% 14% 51% 13% 4% 32% 54% 12% 8% 26%
NJ 53% 21% 7% 20% 61% 13% 6% 19% 56% 14% 9% 21%
NM 59% 26% 8% 7% 72% 5% 5% 18% 69% 9% 5% 16%
NV N/A N/A N/A N/A 77% 9% 3% 11% 67% 12% 5% 15%
OH 64% 17% 9% 10% 62% 13% 7% 19% 56% 13% 8% 23%
OK 74% 16% 5% 6% 91% 1% 0% 8% 93% 1% 1% 5%
OR N/A N/A N/A N/A 60% 15% 5% 20% 60% 15% 5% 20%
PA 63% 17% 9% 11% 80% 4% 2% 15% 70% 10% 4% 16%
SC 78% 9% 6% 7% 88% 3% 1% 8% 90% 3% 1% 7%
SD 66% 18% 7% 9% 76% 13% 3% 8% 84% 8% 2% 6%
TN 74% 15% 5% 6% 88% 1% 0% 11% 79% 5% 2% 14%
TX 73% 12% 8% 7% 81% 5% 3% 11% 83% 5% 3% 10%
UT 71% 17% 8% 4% 89% 1% 3% 7% 90% 3% 2% 6%
VA 74% 10% 8% 8% 80% 5% 1% 14% 78% 4% 1% 16%
WI 71% 14% 5% 9% 77% 6% 2% 15% 76% 6% 3% 14%
WV 62% 17% 6% 15% 59% 16% 6% 19% 61% 15% 6% 19%
WY 68% 16% 5% 11% 90% 1% 0% 8% 90% 2% 1% 7%
Source: Plan information is from the plan landscape files and active plan selections in the Centers for Medicare and Medicaid (CMS) Multidimensional Insurance Data Analytics System (MIDAS) for states using the HealthCare.gov platform between PY14 and PY19.
Note: PY stands for plan year and is followed by the last two digits of the year of Exchange plan coverage, e.g. PY14 = plan year. Percentages across premium categories may not sum due to
rounding. For each plan year, premiums after subsidy were calculated using enrollees who made a plan selection during the previous year’s Open Enrollment Period. This analysis holds all enrollee characteristics unchanged and calculates premiums and tax credits based on the same age, family composition, and household income as in the previous year. For each plan year, this analysis
includes only enrollees who could be linked to complete plan and premium data for the current and previous plan year, and excludes tobacco users. Catastrophic plans, which are not available to all
consumers, were not considered in these calculations. See the “Methods and Limitations” section for more details.
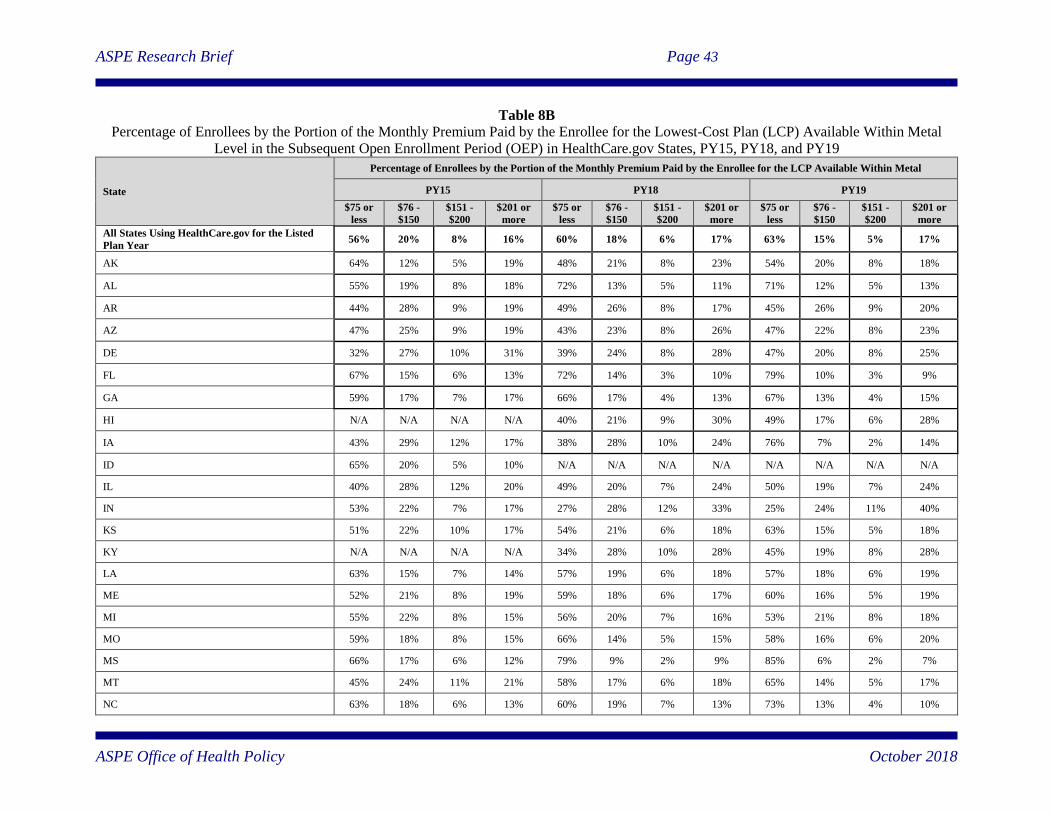
ASPE Research Brief Page 43
ASPE Office of Health Policy October 2018
Table 8B
Percentage of Enrollees by the Portion of the Monthly Premium Paid by the Enrollee for the Lowest-Cost Plan (LCP) Available Within Metal
Level in the Subsequent Open Enrollment Period (OEP) in HealthCare.gov States, PY15, PY18, and PY19
State
Percentage of Enrollees by the Portion of the Monthly Premium Paid by the Enrollee for the LCP Available Within Metal
PY15 PY18 PY19
$75 or
less
$76 -
$150
$151 -
$200
$201 or
more
$75 or
less
$76 -
$150
$151 -
$200
$201 or
more
$75 or
less
$76 -
$150
$151 -
$200
$201 or
more
All States Using HealthCare.gov for the Listed
Plan Year 56% 20% 8% 16% 60% 18% 6% 17% 63% 15% 5% 17%
AK 64% 12% 5% 19% 48% 21% 8% 23% 54% 20% 8% 18%
AL 55% 19% 8% 18% 72% 13% 5% 11% 71% 12% 5% 13%
AR 44% 28% 9% 19% 49% 26% 8% 17% 45% 26% 9% 20%
AZ 47% 25% 9% 19% 43% 23% 8% 26% 47% 22% 8% 23%
DE 32% 27% 10% 31% 39% 24% 8% 28% 47% 20% 8% 25%
FL 67% 15% 6% 13% 72% 14% 3% 10% 79% 10% 3% 9%
GA 59% 17% 7% 17% 66% 17% 4% 13% 67% 13% 4% 15%
HI N/A N/A N/A N/A 40% 21% 9% 30% 49% 17% 6% 28%
IA 43% 29% 12% 17% 38% 28% 10% 24% 76% 7% 2% 14%
ID 65% 20% 5% 10% N/A N/A N/A N/A N/A N/A N/A N/A
IL 40% 28% 12% 20% 49% 20% 7% 24% 50% 19% 7% 24%
IN 53% 22% 7% 17% 27% 28% 12% 33% 25% 24% 11% 40%
KS 51% 22% 10% 17% 54% 21% 6% 18% 63% 15% 5% 18%
KY N/A N/A N/A N/A 34% 28% 10% 28% 45% 19% 8% 28%
LA 63% 15% 7% 14% 57% 19% 6% 18% 57% 18% 6% 19%
ME 52% 21% 8% 19% 59% 18% 6% 17% 60% 16% 5% 19%
MI 55% 22% 8% 15% 56% 20% 7% 16% 53% 21% 8% 18%
MO 59% 18% 8% 15% 66% 14% 5% 15% 58% 16% 6% 20%
MS 66% 17% 6% 12% 79% 9% 2% 9% 85% 6% 2% 7%
MT 45% 24% 11% 21% 58% 17% 6% 18% 65% 14% 5% 17%
NC 63% 18% 6% 13% 60% 19% 7% 13% 73% 13% 4% 10%
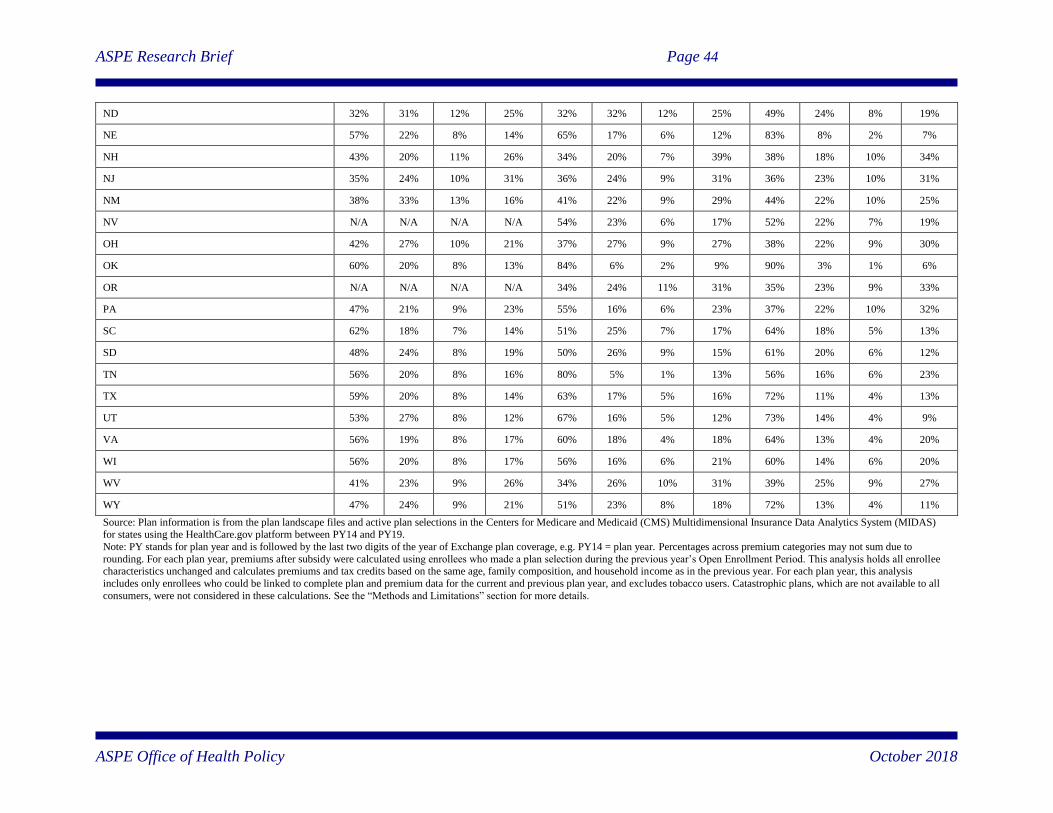
ASPE Research Brief Page 44
ASPE Office of Health Policy October 2018
ND 32% 31% 12% 25% 32% 32% 12% 25% 49% 24% 8% 19%
NE 57% 22% 8% 14% 65% 17% 6% 12% 83% 8% 2% 7%
NH 43% 20% 11% 26% 34% 20% 7% 39% 38% 18% 10% 34%
NJ 35% 24% 10% 31% 36% 24% 9% 31% 36% 23% 10% 31%
NM 38% 33% 13% 16% 41% 22% 9% 29% 44% 22% 10% 25%
NV N/A N/A N/A N/A 54% 23% 6% 17% 52% 22% 7% 19%
OH 42% 27% 10% 21% 37% 27% 9% 27% 38% 22% 9% 30%
OK 60% 20% 8% 13% 84% 6% 2% 9% 90% 3% 1% 6%
OR N/A N/A N/A N/A 34% 24% 11% 31% 35% 23% 9% 33%
PA 47% 21% 9% 23% 55% 16% 6% 23% 37% 22% 10% 32%
SC 62% 18% 7% 14% 51% 25% 7% 17% 64% 18% 5% 13%
SD 48% 24% 8% 19% 50% 26% 9% 15% 61% 20% 6% 12%
TN 56% 20% 8% 16% 80% 5% 1% 13% 56% 16% 6% 23%
TX 59% 20% 8% 14% 63% 17% 5% 16% 72% 11% 4% 13%
UT 53% 27% 8% 12% 67% 16% 5% 12% 73% 14% 4% 9%
VA 56% 19% 8% 17% 60% 18% 4% 18% 64% 13% 4% 20%
WI 56% 20% 8% 17% 56% 16% 6% 21% 60% 14% 6% 20%
WV 41% 23% 9% 26% 34% 26% 10% 31% 39% 25% 9% 27%
WY 47% 24% 9% 21% 51% 23% 8% 18% 72% 13% 4% 11%
Source: Plan information is from the plan landscape files and active plan selections in the Centers for Medicare and Medicaid (CMS) Multidimensional Insurance Data Analytics System (MIDAS) for states using the HealthCare.gov platform between PY14 and PY19.
Note: PY stands for plan year and is followed by the last two digits of the year of Exchange plan coverage, e.g. PY14 = plan year. Percentages across premium categories may not sum due to
rounding. For each plan year, premiums after subsidy were calculated using enrollees who made a plan selection during the previous year’s Open Enrollment Period. This analysis holds all enrollee characteristics unchanged and calculates premiums and tax credits based on the same age, family composition, and household income as in the previous year. For each plan year, this analysis
includes only enrollees who could be linked to complete plan and premium data for the current and previous plan year, and excludes tobacco users. Catastrophic plans, which are not available to all
consumers, were not considered in these calculations. See the “Methods and Limitations” section for more details.