
Asian Journal of Food and Agro-Industry - AJOFAI factors affecting production of... · Asian...
18
As. J. Food Ag-Ind. 2013, 6(06), 304-321 Asian Journal of Food and Agro-Industry ISSN 1906-3040 Available online at www.ajofai.info Research Article Different factors affecting production of fermented Jackfruit beverage Nguyen Phuoc Minh Tra Vinh University, Tra Vinh City, Vietnam. Email: [email protected] Abstract Through the process of jackfruit juice fermentation, the following conclusion has been drawn: after crushing jackfruit pulp, sterilization should be conducted to prevent oxidation and infection by adding NaHSO 3 as quickly as possible to avoid juice darkness owing to oxidative products and to destroy any harmful microorganisms. Jackfruit was diluted at the rate of fruit/water = 1/3 to retain the flavour and aroma of the product. Soluble dry matter content suitable for fermentation was found to be 20% and the yeast ratio used is 0.05%. After pouring the bottle capping for preservation, the fermented jackfruit beverage should be pasteurized at 70 o C within 10 minutes. During storage time (28 days), the soluble dry matter and acidity do not change significantly; the density of the total aerobic bacteria is lower than the limit allowed in fermented beverages. Keywords: yeast, soluble dry matter, acidity, Artocarpus heterophyllus, alcohol, Vietnam. 1. INTRODUCTION Jackfruit tree (Artocarpus heterophyllus) is familiar to the people of Vietnam because it is easily cultivated. Jackfruit and banana are grown all across Vietnam, mostly in rural areas. In Southeast Asia, jackfruit trees are either grown as house plants or are considered to be crops usually cultivated by poorer people. Being a large and heavy fruit it is not easily handled or transported. Jackfruit is not normally popular with Westerners due to the texture and the overwhelming smell. In addition, very few products are made from jackfruit and it is mostly eaten fresh. That limits the market for products and the income of fruit growers is very low. As a result, the cultivation of jackfruit is declining. The under-utilization of jackfruit and post-harvest losses has been a grave problem for cultivators. This particular fruit is not exploited fully despite the fact that it has a very good sugar content and antioxidant activity. In an effort to improve the value of the fruit, researchers have been examining various methods of adding value to the product through further processing, such as drying, making glace and chips.
Transcript of Asian Journal of Food and Agro-Industry - AJOFAI factors affecting production of... · Asian...

As. J. Food Ag-Ind. 2013, 6(06), 304-321
Asian Journal of
Food and Agro-Industry ISSN 1906-3040
Available online at www.ajofai.info
Research Article
Different factors affecting production of fermented Jackfruit beverage
Nguyen Phuoc Minh
Tra Vinh University, Tra Vinh City, Vietnam.
Email: [email protected]
Abstract
Through the process of jackfruit juice fermentation, the following conclusion has been drawn: after
crushing jackfruit pulp, sterilization should be conducted to prevent oxidation and infection by
adding NaHSO3 as quickly as possible to avoid juice darkness owing to oxidative products and
to destroy any harmful microorganisms. Jackfruit was diluted at the rate of fruit/water = 1/3 to
retain the flavour and aroma of the product. Soluble dry matter content suitable for fermentation
was found to be 20% and the yeast ratio used is 0.05%. After pouring the bottle capping for
preservation, the fermented jackfruit beverage should be pasteurized at 70oC within 10 minutes.
During storage time (28 days), the soluble dry matter and acidity do not change significantly; the
density of the total aerobic bacteria is lower than the limit allowed in fermented beverages.
Keywords: yeast, soluble dry matter, acidity, Artocarpus heterophyllus, alcohol, Vietnam.
1. INTRODUCTION
Jackfruit tree (Artocarpus heterophyllus) is familiar to the people of Vietnam because it is easily
cultivated. Jackfruit and banana are grown all across Vietnam, mostly in rural areas. In Southeast
Asia, jackfruit trees are either grown as house plants or are considered to be crops usually cultivated
by poorer people. Being a large and heavy fruit it is not easily handled or transported. Jackfruit is
not normally popular with Westerners due to the texture and the overwhelming smell. In addition,
very few products are made from jackfruit and it is mostly eaten fresh. That limits the market for
products and the income of fruit growers is very low. As a result, the cultivation of jackfruit is
declining. The under-utilization of jackfruit and post-harvest losses has been a grave problem for
cultivators. This particular fruit is not exploited fully despite the fact that it has a very good sugar
content and antioxidant activity. In an effort to improve the value of the fruit, researchers have been
examining various methods of adding value to the product through further processing, such as
drying, making glace and chips.
As. J. Food Ag-Ind. 2013, 6(06), 304-321 305
Fermented fruit juice is one possible avenue for adding value to jackfruit by fermenting the pulp in
combination with a suitable yeast. The product retains the characteristic aroma and the sweetness
of the fruit. Also, a small amount of ethanol is produced in the fermentation process. The final
beverage has a very low alcohol content, which also helps in digestion and enhancing its potential
popularity with all walks of people.
Compared to other types of beverages that are currently sold on the market,fermented beverages are
delicious and have much more cooling effect. They are more delicious because CO2 escapes due to
the fermentation reaction and will dissolve into the beverage then react with other substances to
create simple and complex esters, giving a more subdued taste and aroma. Cooling is also better
because when carbonated CO2 will evaporate and endothermics contribute to cooling.
Several notable studies on producing jackfruit beverages have been undertaken. S.M.R. Rahman et
al. (2001) utilized jackfruit juice in the manufacture of yogurt. Yogurt samples were prepared by
adding 5, 10 and 15% jackfruit juice with milk. The quality of prepared yogurt was measured by
some organoleptic, chemical and microbiological tests. Smell and taste; body and consistency;
colour and texture score of yogurt improved due to the addition of jackfruit juice. The addition of
jackfruit juice also increased the total solids content but decreased the protein, fat and ash content.
Yeast cells were higher in jackfruit yogurt (JFY) than plain yogurt. From this study it was suggested
that yogurt could be prepared successfully by adding different proportions of jackfruit juice with
milk and among of them 5% jackfruit juice yogurt showed the better performance. Rosnah
Shamsudin et al. (2009) examined the chemical composition of jackfruit juice during storage.
Chemical properties such as pH, total acidity, total soluble solids (TSS) and sugar content changes
during ripening of jackfruit were evaluated at ambient temperature (±27°C; 70-80% RH). There are
significant changes in pH, total soluble solids, total acidity and sugar content at different ripening
days. In this study, data obtained suggests that the ripening process of jackfruit was at its optimum
at day 9 after harvest at ambient temperature. The results will help to make the best use of jackfruit
for different purposes and applications.
D.K. Dushyantha et al. (2011) studied the fermentation of jackfruit juice by beneficial lactic acid
bacteria. Lactic acid bacteria were isolated from the jackfruit phyllosphere, perianth lobes and juice.
They were characterized and compared with standard lactic acid bacterial strain Lactobacillus
acidophilus for different characteristics. Among the isolated strains, lactic acid bacterial strain JFL1
was found superior to other isolates in fermenting the jackfruit juice. Hence, this strain was further
screened for beverage making. Casein and soy protein were supplemented as a nitrogen source for
enhancing the fermentation efficiency of strains. Beverage produced by supplementation of a
nitrogen source was found superior to beverage produced without.
Andri Cahyo Kumoro et al. (2012) prepared wine from jackfruit juice using Baker’s yeast and
studied the effect of yeast and initial sugar concentrations. This research investigated the effect of
yeast and initial sugar concentrations on jackfruit juice fermentation. Clarified jackfruit juice of 14
% w/w sugar concentration was fermented using 0.5 to 2.0% w/v Baker’s yeast (Saccharomyces
cerevisiae) under anaerobic conditions at 30°C for 14 days. Samples were collected daily for
ethanol and sugar contents analysis. The profile of sugar and ethanol concentration as a function of
fermentation time showed that a higher yeast inoculum rate and initial sugar concentration inhibited
growth of yeast. The fermentation of original jackfruit juice of 14 %w/w sugar concentration using
0.5% w/v yeast for 9 days was found to be the best to produce a good quality beverage with 12.13%
v/v of ethanol and specific jackfruit aroma.
As. J. Food Ag-Ind. 2013, 6(06), 304-321 306
C. Mondal et al. (2013) investigated product development from jackfruit and analyzed the
nutritional quality of the processed products. They developed products by processing different parts
of the fruit and the highest total soluble solids were observed from jelly (65.00%). The highest pH
was also found in jelly (5.047). Green pickle contain the highest amount of vitamin C (3.4433
mg/100 g) and carotenoids (22.78 mg/100 g). Sweet pickle contained the highest amount of
moisture (50.95%). After six months of storage, quality of the processed products regarding colour,
taste, flavour and texture were similar to that of freshly processed products. However, after 8-9
months of storage the quality of jam, jelly and squash started to deteriorate and the quality of
pickles (i.e., green pickle and sweet-pickle) remained unchanged even after 12 months of storage.
Nirmal Sharma et al. (2013) examined the process optimization for fermentation of wine from
jackfruit. Because of the sugar content present, jackfruit juice is a very good substrate for
fermentation. In order to minimize post-harvest losses, jackfruit juice can be used for wine
production. Their work was conducted to study the conditions that affect the fermentation of wine
from jackfruit. Jackfruit juice was divided into 3 parts and the pH was adjusted to 4, 5 and 6. The
juices with the adjusted pH were added to different bottles and maintained at a temperature of 27°C,
32°C, and 37°C. 9 bottles were used for each temperature condition, which contained an inoculum
concentration of 5%, 10% and 15% for each pH. Samples were collected on a weekly basis and
were tested for sugar content, alcohol content, polyphenol content, antioxidant activity and pH.
Jackfruit wine underwent an acidic fermentation and in most cases, fermentation was completed on
the 14th day, with a maximum alcohol content of 18%.
The purpose of this research is to create new products of good quality from fermented juice, with
long storage time. The influence of dilution ratio and product quality was examined, as well as the
influence of the ratio of yeast used and the dissolved dry matter content to fermentation time and
product quality and the effect of sterilization temperature on product quality.
Materials and Methods
Materials Ripe jackfruit, refine sugar and yeast Saccharomyces cerevisiae were used during this study.
Research method
Experiment 1: Effect of dilution to product quality
Purpose: determine initial water content before adding to ensure good sensory characteristics as
well economics reasons.
Preparation: ripe jackfruit is washed, crushed and water added.
Arrangement: random layout experiments repeated with 1 multiplication factor.
A factor: the ratio of additional water; A1: water/jackfruit = 2/1; A2: water/jackfruit = 2.5/1;
A3: water/jackfruit = 3/1; A4: water/jackfruit = 3.5/1.
Monitoring parameter: sensory, colour, aroma.
Experiment 2: Effect of yeast ratio and soluble dry matter to fermentation time and product quality
Purpose: determine yeast ratio and soluble dry matter suitable for fermentation and product quality.
Preparation: mixed jackfruit juice to be fermented with three levels of yeast ratio and three levels
of soluble dry matter ready for fermentation.
Arrangement: random layout repeat with 2 factors.
B factor: yeast ratio; B1= 0.01%; B2 = 0.05%; B3 = 0.1%
C factor: soluble dry matter (Brix); C1 = 16%; C2 = 20%; C3 = 24%
Monitoring parameter: sensory (status, colour, aroma, taste); Brix (Brix meter) and ethanol (ethanol
meter) by fermentation time.
As. J. Food Ag-Ind. 2013, 6(06), 304-321 307
Experiment 3: Effect of temperature and pasteurization time on product quality
Purpose: determine temperature and pasteurization time effects on product quality in minimum.
Preparation: after clearing, proceed to bottle pouring and pasteurization at three temperature levels
and three time levels intended.
Arrangement: random layout repeat with 2 factors.
T factor: pasteurization temperature; T1 = 60oC; T2 = 70
oC; T3 = 80
oC
M factor: pasteurization time; M1 = 5 minutes; M2 =10 minutes; M3 = 15 minutes
Monitoring parameter: sensory(status, colour, aroma, taste); residue soluble dry matter;
microorganisms (TPC)
Results and Discussion
Nutrient composition of jackfruit
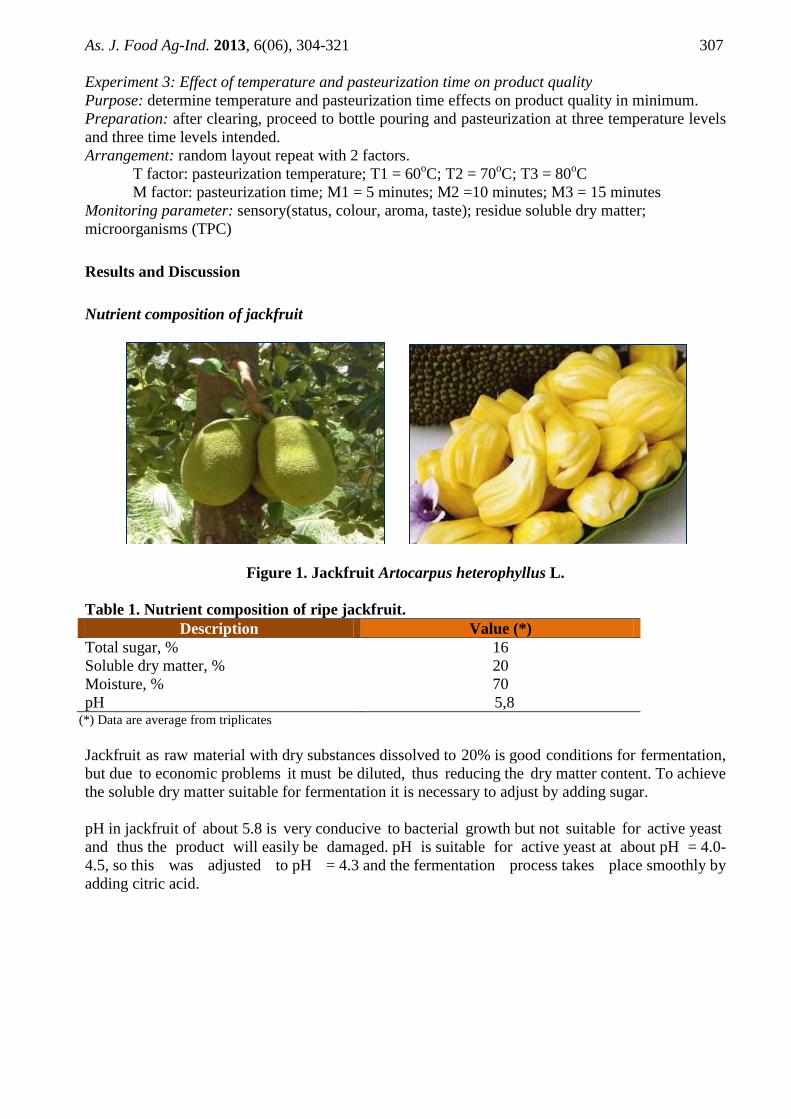
Figure 1. Jackfruit Artocarpus heterophyllus L.
Table 1. Nutrient composition of ripe jackfruit.
Description Value (*)
Total sugar, % 16
Soluble dry matter, % 20
Moisture, % 70
pH 5,8 (*) Data are average from triplicates
Jackfruit as raw material with dry substances dissolved to 20% is good conditions for fermentation,
but due to economic problems it must be diluted, thus reducing the dry matter content. To achieve
the soluble dry matter suitable for fermentation it is necessary to adjust by adding sugar.
pH in jackfruit of about 5.8 is very conducive to bacterial growth but not suitable for active yeast
and thus the product will easily be damaged. pH is suitable for active yeast at about pH = 4.0-
4.5, so this was adjusted to pH = 4.3 and the fermentation process takes place smoothly by
adding citric acid.
As. J. Food Ag-Ind. 2013, 6(06), 304-321 308
Effect of dilution on product quality
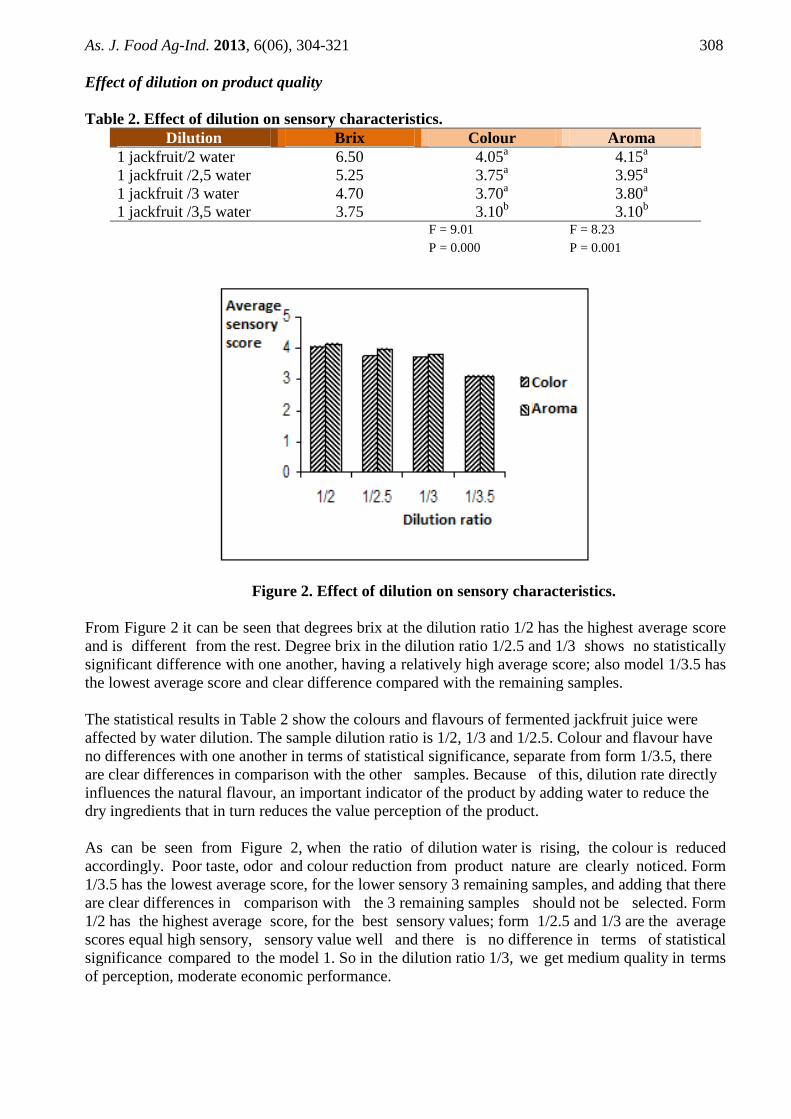
Table 2. Effect of dilution on sensory characteristics.
Dilution Brix Colour Aroma
1 jackfruit/2 water 6.50
4.05a
4.15a
1 jackfruit /2,5 water 5.25
3.75a
3.95a
1 jackfruit /3 water 4.70
3.70a
3.80a
1 jackfruit /3,5 water 3.75
3.10b
3.10b
F = 9.01 F = 8.23
P = 0.000 P = 0.001
Figure 2. Effect of dilution on sensory characteristics.
From Figure 2 it can be seen that degrees brix at the dilution ratio 1/2 has the highest average score
and is different from the rest. Degree brix in the dilution ratio 1/2.5 and 1/3 shows no statistically
significant difference with one another, having a relatively high average score; also model 1/3.5 has
the lowest average score and clear difference compared with the remaining samples.
The statistical results in Table 2 show the colours and flavours of fermented jackfruit juice were
affected by water dilution. The sample dilution ratio is 1/2, 1/3 and 1/2.5. Colour and flavour have
no differences with one another in terms of statistical significance, separate from form 1/3.5, there
are clear differences in comparison with the other samples. Because of this, dilution rate directly
influences the natural flavour, an important indicator of the product by adding water to reduce the
dry ingredients that in turn reduces the value perception of the product.
As can be seen from Figure 2, when the ratio of dilution water is rising, the colour is reduced
accordingly. Poor taste, odor and colour reduction from product nature are clearly noticed. Form
1/3.5 has the lowest average score, for the lower sensory 3 remaining samples, and adding that there
are clear differences in comparison with the 3 remaining samples should not be selected. Form
1/2 has the highest average score, for the best sensory values; form 1/2.5 and 1/3 are the average
scores equal high sensory, sensory value well and there is no difference in terms of statistical
significance compared to the model 1. So in the dilution ratio 1/3, we get medium quality in terms
of perception, moderate economic performance.
As. J. Food Ag-Ind. 2013, 6(06), 304-321 309
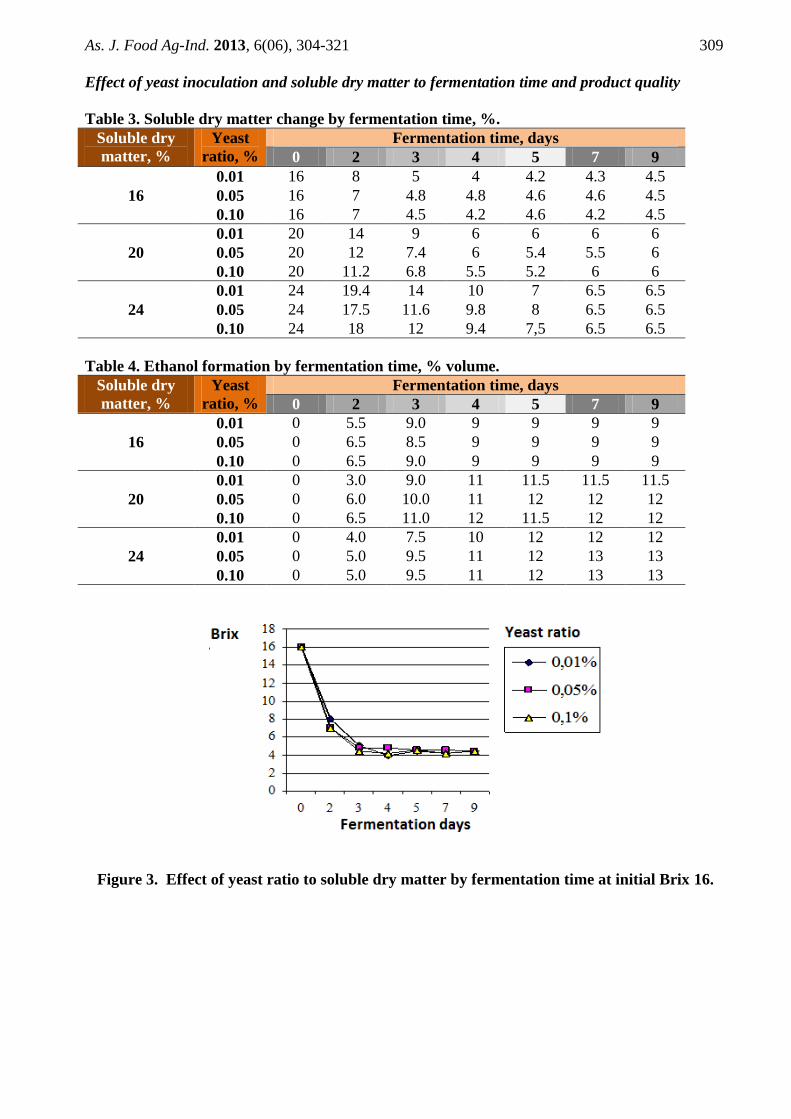
Effect of yeast inoculation and soluble dry matter to fermentation time and product quality
Table 3. Soluble dry matter change by fermentation time, %.
Soluble dry
matter, %
Yeast
ratio, %
Fermentation time, days
0 2 3 4 5 7 9
16
0.01 16 8 5 4 4.2 4.3 4.5
0.05 16 7 4.8 4.8 4.6 4.6 4.5
0.10 16 7 4.5 4.2 4.6 4.2 4.5
20
0.01 20 14 9 6 6 6 6
0.05 20 12 7.4 6 5.4 5.5 6
0.10 20 11.2 6.8 5.5 5.2 6 6
24
0.01 24 19.4 14 10 7 6.5 6.5
0.05 24 17.5 11.6 9.8 8 6.5 6.5
0.10 24 18 12 9.4 7,5 6.5 6.5
Table 4. Ethanol formation by fermentation time, % volume.
Soluble dry
matter, %
Yeast
ratio, %
Fermentation time, days
0 2 3 4 5 7 9
16
0.01 0 5.5 9.0 9 9 9 9
0.05 0 6.5 8.5 9 9 9 9
0.10 0 6.5 9.0 9 9 9 9
20
0.01 0 3.0 9.0 11 11.5 11.5 11.5
0.05 0 6.0 10.0 11 12 12 12
0.10 0 6.5 11.0 12 11.5 12 12
24
0.01 0 4.0 7.5 10 12 12 12
0.05 0 5.0 9.5 11 12 13 13
0.10 0 5.0 9.5 11 12 13 13
Figure 3. Effect of yeast ratio to soluble dry matter by fermentation time at initial Brix 16.
As. J. Food Ag-Ind. 2013, 6(06), 304-321 310
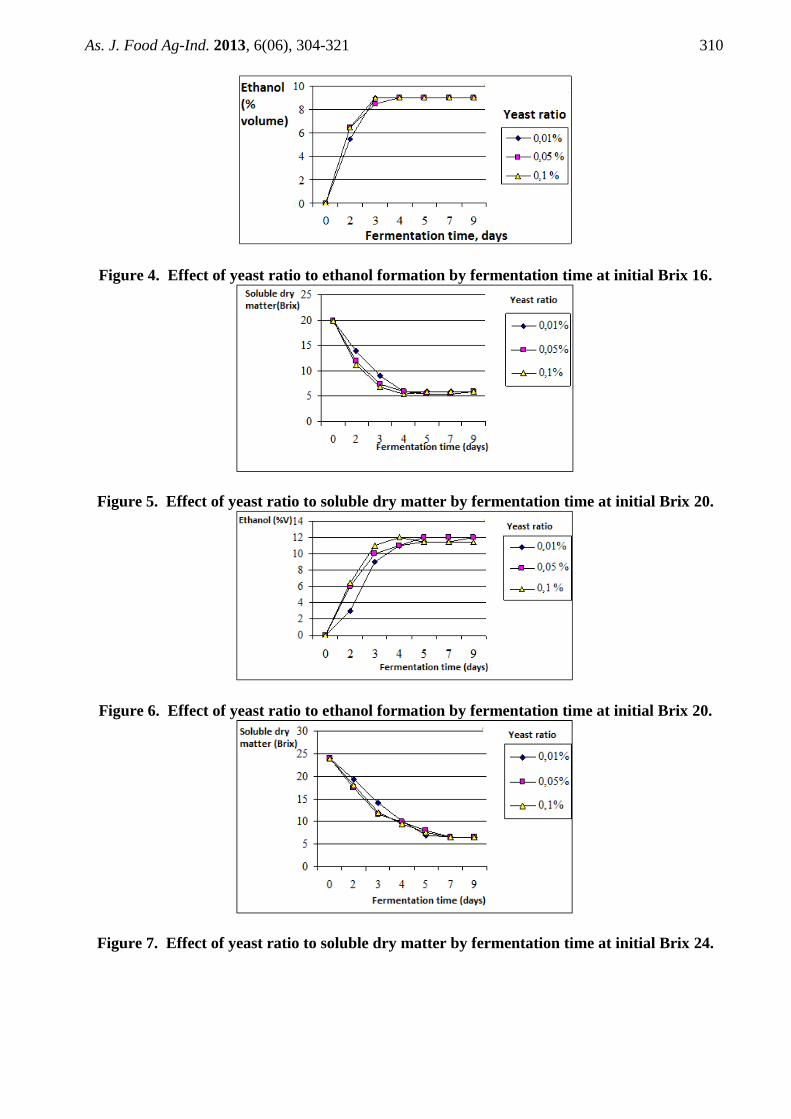
Figure 4. Effect of yeast ratio to ethanol formation by fermentation time at initial Brix 16.
Figure 5. Effect of yeast ratio to soluble dry matter by fermentation time at initial Brix 20.
Figure 6. Effect of yeast ratio to ethanol formation by fermentation time at initial Brix 20.
Figure 7. Effect of yeast ratio to soluble dry matter by fermentation time at initial Brix 24.

As. J. Food Ag-Ind. 2013, 6(06), 304-321 311
Figure 8. Effect of yeast ratio on ethanol formation by fermentation time at initial Brix 24.
Table 5. Effect of initial Brix to soluble dry matter.
Initial Brix Soluble dry matter, %
16 4.97a
20 7.27b
24 9.62c
F = 79.36
P = 0.0000
Table 6. Effect of fermentation time on soluble dry matter.
Fermentation time, days Soluble dry matter, %
0 20.00d
2 11.57a
3 8.34b
4 6.63c
5 5.94c
7 5.56c
9 5.67c
F = 39.96
P = 0.0000
Table 7. Effect of yeast ratio on soluble dry matter, %.
Yeast ratio, % Soluble dry matter, %
0.01 7.25a
0.05 7.36a
0.10 7.24a
F = 0.06
P= 0.9386
Table 8. Effect of initial Brix on ethanol formation.
Initial Brix Ethanol formation, % volume
16 8.50a
20 10.30b
24 10.36b
F = 39.05
P = 0.0000

As. J. Food Ag-Ind. 2013, 6(06), 304-321 312
Table 9. Effect of fermentation time on ethanol formation.
Fermentation time, days Ethanol formation, % volume
0 0.00d
2 5.33a
3 9.22b
4 10.44c
5 11.00c
7 11.17c
9 11.17c
F = 90.01
P = 0.0000
Table 10. Effect of yeast ratio on ethanol formation.
Yeast ratio, % Ethanol formation, % volume
0.01 9.69a
0.05 9.88a
0.10 9.69a
F = 6.56
P= 0.021
Table 5 shows the dry substance content of solubles descending in the form of the original 16 brix,
20 and 24 have a difference. Table 6 shows the dissolved content of dry substances decrease with
fermentation time. In the early days, the dry matter content of soluble falling fast due to yeasts used
to increase biomass. At this time the most powerful yeast's activity should use the metabolized
alcohol is highest. So in day 2, 3, 4 degrees brix diminished and there were differences over the
next days. In the days following fermentation the yeast's activity was much weaker should use sugar
to metabolize the alcohol also slows and there is no difference in terms of statistical significance.
Table 7 shows at the rate of 0.01% yeast, 0.05%, 0.1% of the dry matter content of the soluble
reduction are not identical, but there is no difference in terms of statistical significance. Table 8
shows the samples were originally 16 brix content wineries produce high and there are differences
compared to the rest. The samples were originally 20 brix and 24 with high-born alcohol and there
is no difference in terms of statistical significance. This demonstrates the brix 16 is too low and not
enough for fermentation. The template has a brix 20, 24 suitable for fermentation, but in terms of
economics model 20 degrees brix is more effective. So the model with 20 brix was chosen. Table 9
shows the time fermenting in the early days (from the first day to the fourth day) of alcohol was
born very different, from day 4 onwards, the alcohol content of birth there is no difference in terms
of statistical significance. This can be interpreted as the initial of active yeast should powerful force,
capable of high fermentation alcohol content, more, and there's a clear difference. From Wednesday
onwards alcohol concentrations in the room is high fermentation (> 10% by volume) inhibit the
activity of the yeast, the yeast metabolizes sugar into alcohol diminishes, so alcohol content
generated no statistically significant differences in the next days. Table 10 shows the proportion of
different yeast alcohol amounts produced no difference in terms of statistical significance. Sample
rate of 0.05% yeast give the highest beverage quality.
Table 11 shows the target colour and then the samples 5, 6, 8 points higher sensory patterns
of rest, of characteristic yellow jackfruit is very beautiful, uniform product with no residue to the
bottom of the bottle. This sample demonstrates a brix and ratio of yeast used for fermentation. The
yeast works well to inhibit microorganism contamination issue that causes instability products.

As. J. Food Ag-Ind. 2013, 6(06), 304-321 313
Table 11. Effect of yeast ratio and soluble dry matter on product sensory quality.
Soluble dry
matter, %
Yeast ratio, % Parameter
Colour and status Aroma Taste
16
0.01 2.00
2.50
3.05
0.05 2.05
2.70
2.95
0.10 3.00
2.90
2.90
20
0.01 3.45
3.10
3.35
0.05 4.25
3.95
4.10
0.10 3.95
3.50
3.50
24
0.01 3.55
3.15
3.45
0.05 4.05
3.65
3.80
0.10 3.75
3.30
3.10
Table 12. Effect of soluble dry matter on product sensory quality.
Soluble dry
matter, %
Parameter
Colour and status Aroma Taste
16 2.35a
2.7a
2.97a
20 3.88b
3.52b
3.65b
24 3.78b
3.77b
3.45b
F = 82.85 F = 26.33 F = 20.28
P = 0.0000 P = 0.0000 P = 0.0000
Table 13. Effect of yeast ratio on product sensory quality.
Yeast ratio, % Parameter
Colour and status Aroma Taste
0.01 3.00a
2.92a
3.28a
0.05 3.45b
3.43b 3.62
a
0.10 3.57b
3.23b
3.17b
F = 10.08 F = 9.45 F = 8.96
P = 0.0001 P = 0.0001 P = 0.002
In addition, the samples 1, 2, 3 have low sensory scores for this sample shows a low brix enough
nutrients for good fermentation. In the first stage the yeast uses the nutrients in the environment to
increase biomass, making nutrients decreased significantly. So after a few days of fermentation,
the nutrient sources in the environment is exhausted, the yeast will die. When that occurs, junk
microorganisms infection will develop active and changing the pH environment, clearly diminished
product colour (lighter in colour).
With regard to the aroma of fermented fruit juice, Table 11 shows the samples 5, 6, 8 have high
sensory points. Scented products are featured; there is the appearance of strange smell
(rancid, rotten, etc.). Also the samples 1, 2, 3 are still characteristic fragrance of water or the strange
smell (rancid, rotten). This can be explained by this model has a low brix is insufficient for good
fermentation yeast; yeast activity is weak enough not to inhibit the growth of odor- causing
microorganism contamination of impurities in the product.
Regarding the norms, Table 11 also shows the samples 5, 6, 8 have a high sensory point. The
product tastes quite mellow, merge features. The sweetness of fruit sugar and subdued ferment
merge with acid by fermentation, matching it’s the top blade of CO2 produced from the
fermentation creates a distinctive taste to the product. Certified partner degrees brix and using
yeast ratio in the form suitable for fermentation, no strange taste (sour). Also the samples 1, 2, 3
are sensory scores low due in this not enough
As. J. Food Ag-Ind. 2013, 6(06), 304-321 314
to brix degrees the yeast fermenting yeast, weak activity well should junk microorganism growing.
The infection makes sour, rancid tasting of the product.
The synthesis of the target colour, smell, taste is the samples 5, 6, 8 have a high sensory spots and
acceptable. But in terms of economy, the decision to choose the model 5
(degrees Brix = 20, 0.05% yeast).
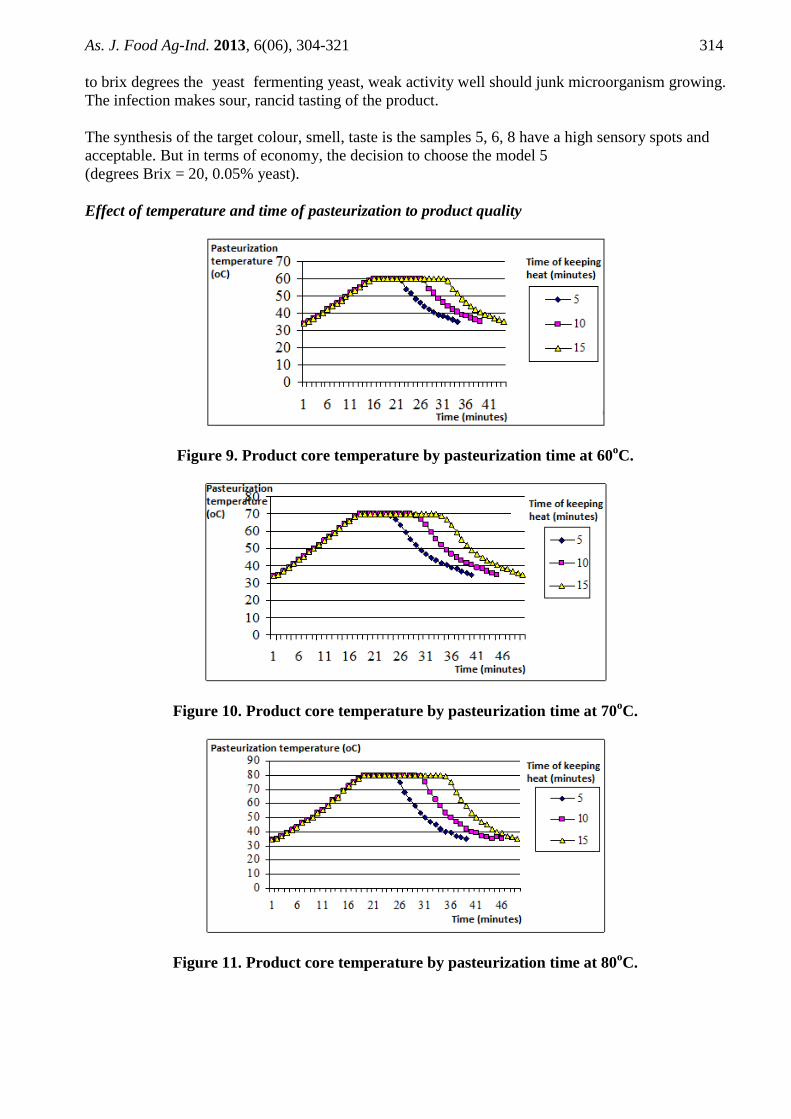
Effect of temperature and time of pasteurization to product quality
Figure 9. Product core temperature by pasteurization time at 60oC.
Figure 10. Product core temperature by pasteurization time at 70oC.
Figure 11. Product core temperature by pasteurization time at 80oC.

As. J. Food Ag-Ind. 2013, 6(06), 304-321 315
Table 14. F value by pasteurization steps.
Pasteurization
temperature, oC
Time of heating, minutes
5 10 15
60 8.86 13.86 18.86
70 8.72 13.72 18.72
80 7.98 12.98 17.98
Table 15. Effect of pasteurization temperature and time on sensory product quality.
Pasteurization
temperature, oC
Time of
heating,
minutes
Parameter
Colour and status Aroma Taste
60
5 3.80 4.05 3.75
10 3.75 3.55 3.75
15 3.50 3.55 3.65
70
5 3.50 4.00 3.70
10 4.00 3.95 3.95
15 3.30 3.60 3.45
80
5 3.25 3.55 3.60
10 3.35 3.40 3.25
15 3.05 3.25 2.95
Table 16. Effect of pasteurization temperature on sensory product quality.
Pasteurization
temperature, oC
Parameter
Colour and status Aroma Taste
60 3.68a
3.72a
3.72a
70 3.60a
3.85a
3.70a
80 3.22b
3.40b
3.27b
F = 9.25 F = 7.25 F = 7.39
P = 0.0002 P = 0.0009 P = 0.0008
Table 17. Effect of pasteurization time on sensory product quality.
Pasteurization time,
minutes
Parameter
Colour and status Aroma Taste
5 3.52a
3.87a
3.68a
10 3.70a
3.63ab
3.65a
15 3.28b
3.47b
3.35b
F = 6.51 F = 5.48 F = 3.83
P = 0.0019 P = 0.0049 P = 0.0236
Table 16 shows the pasteurization temperature the higher the score, the lower sensory means more
colour, gold becomes more intense, more powerful cooking odors. Pasteurized samples at a
temperature of 60oC and 70
oC have sensory point of colour, smell, taste and status higher than the
temperature 80oC pasteurization. Pasteurized samples at 60
oC and 70
oC retains its fresh yellow
characteristic aroma and harmonious taste, there is no difference in terms of statistical
significance. Also the template has 80oC temperature pasteurization darker rather than lighter
cooking smell, appearance, taste sour and have differences with samples of pasteurized at
a temperature of 60oC and 70
oC. Due to the temperature 80
oC, the amino acid and reducing sugar in
products that work with each other to

As. J. Food Ag-Ind. 2013, 6(06), 304-321 316
form dark caramel colour in the product more intensely. So product pasteurization at a temperature
80oC was not selected.
Table 17 shows the sample time pasteurization temperature short (5 minutes, 10minutes) then very
little affect sensory value product. The product has a high sensory value, retains the colour
characteristics of the product, soothing fragrance, doesn't appear harmonious taste, cooking smells
do not sharply and there is no difference in terms of statistical significance. While the model has
time pasteurization temperature 15 minutes then lower sensory value. The product has a darker
appearance. The smell of cooking, taste becomes strong and there are differences in terms of
statistical significance compared to the sterilization time keeping heat 5 minutes and 10 minutes.
It shows the time of keeping heat as long as product sensory values decrease. So we don't choose
the pasteurized samples having time keeping heat at 15 minutes.
When combining all of the above factors is the pasteurization of 60oC and 70
oC with heat keeping
time 5 minutes, 10 minutes we can ensure good product quality. However, in order to choose
the proper sterilization temperatures to be maintained so long that the quality has remained stable,
we have to keep track of changes in the process of preserving all the templates on. Then select the
templates to preserve much with little change.
Table 18. TPC in product.
Pasteurization
temperature, oC
Time of heating,
minutes
TPC, CFU/ml beverage
Initial After 28th
day
60
5 0 >100
10 0 >100
15 0 >100
70
5 0 >100
10 0 3
15 0 1
80
5 0 0
10 0 0
15 0 0
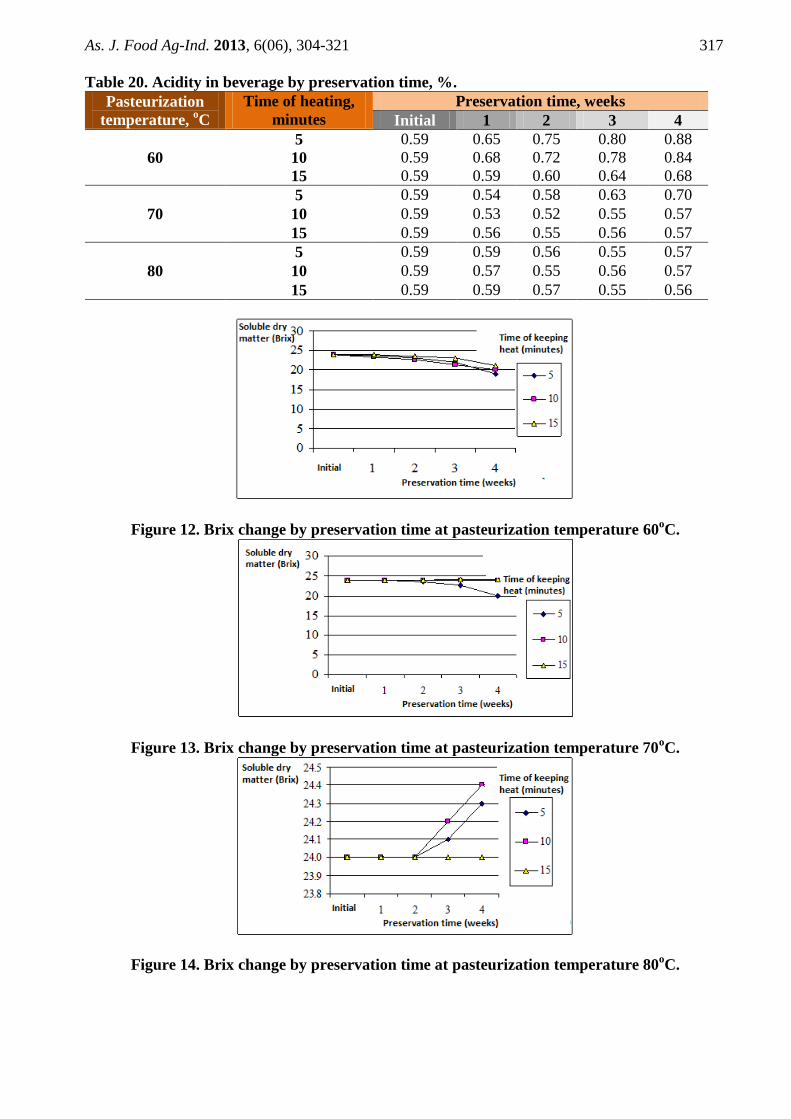
Table 19. Brix change in beverage by preservation time.
Pasteurization
temperature, oC
Time of heating,
minutes
Preservation time, weeks
Initial 1 2 3 4
60
5 24.0 23.8 23.0 22.0 19.0
10 24.0 23.4 22.6 21.4 20.0
15 24.0 24.0 23.6 23.0 21.2
70
5 24.0 24.0 23.5 22.6 20.0
10 24.0 24.0 24.0 24.0 24.0
15 24.0 24.0 24.0 24.1 24.1
80
5 24.0 24.0 24.0 24.1 24.3
10 24.0 24.0 24.0 24.2 24.4
15 24.0 24.0 24.0 24.0 24.0
As. J. Food Ag-Ind. 2013, 6(06), 304-321 317
Table 20. Acidity in beverage by preservation time, %.
Pasteurization
temperature, oC
Time of heating,
minutes
Preservation time, weeks
Initial 1 2 3 4
60
5 0.59 0.65 0.75 0.80 0.88
10 0.59 0.68 0.72 0.78 0.84
15 0.59 0.59 0.60 0.64 0.68
70
5 0.59 0.54 0.58 0.63 0.70
10 0.59 0.53 0.52 0.55 0.57
15 0.59 0.56 0.55 0.56 0.57
80
5 0.59 0.59 0.56 0.55 0.57
10 0.59 0.57 0.55 0.56 0.57
15 0.59 0.59 0.57 0.55 0.56
Figure 12. Brix change by preservation time at pasteurization temperature 60oC.
Figure 13. Brix change by preservation time at pasteurization temperature 70oC.
Figure 14. Brix change by preservation time at pasteurization temperature 80oC.
As. J. Food Ag-Ind. 2013, 6(06), 304-321 318
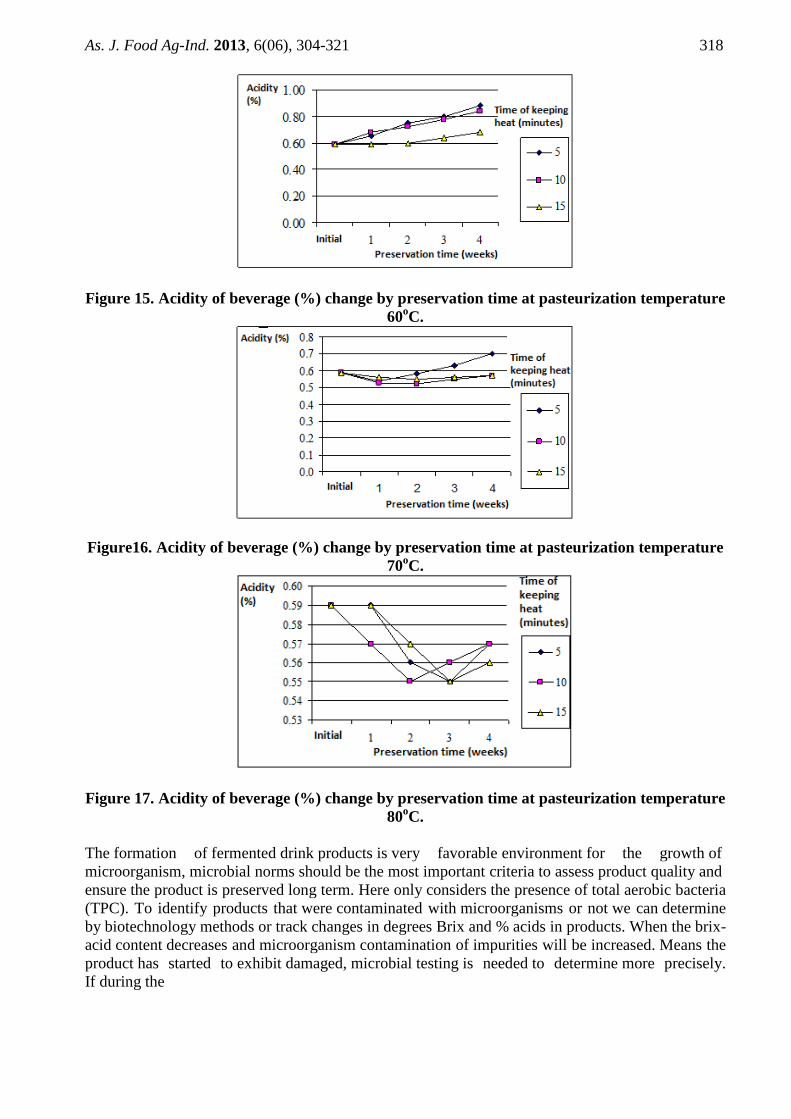
Figure 15. Acidity of beverage (%) change by preservation time at pasteurization temperature
60oC.
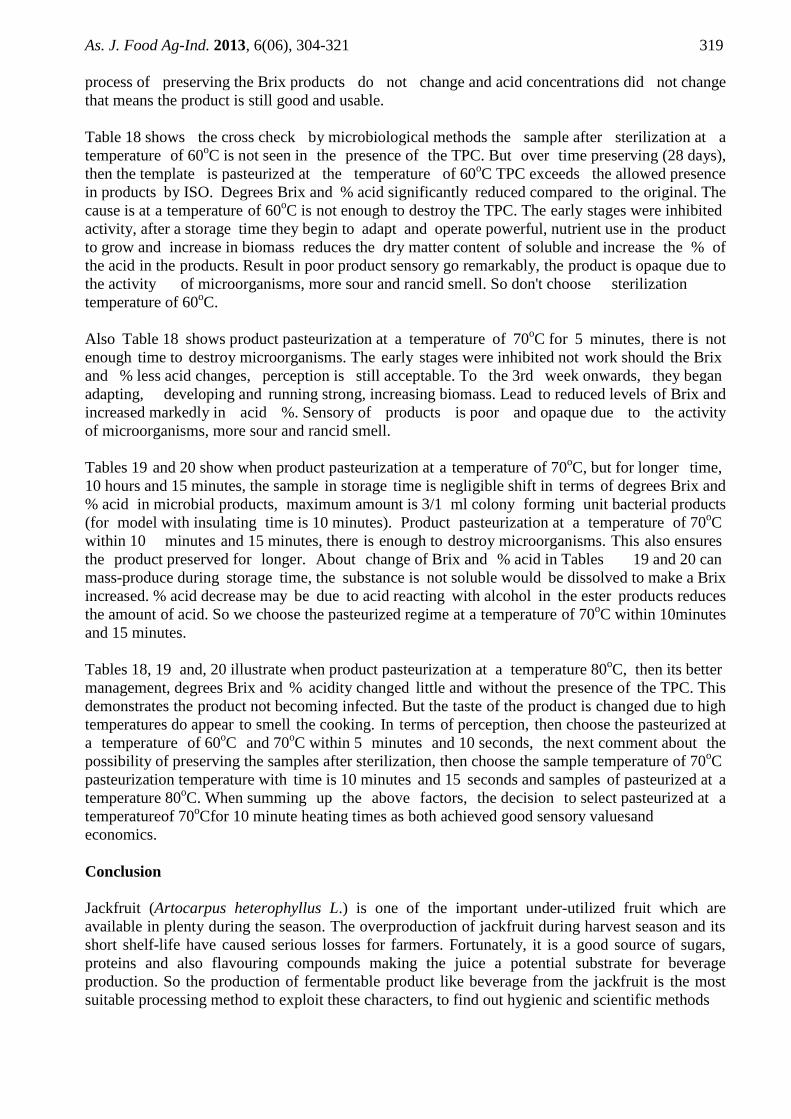
Figure16. Acidity of beverage (%) change by preservation time at pasteurization temperature
70oC.
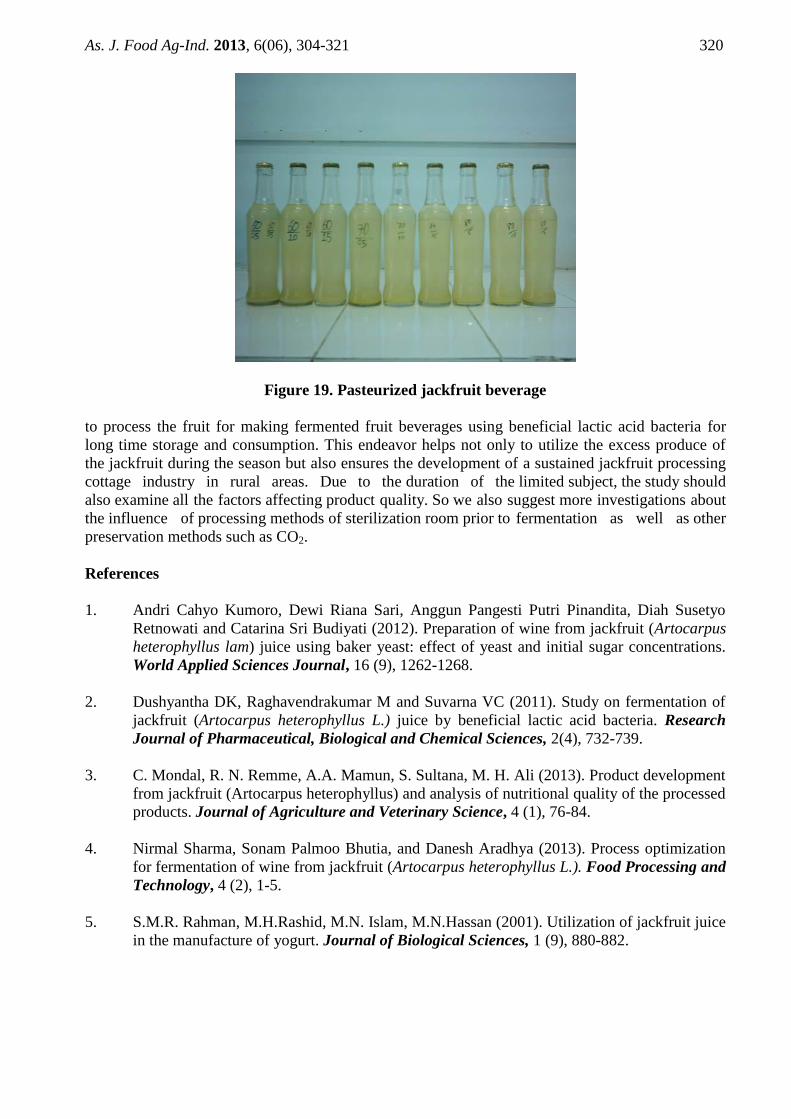
Figure 17. Acidity of beverage (%) change by preservation time at pasteurization temperature
80oC.
The formation of fermented drink products is very favorable environment for the growth of
microorganism, microbial norms should be the most important criteria to assess product quality and
ensure the product is preserved long term. Here only considers the presence of total aerobic bacteria
(TPC). To identify products that were contaminated with microorganisms or not we can determine
by biotechnology methods or track changes in degrees Brix and % acids in products. When the brix-
acid content decreases and microorganism contamination of impurities will be increased. Means the
product has started to exhibit damaged, microbial testing is needed to determine more precisely.
If during the
As. J. Food Ag-Ind. 2013, 6(06), 304-321 319
process of preserving the Brix products do not change and acid concentrations did not change
that means the product is still good and usable.
Table 18 shows the cross check by microbiological methods the sample after sterilization at a
temperature of 60oC is not seen in the presence of the TPC. But over time preserving (28 days),
then the template is pasteurized at the temperature of 60oC TPC exceeds the allowed presence
in products by ISO. Degrees Brix and % acid significantly reduced compared to the original. The
cause is at a temperature of 60oC is not enough to destroy the TPC. The early stages were inhibited
activity, after a storage time they begin to adapt and operate powerful, nutrient use in the product
to grow and increase in biomass reduces the dry matter content of soluble and increase the % of
the acid in the products. Result in poor product sensory go remarkably, the product is opaque due to
the activity of microorganisms, more sour and rancid smell. So don't choose sterilization
temperature of 60oC.
Also Table 18 shows product pasteurization at a temperature of 70oC for 5 minutes, there is not
enough time to destroy microorganisms. The early stages were inhibited not work should the Brix
and % less acid changes, perception is still acceptable. To the 3rd week onwards, they began
adapting, developing and running strong, increasing biomass. Lead to reduced levels of Brix and
increased markedly in acid %. Sensory of products is poor and opaque due to the activity
of microorganisms, more sour and rancid smell.
Tables 19 and 20 show when product pasteurization at a temperature of 70oC, but for longer time,
10 hours and 15 minutes, the sample in storage time is negligible shift in terms of degrees Brix and
% acid in microbial products, maximum amount is 3/1 ml colony forming unit bacterial products
(for model with insulating time is 10 minutes). Product pasteurization at a temperature of 70oC
within 10 minutes and 15 minutes, there is enough to destroy microorganisms. This also ensures
the product preserved for longer. About change of Brix and % acid in Tables 19 and 20 can
mass-produce during storage time, the substance is not soluble would be dissolved to make a Brix
increased. % acid decrease may be due to acid reacting with alcohol in the ester products reduces
the amount of acid. So we choose the pasteurized regime at a temperature of 70oC within 10minutes
and 15 minutes.
Tables 18, 19 and, 20 illustrate when product pasteurization at a temperature 80oC, then its better
management, degrees Brix and % acidity changed little and without the presence of the TPC. This
demonstrates the product not becoming infected. But the taste of the product is changed due to high
temperatures do appear to smell the cooking. In terms of perception, then choose the pasteurized at
a temperature of 60oC and 70
oC within 5 minutes and 10 seconds, the next comment about the
possibility of preserving the samples after sterilization, then choose the sample temperature of 70oC
pasteurization temperature with time is 10 minutes and 15 seconds and samples of pasteurized at a
temperature 80oC. When summing up the above factors, the decision to select pasteurized at a
temperatureof 70oCfor 10 minute heating times as both achieved good sensory valuesand
economics.
Conclusion
Jackfruit (Artocarpus heterophyllus L.) is one of the important under-utilized fruit which are
available in plenty during the season. The overproduction of jackfruit during harvest season and its
short shelf-life have caused serious losses for farmers. Fortunately, it is a good source of sugars,
proteins and also flavouring compounds making the juice a potential substrate for beverage
production. So the production of fermentable product like beverage from the jackfruit is the most
suitable processing method to exploit these characters, to find out hygienic and scientific methods
As. J. Food Ag-Ind. 2013, 6(06), 304-321 320
Figure 19. Pasteurized jackfruit beverage
to process the fruit for making fermented fruit beverages using beneficial lactic acid bacteria for
long time storage and consumption. This endeavor helps not only to utilize the excess produce of
the jackfruit during the season but also ensures the development of a sustained jackfruit processing
cottage industry in rural areas. Due to the duration of the limited subject, the study should
also examine all the factors affecting product quality. So we also suggest more investigations about
the influence of processing methods of sterilization room prior to fermentation as well as other
preservation methods such as CO2.
References
1. Andri Cahyo Kumoro, Dewi Riana Sari, Anggun Pangesti Putri Pinandita, Diah Susetyo
Retnowati and Catarina Sri Budiyati (2012). Preparation of wine from jackfruit (Artocarpus
heterophyllus lam) juice using baker yeast: effect of yeast and initial sugar concentrations.
World Applied Sciences Journal, 16 (9), 1262-1268.
2. Dushyantha DK, Raghavendrakumar M and Suvarna VC (2011). Study on fermentation of
jackfruit (Artocarpus heterophyllus L.) juice by beneficial lactic acid bacteria. Research
Journal of Pharmaceutical, Biological and Chemical Sciences, 2(4), 732-739.
3. C. Mondal, R. N. Remme, A.A. Mamun, S. Sultana, M. H. Ali (2013). Product development
from jackfruit (Artocarpus heterophyllus) and analysis of nutritional quality of the processed
products. Journal of Agriculture and Veterinary Science, 4 (1), 76-84.
4. Nirmal Sharma, Sonam Palmoo Bhutia, and Danesh Aradhya (2013). Process optimization
for fermentation of wine from jackfruit (Artocarpus heterophyllus L.). Food Processing and
Technology, 4 (2), 1-5.
5. S.M.R. Rahman, M.H.Rashid, M.N. Islam, M.N.Hassan (2001). Utilization of jackfruit juice
in the manufacture of yogurt. Journal of Biological Sciences, 1 (9), 880-882.

As. J. Food Ag-Ind. 2013, 6(06), 304-321 321
6. Rosnah Shamsudin, Chia Su Ling, Chin Nyuk Ling, Noraziah Muda and Osman Hassan
(2009). Chemical compositions of the jackfruit juice (Artocarpus) cultivar J33 during
storage. Journal of Applied Sciences, 9 (17), 3202-3204.


