![La Filosofia católica en el s. XX_V-83-P-167-186 [1970]](https://static.fdocuments.net/doc/165x107/577cdc8c1a28ab9e78aac7f2/la-filosofia-catolica-en-el-s-xxv-83-p-167-186-1970.jpg)
Asian Journal of Empirical Research - QUT7)2016-AJER-167-186.pdf · Asian Journal of Empirical...
20
© 2016 Asian Economic and Social Society. All rights reserved ISSN (P): 2306-983X, ISSN (E): 2224-4425 Volume 6, Issue 7 pp. 167-186 167 ANALYSIS OF GDP TRENDS AND INEQUALITIES IN VIETNAM’S PROVINCES AND GROUPS OF PROVINCES Xuan-Binh Vu Department of Accounting, Finance and Economics, Griffith University, Australia. The Australian Research Centre for Health Services Innovation, Institute of Health and Biomedical Innovation, Australia Son Nghiem The Australian Research Centre for Health Services Innovation, Institute of Health and Biomedical Innovation, Australia Article History: Received: 01-Aug-2016 Revised received: 25-Aug- 2016 Accepted: 05-Sep-2016 Online available: 20-Oct- 2016 Keywords: Vietnam, provincial GDP trends, inequality, foreign direct investment, public investment, transfers Abstract Our recent paper (Vu et al., 2016) applied the Phillips and Sul’s method (2007, 2009) and found that the 61 provinces of Vietnam were formed in five convergence sub-groups. This current paper identifies trends and patterns of inequality in provincial GDP per capita of each sub-group of provinces in Vietnam during the period 1990-2011. It also analyses the growth path of each province compared with that of the reference economy [Ho Chi Minh City (HCMC) and the national average]. The results show that there were the downward trends of inequality in GDP per capita of each sub-group. Also, during the period 1990-1994, most provinces diverged from HCMC but during the period 2004-2011, all provinces tended to converge to it. However, there were few poorest provinces, which tend to be located in geographically and economically isolated regions of Vietnam. This paper analyses main characteristics of provinces and key factors affecting the trends and patterns of disparities in GDP per capita of each sub- group. Furthermore, several policy implications are discussed. 1. INTRODUCTION Since the implementation of economic reform in 1986, Vietnam has attained remarkable economic achievements (Dollar, 2002; Malesky & London, 2014). The GDP growth rate increased from 2.8 % in 1986 to 9.5% in 1995 and 6.7% in 2015 (World Bank, 2016). The GDP per capita (PPP 1 ) increased from US$ 970 in 1990 to US$ 6,022 in 2015 ( World Bank, 2016). The poverty headcount ratio at US$ 1.90 a day (2011 PPP) (% of population) decreased from 49.2% in 1992 to 3.2% in 2012 (World Bank, 2016). However, the income inequality (Gini index) increased from 0.35 in 1992 to 0.39 in 2012 (World Bank, 2016). Corresponding author's Name: Xuan-Binh Vu Email address: [email protected] 1 Purchasing power parity Asian Journal of Empirical Research http://aessweb.com/journal-detail.php?id=5004 DOI: 10.18488/journal.1007/2016.6.7/1007.7.167.186
Transcript of Asian Journal of Empirical Research - QUT7)2016-AJER-167-186.pdf · Asian Journal of Empirical...
© 2016 Asian Economic and Social Society. All rights reserved ISSN (P): 2306-983X, ISSN (E): 2224-4425 Volume 6, Issue 7 pp. 167-186
167
ANALYSIS OF GDP TRENDS AND INEQUALITIES IN VIETNAM’S
PROVINCES AND GROUPS OF PROVINCES
Xuan-Binh Vu
Department of Accounting, Finance and Economics, Griffith University, Australia.
The Australian Research Centre for Health Services Innovation, Institute of Health and Biomedical
Innovation, Australia
Son Nghiem
The Australian Research Centre for Health Services Innovation, Institute of Health and Biomedical
Innovation, Australia
Article History:
Received: 01-Aug-2016
Revised received: 25-Aug-
2016
Accepted: 05-Sep-2016
Online available: 20-Oct-
2016
Keywords: Vietnam,
provincial GDP trends,
inequality,
foreign direct investment,
public investment,
transfers
Abstract
Our recent paper (Vu et al., 2016) applied the Phillips and Sul’s
method (2007, 2009) and found that the 61 provinces of Vietnam
were formed in five convergence sub-groups. This current paper
identifies trends and patterns of inequality in provincial GDP per
capita of each sub-group of provinces in Vietnam during the period
1990-2011. It also analyses the growth path of each province
compared with that of the reference economy [Ho Chi Minh City
(HCMC) and the national average]. The results show that there
were the downward trends of inequality in GDP per capita of each
sub-group. Also, during the period 1990-1994, most provinces
diverged from HCMC but during the period 2004-2011, all
provinces tended to converge to it. However, there were few
poorest provinces, which tend to be located in geographically and
economically isolated regions of Vietnam. This paper analyses
main characteristics of provinces and key factors affecting the
trends and patterns of disparities in GDP per capita of each sub-
group. Furthermore, several policy implications are discussed.
1. INTRODUCTION
Since the implementation of economic reform in 1986, Vietnam has attained remarkable economic
achievements (Dollar, 2002; Malesky & London, 2014). The GDP growth rate increased from 2.8 %
in 1986 to 9.5% in 1995 and 6.7% in 2015 (World Bank, 2016). The GDP per capita (PPP1)
increased from US$ 970 in 1990 to US$ 6,022 in 2015 (World Bank, 2016). The poverty headcount
ratio at US$ 1.90 a day (2011 PPP) (% of population) decreased from 49.2% in 1992 to 3.2% in
2012 (World Bank, 2016). However, the income inequality (Gini index) increased from 0.35 in 1992
to 0.39 in 2012 (World Bank, 2016).
Corresponding author's
Name: Xuan-Binh Vu
Email address: [email protected] 1 Purchasing power parity
Asian Journal of Empirical Research
http://aessweb.com/journal-detail.php?id=5004
DOI: 10.18488/journal.1007/2016.6.7/1007.7.167.186
Asian Journal of Empirical Research, 6(7)2016: 167-186
168
There are few previous studies on economic growth and income inequality in Vietnam (Walle &
Gunewardena, 2001; Shankar & Shah, 2003; Le, 2003; Takahashi, 2007; Liu, 2001, 2008; Nguyen,
2009; Le & Booth, 2013); however, these studies show consistent evidence of rising inequality at the
national level but do not analyse economic performance and income inequality at provincial level
(for more details, see literature review section). We (Vu et al., 2016) applied the “log(t)” test
developed by Phillips and Sul (2007, 2009) and found no significant evidence of overall
convergence in GDP per capita across the 61 provinces in Vietnam during the period 1990-2011.
Moreover, Vu et al. (2016) identified that the 61 provinces were formed in five sub-groups in which
provincial GDP per capita converged (see Table 1).
This current paper is developed to identify the trends and patterns of inequality in provincial GDP
per capita of each of the five convergence sub-groups in Vietnam during the period 1990-2011. It
also analyses the growth path of each province compared with that of the reference economy
(HCMC and the national average). Provincial characteristics and factors determining the trends and
patterns of inequality in GDP per capita within each convergence sub-group are investigated in this
paper.
The remainder of this paper is organised as follows. Section 2 presents the literature review on
income disparity while Section 3 outlines the methodology used in this study. Section 4 describes the
data used. Section 5 discusses the study’s empirical results and Section 6 concludes.
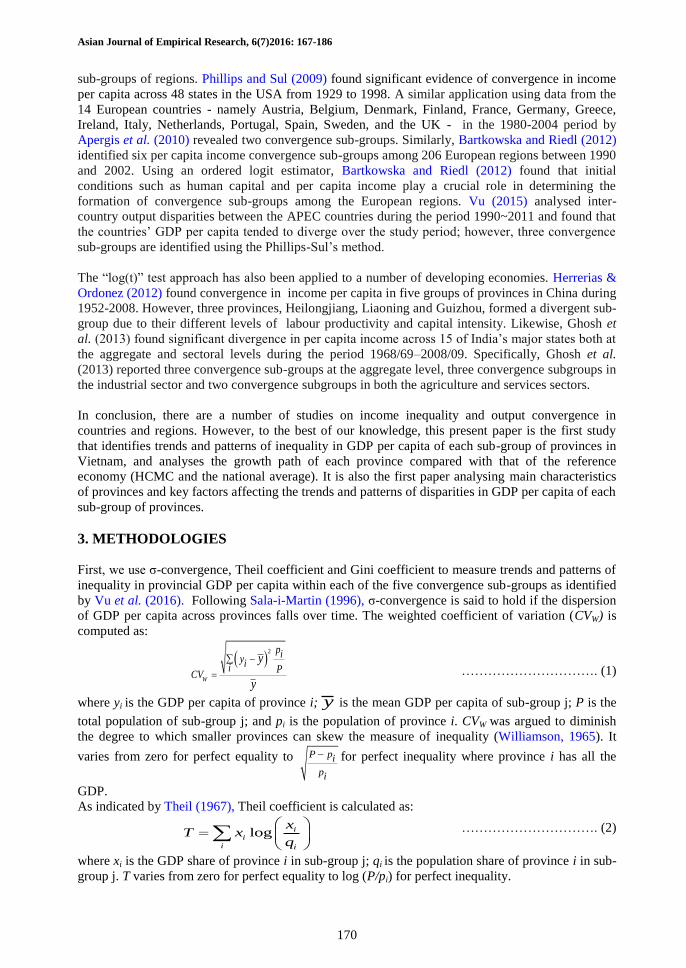
Table 1: Phillips-Sul tests of overall convergence and convergence sub-group formation
Provinces coefficient t-stat
Vietnam*
All 61 provinces -0.543 -16.333
Sub-group 1
Quang Ninh, Hanoi, Hai Phong, Hai Duong, Hung Yen,
Ninh Binh, Vinh Phuc, Bac Ninh, Da Nang, Quang Ngai,
Khanh Hoa, Lam Dong, Ho Chi Minh City, Tay Ninh,
Binh Duong, Dong Nai, Binh Thuan, Ba Ria Vung Tau,
Long An, Dong Thap, Kien Giang, Can Tho - Hau Giang,
Tra Vinh, Soc Trang, Bac Lieu, and Ca Mau.
-0.017 -0.254
Sub-group 2
Cao Bang, Tuyen Quang, Ha Nam, Thai Binh, Thanh
Hoa, Quang Nam, An Giang, Tien Giang, Vinh Long,
and Ben Tre
0.370 5.654
Sub-group 3 Lang Son, Thua Thien Hue, and Binh Dinh 0.125 1.053
Sub-group 4
Son La, Lao Cai, Bac Kan, Yen Bai, Thai Nguyen, Phu
Tho, Ha Tay, Nam Dinh, Nghe An, Ha Tinh, Phu Yen,
Kon Tum, Gia Lai, and Binh Phuoc
0.300 2.963
Sub-group 5
Lai Chau-Dien Bien, Hoa Binh, Ha Giang, Bac Giang,
Quang Binh, Quang Tri, Dak Nong-Dak Lak, and Ninh
Thuan
-0.043 -1.540
Notes: (1) The Phillips-Sul log-t test is applied to sets of data for GDP per capita. A set of economies is
considered a convergent set (or sub-group) if the log-t coefficient is positive, or if the log-t coefficient is
negative but its t-statistic is > -1.65. (2) An asterisk (*) indicates a divergent economy.
Source: Vu et al. (2016)
2. LITERATURE REVIEW
2.1. Vietnam
There are few previous studies on regional income disparities in Vietnam and they show significant
evidence of rising inequality. Walle & Gunewardena (2001) investigated inequality between ethnic
groups by applying the Blinder-Oaxaca decomposition technique to analyse the Vietnam Living
Standard Surveys (VLSS) 1992-1993. The study found that minority ethnic groups experienced
lower per capita expenditure. Takahashi (2007) and Le & Booth (2013) also applied the Blinder-
Oaxaca decomposition to VLSS 1992-1998 and found significant evidence of increased income
Asian Journal of Empirical Research, 6(7)2016: 167-186
169
inequality in Vietnam. Liu (2001, 2008) applied general entropy and Theil indices to measure
inequality to measure inequality in Vietnam using the VLSS 1992-1993 and the VLSS 1997-1998.
The authors found that the inequality in per capita expenditure increased slightly between urban and
rural areas as well as between eight regions in Vietnam. Similarly, Shankar and Shah (2003) and Le
(2003) found that Vietnam experienced a dramatic increase in regional income inequality, which was
measured by Gini index, Theil index and the use of weighted coefficient of variation (CVW).
Nguyen (2009) tested the hypothesis of convergence in income in Vietnam during the period of
1990-2006. By using the unconditional β-convergence test and the augmented Dickey-fuller (ADF)
test for panel unit root, Nguyen (2009) found no significant evidence of a converging pattern. In
addition, the results of using Theil index show that regional inequality increased moderately over the
study period, except for the declines in 1998 and 1999.
2.2. Other countries
The international literature on income inequality is extensive, thus we focus on relevant studies. The
literature on output convergence can be divided into firstly, a number of traditional time-series data
approaches: that is, δ-convergence (the reduction of dispersion across countries); β-convergence
(poor countries growing faster than rich countries) and the unit-root tests. Secondly a new dynamic
panel data approach developed by Phillips & Sul (2009) is reviewed.
The β-convergence and δ-convergence tests have been applied to a wide range of countries and
regions: the USA (Barro & Sala-i-Martin, 1991), EU and Japan (Sala-i-Martin, 1996), Australia
(Neri, 1998; Nguyen et al., 2006; Smith, 2004), Indonesia (Garcia & Soelistianingsih, 1998;
Kharisma & Saleh, 2013; Resosudarmo & Vidyattama, 2006), and China (Chang, 2002; Gen, 1999;
Jian et al., 1996). Barro & Sala-i-Martin (1991) found that the rate of convergence between the poor
and the rich states in the USA was approximately two percent per year in the 1880-1988 periods.
Sala-i-Martin (1996) reported a similar convergence speed across the USA (1880-1990), in Japan
(1955-1990), and in five European nations (1950-1990). Neri (1998) found that Australia
experienced β-convergence in the 1861-1992 period but divergence trends were reported in the more
recent periods 1976-1992 (Neri, 1998), 1966-2001 (Smith, 2004) and 1984-2005 (Nguyen et al.,
2006).
Similar convergence tests were also applied to developing economies. Empirical evidence in
Indonesia indicated convergence in a number of periods, including 1975-1993 (Garcia &
Soelistianingsih, 1998), 1993-2002 (Resosudarmo & Vidyattama, 2006), and 1982-2008 (Kharisma
& Saleh, 2013). These studies argued that improvements in human capital, accumulation of physical
capital, and trade liberalisation were the main factors contributing to a trend of increasing
convergence in Indonesia. However, empirical studies of regions in China showed that income
inequality had increased and income levels across provinces were not converging (Jian et al., 1996).
The unit root test approach examines evidence of convergence by testing to determine whether
outputs are stationary across countries or regions. Results of unit roots tests for the USA and other
developed economies remained consistent with β- and δ-convergence tests. For example, in the
context of the USA, Loewy & Papell (1996), and Carlino & Mills (1996) found significant evidence
of convergence during the 1929-1990 period while Genc et al. (2011) supported evidence of a
convergence trend in the period 1969-2001. However, the literature has reported less consistency in
empirical results between the unit root test and β- and δ-convergence tests for developing economies.
For example, studies using unit root tests for China (Pedroni & Yao, 2006) found evidence of
convergence during the 1952-1977 period and divergence in the 1978-1997 period. Meanwhile,
Narayan (2008) concluded that there was possible convergence of real GDP per capita across the
provinces in China during the period 1952-2003.
The most recent development in the literature on tests of output convergence is the “log(t)” test
approach proposed by Phillips & Sul (2007, 2009). Different from other tests, log(t) takes into
account heterogeneity among individual regions and allows for the possibility of convergence among
Asian Journal of Empirical Research, 6(7)2016: 167-186
170
sub-groups of regions. Phillips and Sul (2009) found significant evidence of convergence in income
per capita across 48 states in the USA from 1929 to 1998. A similar application using data from the
14 European countries - namely Austria, Belgium, Denmark, Finland, France, Germany, Greece,
Ireland, Italy, Netherlands, Portugal, Spain, Sweden, and the UK - in the 1980-2004 period by
Apergis et al. (2010) revealed two convergence sub-groups. Similarly, Bartkowska and Riedl (2012)
identified six per capita income convergence sub-groups among 206 European regions between 1990
and 2002. Using an ordered logit estimator, Bartkowska and Riedl (2012) found that initial
conditions such as human capital and per capita income play a crucial role in determining the
formation of convergence sub-groups among the European regions. Vu (2015) analysed inter-
country output disparities between the APEC countries during the period 1990~2011 and found that
the countries’ GDP per capita tended to diverge over the study period; however, three convergence
sub-groups are identified using the Phillips-Sul’s method.
The “log(t)” test approach has also been applied to a number of developing economies. Herrerias &
Ordonez (2012) found convergence in income per capita in five groups of provinces in China during
1952-2008. However, three provinces, Heilongjiang, Liaoning and Guizhou, formed a divergent sub-
group due to their different levels of labour productivity and capital intensity. Likewise, Ghosh et
al. (2013) found significant divergence in per capita income across 15 of India’s major states both at
the aggregate and sectoral levels during the period 1968/69–2008/09. Specifically, Ghosh et al.
(2013) reported three convergence sub-groups at the aggregate level, three convergence subgroups in
the industrial sector and two convergence subgroups in both the agriculture and services sectors.
In conclusion, there are a number of studies on income inequality and output convergence in
countries and regions. However, to the best of our knowledge, this present paper is the first study
that identifies trends and patterns of inequality in GDP per capita of each sub-group of provinces in
Vietnam, and analyses the growth path of each province compared with that of the reference
economy (HCMC and the national average). It is also the first paper analysing main characteristics
of provinces and key factors affecting the trends and patterns of disparities in GDP per capita of each
sub-group of provinces.
3. METHODOLOGIES
First, we use σ-convergence, Theil coefficient and Gini coefficient to measure trends and patterns of
inequality in provincial GDP per capita within each of the five convergence sub-groups as identified
by Vu et al. (2016). Following Sala-i-Martin (1996), σ-convergence is said to hold if the dispersion
of GDP per capita across provinces falls over time. The weighted coefficient of variation (CVW) is
computed as:
2
W
piyii PCV
y
y
…………………………. (1)
where yi is the GDP per capita of province i; is the mean GDP per capita of sub-group j; P is the
total population of sub-group j; and pi is the population of province i. CVW was argued to diminish
the degree to which smaller provinces can skew the measure of inequality (Williamson, 1965). It
varies from zero for perfect equality to for perfect inequality where province i has all the
GDP.
As indicated by Theil (1967), Theil coefficient is calculated as:
log ii
i i
xT x
q
…………………………. (2)
where xi is the GDP share of province i in sub-group j; qi is the population share of province i in sub-
group j. T varies from zero for perfect equality to log (P/pi) for perfect inequality.
y
P pi
pi

Asian Journal of Empirical Research, 6(7)2016: 167-186
171
According to Kakwani (1980) and Shankar and Shah (2003), the weighted Gini index is computed
as:
2
1
2
n ni k
W i k
i k
p pG y y
Py
…………………………. (3)
where is the mean GDP per capita of sub-group j; P is the population of sub-group j; n is the
number of provinces within sub-group j; and pi and pk are the population of provinces i and k,
respectively. GW varies from zero for perfect equality to 1 i
k
p
p
for perfect inequality.
Second, in recognition of the fact that the Phillips-Sul (2007, 2009)’s methods do not allow for
structural breaks, we explore the effects of structural breaks in inequality in GDP per capita using a
regression-based approach by Nguyen et al. (2006). We argue that the removal of the US embargo in
1995 and major policy changes in 2004 are possible structure breaks to the Vietnamese economy.
The standard method developed by Chow (1960) is used to test for possible structural breaks of the
CVW of provincial GDP per capita around 1995 and 2004.
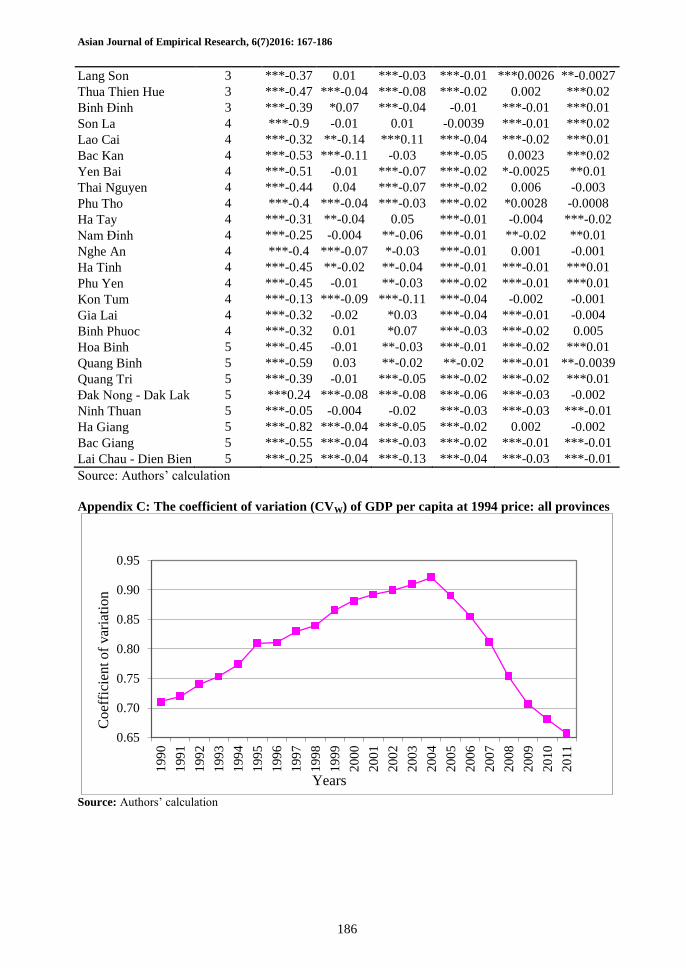
CVw = a + b*t + εt …………………………. (4)
where CVW is the weighted coefficient of variation of the 61 provinces of Vietnam and t is time
variable (see Appendix C).
The results of Chow (1960)’s test show that at the 5% level of significance, F-statistic test (4, 16) for
the breakpoints in 1995 and 2004 [F-statistic (4, 16) = 335.39] is greater than F-critical [F-critical (4,
16) = 3.06]. The results suggest that there are two breaks of the CVw of provincial GDP per capita in
1995 and 2004.
Denoting these sub-periods 1, 2, and 3, the analysis of relative income growth paths is formulated as:
1 1 1 2 2 2 2 3 3 3 3*log * * * * *it
it
t
ya b TRND a DA b TRND a DA b TRND
y
………. (5)
where yit is GDP per capita of province i, year t; is GDP per capita of the reference economy year
t: Ho Chi Minh City or the national average; aj (j=1, 2, 3) are constant intercept terms; DA2 and DA3
are dummy variable for two periods 1995-2004, and 2005-2011 (the first period 1990-1994 is
selected as the reference period); bj (j=1, 2, 3) are slopes; and TRNDj (j=1, 2, 3) are the time trends
for the three sub-periods.
Third, this paper uses descriptive analyses based on data and information collected from the General
Office Statistics (GSO), the Ministry of Finance (MOF), and the Ministry of Planning and
Investment (MPI) to discuss main characteristics of provinces and factors determining the trends and
patterns of inequality in provincial GDP per capita within each of the five sub-groups in Vietnam.
4. DATA SOURCES
The data used in this paper comprised real GDP per capita at 1994 price for the 64 provinces of
Vietnam during the period 1990-2011, and which were collected from the GSO. We used fixed 1994
price to control for effects of inflation. Annual data for population, overseas export, and agriculture,
forestry and fishery sector at the provincial level during the period 1990-2011 were available from
the GSO. Yearly data from 1990 to 2011 for public investment and foreign direct investment were
collected from the MPI. Annual data on transfers from the central authority to provincial budgets
were obtained from the MOF.
y
*
ty
Asian Journal of Empirical Research, 6(7)2016: 167-186
172
As three of the 64 provinces, namely Dien Bien, Dak Nong and Hau Giang were established in 2004,
the data of these three provinces were combined with data of their former sibling-provinces and thus,
the final data set includes only 61 provinces.
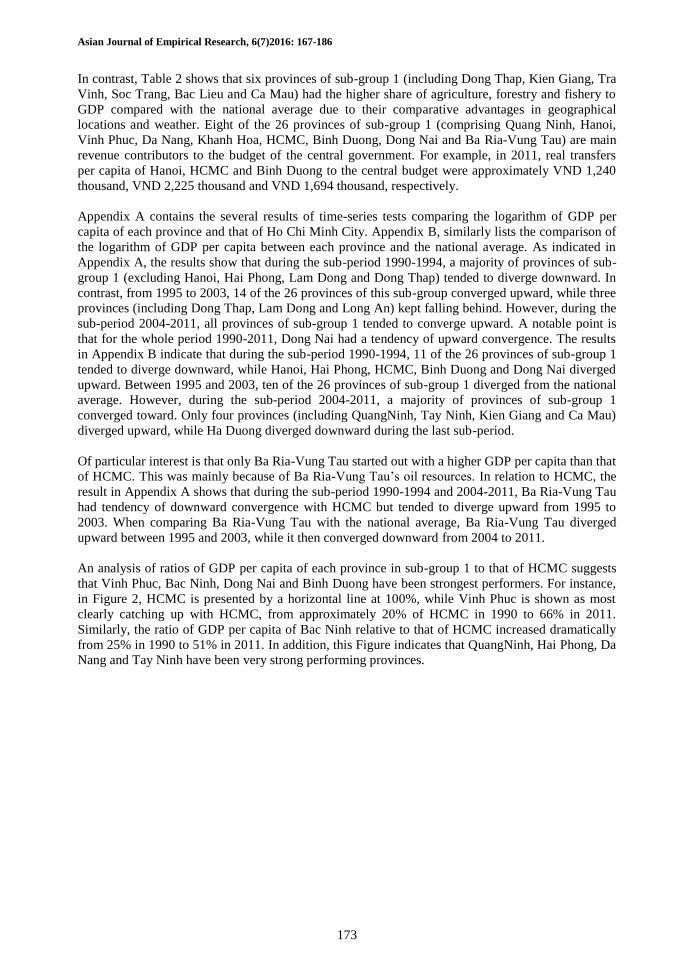
5. FINDINGS
As indicated in Table 1, sub-group 1 comprises 26 provinces. The results of measuring inequality in
GDP per capita across the 26 provinces show that the inequality increased during the sub-period
1990-1997, and decreased during the sub-period 1998-2011 (see Figure 1). For example, the CVW
increased from 0.49 in 1990 to 0.58 in 1997. It then decreased slightly between 1998 and 2003
before declining considerably to 0.34 in 2011.
Figure 1: The inequality in GDP per capita across the 26 provinces in sub-group 1
Source: Authors’ calculation
One of the main reasons leading to the trends of disparity in provincial GDP per capita of sub-group
1 was that FDI of this sub-group was allocated more evenly across the 26 provinces after 1997. For
example, in 1996, 81% of the total FDI of sub-group 1 was allocated in its five richest
cities/provinces (including Hanoi, Hai Phong, Ho Chi Minh City, Binh Duong and Dong Nai).
However, in 2011, FDI of these five richest cities/provinces accounted for 73% of the total FDI of
this sub-group. After 1997, the remaining provinces of sub-group 1 such as QuangNinh, Hai Duong,
Hung Yen, Vinh Phuc, Bac Ninh, Da Nang, Quang Ngai, Tay Ninh, Long An and Can Tho-Hau
Giang attracted more FDI. For instance, the FDI per capita at 1994 price of Vinh Phuc and Tay Ninh
increased dramatically from about VND 58 thousand and VND 17 thousand in 1998 to VND 717
thousand and VND 1,140 thousand in 2011, respectively.
Table 2 shows the main characteristics of 26 provinces in sub-group 1. A majority of provinces in
this sub-group have relatively high GDP per capita. For example, in 2011, 16 of the 26 provinces
had higher GDP per capita compared with the national average. In addition, nine of the provinces
(including Quang Ninh, Hanoi, Hai Phong, Vinh Phuc, Da Nang, HCMC, Binh Duong, Dong Nai
and Ba Ria-Vung Tau) are most industrialised cities/provinces in Vietnam. For instance, in 2011, the
share of agriculture, forestry and fishery to GDP of Hanoi, HCMC, Binh Duong and Ba Ria-Vung
Tau were only approximately 5.8%, 1.2%, 4.1% and 5.6%, respectively. They are also biggest
exporting performers in comparison with other provinces. For instance, in 2011, the percentage of
overseas exports to GDP of Quang Ninh, HCMC, Binh Duong and Dong Nai were roughly 109%,
126%, 360% and 206%, respectively.
Asian Journal of Empirical Research, 6(7)2016: 167-186
173
In contrast, Table 2 shows that six provinces of sub-group 1 (including Dong Thap, Kien Giang, Tra
Vinh, Soc Trang, Bac Lieu and Ca Mau) had the higher share of agriculture, forestry and fishery to
GDP compared with the national average due to their comparative advantages in geographical
locations and weather. Eight of the 26 provinces of sub-group 1 (comprising Quang Ninh, Hanoi,
Vinh Phuc, Da Nang, Khanh Hoa, HCMC, Binh Duong, Dong Nai and Ba Ria-Vung Tau) are main
revenue contributors to the budget of the central government. For example, in 2011, real transfers
per capita of Hanoi, HCMC and Binh Duong to the central budget were approximately VND 1,240
thousand, VND 2,225 thousand and VND 1,694 thousand, respectively.
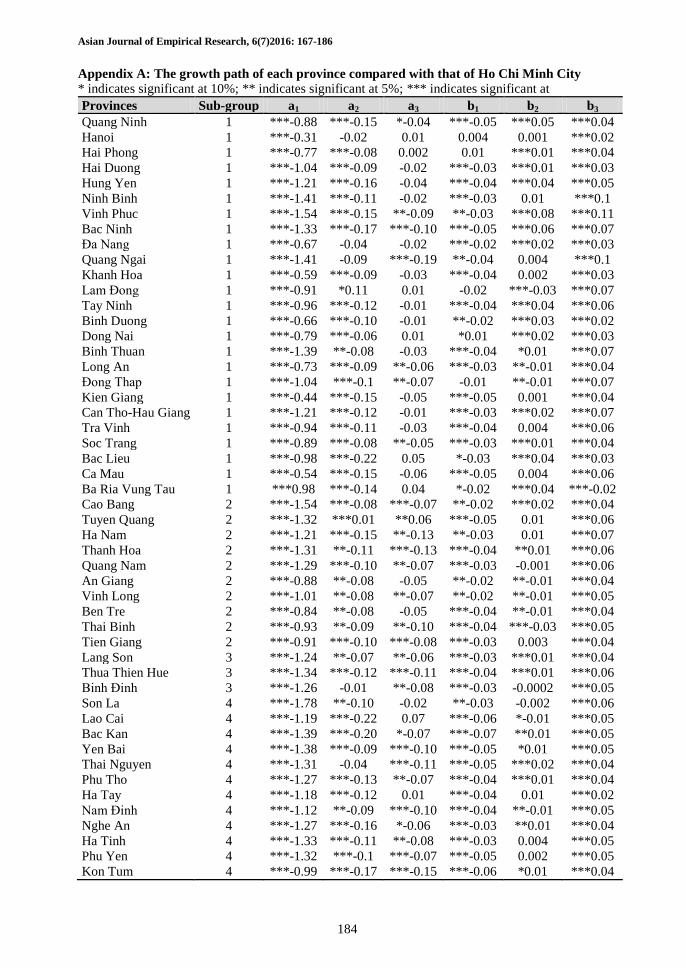
Appendix A contains the several results of time-series tests comparing the logarithm of GDP per
capita of each province and that of Ho Chi Minh City. Appendix B, similarly lists the comparison of
the logarithm of GDP per capita between each province and the national average. As indicated in
Appendix A, the results show that during the sub-period 1990-1994, a majority of provinces of sub-
group 1 (excluding Hanoi, Hai Phong, Lam Dong and Dong Thap) tended to diverge downward. In
contrast, from 1995 to 2003, 14 of the 26 provinces of this sub-group converged upward, while three
provinces (including Dong Thap, Lam Dong and Long An) kept falling behind. However, during the
sub-period 2004-2011, all provinces of sub-group 1 tended to converge upward. A notable point is
that for the whole period 1990-2011, Dong Nai had a tendency of upward convergence. The results
in Appendix B indicate that during the sub-period 1990-1994, 11 of the 26 provinces of sub-group 1
tended to diverge downward, while Hanoi, Hai Phong, HCMC, Binh Duong and Dong Nai diverged
upward. Between 1995 and 2003, ten of the 26 provinces of sub-group 1 diverged from the national
average. However, during the sub-period 2004-2011, a majority of provinces of sub-group 1
converged toward. Only four provinces (including QuangNinh, Tay Ninh, Kien Giang and Ca Mau)
diverged upward, while Ha Duong diverged downward during the last sub-period.
Of particular interest is that only Ba Ria-Vung Tau started out with a higher GDP per capita than that
of HCMC. This was mainly because of Ba Ria-Vung Tau’s oil resources. In relation to HCMC, the
result in Appendix A shows that during the sub-period 1990-1994 and 2004-2011, Ba Ria-Vung Tau
had tendency of downward convergence with HCMC but tended to diverge upward from 1995 to
2003. When comparing Ba Ria-Vung Tau with the national average, Ba Ria-Vung Tau diverged
upward between 1995 and 2003, while it then converged downward from 2004 to 2011.
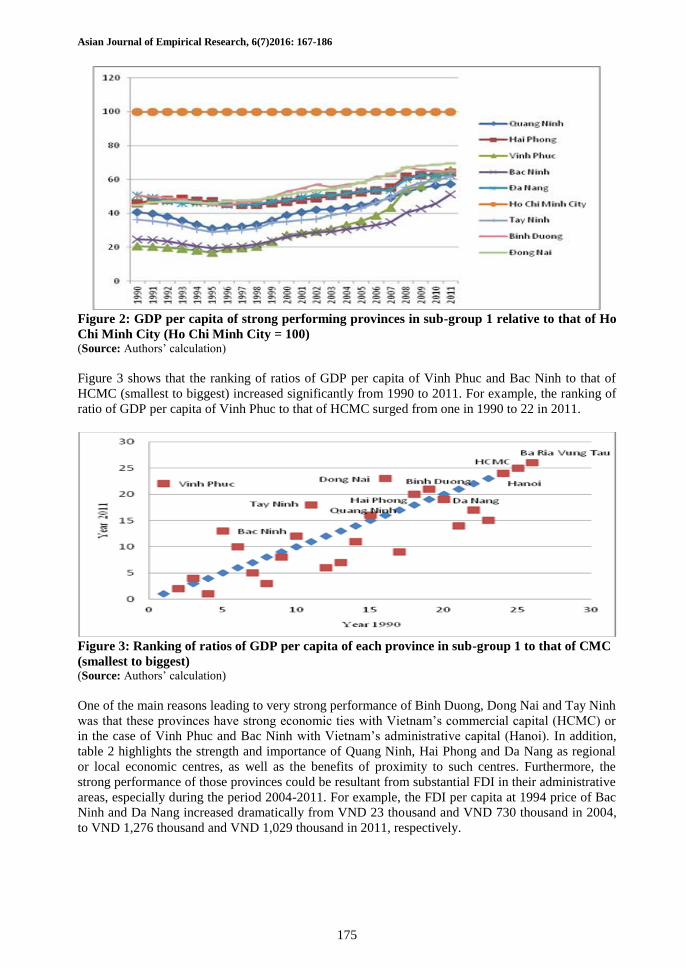
An analysis of ratios of GDP per capita of each province in sub-group 1 to that of HCMC suggests
that Vinh Phuc, Bac Ninh, Dong Nai and Binh Duong have been strongest performers. For instance,
in Figure 2, HCMC is presented by a horizontal line at 100%, while Vinh Phuc is shown as most
clearly catching up with HCMC, from approximately 20% of HCMC in 1990 to 66% in 2011.
Similarly, the ratio of GDP per capita of Bac Ninh relative to that of HCMC increased dramatically
from 25% in 1990 to 51% in 2011. In addition, this Figure indicates that QuangNinh, Hai Phong, Da
Nang and Tay Ninh have been very strong performing provinces.
Asian Journal of Empirical Research, 6(7)2016: 167-186
174
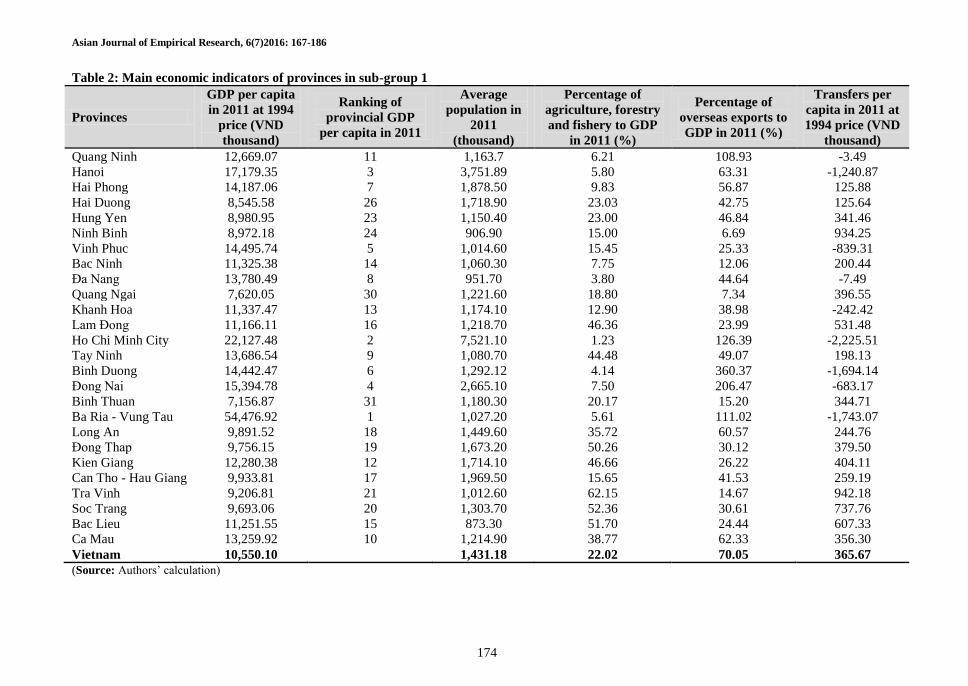
Table 2: Main economic indicators of provinces in sub-group 1
Provinces
GDP per capita
in 2011 at 1994
price (VND
thousand)
Ranking of
provincial GDP
per capita in 2011
Average
population in
2011
(thousand)
Percentage of
agriculture, forestry
and fishery to GDP
in 2011 (%)
Percentage of
overseas exports to
GDP in 2011 (%)
Transfers per
capita in 2011 at
1994 price (VND
thousand)
Quang Ninh 12,669.07 11 1,163.7 6.21 108.93 -3.49
Hanoi 17,179.35 3 3,751.89 5.80 63.31 -1,240.87
Hai Phong 14,187.06 7 1,878.50 9.83 56.87 125.88
Hai Duong 8,545.58 26 1,718.90 23.03 42.75 125.64
Hung Yen 8,980.95 23 1,150.40 23.00 46.84 341.46
Ninh Binh 8,972.18 24 906.90 15.00 6.69 934.25
Vinh Phuc 14,495.74 5 1,014.60 15.45 25.33 -839.31
Bac Ninh 11,325.38 14 1,060.30 7.75 12.06 200.44
Đa Nang 13,780.49 8 951.70 3.80 44.64 -7.49
Quang Ngai 7,620.05 30 1,221.60 18.80 7.34 396.55
Khanh Hoa 11,337.47 13 1,174.10 12.90 38.98 -242.42
Lam Đong 11,166.11 16 1,218.70 46.36 23.99 531.48
Ho Chi Minh City 22,127.48 2 7,521.10 1.23 126.39 -2,225.51
Tay Ninh 13,686.54 9 1,080.70 44.48 49.07 198.13
Binh Duong 14,442.47 6 1,292.12 4.14 360.37 -1,694.14
Đong Nai 15,394.78 4 2,665.10 7.50 206.47 -683.17
Binh Thuan 7,156.87 31 1,180.30 20.17 15.20 344.71
Ba Ria - Vung Tau 54,476.92 1 1,027.20 5.61 111.02 -1,743.07
Long An 9,891.52 18 1,449.60 35.72 60.57 244.76
Đong Thap 9,756.15 19 1,673.20 50.26 30.12 379.50
Kien Giang 12,280.38 12 1,714.10 46.66 26.22 404.11
Can Tho - Hau Giang 9,933.81 17 1,969.50 15.65 41.53 259.19
Tra Vinh 9,206.81 21 1,012.60 62.15 14.67 942.18
Soc Trang 9,693.06 20 1,303.70 52.36 30.61 737.76
Bac Lieu 11,251.55 15 873.30 51.70 24.44 607.33
Ca Mau 13,259.92 10 1,214.90 38.77 62.33 356.30
Vietnam 10,550.10 1,431.18 22.02 70.05 365.67
(Source: Authors’ calculation)
Asian Journal of Empirical Research, 6(7)2016: 167-186
175
Figure 2: GDP per capita of strong performing provinces in sub-group 1 relative to that of Ho
Chi Minh City (Ho Chi Minh City = 100) (Source: Authors’ calculation)
Figure 3 shows that the ranking of ratios of GDP per capita of Vinh Phuc and Bac Ninh to that of
HCMC (smallest to biggest) increased significantly from 1990 to 2011. For example, the ranking of
ratio of GDP per capita of Vinh Phuc to that of HCMC surged from one in 1990 to 22 in 2011.
Figure 3: Ranking of ratios of GDP per capita of each province in sub-group 1 to that of CMC
(smallest to biggest) (Source: Authors’ calculation)
One of the main reasons leading to very strong performance of Binh Duong, Dong Nai and Tay Ninh
was that these provinces have strong economic ties with Vietnam’s commercial capital (HCMC) or
in the case of Vinh Phuc and Bac Ninh with Vietnam’s administrative capital (Hanoi). In addition,
table 2 highlights the strength and importance of Quang Ninh, Hai Phong and Da Nang as regional
or local economic centres, as well as the benefits of proximity to such centres. Furthermore, the
strong performance of those provinces could be resultant from substantial FDI in their administrative
areas, especially during the period 2004-2011. For example, the FDI per capita at 1994 price of Bac
Ninh and Da Nang increased dramatically from VND 23 thousand and VND 730 thousand in 2004,
to VND 1,276 thousand and VND 1,029 thousand in 2011, respectively.
Asian Journal of Empirical Research, 6(7)2016: 167-186
176
Sub-group 2 includes ten provinces: Cao Bang, Tuyen Quang, Ha Nam, Thai Binh, Thanh Hoa,
Quang Nam, An Giang, Tien Giang, Vinh Long and Ben Tre. Figure 4 shows movements over time
of three measures of inequality in GDP per capita: the CVW, Theil coefficient and Gini coefficient.
As can be seen from this figure, the CVW, Theil coefficient and Gini coefficient tended to increase
slightly from 1990 to 1995. They then decreased between 1996 and 2011. For example, the CVW
increased from approximately 0.20 in 1990 to 0.22 in 1995 before declining to 0.12 in 2011.
Figure 4: Coefficient of variation (CVW), Theil coefficient and Gini coefficient of GDP per
capita at 1994 price of provinces in sub-group 2 (Source: Authors’ calculation)
One of the most important reasons resulting in the decline in the disparities in GDP per capita across
provinces of sub-group 2 was that poorer provinces in this sub-group received significant subsidies
from the central government through its public investment and poverty reduction programs. For
instance, the Tuyen Quang Hydroelectric Plant was built during the period 2002-2008 with total
investment VND 7,500 billion, accounting for approximately 112% of the nominal GDP of Tuyen
Quang in 2008. In addition, Cao Bang, Thanh Hoa and Quang Nam were subsidised significantly
through Nationally Targeted Programs such as the Hunger Eradication and Poverty Reduction
Programme and the Programme for socio-economic Development in Communes facing Extreme
Hardship in ethnic minority and mountainous areas.
Table 3 shows main characteristics of provinces of sub-group 2. In 2011, all ten provinces of this
sub-group had lower GDP per capita compared with the national average. In addition, they are
agricultural provinces in which some of them (including Thai Binh, An Giang, Tien Giang, Vinh
Long and Ben Tre) have advantages of agriculture and fishery production. For example, in 2011, the
percentages of agriculture, forestry and fishery to GDP of Tien Giang, Vinh Long and Ben Tre were
approximately 47%, 50% and 51%, respectively. Also, four of the 10 provinces of sub-group 2 are
significant subsidy recipients from the central budget. For instance, in 2011, transfers per capita at
1994 price from the central government to Cao Bang and Tuyen Quang were approximately VND
2,415 thousand and VND 1,077 thousand, respectively.
The results in Appendix A indicate that from 1990 to 1994 all 10 provinces of sub-group 2 diverged
from HCMC, and five of them kept falling behind between 1995 and 2003. In contrast, during the
last period 2004-2011, all provinces of this sub-group had a propensity to catch up with HCMC. In
relation to the national average, the results in Appendix B show that between 1990 and 2003 almost
all provinces of sub-group 2 diverged downward. However, from 2004 to 2011, a majority of them
converged upward toward the national average.

Asian Journal of Empirical Research, 6(7)2016: 167-186
177
Table 3: A set of economic indicators of provinces of sub-group 2
Provinces
GDP per
capita in
2011 at
1994 price
(VND
thousand)
Ranking of
provincial
GDP per
capita in
Vietnam in
2011
Average
population
in 2011
(Thousand)
Percentage of
agriculture,
forestry and
fishery to GDP
in 2011 (%)
Percentage of
overseas
exports to
GDP in 2011
(%)
Transfers per
capita in 2011
at 1994 price
(VND
thousand)
Cao Bang 6,361.50 40 515.00 33.31 5.03 2,415.66
Tuyen Quang 6,538.82 37 730.80 37.47 1.10 1,077.09
Ha Nam 7,785.74 29 786.90 20.05 23.93 665.05
Thai Binh 7,040.31 33 1,786.00 37.26 19.19 478.29
Thanh Hoa 6,689.27 36 3,412.60 23.84 5.66 788.58
Quang Nam 7,113.48 32 1,435.00 20.67 22.31 754.93
An Giang 8,698.47 25 2,151.00 33.74 33.63 228.36
Tien Giang 8,996.41 22 1,682.60 47.19 30.59 222.91
Vinh Long 8,356.69 28 1,028.60 49.93 19.06 268.33
Ben Tre 8,461.92 27 1,257.80 50.75 18.53 376.93
Vietnam 10,550.10
1,431.18 22.02 70.05 365.67
(Source: Authors’ calculation)
Sub-group 3 consists of Lang Son, Thua Thien Hue and Binh Dinh. Figure 7 shows that the CVW,
Theil coefficient and Gini coefficient fluctuated slightly from 1990 to 1993, and then peaked in 1995
before falling afterwards (except 2004 and 2005). For instance, the CVW fluctuated around 0.05
between 1990 and 1993, reached a peak at 0.097 in 1995 before falling to 0.047 in 2011.
Figure 7: Coefficient of variation (CVW), Theil coefficient and Gini coefficient of GDP per
capita at 1994 price across provinces in sub-group 3 (Source: Authors’ calculation)
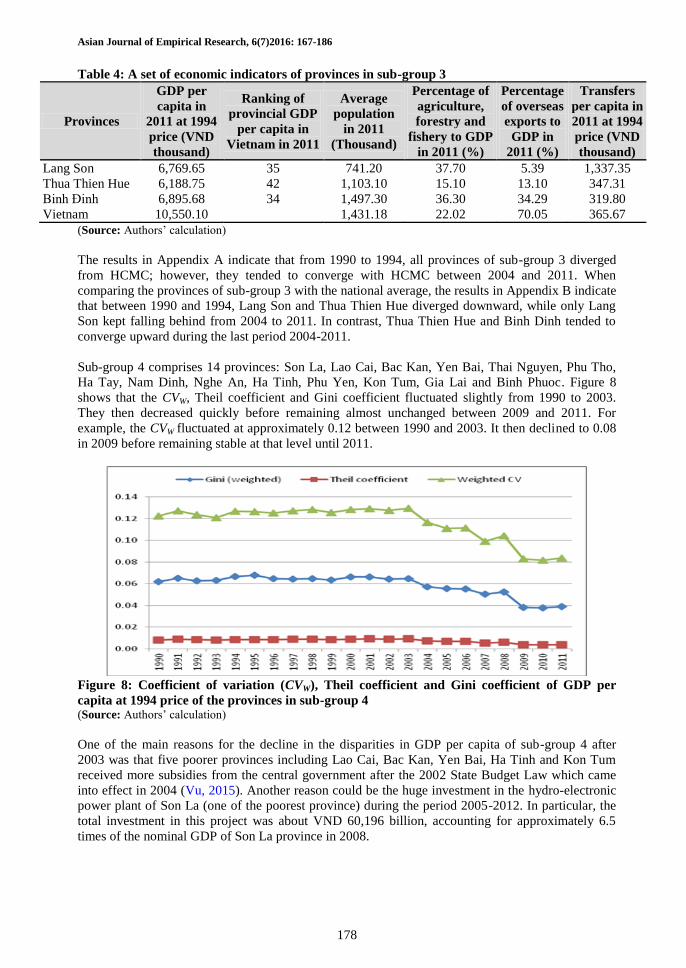
Table 4 indicates that in 2011, GDP per capita of all provinces in sub-group 3 were approximately
two-thirds of the national average. In 2011, the percentage of agriculture, forestry and fishery to
GDP of Lang Son and Binh Dinh were higher than the national average. All the provinces received
significant subsidies from the central government. For example, in 2011, transfers per capita from
the central government of Lang Son were roughly 3.5 times of the national average.
Asian Journal of Empirical Research, 6(7)2016: 167-186
178
Table 4: A set of economic indicators of provinces in sub-group 3
Provinces
GDP per
capita in
2011 at 1994
price (VND
thousand)
Ranking of
provincial GDP
per capita in
Vietnam in 2011
Average
population
in 2011
(Thousand)
Percentage of
agriculture,
forestry and
fishery to GDP
in 2011 (%)
Percentage
of overseas
exports to
GDP in
2011 (%)
Transfers
per capita in
2011 at 1994
price (VND
thousand)
Lang Son 6,769.65 35 741.20 37.70 5.39 1,337.35
Thua Thien Hue 6,188.75 42 1,103.10 15.10 13.10 347.31
Binh Đinh 6,895.68 34 1,497.30 36.30 34.29 319.80
Vietnam 10,550.10 1,431.18 22.02 70.05 365.67
(Source: Authors’ calculation)
The results in Appendix A indicate that from 1990 to 1994, all provinces of sub-group 3 diverged
from HCMC; however, they tended to converge with HCMC between 2004 and 2011. When
comparing the provinces of sub-group 3 with the national average, the results in Appendix B indicate
that between 1990 and 1994, Lang Son and Thua Thien Hue diverged downward, while only Lang
Son kept falling behind from 2004 to 2011. In contrast, Thua Thien Hue and Binh Dinh tended to
converge upward during the last period 2004-2011.
Sub-group 4 comprises 14 provinces: Son La, Lao Cai, Bac Kan, Yen Bai, Thai Nguyen, Phu Tho,
Ha Tay, Nam Dinh, Nghe An, Ha Tinh, Phu Yen, Kon Tum, Gia Lai and Binh Phuoc. Figure 8
shows that the CVW, Theil coefficient and Gini coefficient fluctuated slightly from 1990 to 2003.
They then decreased quickly before remaining almost unchanged between 2009 and 2011. For
example, the CVW fluctuated at approximately 0.12 between 1990 and 2003. It then declined to 0.08
in 2009 before remaining stable at that level until 2011.
Figure 8: Coefficient of variation (CVW), Theil coefficient and Gini coefficient of GDP per
capita at 1994 price of the provinces in sub-group 4 (Source: Authors’ calculation)
One of the main reasons for the decline in the disparities in GDP per capita of sub-group 4 after
2003 was that five poorer provinces including Lao Cai, Bac Kan, Yen Bai, Ha Tinh and Kon Tum
received more subsidies from the central government after the 2002 State Budget Law which came
into effect in 2004 (Vu, 2015). Another reason could be the huge investment in the hydro-electronic
power plant of Son La (one of the poorest province) during the period 2005-2012. In particular, the
total investment in this project was about VND 60,196 billion, accounting for approximately 6.5
times of the nominal GDP of Son La province in 2008.
Asian Journal of Empirical Research, 6(7)2016: 167-186
179
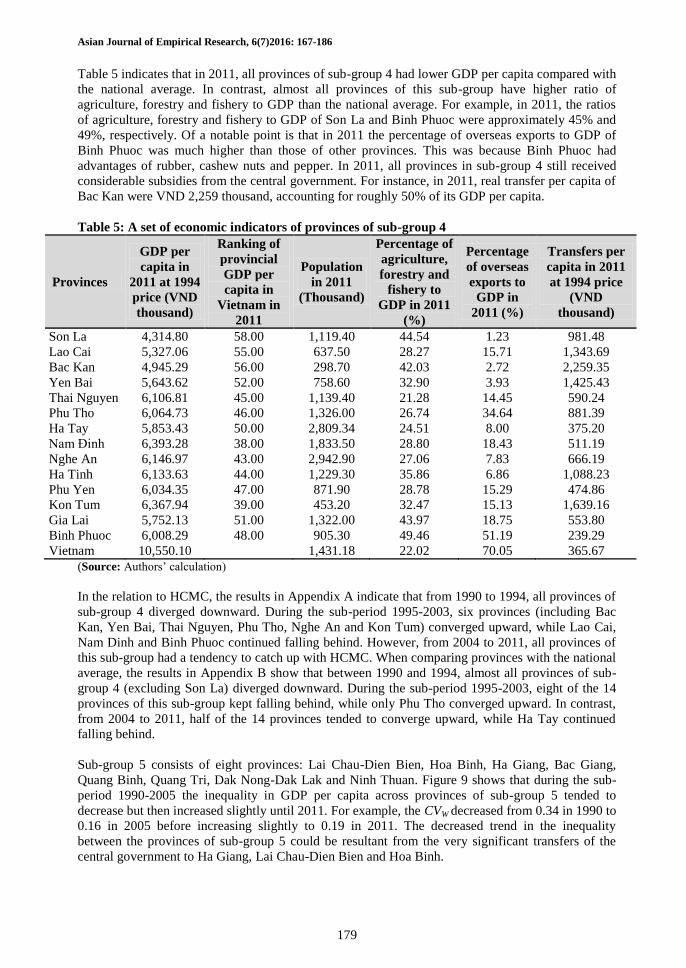
Table 5 indicates that in 2011, all provinces of sub-group 4 had lower GDP per capita compared with
the national average. In contrast, almost all provinces of this sub-group have higher ratio of
agriculture, forestry and fishery to GDP than the national average. For example, in 2011, the ratios
of agriculture, forestry and fishery to GDP of Son La and Binh Phuoc were approximately 45% and
49%, respectively. Of a notable point is that in 2011 the percentage of overseas exports to GDP of
Binh Phuoc was much higher than those of other provinces. This was because Binh Phuoc had
advantages of rubber, cashew nuts and pepper. In 2011, all provinces in sub-group 4 still received
considerable subsidies from the central government. For instance, in 2011, real transfer per capita of
Bac Kan were VND 2,259 thousand, accounting for roughly 50% of its GDP per capita.
Table 5: A set of economic indicators of provinces of sub-group 4
Provinces
GDP per
capita in
2011 at 1994
price (VND
thousand)
Ranking of
provincial
GDP per
capita in
Vietnam in
2011
Population
in 2011
(Thousand)
Percentage of
agriculture,
forestry and
fishery to
GDP in 2011
(%)
Percentage
of overseas
exports to
GDP in
2011 (%)
Transfers per
capita in 2011
at 1994 price
(VND
thousand)
Son La 4,314.80 58.00 1,119.40 44.54 1.23 981.48
Lao Cai 5,327.06 55.00 637.50 28.27 15.71 1,343.69
Bac Kan 4,945.29 56.00 298.70 42.03 2.72 2,259.35
Yen Bai 5,643.62 52.00 758.60 32.90 3.93 1,425.43
Thai Nguyen 6,106.81 45.00 1,139.40 21.28 14.45 590.24
Phu Tho 6,064.73 46.00 1,326.00 26.74 34.64 881.39
Ha Tay 5,853.43 50.00 2,809.34 24.51 8.00 375.20
Nam Đinh 6,393.28 38.00 1,833.50 28.80 18.43 511.19
Nghe An 6,146.97 43.00 2,942.90 27.06 7.83 666.19
Ha Tinh 6,133.63 44.00 1,229.30 35.86 6.86 1,088.23
Phu Yen 6,034.35 47.00 871.90 28.78 15.29 474.86
Kon Tum 6,367.94 39.00 453.20 32.47 15.13 1,639.16
Gia Lai 5,752.13 51.00 1,322.00 43.97 18.75 553.80
Binh Phuoc 6,008.29 48.00 905.30 49.46 51.19 239.29
Vietnam 10,550.10 1,431.18 22.02 70.05 365.67
(Source: Authors’ calculation)
In the relation to HCMC, the results in Appendix A indicate that from 1990 to 1994, all provinces of
sub-group 4 diverged downward. During the sub-period 1995-2003, six provinces (including Bac
Kan, Yen Bai, Thai Nguyen, Phu Tho, Nghe An and Kon Tum) converged upward, while Lao Cai,
Nam Dinh and Binh Phuoc continued falling behind. However, from 2004 to 2011, all provinces of
this sub-group had a tendency to catch up with HCMC. When comparing provinces with the national
average, the results in Appendix B show that between 1990 and 1994, almost all provinces of sub-
group 4 (excluding Son La) diverged downward. During the sub-period 1995-2003, eight of the 14
provinces of this sub-group kept falling behind, while only Phu Tho converged upward. In contrast,
from 2004 to 2011, half of the 14 provinces tended to converge upward, while Ha Tay continued
falling behind.
Sub-group 5 consists of eight provinces: Lai Chau-Dien Bien, Hoa Binh, Ha Giang, Bac Giang,
Quang Binh, Quang Tri, Dak Nong-Dak Lak and Ninh Thuan. Figure 9 shows that during the sub-
period 1990-2005 the inequality in GDP per capita across provinces of sub-group 5 tended to
decrease but then increased slightly until 2011. For example, the CVW decreased from 0.34 in 1990 to
0.16 in 2005 before increasing slightly to 0.19 in 2011. The decreased trend in the inequality
between the provinces of sub-group 5 could be resultant from the very significant transfers of the
central government to Ha Giang, Lai Chau-Dien Bien and Hoa Binh.

Asian Journal of Empirical Research, 6(7)2016: 167-186
180
Figure 9: Coefficient of variation (CVW), Theil coefficient and Gini coefficient of GDP per
capita at 1994 price of the sub-group 5 (Source: Authors’ calculation)
Table 6 shows that a majority of provinces of sub-group 5 had very low ranking of GDP per capita.
In 2011, the rankings of GDP per capita of Ha Giang, Lai Chau-Dien Bien and Back Giang were
61/61, 60/61 and 59/61, respectively. In the same year, almost all provinces of this sub-group had
high percentage of agriculture, forestry and fishery to GDP. Of particular interest is that the
percentage of overseas exports to GDP of Dak Nong-Dak Lak was high, for example roughly 53% in
2011. This was because the province has been in a strong position of coffee production. In addition,
all provinces of sub-group 5, especially Ha Giang, Lai Chau-Dien Bien and Hoa Binh, were
significant recipients in terms of subsidies from the central government. For example, in 2011 the
transfers per capita at 1994 prices from the central government to Ha Giang and Lai Chau-Dien Bien
were approximately VND 2,182 thousand and VND 2,069 thousand, accounting for 57% and 53% of
their GDP per capita, respectively.
Table 6: A set of economic indicators of provinces of augmented sub-group 5
Provinces
GDP per
capita in
2011 at
1994 price
(VND
thousand)
Ranking of
provincial
GDP per
capita in
Vietnam in
2011
Population
in 2011
(Thousand)
Percentage
of
agriculture,
forestry and
fishery to
GDP in 2011
(%)
Percentage
of overseas
exports to
GDP in 2011
(%)
Transfers
per capita
in 2011 at
1994 price
(VND
thousand)
Lai Chau-Dien Bien 3,869.42 60 903.50 32.62 6.37 2,069.53
Hoa Binh 5,512.74 53 799.80 20.76 7.46 1,725.35
Ha Giang 3,824.47 61 746.30 32.12 3.86 2,181.89
Bac Giang 4,271.87 59 1,574.30 31.39 22.43 628.10
Quang Binh 4,649.56 57 853.00 21.07 11.43 668.51
Quang Tri 5,463.34 54 604.70 27.89 7.13 864.29
Dak Nong-Dak Lak 6,288.67 41 2,288.10 55.32 53.41 631.62
Ninh Thuan 5,864.67 49 569.00 43.06 19.27 834.48
Vietnam 10,550.10 1,431.18 22.02 70.05 365.67
(Source: Authors’ calculation)
The results of time series tests (Appendix A) indicate that from 1990 to 1994, all provinces of sub-
group 5 diverged downward from HCMC. Between 1995 and 2003, Lai Chau-Dien Bien, Hoa Binh,
Dak Nong-Dak Lak and Ninh Thuan kept falling behind, while only Ha Giang tended to converge
upward. However, from 2005 to 2011, all provinces of this sub-group tended to converge with
HCMC.
Asian Journal of Empirical Research, 6(7)2016: 167-186
181
In the relation to the national average, the results of time-series regressions (Appendix B) show that
between 1990 and 1994 all provinces of sub-group 5 diverged downward. In addition, during the
sub-period 1995-2003, seven of the eight provinces of this sub-group (excluding Ha Giang) kept
falling behind. For the last sub-period 2004-2011, only Hoa Binh and Quang Tri tended to converge
upward, while Lai Chau-Dien Bien, Bac Giang, Quang Binh and Ninh Thuan continued falling
behind from the national average.
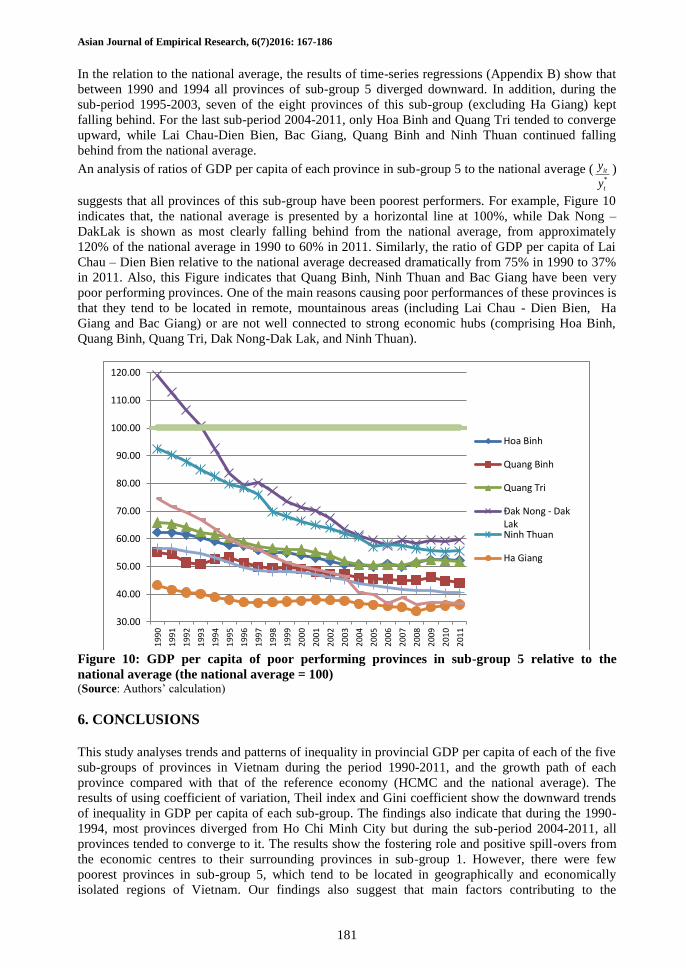
An analysis of ratios of GDP per capita of each province in sub-group 5 to the national average (*
it
t
y
y)
suggests that all provinces of this sub-group have been poorest performers. For example, Figure 10
indicates that, the national average is presented by a horizontal line at 100%, while Dak Nong –
DakLak is shown as most clearly falling behind from the national average, from approximately
120% of the national average in 1990 to 60% in 2011. Similarly, the ratio of GDP per capita of Lai
Chau – Dien Bien relative to the national average decreased dramatically from 75% in 1990 to 37%
in 2011. Also, this Figure indicates that Quang Binh, Ninh Thuan and Bac Giang have been very
poor performing provinces. One of the main reasons causing poor performances of these provinces is
that they tend to be located in remote, mountainous areas (including Lai Chau - Dien Bien, Ha
Giang and Bac Giang) or are not well connected to strong economic hubs (comprising Hoa Binh,
Quang Binh, Quang Tri, Dak Nong-Dak Lak, and Ninh Thuan).
Figure 10: GDP per capita of poor performing provinces in sub-group 5 relative to the
national average (the national average = 100) (Source: Authors’ calculation)
6. CONCLUSIONS
This study analyses trends and patterns of inequality in provincial GDP per capita of each of the five
sub-groups of provinces in Vietnam during the period 1990-2011, and the growth path of each
province compared with that of the reference economy (HCMC and the national average). The
results of using coefficient of variation, Theil index and Gini coefficient show the downward trends
of inequality in GDP per capita of each sub-group. The findings also indicate that during the 1990-
1994, most provinces diverged from Ho Chi Minh City but during the sub-period 2004-2011, all
provinces tended to converge to it. The results show the fostering role and positive spill-overs from
the economic centres to their surrounding provinces in sub-group 1. However, there were few
poorest provinces in sub-group 5, which tend to be located in geographically and economically
isolated regions of Vietnam. Our findings also suggest that main factors contributing to the
30.00
40.00
50.00
60.00
70.00
80.00
90.00
100.00
110.00
120.00
199
0
199
1
199
2
199
3
199
4
199
5
199
6
199
7
199
8
199
9
200
0
200
1
200
2
200
3
200
4
200
5
200
6
200
7
200
8
200
9
201
0
201
1
Hoa Binh
Quang Binh
Quang Tri
Đak Nong - DakLakNinh Thuan
Ha Giang

Asian Journal of Empirical Research, 6(7)2016: 167-186
182
downward trends of inequality in GDP per capita among sub-groups of provinces in Vietnam during
the period 1990-2011 include FDI, public investment and transfers from the central government to
poor provinces. This study recommends three policy implications. First, it is worth promoting further
positive spillovers of the existing economic centres (the dynamic cities/provinces) on their adjacent
provinces. Second, the central government should pay more attention to the poorest provinces
through its investment policies and budget transfer mechanism from central to provincial
governments in order to safeguard their socio-economic development. Third, economic efficiencies
in public expenditure programs, therefore, is a primary determinant of the success of past economic
growth in reducing regional disparity.
Funding: This study received no specific financial support.
Competing Interests: The authors declare that they have no conflict of interests.
Contributors/Acknowledgement: All authors participated equally in designing and estimation of current
research.
Views and opinions expressed in this study are the views and opinions of the authors, Asian Journal of
Empirical Research shall not be responsible or answerable for any loss, damage or liability etc. caused in
relation to/arising out of the use of the content.
References
Apergis, N., Panopoulou, E., & Tsoumas, C. (2010). Old wine in a new bottle: Growth convergence
dynamics in the EU. Atlantic Economic Journal, 38(2), 169–181.
Barro, R. J., & Sala-i-Martin, X. (1991). Convergence across states and regions. Brooking Papers on
Economic Activity, 1, 107–182.
Bartkowska, M., & Riedl, A. (2012). Regional convergence clubs in Europe: Identification and
conditioning factors. Economic Modelling, 29(1), 22-31.
Carlino, G., & Mills, L. (1996). Convergence and the U.S. states: A time-series analysis. Journal of
Regional Science, 36(4), 597–616.
Chang, G. H. (2002). The cause and cure of China's widening income disparity. China Economic
Review, 13(4), 335-340.
Chow, G. C. (1960). Tests of equality between sets of coefficients in two linear regressions.
Econometrica, 28, 591-665.
Dollar, D. (2002). Reform, growth and poverty in Vietnam. World Bank, Washington, D.C.
Garcia, J. G., & Soelistianingsih, L. (1998). Why do differences in provincial incomes persist in
Indonesia?. Bulletin of Indonesian Economic Studies, 34(1), 95–120.
Genc, I. H., Miller, J. R., & Rupasingha, A. (2011). Stochastic convergence tests for US regional per
capita personal income; some further evidence: A research note. The Annals of Regional
Science, 46(2), 369–377.
Gen, Y. L. (1999). China's changing regional disparities during the reform period. Economic
Geography, 75(1), 59-70.
Herrerias, M. J., & Ordonez, J. (2012). New evidence on the role of regional clusters and
convergence in China (1952–2008). China Economic Review, 23(4), 1120–1133.
Jian, T., Sachs, J. D., & Warner, A. M. (1996). Trends in regional inequality in China. China
Economic Review, 7(1), 1–21.
Kakwani, N. C. (1980). Inequality and poverty - methods of estimation and policy applications,
World Bank, Oxford University Press.
Kharisma, B., & Saleh, S. (2013). Convergence of income among provinces in Indonesia, 1984-
2008: a panel data approach. Journal of Indonesian Economy and Business, 28(2), 167–187.
Le, K. Q. (2003). An assessment of spatial differentiation in Vietnam’s social-economic development
1990-2000. University of Akron, Department of Public Administration and Urban Affairs.
Le, T. H., & Booth, A. L. (2013). Inequality in Vietnamese urban–rural living standards, 1993–2006.
Review of Income and Wealth, 60(4), 862-886.
Liu, A. Y. C. (2001). Markets, inequality and poverty in Vietnam. Asian Economic Journal, 15(2),
217–35.
Asian Journal of Empirical Research, 6(7)2016: 167-186
183
Liu, A. Y. C. (2008). Changes in urban inequality in Vietnam: 1992-1998. Economic Systems, 32,
410–425.
Loewy, M. B., & Papell, D. H. (1996). Are US regional incomes converging? Some further
evidence. Journal of Monetary Economics, 38(3), 587–598.
Malesky, E., & London, J., (2014). The political economy of development in China and Vietnam.
Annual Review of Political Science, 17, 395-419.
Narayan, P. K. (2008). Evidence of panel stationarity from Chinese provincial and regional income.
China Economic Review, 19(2), 274–286.
Neri, F. (1998). The economic performance of the states and territories of Australia: 1861-1992. The
Economic Record, 74(225), 105–120.
Nguyen, D. T., Smith, C., & Meyer-Boehm, G. (2006). Growth and divergence in output per capita
and labour productivity among the states of Australia, 1984-85 to 2004-05, Department of
Accounting, Finance, and Economics, Griffith University, Australia.
Nguyen, H. H. (2009). Regional welfare disparities and regional economic growth in Vietnam.
Wageningen University.
Pedroni, P., & Yao, J. Y. (2006). Regional income divergence in China. Journal of Asian
Economics, 17(2), 294–315.
Phillips, P. C., & Sul, D. (2007). Transition modelling and econometric convergence tests.
Econometrica, 75(6), 1771–1855.
Phillips, P. C., & Sul, D. (2009). Economic transition and growth. Journal of Applied Econometrics,
24(7), 1153–1185.
Resosudarmo, B. P., & Vidyattama, Y. (2006). Regional income disparity in Indonesia: A panel data
analysis. ASEAN Economic Bulletin, 23(1), 31–44.
Sala-i-Martin, X. X. (1996). Regional cohesion: Evidence and theories of regional growth and
convergence. European Economic Review, 40(6), 1325–1352.
Shankar, R., & Shah, A. (2003). Bridging the economic divide within countries: A scorecard on the
performance of regional policies in reducing regional income disparities. World Development,
31(8), 1421–1441.
Smith, C. (2004). For richer or poorer: recent trends in Australia’s regional income dynamics.
Australasian Journal of Regional Studies, 10(2), 195–223.
Takahashi, K. (2007). Sources of regional income disparity in rural Vietnam: Oaxaca-Blinder
Decomposition (No. 95), Institute of Developing Economies.
Theil, H. (1967). Economics and information theory. North-Holland Publishing Company,
Amsterdam, Netherlands.
Vu, X. B. (2015). Disparities and growth within APEC countries, 1990~2011. Journal of Economic
Integration, 30(3), 399-428.
Vu, X. B., Nguyen, D. T., Nghiem, H. S., & Hoang, V. N. (2016). Provincial divergence and sub-
group convergence in Vietnam’s GDP per capita: 1990 – 2011. Journal of Asian Economics,
(under review).
Walle, D., & Gunewardena, D. (2001). Sources of ethnic inequality in Viet Nam. Journal of
Development Economics, 65(1), 177–207.
Williamson, J. G. (1965). Regional inequality and the process of national development: A
description of the patterns. Economic Development and Cultural Change, 13(2), 1-84.
World Bank (2016). World Bank indicators. Washington, D.C. http://data.worldbank.org/indicator
(accessed July 30, 2016).
Asian Journal of Empirical Research, 6(7)2016: 167-186
184
Appendix A: The growth path of each province compared with that of Ho Chi Minh City
* indicates significant at 10%; ** indicates significant at 5%; *** indicates significant at
Provinces Sub-group a1 a2 a3 b1 b2 b3
Quang Ninh 1 ***-0.88 ***-0.15 *-0.04 ***-0.05 ***0.05 ***0.04
Hanoi 1 ***-0.31 -0.02 0.01 0.004 0.001 ***0.02
Hai Phong 1 ***-0.77 ***-0.08 0.002 0.01 ***0.01 ***0.04
Hai Duong 1 ***-1.04 ***-0.09 -0.02 ***-0.03 ***0.01 ***0.03
Hung Yen 1 ***-1.21 ***-0.16 -0.04 ***-0.04 ***0.04 ***0.05
Ninh Binh 1 ***-1.41 ***-0.11 -0.02 ***-0.03 0.01 ***0.1
Vinh Phuc 1 ***-1.54 ***-0.15 **-0.09 **-0.03 ***0.08 ***0.11
Bac Ninh 1 ***-1.33 ***-0.17 ***-0.10 ***-0.05 ***0.06 ***0.07
Đa Nang 1 ***-0.67 -0.04 -0.02 ***-0.02 ***0.02 ***0.03
Quang Ngai 1 ***-1.41 -0.09 ***-0.19 **-0.04 0.004 ***0.1
Khanh Hoa 1 ***-0.59 ***-0.09 -0.03 ***-0.04 0.002 ***0.03
Lam Đong 1 ***-0.91 *0.11 0.01 -0.02 ***-0.03 ***0.07
Tay Ninh 1 ***-0.96 ***-0.12 -0.01 ***-0.04 ***0.04 ***0.06
Binh Duong 1 ***-0.66 ***-0.10 -0.01 **-0.02 ***0.03 ***0.02
Dong Nai 1 ***-0.79 ***-0.06 0.01 *0.01 ***0.02 ***0.03
Binh Thuan 1 ***-1.39 **-0.08 -0.03 ***-0.04 *0.01 ***0.07
Long An 1 ***-0.73 ***-0.09 **-0.06 ***-0.03 **-0.01 ***0.04
Đong Thap 1 ***-1.04 ***-0.1 **-0.07 -0.01 **-0.01 ***0.07
Kien Giang 1 ***-0.44 ***-0.15 -0.05 ***-0.05 0.001 ***0.04
Can Tho-Hau Giang 1 ***-1.21 ***-0.12 -0.01 ***-0.03 ***0.02 ***0.07
Tra Vinh 1 ***-0.94 ***-0.11 -0.03 ***-0.04 0.004 ***0.06
Soc Trang 1 ***-0.89 ***-0.08 **-0.05 ***-0.03 ***0.01 ***0.04
Bac Lieu 1 ***-0.98 ***-0.22 0.05 *-0.03 ***0.04 ***0.03
Ca Mau 1 ***-0.54 ***-0.15 -0.06 ***-0.05 0.004 ***0.06
Ba Ria Vung Tau 1 ***0.98 ***-0.14 0.04 *-0.02 ***0.04 ***-0.02
Cao Bang 2 ***-1.54 ***-0.08 ***-0.07 **-0.02 ***0.02 ***0.04
Tuyen Quang 2 ***-1.32 ***0.01 **0.06 ***-0.05 0.01 ***0.06
Ha Nam 2 ***-1.21 ***-0.15 **-0.13 **-0.03 0.01 ***0.07
Thanh Hoa 2 ***-1.31 **-0.11 ***-0.13 ***-0.04 **0.01 ***0.06
Quang Nam 2 ***-1.29 ***-0.10 **-0.07 ***-0.03 -0.001 ***0.06
An Giang 2 ***-0.88 **-0.08 -0.05 **-0.02 **-0.01 ***0.04
Vinh Long 2 ***-1.01 **-0.08 **-0.07 **-0.02 **-0.01 ***0.05
Ben Tre 2 ***-0.84 **-0.08 -0.05 ***-0.04 **-0.01 ***0.04
Thai Binh 2 ***-0.93 **-0.09 **-0.10 ***-0.04 ***-0.03 ***0.05
Tien Giang 2 ***-0.91 ***-0.10 ***-0.08 ***-0.03 0.003 ***0.04
Lang Son 3 ***-1.24 **-0.07 **-0.06 ***-0.03 ***0.01 ***0.04
Thua Thien Hue 3 ***-1.34 ***-0.12 ***-0.11 ***-0.04 ***0.01 ***0.06
Binh Đinh 3 ***-1.26 -0.01 **-0.08 ***-0.03 -0.0002 ***0.05
Son La 4 ***-1.78 **-0.10 -0.02 **-0.03 -0.002 ***0.06
Lao Cai 4 ***-1.19 ***-0.22 0.07 ***-0.06 *-0.01 ***0.05
Bac Kan 4 ***-1.39 ***-0.20 *-0.07 ***-0.07 **0.01 ***0.05
Yen Bai 4 ***-1.38 ***-0.09 ***-0.10 ***-0.05 *0.01 ***0.05
Thai Nguyen 4 ***-1.31 -0.04 ***-0.11 ***-0.05 ***0.02 ***0.04
Phu Tho 4 ***-1.27 ***-0.13 **-0.07 ***-0.04 ***0.01 ***0.04
Ha Tay 4 ***-1.18 ***-0.12 0.01 ***-0.04 0.01 ***0.02
Nam Đinh 4 ***-1.12 **-0.09 ***-0.10 ***-0.04 **-0.01 ***0.05
Nghe An 4 ***-1.27 ***-0.16 *-0.06 ***-0.03 **0.01 ***0.04
Ha Tinh 4 ***-1.33 ***-0.11 **-0.08 ***-0.03 0.004 ***0.05
Phu Yen 4 ***-1.32 ***-0.1 ***-0.07 ***-0.05 0.002 ***0.05
Kon Tum 4 ***-0.99 ***-0.17 ***-0.15 ***-0.06 *0.01 ***0.04

Asian Journal of Empirical Research, 6(7)2016: 167-186
185
Gia Lai 4 ***-1.2 ***-0.1 -0.01 ***-0.06 -0.0005 ***0.03
Binh Phuoc 4 ***-1.2 **-0.08 0.04 ***-0.01 ***-0.01 ***0.04
Hoa Binh 5 ***-1.32 ***-0.09 **-0.07 ***-0.04 ***-0.01 ***0.05
Quang Binh 5 ***-1.46 -0.05 *-0.05 ***-0.04 -0.004 ***0.03
Quang Tri 5 ***-1.27 ***-0.11 ***-0.09 ***-0.04 -0.01 ***0.04
Dak Nong-Dak Lak 5 ***-0.63 ***-0.16 ***-0.12 ***-0.09 ***-0.02 ***0.04
Ninh Thuan 5 ***-0.92 ***-0.09 *-0.06 ***-0.05 ***-0.02 ***0.03
Ha Giang 5 ***-1.69 ***-0.13 ***-0.09 ***-0.05 ***0.01 ***0.04
Bac Giang 5 ***-1.42 ***-0.13 **-0.07 ***-0.04 -0.004 ***0.03
Lai Chau-Dien Bien 5 ***-1.12 ***-0.12 ***-0.17 ***-0.06 ***-0.02 ***0.03
Source: Authors’ calculation
Appendix B: The growth path of each province compared with the national average
* indicates significant at 10%; ** indicates significant at 5%; *** indicates significant at 1%
Provinces Sub-group a1 a2 a3 b1 b2 b3
Quang Ninh 1 ***0.04 ***-0.07 -0.003 ***-0.03 ***0.04 **0.0046
Hanoi 1 ***0.56 ***0.06 ***0.05 ***0.02 ***-0.01 ***-0.02
Hai Phong 1 ***0.1 0.001 **0.04 ***0.03 0.0009 -0.001
Hai Duong 1 ***-0.17 -0.01 0.02 ***-0.01 **0.0047 ***-0.01
Hung Yen 1 ***-0.32 ***-0.07 0.0006 ***-0.01 ***0.03 ***0.01
Ninh Binh 1 ***-0.53 -0.02 0.02 ***-0.01 *-0.0044 ***0.06
Vinh Phuc 1 ***-0.66 *-0.06 *-0.05 ***-0.01 ***0.07 ***0.07
Bac Ninh 1 ***-0.46 ***-0.08 **-0.06 ***-0.02 ***0.05 ***0.04
Đa Nang 1 ***0.21 0.04 0.02 -0.0002 ***0.01 ***-0.01
Quang Ngai 1 ***-0.53 -0.005 **-0.15 ***-0.02 ***-0.01 ***0.06
Khanh Hoa 1 ***0.28 -0.01 0.005 ***-0.01 ***-0.01 ***-0.01
Lam Đong 1 ***-0.03 **0.2 0.05 0.0008 ***-0.04 ***0.03
Ho Chi Minh City 1 ***0.87 ***0.08 *0.04 ***0.02 ***-0.01 ***-0.04
Tay Ninh 1 ***-0.09 ***-0.04 0.02 ***-0.02 ***0.03 ***0.03
Binh Duong 1 ***0.22 -0.01 0.03 ***0.0035 ***0.02 ***-0.02
Dong Nai 1 ***0.08 *0.03 *0.05 ***0.03 ***0.01 -0.005
Binh Thuan 1 ***-0.52 0.004 0.01 ***-0.01 -0.001 ***0.03
Long An 1 ***0.14 -0.01 **-0.02 -0.01 **-0.02 0.0025
Đong Thap 1 ***-0.17 -0.02 ***-0.03 ***0.02 ***-0.02 ***0.03
Kien Giang 1 ***0.43 ***-0.07 -0.02 ***-0.03 ***-0.01 ***0.01
Can Tho-Hau Giang 1 ***-0.34 **-0.04 0.02 ***-0.01 *0.01 ***0.03
Tra Vinh 1 ***-0.07 **-0.03 0.01 ***-0.01 ***-0.01 ***0.02
Soc Trang 1 ***-0.03 -0.001 -0.01 ***-0.01 -0.0003 0.002
Bac Lieu 1 ***-0.11 **-0.14 **0.09 ***-0.01 ***0.03 ***-0.01
Ca Mau 1 ***0.34 **-0.07 -0.02 ***-0.03 -0.006 ***0.02
Ba Ria-Vung Tau 1 ***1.86 *-0.05 ***0.08 0.001 ***0.03 ***-0.06
Cao Bang 2 ***-0.67 0.01 **-0.03 **0.01 ***0.01 *0.0028
Tuyen Quang 2 ***-0.45 ***-0.04 -0.04 ***-0.02 *-0.0034 ***0.02
Ha Nam 2 ***-0.33 **-0.07 ***-0.1 ***-0.01 -0.002 ***0.03
Thanh Hoa 2 ***-0.44 *-0.03 ***-0.1 ***-0.02 0.004 ***0.02
Quang Nam 2 ***-0.42 **-0.01 ***-0.03 *-0.0029 ***-0.01 ***0.02
An Giang 2 **-0.01 -0.0007 -0.01 **0.0017 **-0.02 -0.00007
Vinh Long 2 ***-0.13 0.003 ***-0.04 ***0.0041 ***-0.02 ***0.01
Ben Tre 2 ***0.04 0.01 -0.01 ***-0.02 ***-0.02 0.002
Thai Binh 2 ***-0.06 -0.01 **-0.06 ***-0.02 ***-0.04 ***0.02
Tien Giang 2 ***-0.04 -0.01 ***-0.05 **-0.01 ***-0.01 ***0.0044
Asian Journal of Empirical Research, 6(7)2016: 167-186
186
Lang Son 3 ***-0.37 0.01 ***-0.03 ***-0.01 ***0.0026 **-0.0027
Thua Thien Hue 3 ***-0.47 ***-0.04 ***-0.08 ***-0.02 0.002 ***0.02
Binh Đinh 3 ***-0.39 *0.07 ***-0.04 -0.01 ***-0.01 ***0.01
Son La 4 ***-0.9 -0.01 0.01 -0.0039 ***-0.01 ***0.02
Lao Cai 4 ***-0.32 **-0.14 ***0.11 ***-0.04 ***-0.02 ***0.01
Bac Kan 4 ***-0.53 ***-0.11 -0.03 ***-0.05 0.0023 ***0.02
Yen Bai 4 ***-0.51 -0.01 ***-0.07 ***-0.02 *-0.0025 **0.01
Thai Nguyen 4 ***-0.44 0.04 ***-0.07 ***-0.02 0.006 -0.003
Phu Tho 4 ***-0.4 ***-0.04 ***-0.03 ***-0.02 *0.0028 -0.0008
Ha Tay 4 ***-0.31 **-0.04 0.05 ***-0.01 -0.004 ***-0.02
Nam Đinh 4 ***-0.25 -0.004 **-0.06 ***-0.01 **-0.02 **0.01
Nghe An 4 ***-0.4 ***-0.07 *-0.03 ***-0.01 0.001 -0.001
Ha Tinh 4 ***-0.45 **-0.02 **-0.04 ***-0.01 ***-0.01 ***0.01
Phu Yen 4 ***-0.45 -0.01 **-0.03 ***-0.02 ***-0.01 ***0.01
Kon Tum 4 ***-0.13 ***-0.09 ***-0.11 ***-0.04 -0.002 -0.001
Gia Lai 4 ***-0.32 -0.02 *0.03 ***-0.04 ***-0.01 -0.004
Binh Phuoc 4 ***-0.32 0.01 *0.07 ***-0.03 ***-0.02 0.005
Hoa Binh 5 ***-0.45 -0.01 **-0.03 ***-0.01 ***-0.02 ***0.01
Quang Binh 5 ***-0.59 0.03 **-0.02 **-0.02 ***-0.01 **-0.0039
Quang Tri 5 ***-0.39 -0.01 ***-0.05 ***-0.02 ***-0.02 ***0.01
Đak Nong - Dak Lak 5 ***0.24 ***-0.08 ***-0.08 ***-0.06 ***-0.03 -0.002
Ninh Thuan 5 ***-0.05 -0.004 -0.02 ***-0.03 ***-0.03 ***-0.01
Ha Giang 5 ***-0.82 ***-0.04 ***-0.05 ***-0.02 0.002 -0.002
Bac Giang 5 ***-0.55 ***-0.04 ***-0.03 ***-0.02 ***-0.01 ***-0.01
Lai Chau - Dien Bien 5 ***-0.25 ***-0.04 ***-0.13 ***-0.04 ***-0.03 ***-0.01
Source: Authors’ calculation
Appendix C: The coefficient of variation (CVW) of GDP per capita at 1994 price: all provinces
Source: Authors’ calculation
0.65
0.70
0.75
0.80
0.85
0.90
0.95
199
0
199
1
199
2
199
3
199
4
199
5
199
6
199
7
199
8
199
9
200
0
200
1
200
2
200
3
200
4
200
5
200
6
200
7
200
8
200
9
201
0
201
1
Co
effi
cien
t o
f var
iati
on
Years


![A Definition of Physicalism - univie.ac.atfewd.univie.ac.at/fileadmin/user_upload/inst_ethik_wiss...ists, according to Tim Crane and Hugh Mellor ([2], p. 186), maintain that the empirical](https://static.fdocuments.net/doc/165x107/61219f850e14e8649278e786/a-definition-of-physicalism-ists-according-to-tim-crane-and-hugh-mellor-2.jpg)