ASIA-PACIFIC ENERGY MARKETS AND ROSNEFT Vladivostok, 3 … · ASIA-PACIFIC ENERGY MARKETS AND...
15
ASIA-PACIFIC ENERGY MARKETS AND ROSNEFT POTENTIAL Igor Sechin Chairman of the Management Board OJSC Rosneft Vladivostok, 3-5 September 2015
Transcript of ASIA-PACIFIC ENERGY MARKETS AND ROSNEFT Vladivostok, 3 … · ASIA-PACIFIC ENERGY MARKETS AND...

ASIA-PACIFIC ENERGY
MARKETS AND ROSNEFT POTENTIAL
Igor Sechin
Chairman of the Management Board
OJSC Rosneft
Vladivostok, 3-5 September 2015

The information contained in this presentation was prepared by the Company. Conclusions made herein are based on the information
collected as of the moment of the material preparation and may be changed without further notice. The Company relies on the
information obtained from sources considered to be reliable; nevertheless, it does not warrant the accuracy or completion thereof.
Such materials contain statements as to future events and explanations which may be considered as a forecast of such events. Any
statements made in these materials not being factual findings shall be deemed to be forward-looking statements associated with known
and unknown risks, uncertainties and other factors due to which our actual results, outcomes and achievements may significantly differ
from any future results, outcomes and achievements reported in or assumed by such forward-looking statements. We do not assume
any obligations as to updating any forward-looking statements contained herein so that they could reflect actual results, changes in
assumptions or in factors affecting such statements.
This presentation is not an offer to sell or encouragement to subscribe or buy any securities. It is understood that neither provision of this
report / presentation underlies any contract or obligation of any kind. The information contained herein shall not be considered, for any
purposes, to be complete, accurate or unprejudiced. The information contained herein is subject to verification, completion or change.
The content of this presentation has not be verified. Accordingly, we have not and will not make, on behalf of the Company, its
shareholders, directors, officials or employees or other persons, any representations or warranties, expressly indicated or implied, with
regard to accuracy, completeness, or objectivity of the information or conclusions contained herein. None of the directors of the
Company, its shareholders, officials, employees, or any other persons assume any liability for any losses of any kind which may be
incurred as a result of the use of such presentation or content hereof or otherwise in connection with this presentation.
2 IMPORTANT NOTICE
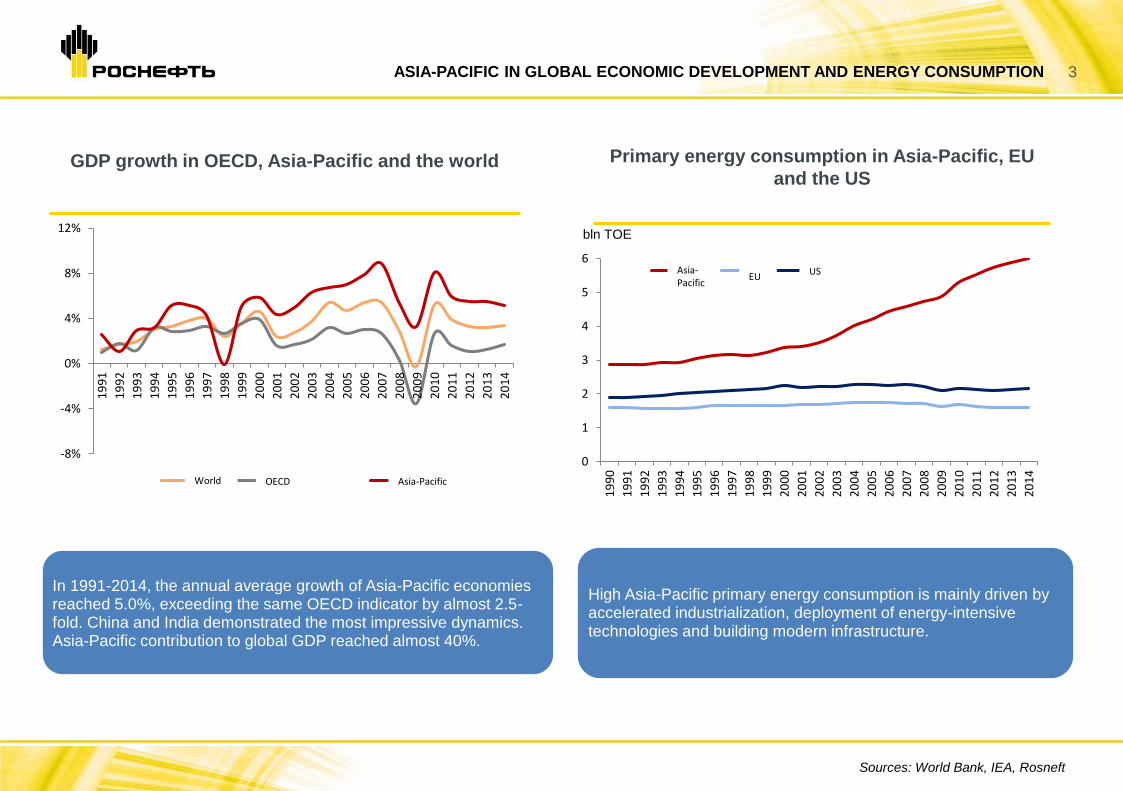
In 1991-2014, the annual average growth of Asia-Pacific economies reached 5.0%, exceeding the same OECD indicator by almost 2.5-fold. China and India demonstrated the most impressive dynamics. Asia-Pacific contribution to global GDP reached almost 40%.
High Asia-Pacific primary energy consumption is mainly driven by accelerated industrialization, deployment of energy-intensive technologies and building modern infrastructure.
Sources: World Bank, IEA, Rosneft
ASIA-PACIFIC IN GLOBAL ECONOMIC DEVELOPMENT AND ENERGY CONSUMPTION 3
GDP growth in OECD, Asia-Pacific and the world Primary energy consumption in Asia-Pacific, EU
and the US
-8%
-4%
0%
4%
8%
12%
19
91
19
92
19
93
19
94
19
95
19
96
19
97
19
98
19
99
20
00
20
01
20
02
20
03
20
04
20
05
20
06
20
07
20
08
20
09
20
10
20
11
20
12
20
13
20
14
Мир Развитые страны АТР
0
1
2
3
4
5
6
19
90
19
91
19
92
19
93
19
94
19
95
19
96
19
97
19
98
19
99
20
00
20
01
20
02
20
03
20
04
20
05
20
06
20
07
20
08
20
09
20
10
20
11
20
12
20
13
20
14
АТР ЕС США
bln TOE
World OECD Asia-Pacific
Asia-Pacific
EU US

Crude oil production and consumption in Asia-
Pacific (excluding Russia) Natural gas production and consumption in Asia-
Pacific (excluding Russia)
In the middle of the 90s, Asia-Pacific own crude output (excl. Russia) accounted for 50% of the regional oil consumption. In 2014, its share reduced to 32%, and, according to Company forecasts, will drop further to 21% by 2030.
In 2014, Asia-Pacific own gas supplies accounted for 72% of the regional gas consumption.
According to Rosneft forecast, gas consumption in Asia-Pacific will grow to 1 200 mln toe by 2030, with imported gas accounting for over 40% of the supply.
ENERGY SHORTAGE IN ASIA-PACIFIC
Source: World Bank, IEA, Rosneft
4
0
10
20
30
40
50
60
70
0
200
400
600
800
1000
1200
1400
1600
1800
19
71
19
74
19
77
19
80
19
83
19
86
19
89
19
92
19
95
19
98
20
01
20
04
20
07
20
10
20
13
20
16
20
19
20
22
20
25
20
28
% mln t
Потребление
Производство
Самообеспеченность нефтью (правая шкала)
2014
40
50
60
70
80
90
100
0
200
400
600
800
1000
1200
1400
19
71
19
74
19
77
19
80
19
83
19
86
19
89
19
92
19
95
19
98
20
01
20
04
20
07
20
10
20
13
20
16
20
19
20
22
20
25
20
28
% mln TOE
Потребление
Производство
Самообеспеченность газом (правая шкала)
2014
Production
Consumption
Self-sufficiency in crude oil (right scale)
Production
Consumption
Self-sufficiency in gas (right scale)

5 RUSSIAN OIL - AN OPTIMAL SOURCE OF ENERGY SUPPLY FOR ASIA-PACIFIC

6 TOP 10 COUNTRIES IN TERMS OF GAS AND OIL RESERVES
Sources: BP Statistical Review 2015, EIA, Ministry of Natural Resources,
Zarubezhgeologia, USGS, Rosneft
TOP 10 COUNTRIES IN TERMS OF CRUDE OIL RESERVES, BLN BBL TOP 10 COUNTRIES IN TERMS OF GAS RESERVES, TLN CUB. M
* incl. shale gas
** incl. 4.5 trln cub. m of shale gas
* incl. 257 bln bbl of extra heavy crude oil
** incl. 170 bln bbl of bitumen
*** incl. 10 bln bbl of shale oil

7 UPSTREAM PROJECTS IN EAST SIBERIA ARE COMPETITIVE
VS. OTHER PROJECTS IN ASIA-PACIFIC
PROFIT / CAPITAL EXPENDITURES RATIO
0,0
0,5
1,0
1,5
2,0
2,5
Чая
нд
ин
ско
е
Ко
выкт
ин
ско
е
Ван
кор
Мес
соях
ско
е
Юр
убче
но
То
хом
ско
е
Ср
едн
ебо
ту
об
ин
ско
е
Суз
уньс
кое
и
Тагу
льс
кое
Вер
хнеч
он
ско
е
Сах
али
н-1
Сах
али
н-2
Wh
eats
ton
e L
NG
Qu
een
slan
d L
NG
AP
LNG
Gla
dst
on
e LN
G
Arr
ow
LN
G
Evan
s Sh
oal
Plu
to L
NG
1
Gre
ater
Su
nri
se
Tan
ggu
h L
NG
San
ga S
anga
Pu
guan
g
D6
MB
A
SHW
E
Vie
tnam
Gas
Россия Австралия Индонезия Китай Индия Мья нма
Вье тнам
2012 2015 средняя 2012 средняя 2015
INTERNAL RATE OF RETURN
0%5%
10%15%20%25%30%35%40%45%50%
Чая
нд
ин
ско
е
Ко
выкт
ин
ско
е
Ван
кор
Мес
соях
ско
е
Юр
убче
но
То
хом
ско
е
Ср
едн
ебо
ту
об
ин
ско
е
Суз
уньс
кое
и
Тагу
льс
кое
Вер
хнеч
он
ско
е
Сах
али
н-1
Сах
али
н-2
Wh
eats
ton
e L
NG
Qu
een
slan
d L
NG
AP
LNG
Gla
dst
on
e LN
G
Arr
ow
LN
G
Evan
s Sh
oal
Plu
to L
NG
1
Gre
ater
Su
nri
se
Tan
ggu
h L
NG
San
ga S
anga
Pu
guan
g
D6
MB
A
SHW
E
Vie
tnam
Gas
Россия Австралия Индонезия Китай Индия Мья нма
Вье тнам
2012 2015 средняя 2012 средняя 2015
Russia Australia Indonesia
China
India
Myanmar
Vietnam
average
average
average
average
Russia Australia Indonesia
China
India
Myanmar
Vietnam
Cha
ya
din
sko
e
Ko
vyktin
sko
e
Va
nko
r
Me
sso
ya
kh
sko
e
Yu
rub
ch
en
o-
To
kh
om
sko
e
Sre
dn
eb
otu
ob
.
Ve
rkh
ne
ch
onskoe
Sa
kh
alin
-1
Su
zu
nsko
e a
nd
T
ag
uls
ko
e
Sa
kh
alin
-2
Cha
ya
din
sko
e
Ko
vyktin
sko
e
Va
nko
r
Yu
rub
ch
en
o-
To
kh
om
sko
e
Su
zu
nsko
e a
nd
Ta
gu
lsko
e
Sa
kh
alin
-1
Sa
kh
alin
-2
Me
sso
ya
kh
sko
e
Sre
dn
eb
otu
ob
.
Ve
rkh
ne
ch
onskoe
Source: Institute of Economics and Finance (IEF), Goldman Sachs
8 RUSSIAN OIL INDUSTRY POTENTIAL (INCL. SHELF) ALLOWS TO SIGNIFICANTLY
INCREASE PRODUCTION
400
450
500
550
600
650
700
750
800
20
14
20
15
20
16
20
17
20
18
20
19
20
20
20
21
20
22
20
23
20
24
20
25
20
26
20
27
20
28
20
29
20
30
20
31
20
32
20
33
20
34
20
35
mln tons
Потенциал шельфовой добычи
Потенциал добычи отрасли без учета шельфа
Базовый прогноз добычи (ЭС-2035*)
0
50
100
150
200
250
300
350
400
2014 (факт) 2020 2030
млн тнэ
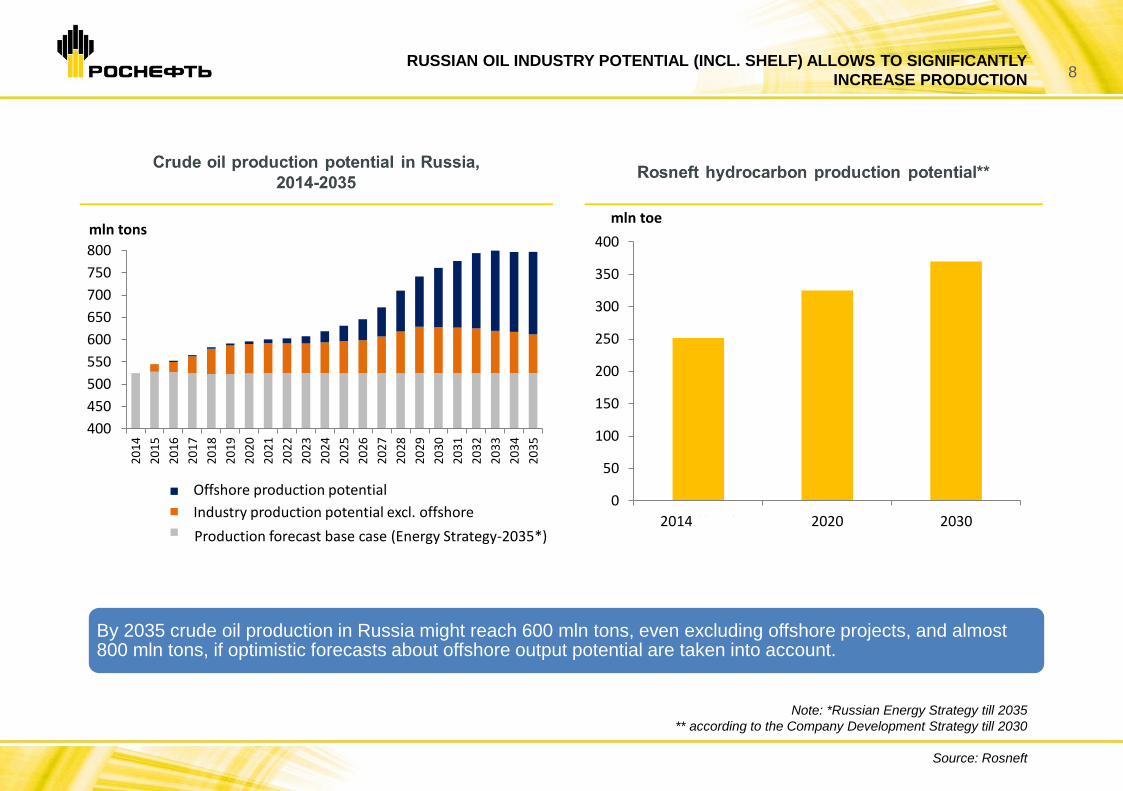
By 2035 crude oil production in Russia might reach 600 mln tons, even excluding offshore projects, and almost 800 mln tons, if optimistic forecasts about offshore output potential are taken into account.
Note: *Russian Energy Strategy till 2035
** according to the Company Development Strategy till 2030
Source: Rosneft
1
mln toe
Offshore production potential
Industry production potential excl. offshore
Production forecast base case (Energy Strategy-2035*)

9 RUSSIA – MAJOR GLOBAL HYDROCARBON PRODUCTION CENTRE
2016-2017
LAUNCHING SUZUN AND
VOSTOCHNO-
MESSOYAKHSKOYE
VladIvostok
Russkoye
Suzun
Tagulskoye
Lodochnoye
Taas-Yuryakh Yurubcheno-Tokhomskoye
Moscow
Verkhnechonskoye
Production – 7.7 mmtpa
Suzun
Production – 4.5 mmtpa
Taas-Yuryakh
(Srednebotuobinskoye) – 2nd stage
Production – 4.2 mmtpa
Yurubcheno-Tokhomskoye
Production – 5.0 mmtpa
Tagulskoye
Production– 4.8 mmtpa
Lodochnoye
Production – 2.0 mmtpa
Vankor
Production – 22.0 mmtpa
Northern tip of Chaivo
Verkhnechonskoye
Kyumbinskoye
Production – 3.0 mmtpa (50%
Rosneft share) Kyumbinskoye
Vankor
*Production at plateau
**Onshore projects
Source: Rosneft
2020+
EASTERN FIELDS REACHING
PRODUCTION OF 40 MLN TONS
2018+
TAAS-YURYAKH (2ND STAGE),
YURUBCHENO-TOKHOMSKOYE,
RUSSKOYE, TAGULSKOYE,
LODOCHNOYE
Cooperation opportunities: bringing financial and technology partners to implement major projects –Taas-Yurakh, Yurubcheno-Tokhomskoye, Vankor cluster

10 ROSNEFT GAS BUSINESS POTENTIAL IN EASTERN RUSSIA
Zabaikalsk
Иркутск
Blagoveschensk
Srednebotuobinskoye
Nizhnejerbinskiy
Srednebiryukskoiy
Verkhnechonskoye
Yurubcheno-Tokhomskoye
Kuyumbinskoye
Agaleyevskoye
Exploration areas near Sobinskoye
Savostyanova
Lisovskiy
Sanarskoye
Bratskoye
Chayandinskoye
Kovyktinskoye
Danilovskoiye
641
307
181
9597
Юг Красноярского края
Иркутская обл.
Респ. Саха-Якутия
Сахалинская обл. (включая шельф)
Доля в Сахалине-1 (20%)
ONSHORE GAS IN EASTERN RUSSIA
>1 trln cub. m of gas reserves and c. 0.8 trln cub. m of
gas resources
Ongoing large-scale exploration program – 6 fields
discovered in 3 years
Gas reserves monetization is a strong catalyst for the
regional development
SAKHALIN GAS - FAR EAST LNG (100%)
Project reserve base – 0.6 trln cub. m of Rosneft and
Sakhalin-1 gas
Intensive exploration works on the Okhotsk Sea offshore
licenses granted by the government
LNG plant and infrastructure planned capacity is 5 mmtpa
with potential expansion to 10 mmtpa
Commissioning is scheduled post 2020
The project drives infrastructure building and new jobs
creation
1.3 trln cub.
m
Map of key Company assets in the region
Company’s reserves in the region (С1+С2)
South of the Krasnoyarsk region
Irkutsk region
Republic of Sakha-Yakutiya
Sakhalin region (incl. shelf)
Sakhalin-1 share (20%)

11 OFFSHORE EXPLORATION AND APPRAISAL IN THE FAR EAST
19 areas are under exploration and appraisal
9 areas are being explored together with
partners
9 areas are open for potential cooperation
AGGREGATE RECOVERABLE
RESERVES, ROSNEFT SHARE:
oil+ condensate - 117 mln tons
gas – 183 bln cub. m
AGGREGATE AREA POTENTIAL:
(DeGolyer & MacNaughton and
Rosneft estimate)
oil+condensate – 10.7 bln tons
gas - 10 trln cub. m
2014 RESULTS:
Aero-gravity-magnetic survey – 155 thous. km
2D seismic survey – 14.3 thous. km
Electric prospecting – 1 300 km
3D seismic survey – 1 500 sq. km
Drilling – 1 exploration well
OFFSHORE EXPLORATION INVESTMENT IN THE
FAR EAST FEDERAL DISTRICT:
2014 – 10.4 bln RUB
2015E – 13.7 bln RUB
2016-2019E – 210.2 bln RUB
LICENSES FOR 26 OFFSHORE AREAS IN THE FAR EAST FEDERAL
DISTRICT

12 CREATION OF NEW INDUSTRIAL CLUSTER BASED ON
SHIP-BUILDING COMPLEX ZVEZDA
Construction of an integrated ship-building
complex located in the Bolshoy Kamen and
Pyatj Okhotnikov bays
I construction stage
2012 – 2019
in the Bolshoy Kamen bay
Medium
shipbuilding site
II construction stage
2018 – 2022
in the Bolshoy Kamen bay
Ultra-large
shipbuilding site
III construction stage
2021 – 2024
in the Pyatj Okhotnikov
bay
Offshore shipbuilding
site
Project cost: 145.5 bln RUB
Main customers of vessels and marine
equipment:
local oil and gas companies and Russian maritime
shipping companies, incl. Rosneft, Gazprom,
Sovkomflot, NOVATEK, etc.
Planned workplaces ~ 7 500 jobs
Bolshoy Kamen bay Pyatj Okhotnikov bay
ROSNEFT DEMAND FOR DRILLING RIGS AND SUPPORT VESSELS FOR
EXPLORATION DRILLING
ROSNEFT DEMAND FOR SEISMIC SURVEY AND SUPPORT VESSELS
0
20
40
60
80
100
120
2016 2017 2018 2019 2020 2021 2022 2023 2024 2025 2026 2027
Support vessels
Semi-submersible floating drillingrigs
Jackup drilling rigs
0
20
40
60
80
2016 2017 2018 2019 2020 2021 2022 2023
Support vessels
3D seismic vessels
2D seismic vessels

13 DEVELOPING INTEGRATED PETROCHEMICAL BUSINESS IN EASTERN RUSSIA
Angarsk petrochemicals company Refining volume: 10.4 mln tons Investment: 84 bln RUB Upgrade completion: 2017 Light yields: 65%
Achinsk refinery Refining volume: 6.9 mln tons Investment: 98 bln RUB Upgrade completion: 2017 Light yields: 88%
Angarsk polymers plant Petrochemicals (olefins): 0.7 mln tons Investment: 52 bln RUB Upgrade completion: post 2020
Komsomolsk refinery Refining volume: 8.0 mln tons Investment: 78 bln RUB Upgrade completion: 2018 Light yields: 83%
Vostochnaya petrochemicals company (FEPCO)
Refining volume: 12mln tons Construction completion: I stage in 2020, II stage in 2022 Conversion rate > 95% Petrochemicals (feedstock): 3.4 mln tons
Achinsk refinery
Komsomolsk refinery
Sakhalin LNG
Krasnoyarsk
Irkutsk Angarsk polymers plant Khabarovsk
Vladivostok Angarsk petrochemicals company Vostochnyaya
pertochemicals company
* - based on historical costs and Company business plan for 2015-19.
Developing modern petrochemical clusters. Investments into existent refining assets upgrades ~315* bln RUB
Rosneft priority – supplying regional markets with quality motor fuel and entering Asia-Pacific markets with high value-adding products

14 FEPCO PROJECT – MODERN REFINING AND PETROCHEMICAL COMPLEX
FEPCO Mongolia
China Japan South Korea
Russia
High quality motor fuels for the Company’s retail network
Gasoil , jet fuel, polyethylene, polypropylene, etc..
ESPO oil pipeline
Promising fields in East Siberia
FEPCO is located near largest sales markets
(Primorsk area – >50% fuel demand of the Far East
federal district; Asia-Pacific)
I stage: refining – 12 mmtpa
II stage: petrochemicals – 3.4 mmtpa
MOTOR FUEL PRODUCTION:
I, II stages – 8.5 mln tons
PETROCHEMICALS PRODUCTION:
I, II stages – 3.0 mln tons
Project status – preparing project documentation for the 1st and 2nd project stages, carrying out engineering surveys. Completion in 2016
Cooperation opportunities – attracting an investor/ partner into the project

117997, Moscow, Sofiyskaya emb., 26/1
Teleaphone: +7 (499) 517-88-99
Fax: +7 (499) 517-72-35
E-mail: [email protected]
CONTACT INFORMATION