ASIA-PACIFIC CAPITAL MARKETS - Knight...
12
ASIA-PACIFIC CAPITAL MARKETS SEPTEMBER 2014 RESEARCH ECONOMIC SNAPSHOT INVESTMENT MARKETS OCCUPIER MARKETS NORMALISING INTEREST RATES?
Transcript of ASIA-PACIFIC CAPITAL MARKETS - Knight...

ASIA-PACIFIC CAPITAL MARKETSSEPTEMBER 2014
RESEARCH
Economic SnapShot
invEStmEnt marKEtS
occupiEr marKEtS
normaliSing intErESt ratES?
2
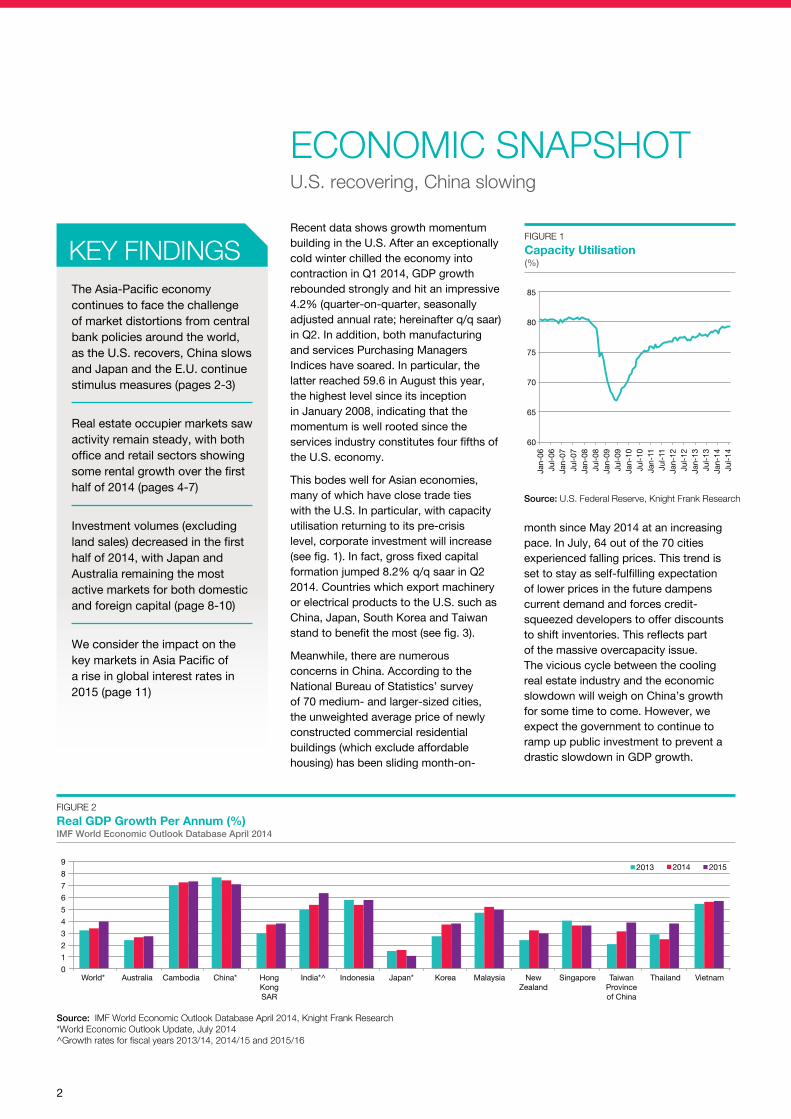
recent data shows growth momentum building in the u.S. after an exceptionally cold winter chilled the economy into contraction in Q1 2014, gDp growth rebounded strongly and hit an impressive 4.2% (quarter-on-quarter, seasonally adjusted annual rate; hereinafter q/q saar) in Q2. in addition, both manufacturing and services purchasing managers indices have soared. in particular, the latter reached 59.6 in august this year, the highest level since its inception in January 2008, indicating that the momentum is well rooted since the services industry constitutes four fifths of the u.S. economy.
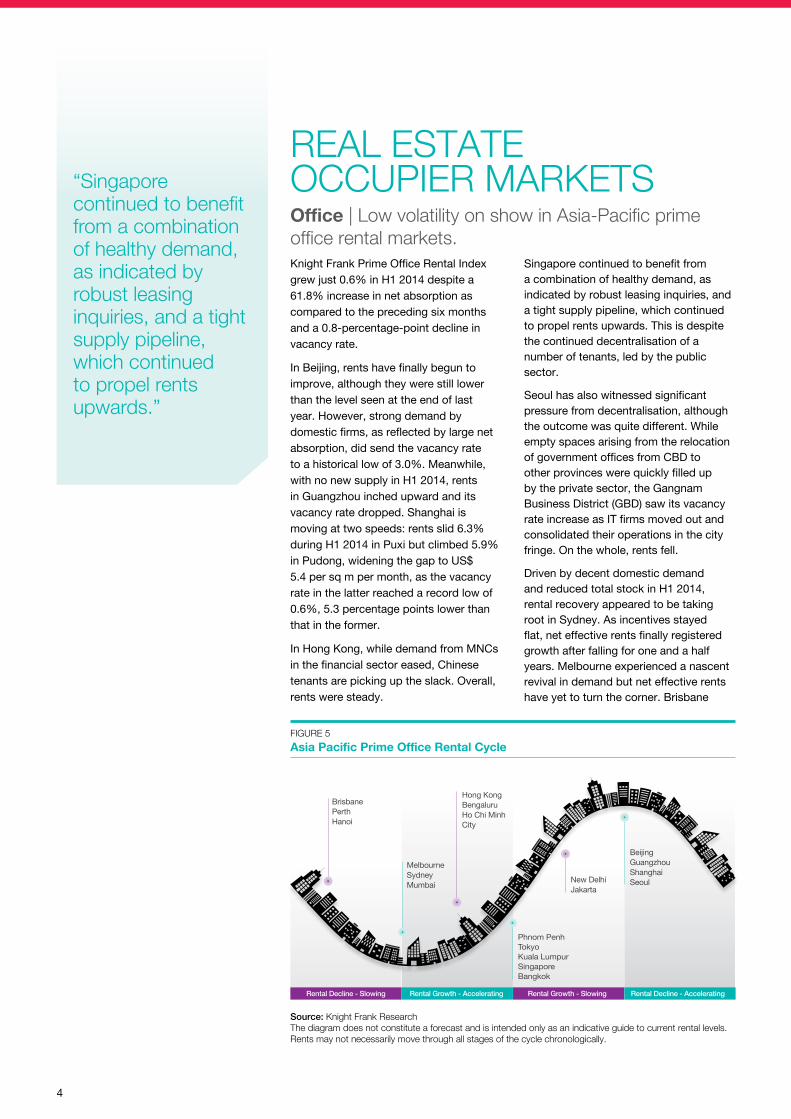
this bodes well for asian economies, many of which have close trade ties with the u.S. in particular, with capacity utilisation returning to its pre-crisis level, corporate investment will increase (see fig. 1). in fact, gross fixed capital formation jumped 8.2% q/q saar in Q2 2014. countries which export machinery or electrical products to the u.S. such as china, Japan, South Korea and taiwan stand to benefit the most (see fig. 3).
meanwhile, there are numerous concerns in china. according to the national Bureau of Statistics’ survey of 70 medium- and larger-sized cities, the unweighted average price of newly constructed commercial residential buildings (which exclude affordable housing) has been sliding month-on-
month since may 2014 at an increasing pace. in July, 64 out of the 70 cities experienced falling prices. this trend is set to stay as self-fulfilling expectation of lower prices in the future dampens current demand and forces credit-squeezed developers to offer discounts to shift inventories. this reflects part of the massive overcapacity issue. the vicious cycle between the cooling real estate industry and the economic slowdown will weigh on china’s growth for some time to come. however, we expect the government to continue to ramp up public investment to prevent a drastic slowdown in gDp growth.
ECONOMIC SNAPSHOTU.S. recovering, China slowing
the asia-pacific economy continues to face the challenge of market distortions from central bank policies around the world, as the u.S. recovers, china slows and Japan and the E.u. continue stimulus measures (pages 2-3)
real estate occupier markets saw activity remain steady, with both office and retail sectors showing some rental growth over the first half of 2014 (pages 4-7)
investment volumes (excluding land sales) decreased in the first half of 2014, with Japan and australia remaining the most active markets for both domestic and foreign capital (page 8-10)
We consider the impact on the key markets in asia pacific of a rise in global interest rates in 2015 (page 11)
KEy FINDINGS
Source: U.S. Federal Reserve, Knight Frank Research
FIGURE 1
Capacity Utilisation (%)
60
65
70
75
80
85
Jan-
06
Jul-
06
Jan-
07
Jul-
07
Jan-
08
Jul-
08
Jan-
09
Jul-
09
Jan-
10
Jul-
10
Jan-
11
Jul-
11
Jan-
12
Jul-
12
Jan-
13
Jul-
13
Jan-
14
Jul-
14
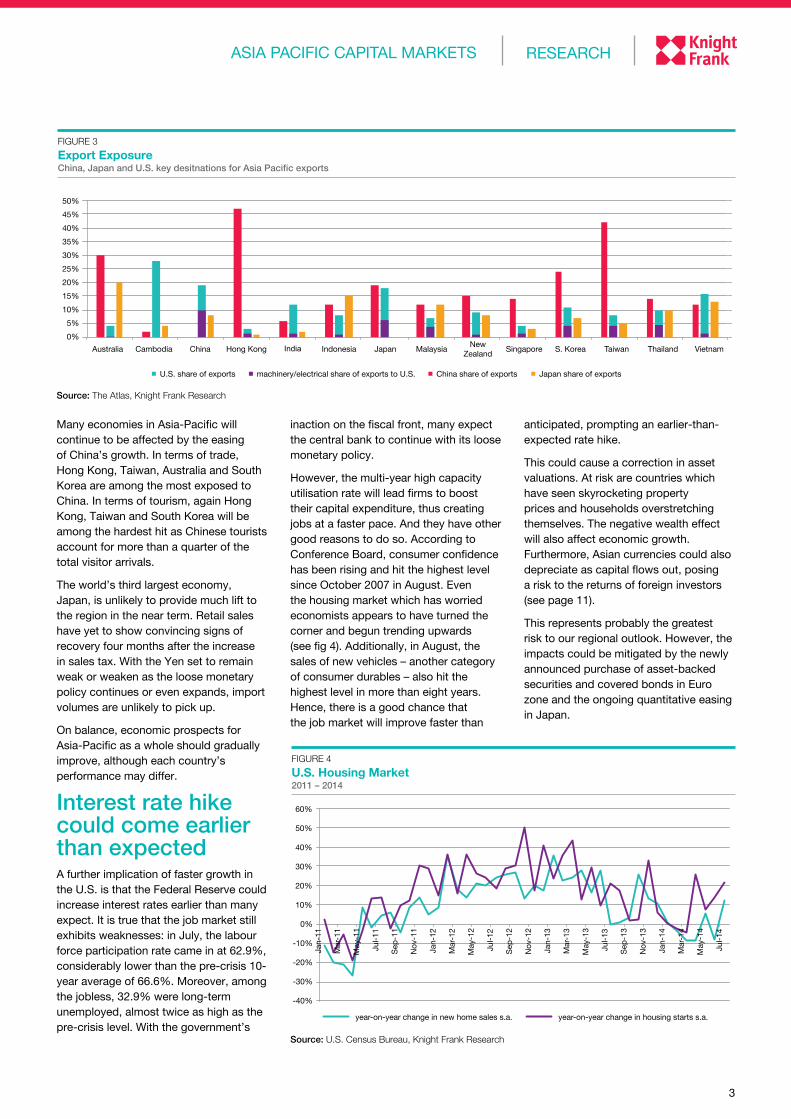
Source: IMF World Economic Outlook Database April 2014, Knight Frank Research*World Economic Outlook Update, July 2014^Growth rates for fiscal years 2013/14, 2014/15 and 2015/16
FIGURE 2
Real GDP Growth Per Annum (%) IMF World Economic Outlook Database April 2014
0
1
2
3
4
5
6
7
8
9
World* Australia Cambodia China* HongKongSAR
India*^ Indonesia Japan* Korea Malaysia NewZealand
Singapore TaiwanProvinceof China
Thailand Vietnam
2013 2014 2015
3
many economies in asia-pacific will continue to be affected by the easing of china’s growth. in terms of trade, hong Kong, taiwan, australia and South Korea are among the most exposed to china. in terms of tourism, again hong Kong, taiwan and South Korea will be among the hardest hit as chinese tourists account for more than a quarter of the total visitor arrivals.
the world’s third largest economy, Japan, is unlikely to provide much lift to the region in the near term. retail sales have yet to show convincing signs of recovery four months after the increase in sales tax. With the Yen set to remain weak or weaken as the loose monetary policy continues or even expands, import volumes are unlikely to pick up.
on balance, economic prospects for asia-pacific as a whole should gradually improve, although each country’s performance may differ.
Interest rate hike could come earlier than expecteda further implication of faster growth in the u.S. is that the Federal reserve could increase interest rates earlier than many expect. it is true that the job market still exhibits weaknesses: in July, the labour force participation rate came in at 62.9%, considerably lower than the pre-crisis 10-year average of 66.6%. moreover, among the jobless, 32.9% were long-term unemployed, almost twice as high as the pre-crisis level. With the government’s
inaction on the fiscal front, many expect the central bank to continue with its loose monetary policy.
however, the multi-year high capacity utilisation rate will lead firms to boost their capital expenditure, thus creating jobs at a faster pace. and they have other good reasons to do so. according to conference Board, consumer confidence has been rising and hit the highest level since october 2007 in august. Even the housing market which has worried economists appears to have turned the corner and begun trending upwards (see fig 4). additionally, in august, the sales of new vehicles – another category of consumer durables – also hit the highest level in more than eight years. hence, there is a good chance that the job market will improve faster than
anticipated, prompting an earlier-than-expected rate hike.
this could cause a correction in asset valuations. at risk are countries which have seen skyrocketing property prices and households overstretching themselves. the negative wealth effect will also affect economic growth. Furthermore, asian currencies could also depreciate as capital flows out, posing a risk to the returns of foreign investors (see page 11).
this represents probably the greatest risk to our regional outlook. however, the impacts could be mitigated by the newly announced purchase of asset-backed securities and covered bonds in Euro zone and the ongoing quantitative easing in Japan.
Source: U.S. Census Bureau, Knight Frank Research
FIGURE 4
U.S. Housing Market 2011 – 2014
-40%
-30%
-20%
-10%
0%
10%
20%
30%
40%
50%
60%
year-on-year change in new home sales s.a. year-on-year change in housing starts s.a.
Jan-
11
Mar
-11
May
-11
Jul-
11
Sep
-11
Nov
-11
Jan-
12
Mar
-12
May
-12
Jul-
12
Sep
-12
Nov
-12
Jan-
13
Mar
-13
May
-13
Jul-
13
Sep
-13
Nov
-13
Jan-
14
Mar
-14
May
-14
Jul-
14
Source: The Atlas, Knight Frank Research
FIGURE 3
Export Exposure China, Japan and U.S. key desitnations for Asia Pacific exports
0%
5%
10%
15%
20%
25%
30%
35%
40%
45%
50%
Australia Cambodia China Hong Kong India Indonesia Japan Malaysia New
Zealand Singapore S. Korea Taiwan Thailand Vietnam
U.S. share of exports machinery/electrical share of exports to U.S. China share of exports Japan share of exports
rESEarchaSia paciFic capital marKEtS
4
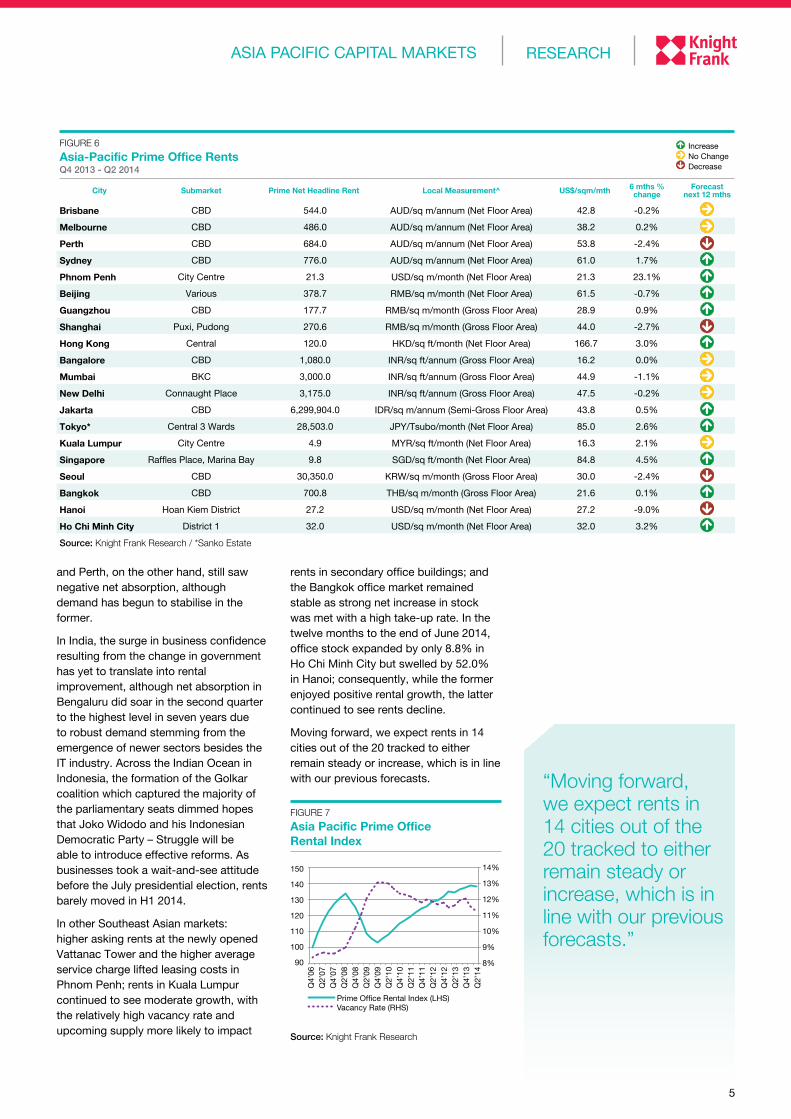
Knight Frank prime office rental index grew just 0.6% in h1 2014 despite a 61.8% increase in net absorption as compared to the preceding six months and a 0.8-percentage-point decline in vacancy rate.
in Beijing, rents have finally begun to improve, although they were still lower than the level seen at the end of last year. however, strong demand by domestic firms, as reflected by large net absorption, did send the vacancy rate to a historical low of 3.0%. meanwhile, with no new supply in h1 2014, rents in guangzhou inched upward and its vacancy rate dropped. Shanghai is moving at two speeds: rents slid 6.3% during h1 2014 in puxi but climbed 5.9% in pudong, widening the gap to uS$ 5.4 per sq m per month, as the vacancy rate in the latter reached a record low of 0.6%, 5.3 percentage points lower than that in the former.
in hong Kong, while demand from mncs in the financial sector eased, chinese tenants are picking up the slack. overall, rents were steady.
Singapore continued to benefit from a combination of healthy demand, as indicated by robust leasing inquiries, and a tight supply pipeline, which continued to propel rents upwards. this is despite the continued decentralisation of a number of tenants, led by the public sector.
Seoul has also witnessed significant pressure from decentralisation, although the outcome was quite different. While empty spaces arising from the relocation of government offices from cBD to other provinces were quickly filled up by the private sector, the gangnam Business District (gBD) saw its vacancy rate increase as it firms moved out and consolidated their operations in the city fringe. on the whole, rents fell.
Driven by decent domestic demand and reduced total stock in h1 2014, rental recovery appeared to be taking root in Sydney. as incentives stayed flat, net effective rents finally registered growth after falling for one and a half years. melbourne experienced a nascent revival in demand but net effective rents have yet to turn the corner. Brisbane
REAL ESTATE OCCUPIER MARKETSOffice | Low volatility on show in Asia-Pacific prime office rental markets.
“Singapore continued to benefit from a combination of healthy demand, as indicated by robust leasing inquiries, and a tight supply pipeline, which continued to propel rents upwards.”
Rental Decline - Slowing Rental Growth - SlowingRental Growth - Accelerating Rental Decline - Accelerating
FIGURE 5
Asia Pacific Prime Office Rental Cycle
Source: Knight Frank ResearchThe diagram does not constitute a forecast and is intended only as an indicative guide to current rental levels. Rents may not necessarily move through all stages of the cycle chronologically.
Brisbaneperthhanoi
new DelhiJakarta
phnom penhtokyoKuala lumpurSingaporeBangkok
BeijingguangzhouShanghaiSeoul
hong Kong Bengaluruho chi minh city
melbourneSydney mumbai
5
and perth, on the other hand, still saw negative net absorption, although demand has begun to stabilise in the former.
in india, the surge in business confidence resulting from the change in government has yet to translate into rental improvement, although net absorption in Bengaluru did soar in the second quarter to the highest level in seven years due to robust demand stemming from the emergence of newer sectors besides the it industry. across the indian ocean in indonesia, the formation of the golkar coalition which captured the majority of the parliamentary seats dimmed hopes that Joko Widodo and his indonesian Democratic party – Struggle will be able to introduce effective reforms. as businesses took a wait-and-see attitude before the July presidential election, rents barely moved in h1 2014.
in other Southeast asian markets: higher asking rents at the newly opened vattanac tower and the higher average service charge lifted leasing costs in phnom penh; rents in Kuala lumpur continued to see moderate growth, with the relatively high vacancy rate and upcoming supply more likely to impact
rents in secondary office buildings; and the Bangkok office market remained stable as strong net increase in stock was met with a high take-up rate. in the twelve months to the end of June 2014, office stock expanded by only 8.8% in ho chi minh city but swelled by 52.0% in hanoi; consequently, while the former enjoyed positive rental growth, the latter continued to see rents decline.
moving forward, we expect rents in 14 cities out of the 20 tracked to either remain steady or increase, which is in line with our previous forecasts. “Moving forward,
we expect rents in 14 cities out of the 20 tracked to either remain steady or increase, which is in line with our previous forecasts.”
FIGURE 6
Asia-Pacific Prime Office Rents Q4 2013 - Q2 2014
City Submarket Prime Net Headline Rent Local Measurement^ US$/sqm/mth 6 mths % change
Forecast next 12 mths
Brisbane cBD 544.0 auD/sq m/annum (net Floor area) 42.8 -0.2%
Melbourne cBD 486.0 auD/sq m/annum (net Floor area) 38.2 0.2%
Perth cBD 684.0 auD/sq m/annum (net Floor area) 53.8 -2.4%
Sydney cBD 776.0 auD/sq m/annum (net Floor area) 61.0 1.7%
Phnom Penh city centre 21.3 uSD/sq m/month (net Floor area) 21.3 23.1%
Beijing various 378.7 rmB/sq m/month (net Floor area) 61.5 -0.7%
Guangzhou cBD 177.7 rmB/sq m/month (gross Floor area) 28.9 0.9%
Shanghai puxi, pudong 270.6 rmB/sq m/month (gross Floor area) 44.0 -2.7%
Hong Kong central 120.0 hKD/sq ft/month (net Floor area) 166.7 3.0%
Bangalore cBD 1,080.0 inr/sq ft/annum (gross Floor area) 16.2 0.0%
Mumbai BKc 3,000.0 inr/sq ft/annum (gross Floor area) 44.9 -1.1%
New Delhi connaught place 3,175.0 inr/sq ft/annum (gross Floor area) 47.5 -0.2%
Jakarta cBD 6,299,904.0 iDr/sq m/annum (Semi-gross Floor area) 43.8 0.5%
Tokyo* central 3 Wards 28,503.0 JpY/tsubo/month (net Floor area) 85.0 2.6%
Kuala Lumpur city centre 4.9 mYr/sq ft/month (net Floor area) 16.3 2.1%
Singapore raffles place, marina Bay 9.8 SgD/sq ft/month (net Floor area) 84.8 4.5%
Seoul cBD 30,350.0 KrW/sq m/month (gross Floor area) 30.0 -2.4%
Bangkok cBD 700.8 thB/sq m/month (gross Floor area) 21.6 0.1%
Hanoi hoan Kiem District 27.2 uSD/sq m/month (net Floor area) 27.2 -9.0%
Ho Chi Minh City District 1 32.0 uSD/sq m/month (net Floor area) 32.0 3.2%
Source: Knight Frank Research / *Sanko Estate
increaseno changeDecrease
FIGURE 7
Asia Pacific Prime Office Rental Index
Source: Knight Frank Research
8%
9%
10%
11%
12%
13%
14%
90
100
110
120
130
140
150
Q4’06
Q2’07
Q4’07
Q2’08
Q4’08
Q2’09
Q4’09
Q2’10
Q4’10
Q2’11
Q4’11
Q2’12
Q4’12
Q2’13
Q4’13
Q2’14
Prime Office Rental Index (LHS)Vacancy Rate (RHS)
rESEarchaSia paciFic capital marKEtS
6
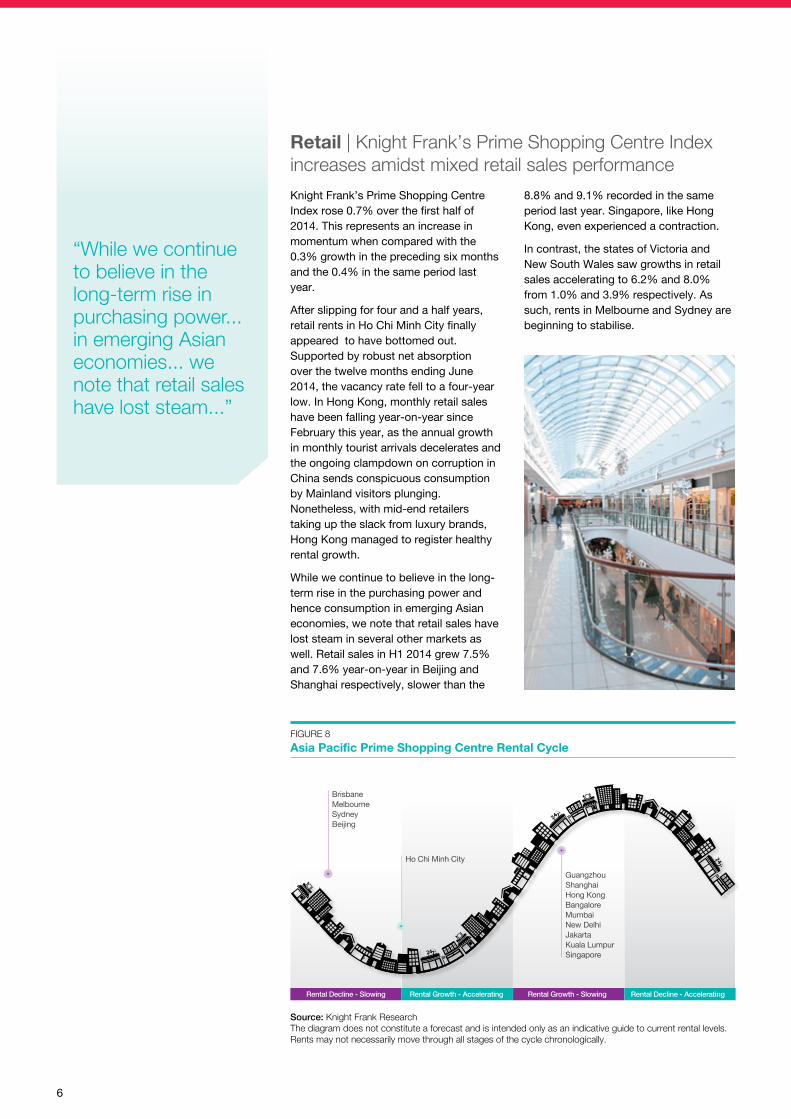
Knight Frank’s prime Shopping centre index rose 0.7% over the first half of 2014. this represents an increase in momentum when compared with the 0.3% growth in the preceding six months and the 0.4% in the same period last year.
after slipping for four and a half years, retail rents in ho chi minh city finally appeared to have bottomed out. Supported by robust net absorption over the twelve months ending June 2014, the vacancy rate fell to a four-year low. in hong Kong, monthly retail sales have been falling year-on-year since February this year, as the annual growth in monthly tourist arrivals decelerates and the ongoing clampdown on corruption in china sends conspicuous consumption by mainland visitors plunging. nonetheless, with mid-end retailers taking up the slack from luxury brands, hong Kong managed to register healthy rental growth.
While we continue to believe in the long-term rise in the purchasing power and hence consumption in emerging asian economies, we note that retail sales have lost steam in several other markets as well. retail sales in h1 2014 grew 7.5% and 7.6% year-on-year in Beijing and Shanghai respectively, slower than the
8.8% and 9.1% recorded in the same period last year. Singapore, like hong Kong, even experienced a contraction.
in contrast, the states of victoria and new South Wales saw growths in retail sales accelerating to 6.2% and 8.0% from 1.0% and 3.9% respectively. as such, rents in melbourne and Sydney are beginning to stabilise.
“While we continue to believe in the long-term rise in purchasing power... in emerging Asian economies... we note that retail sales have lost steam...”
Retail | Knight Frank’s Prime Shopping Centre Index increases amidst mixed retail sales performance
Rental Decline - Slowing Rental Growth - SlowingRental Growth - Accelerating Rental Decline - Accelerating
FIGURE 8
Asia Pacific Prime Shopping Centre Rental Cycle
Source: Knight Frank ResearchThe diagram does not constitute a forecast and is intended only as an indicative guide to current rental levels. Rents may not necessarily move through all stages of the cycle chronologically.
BrisbanemelbourneSydneyBeijing
guangzhouShanghaihong KongBangaloremumbainew DelhiJakartaKuala lumpurSingapore
ho chi minh city
7
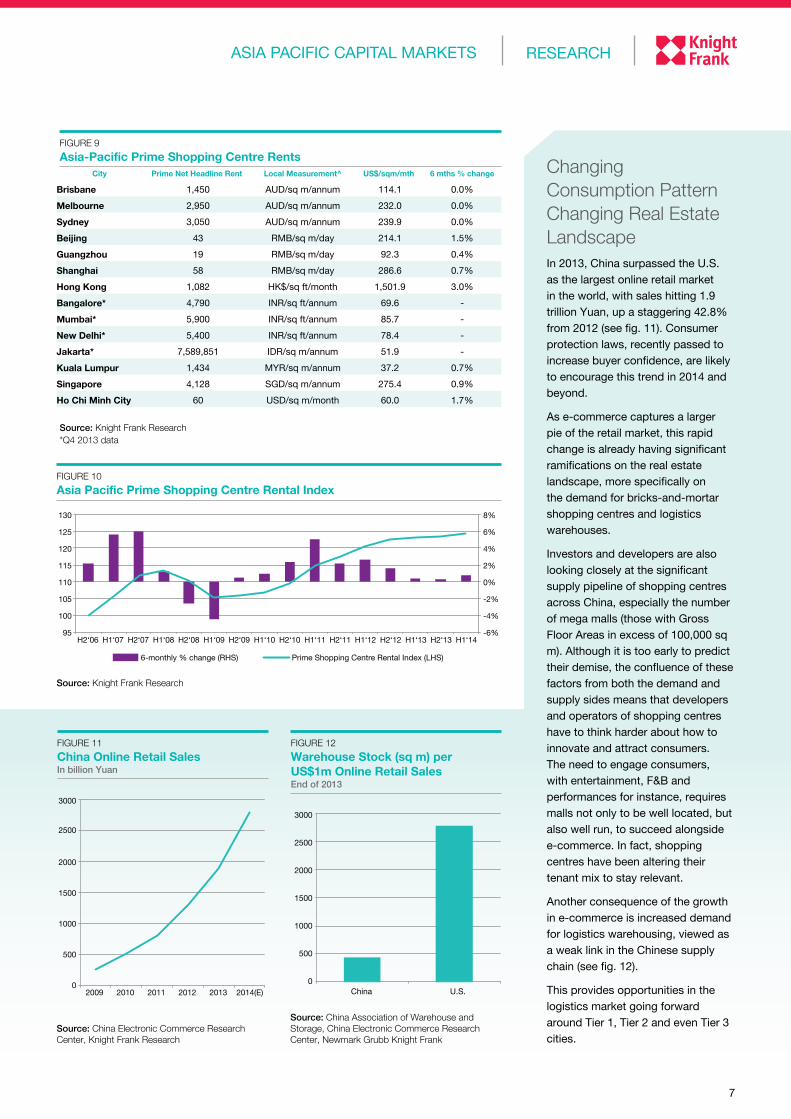
Changing Consumption Pattern Changing Real Estate Landscape in 2013, china surpassed the u.S. as the largest online retail market in the world, with sales hitting 1.9 trillion Yuan, up a staggering 42.8% from 2012 (see fig. 11). consumer protection laws, recently passed to increase buyer confidence, are likely to encourage this trend in 2014 and beyond.
as e-commerce captures a larger pie of the retail market, this rapid change is already having significant ramifications on the real estate landscape, more specifically on the demand for bricks-and-mortar shopping centres and logistics warehouses.
investors and developers are also looking closely at the significant supply pipeline of shopping centres across china, especially the number of mega malls (those with gross Floor areas in excess of 100,000 sq m). although it is too early to predict their demise, the confluence of these factors from both the demand and supply sides means that developers and operators of shopping centres have to think harder about how to innovate and attract consumers. the need to engage consumers, with entertainment, F&B and performances for instance, requires malls not only to be well located, but also well run, to succeed alongside e-commerce. in fact, shopping centres have been altering their tenant mix to stay relevant.
another consequence of the growth in e-commerce is increased demand for logistics warehousing, viewed as a weak link in the chinese supply chain (see fig. 12).
this provides opportunities in the logistics market going forward around tier 1, tier 2 and even tier 3 cities.
Source: China Association of Warehouse and Storage, China Electronic Commerce Research Center, Newmark Grubb Knight Frank
FIGURE 12
Warehouse Stock (sq m) per US$1m Online Retail Sales End of 2013
0
500
1000
1500
2000
2500
3000
China U.S.
Source: China Electronic Commerce Research Center, Knight Frank Research
FIGURE 11
China Online Retail Sales In billion Yuan
0
500
1000
1500
2000
2500
3000
2009 2010 2011 2012 2013 2014(E)
FIGURE 9
Asia-Pacific Prime Shopping Centre Rents City Prime Net Headline Rent Local Measurement^ US$/sqm/mth 6 mths % change
Brisbane 1,450 auD/sq m/annum 114.1 0.0%
Melbourne 2,950 auD/sq m/annum 232.0 0.0%
Sydney 3,050 auD/sq m/annum 239.9 0.0%
Beijing 43 rmB/sq m/day 214.1 1.5%
Guangzhou 19 rmB/sq m/day 92.3 0.4%
Shanghai 58 rmB/sq m/day 286.6 0.7%
Hong Kong 1,082 hK$/sq ft/month 1,501.9 3.0%
Bangalore* 4,790 inr/sq ft/annum 69.6 -
Mumbai* 5,900 inr/sq ft/annum 85.7 -
New Delhi* 5,400 inr/sq ft/annum 78.4 -
Jakarta* 7,589,851 iDr/sq m/annum 51.9 -
Kuala Lumpur 1,434 mYr/sq m/annum 37.2 0.7%
Singapore 4,128 SgD/sq m/annum 275.4 0.9%
Ho Chi Minh City 60 uSD/sq m/month 60.0 1.7%
Source: Knight Frank Research*Q4 2013 data
FIGURE 10
Asia Pacific Prime Shopping Centre Rental Index
Source: Knight Frank Research
-6%
-4%
-2%
0%
2%
4%
6%
8%
95
100
105
110
115
120
125
130
H2‘06 H1‘07 H2‘07 H1‘08 H2‘08 H1‘09 H2‘09 H1‘10 H2‘10 H1‘11 H2‘11 H1‘12 H2‘12 H1‘13 H2‘13 H1‘14
6-monthly % change (RHS) Prime Shopping Centre Rental Index (LHS)
rESEarchaSia paciFic capital marKEtS
8
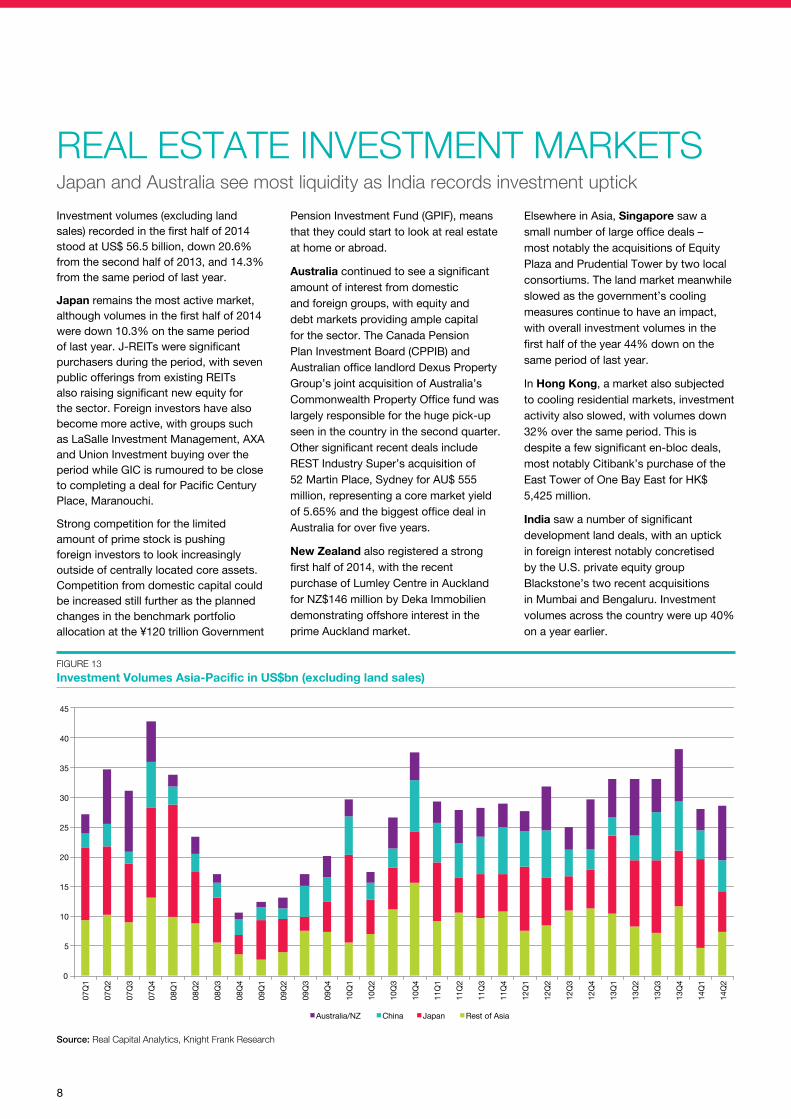
investment volumes (excluding land sales) recorded in the first half of 2014 stood at uS$ 56.5 billion, down 20.6% from the second half of 2013, and 14.3% from the same period of last year.
Japan remains the most active market, although volumes in the first half of 2014 were down 10.3% on the same period of last year. J-rEits were significant purchasers during the period, with seven public offerings from existing rEits also raising significant new equity for the sector. Foreign investors have also become more active, with groups such as laSalle investment management, aXa and union investment buying over the period while gic is rumoured to be close to completing a deal for pacific century place, maranouchi.
Strong competition for the limited amount of prime stock is pushing foreign investors to look increasingly outside of centrally located core assets. competition from domestic capital could be increased still further as the planned changes in the benchmark portfolio allocation at the ¥120 trillion government
pension investment Fund (gpiF), means that they could start to look at real estate at home or abroad.
Australia continued to see a significant amount of interest from domestic and foreign groups, with equity and debt markets providing ample capital for the sector. the canada pension plan investment Board (cppiB) and australian office landlord Dexus property group’s joint acquisition of australia’s commonwealth property office fund was largely responsible for the huge pick-up seen in the country in the second quarter. other significant recent deals include rESt industry Super’s acquisition of 52 martin place, Sydney for au$ 555 million, representing a core market yield of 5.65% and the biggest office deal in australia for over five years.
New Zealand also registered a strong first half of 2014, with the recent purchase of lumley centre in auckland for nZ$146 million by Deka immobilien demonstrating offshore interest in the prime auckland market.
Elsewhere in asia, Singapore saw a small number of large office deals – most notably the acquisitions of Equity plaza and prudential tower by two local consortiums. the land market meanwhile slowed as the government’s cooling measures continue to have an impact, with overall investment volumes in the first half of the year 44% down on the same period of last year.
in Hong Kong, a market also subjected to cooling residential markets, investment activity also slowed, with volumes down 32% over the same period. this is despite a few significant en-bloc deals, most notably citibank’s purchase of the East tower of one Bay East for hK$ 5,425 million.
India saw a number of significant development land deals, with an uptick in foreign interest notably concretised by the u.S. private equity group Blackstone’s two recent acquisitions in mumbai and Bengaluru. investment volumes across the country were up 40% on a year earlier.
REAL ESTATE INVESTMENT MARKETSJapan and Australia see most liquidity as India records investment uptick
FIGURE 13
Investment Volumes Asia-Pacific in US$bn (excluding land sales)
Source: Real Capital Analytics, Knight Frank Research
0
5
10
15
20
25
30
35
40
45
07Q
1
07Q
2
07Q
3
07Q
4
08Q
1
08Q
2
08Q
3
08Q
4
09Q
1
09Q
2
09Q
3
09Q
4
10Q
1
10Q
2
10Q
3
10Q
4
11Q
1
11Q
2
11Q
3
11Q
4
12Q
1
12Q
2
12Q
3
12Q
4
13Q
1
13Q
2
13Q
3
13Q
4
14Q
1
14Q
2
Australia/NZ China Japan Rest of Asia
9
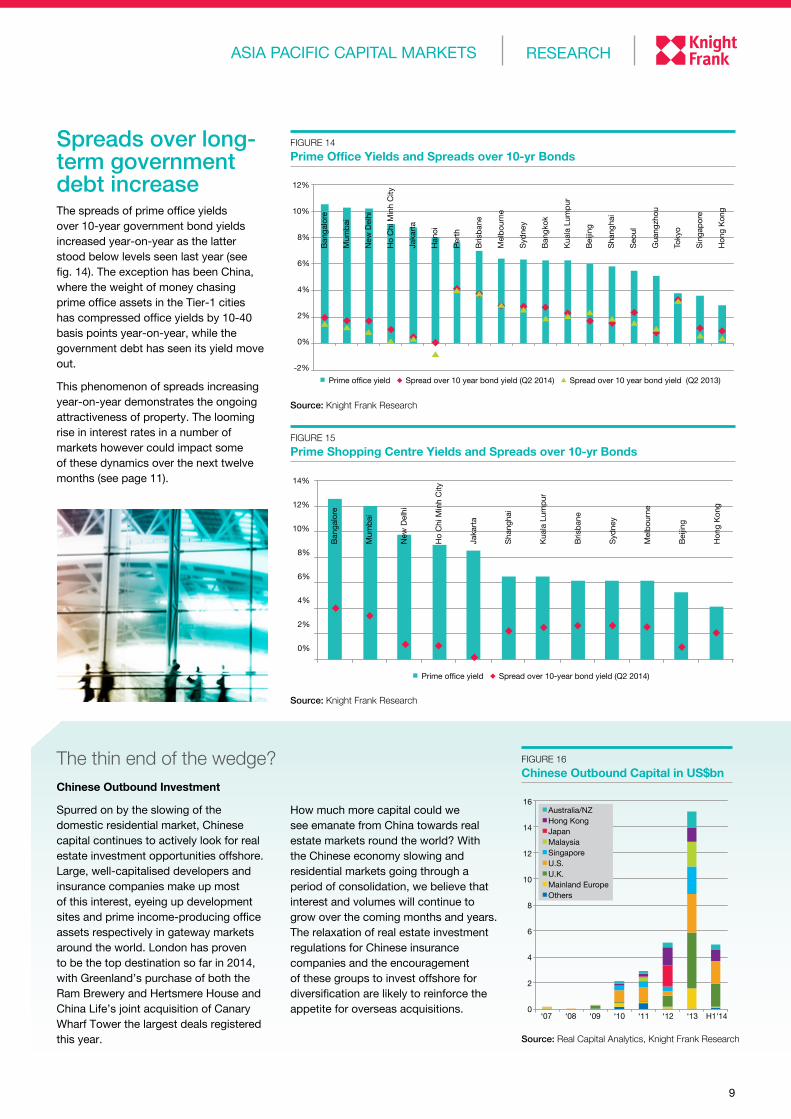
Spreads over long-term government debt increasethe spreads of prime office yields over 10-year government bond yields increased year-on-year as the latter stood below levels seen last year (see fig. 14). the exception has been china, where the weight of money chasing prime office assets in the tier-1 cities has compressed office yields by 10-40 basis points year-on-year, while the government debt has seen its yield move out.
this phenomenon of spreads increasing year-on-year demonstrates the ongoing attractiveness of property. the looming rise in interest rates in a number of markets however could impact some of these dynamics over the next twelve months (see page 11).
FIGURE 16
Chinese Outbound Capital in US$bn
Source: Real Capital Analytics, Knight Frank Research
0
2
4
6
8
10
12
14
16
‘07 ‘08 ‘09 ‘10 ‘11 ‘12 ‘13 H1'14
Australia/NZHong KongJapanMalaysiaSingaporeU.S.U.K.Mainland EuropeOthers
FIGURE 14
Prime Office Yields and Spreads over 10-yr Bonds
Source: Knight Frank Research
-2%
0%
2%
4%
6%
8%
10%
12%
Prime office yield Spread over 10 year bond yield (Q2 2014) Spread over 10 year bond yield (Q2 2013)
Ban
galore
Mum
bai
New
Del
hi
Ho
Chi
Min
h C
ity
Jaka
rta
Han
oi
Per
th
Bris
ban
e
Mel
bou
rne
Syd
ney
Ban
gkok
Kua
la L
ump
ur
Bei
jing
Sha
ngha
i
Seo
ul
Gua
ngzh
ou
Toky
o
Sin
gap
ore
Hon
g K
ong
FIGURE 15
Prime Shopping Centre Yields and Spreads over 10-yr Bonds
Source: Knight Frank Research
Prime office yield Spread over 10-year bond yield (Q2 2014)
0%
2%
4%
6%
8%
10%
12%
14%
Ban
galore
Mum
bai
New
Del
hi
Ho
Chi
Min
h C
ity
Jaka
rta
Sha
ngha
i
Kua
la L
ump
ur
Bris
ban
e
Syd
ney
Mel
bou
rne
Bei
jing
Hon
g K
ong
rESEarchaSia paciFic capital marKEtS
Chinese Outbound Investment
Spurred on by the slowing of the domestic residential market, chinese capital continues to actively look for real estate investment opportunities offshore. large, well-capitalised developers and insurance companies make up most of this interest, eyeing up development sites and prime income-producing office assets respectively in gateway markets around the world. london has proven to be the top destination so far in 2014, with greenland’s purchase of both the ram Brewery and hertsmere house and china life’s joint acquisition of canary Wharf tower the largest deals registered this year.
how much more capital could we see emanate from china towards real estate markets round the world? With the chinese economy slowing and residential markets going through a period of consolidation, we believe that interest and volumes will continue to grow over the coming months and years. the relaxation of real estate investment regulations for chinese insurance companies and the encouragement of these groups to invest offshore for diversification are likely to reinforce the appetite for overseas acquisitions.
The thin end of the wedge?
10
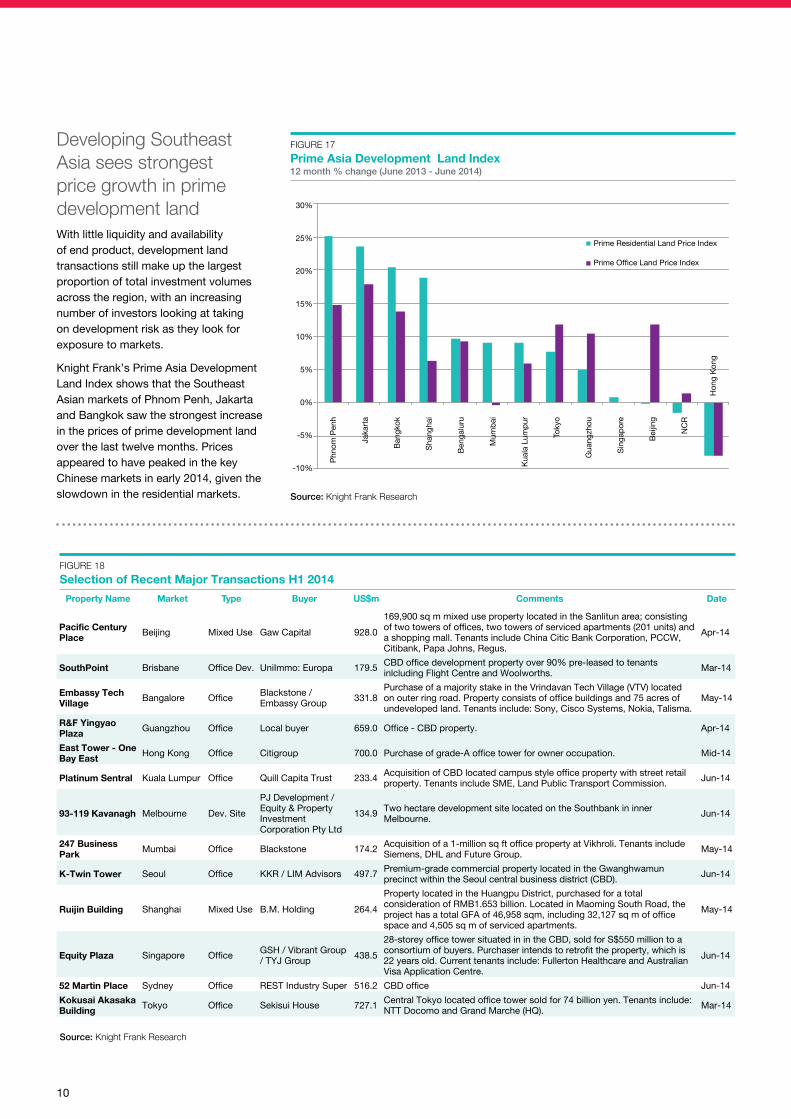
FIGURE 17
Prime Asia Development Land Index 12 month % change (June 2013 - June 2014)
Source: Knight Frank Research
-10%
-5%
0%
5%
10%
15%
20%
25%
30%
Phn
om P
enh
Jaka
rta
Ban
gkok
Sha
ngha
i
Ben
galu
ru
Mum
bai
Kua
la L
ump
ur
Toky
o
Gua
ngzh
ou
Sin
gap
ore
Bei
jing
NC
R
Hon
g K
ong
Prime Residential Land Price Index
Prime Office Land Price Index
Developing Southeast Asia sees strongest price growth in prime development landWith little liquidity and availability of end product, development land transactions still make up the largest proportion of total investment volumes across the region, with an increasing number of investors looking at taking on development risk as they look for exposure to markets.
Knight Frank’s prime asia Development land index shows that the Southeast asian markets of phnom penh, Jakarta and Bangkok saw the strongest increase in the prices of prime development land over the last twelve months. prices appeared to have peaked in the key chinese markets in early 2014, given the slowdown in the residential markets.
FIGURE 18
Selection of Recent Major Transactions H1 2014
Property Name Market Type Buyer US$m Comments Date
Pacific Century Place Beijing mixed use gaw capital 928.0
169,900 sq m mixed use property located in the Sanlitun area; consisting of two towers of offices, two towers of serviced apartments (201 units) and a shopping mall. tenants include china citic Bank corporation, pccW, citibank, papa Johns, regus.
apr-14
SouthPoint Brisbane office Dev. uniimmo: Europa 179.5 cBD office development property over 90% pre-leased to tenants inlcluding Flight centre and Woolworths. mar-14
Embassy Tech Village Bangalore office Blackstone /
Embassy group 331.8purchase of a majority stake in the vrindavan tech village (vtv) located on outer ring road. property consists of office buildings and 75 acres of undeveloped land. tenants include: Sony, cisco Systems, nokia, talisma.
may-14
R&F Yingyao Plaza guangzhou office local buyer 659.0 office - cBD property. apr-14
East Tower - One Bay East hong Kong office citigroup 700.0 purchase of grade-a office tower for owner occupation. mid-14
Platinum Sentral Kuala lumpur office Quill capita trust 233.4 acquisition of cBD located campus style office property with street retail property. tenants include SmE, land public transport commission. Jun-14
93-119 Kavanagh melbourne Dev. Site
pJ Development / Equity & property investment corporation pty ltd
134.9 two hectare development site located on the Southbank in inner melbourne. Jun-14
247 Business Park mumbai office Blackstone 174.2 acquisition of a 1-million sq ft office property at vikhroli. tenants include
Siemens, Dhl and Future group. may-14
K-Twin Tower Seoul office KKr / lim advisors 497.7 premium-grade commercial property located in the gwanghwamun precinct within the Seoul central business district (cBD). Jun-14
Ruijin Building Shanghai mixed use B.m. holding 264.4
property located in the huangpu District, purchased for a total consideration of rmB1.653 billion. located in maoming South road, the project has a total gFa of 46,958 sqm, including 32,127 sq m of office space and 4,505 sq m of serviced apartments.
may-14
Equity Plaza Singapore office gSh / vibrant group / tYJ group 438.5
28-storey office tower situated in in the cBD, sold for S$550 million to a consortium of buyers. purchaser intends to retrofit the property, which is 22 years old. current tenants include: Fullerton healthcare and australian visa application centre.
Jun-14
52 Martin Place Sydney office rESt industry Super 516.2 cBD office Jun-14
Kokusai Akasaka Building tokyo office Sekisui house 727.1 central tokyo located office tower sold for 74 billion yen. tenants include:
ntt Docomo and grand marche (hQ). mar-14
Source: Knight Frank Research
11
rESEarchaSia paciFic capital marKEtS
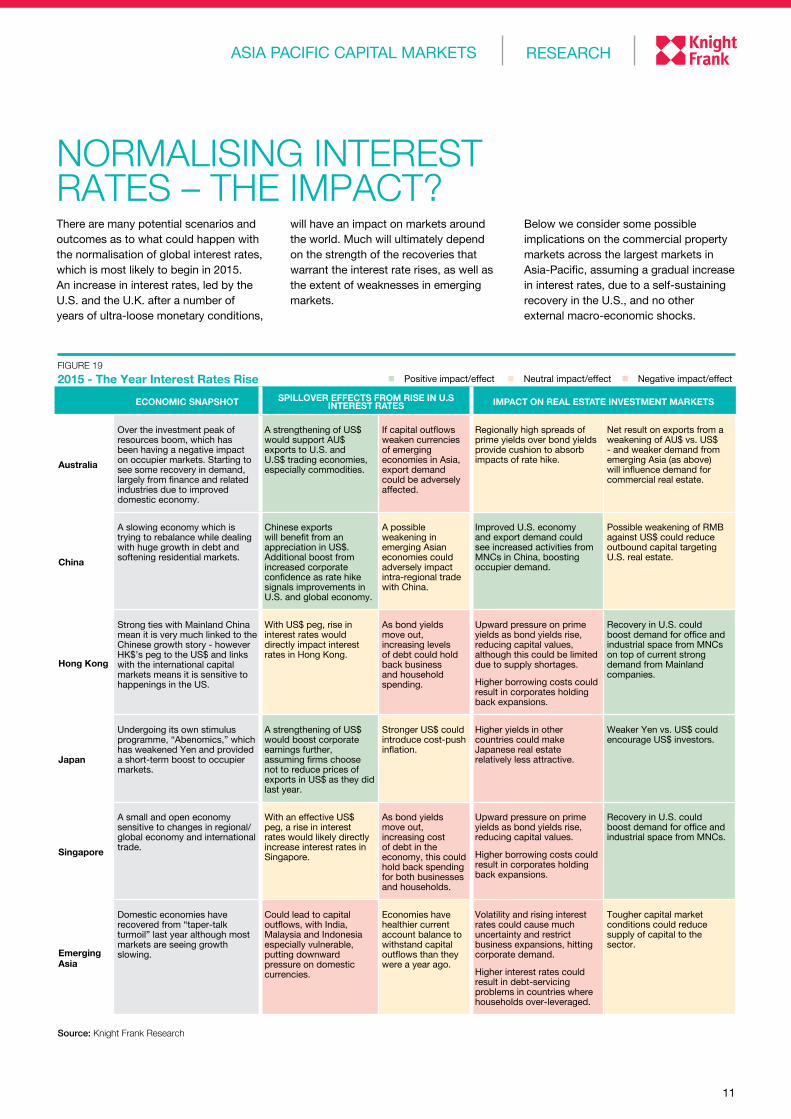
FIGURE 19
2015 - The Year Interest Rates Rise
ECONOMIC SNAPSHOT SPILLOVER EFFECTS FROM RISE IN U.S INTEREST RATES IMPACT ON REAL ESTATE INVESTMENT MARKETS
Australia
over the investment peak of resources boom, which has been having a negative impact on occupier markets. Starting to see some recovery in demand, largely from finance and related industries due to improved domestic economy.
a strengthening of uS$ would support au$ exports to u.S. and u.S$ trading economies, especially commodities.
if capital outflows weaken currencies of emerging economies in asia, export demand could be adversely affected.
regionally high spreads of prime yields over bond yields provide cushion to absorb impacts of rate hike.
net result on exports from a weakening of au$ vs. uS$ - and weaker demand from emerging asia (as above) will influence demand for commercial real estate.
China
a slowing economy which is trying to rebalance while dealing with huge growth in debt and softening residential markets.
chinese exports will benefit from an appreciation in uS$. additional boost from increased corporate confidence as rate hike signals improvements in u.S. and global economy.
a possible weakening in emerging asian economies could adversely impact intra-regional trade with china.
improved u.S. economy and export demand could see increased activities from mncs in china, boosting occupier demand.
possible weakening of rmB against uS$ could reduce outbound capital targeting u.S. real estate.
Hong Kong
Strong ties with mainland china mean it is very much linked to the chinese growth story - however hK$’s peg to the uS$ and links with the international capital markets means it is sensitive to happenings in the uS.
With uS$ peg, rise in interest rates would directly impact interest rates in hong Kong.
as bond yields move out, increasing levels of debt could hold back business and household spending.
upward pressure on prime yields as bond yields rise, reducing capital values, although this could be limited due to supply shortages.
higher borrowing costs could result in corporates holding back expansions.
recovery in u.S. could boost demand for office and industrial space from mncs on top of current strong demand from mainland companies.
Japan
undergoing its own stimulus programme, “abenomics,” which has weakened Yen and provided a short-term boost to occupier markets.
a strengthening of uS$ would boost corporate earnings further, assuming firms choose not to reduce prices of exports in uS$ as they did last year.
Stronger uS$ could introduce cost-push inflation.
higher yields in other countries could make Japanese real estate relatively less attractive.
Weaker Yen vs. uS$ could encourage uS$ investors.
Singapore
a small and open economy sensitive to changes in regional/global economy and international trade.
With an effective uS$ peg, a rise in interest rates would likely directly increase interest rates in Singapore.
as bond yields move out, increasing cost of debt in the economy, this could hold back spending for both businesses and households.
upward pressure on prime yields as bond yields rise, reducing capital values.
higher borrowing costs could result in corporates holding back expansions.
recovery in u.S. could boost demand for office and industrial space from mncs.
Emerging Asia
Domestic economies have recovered from “taper-talk turmoil” last year although most markets are seeing growth slowing.
could lead to capital outflows, with india, malaysia and indonesia especially vulnerable, putting downward pressure on domestic currencies.
Economies have healthier current account balance to withstand capital outflows than they were a year ago.
volatility and rising interest rates could cause much uncertainty and restrict business expansions, hitting corporate demand.
higher interest rates could result in debt-servicing problems in countries where households over-leveraged.
tougher capital market conditions could reduce supply of capital to the sector.
Source: Knight Frank Research
n positive impact/effect n neutral impact/effect n negative impact/effect
there are many potential scenarios and outcomes as to what could happen with the normalisation of global interest rates, which is most likely to begin in 2015. an increase in interest rates, led by the u.S. and the u.K. after a number of years of ultra-loose monetary conditions,
will have an impact on markets around the world. much will ultimately depend on the strength of the recoveries that warrant the interest rate rises, as well as the extent of weaknesses in emerging markets.
Below we consider some possible implications on the commercial property markets across the largest markets in asia-pacific, assuming a gradual increase in interest rates, due to a self-sustaining recovery in the u.S., and no other external macro-economic shocks.
NORMALISING INTEREST RATES – THE IMPACT?
ASIA PACIFIC RESEARCH
Nicholas Holt asia pacific head of research +65 6429 3595 [email protected]
GLOBAL CAPITAL MARKETS
Neil Brookes asia pacific head of capital markets +65 6429 3585 [email protected]
ASIA PACIFIC CAPITAL MARKETS
Australia James Parry +61 2 9036 6758 [email protected]
China Nick Cao +86 21 6032 6758 [email protected]
Hong Kong Henry Lam +852 2846 9568 [email protected]
India Shishir Baijal +91 22 6745 0101 [email protected]
Indonesia Willson Kalip +62 21 570 7170 (100) [email protected]
Japan Daisuke Naoi +65 6429 3597 [email protected]
Korea Yoona Choi +82 2 538 5360 [email protected]
Malaysia Sarky Subramaniam +603 228 99 688 [email protected]
New Zealand Layne Harwood +64 3 377 1460 [email protected]
Singapore Ian Loh +65 6228 6823 [email protected]
Thailand Phanom Kanjanathiemthao +66 2 643 8223 [email protected]
RESEARCH
TAIWAN CHINAGLOBAL TRENDS
GLOBAL CAPITAL MARKETSSPRING 2014
global capital markets Spring 2014
One reason for the deceleration is the slowdown in China, although activity also fell across the rest of Asia: in H1 2014, investment volumes totalled only 37.6% of the amount achieved in the whole of last year (see Fig. 2). Interestingly, despite these, investment inflow originating from outside Asia during H1 2014 has already surpassed its total volume in 2013 by 76.1% (Fig. 3).
Prices appeared to have peaked in the key Chinese markets in Q1 2014, except those of Shanghai’s office sites – which managed to hold up – and Beijing’s residential sector – which has been easing since Q4 2013 (Figure 4). Guangzhou provides a stark contrast: after values reached record highs with the entry of new comers such as Zhuhai Huafa and Financial Street in Q1 2014, the land market cooled off substantially in Q2 2014 with nine failed auctions in June alone. Faced with a slowdown in the property market, a resultant large inventory and credit constraints, developers have become more cautious. In Beijing, moving forward, with merely 124 sq km of land left for development, the National Land Bureau intends to decelerate the pace of land supply. Notwithstanding, land in the capital is expected to be fully utilised by 2020. Shanghai is scarcely better positioned, with 153 sq km remaining against its 2020 target. Against this backdrop, we expect land prices in Beijing and Shanghai to be well supported in the medium-to-long term.
The confluence of softened property prices as a result of cooling measures, elevated construction costs and an uncertain external economy has led the prices of prime residential and office sites in Hong Kong to slide 4.9% and 4.4% respectively in H1 2014. However, the limited supply of land in urban areas was still highly sought after, while suburban areas faced some challenges due to the government’s commitment to boost land supply in such areas. We expect such divergence to continue.
Singapore’s land price indices stayed flat. The residential market, in particular, faced strong headwinds. In Q2 2014, as compared to the same period last year right before the impact of
HighlightsBangkok saw the largest increase in the prime residential development land index in H1 2014; Bengaluru topped Asia for the prime office development land index
Land prices appeared to have peaked in most key Chinese markets in Q1 2014
Abenomics continued to drive demand for commercial land in Tokyo
While land transaction volumes in Asia dropped 5.0% year-on-year in H1 2014, investment inflows from outside Asia increased 423.9% year-on-year
NicHolas Holt Asia Pacific Head of Research
Follow Nicholas at @nholtKF
For the latest news, views and analysis on the world of prime property, visit Global Briefing or @KF_CommBrief
cHiNa slows dowN as BaNgkok, Jakarta aNd PHNom PeNH Power oNThe first half of 2014 saw Knight Frank’s Prime Asia Development Land Index advance 4.9% and 2.9% for office and residential sites respectively. This represents a loss in momentum when compared to the 9.8% and 7.7% respective growth rates in H1 2013.
RESEARCH
PRIME ASIA DEVELOPMENT LAND INDEX
“the confluence of softening property prices as a result of cooling measures, (and) elevated construction costs has led the prices of prime residential and office sites in Hong kong to slide...”
Figure 1
Prime Asia Land Price Indices Unweighted
Source: knight Frank research
Prime Residential Development Land IndexPrime Office Development Land Index
80
100110120130
90
140150
Q4’
11
Q2’
12
Q1’
12
Q3’
12
Q1’
13
Q3’
13
Q4’
12
Q2’
13
Q4’
13
Q2’
14
Q1’
14
Figure 2
Investment Volumes in Asia US$ million, development sites > US$10 million
Source: real capital analytics, knight Frank research
0
100,000
200,000
300,000
400,000
500,000
600,000
2007 2008 2009 2010 2011 2012 2013 1H14
China Rest of Asia
Figure 3
Cross-border developer activity Origin of cross-border investment volumes in Asia (US$ million, development sites > US$ million)
Source: real capital analytics, knight Frank research
0
5,000 10,000 15,000 20,000
25,000 30,000 35,000 40,000 45,000 50,000
2008 2009 2010 2011 2012 2013 1H14
Asian Other
prime asia Development land index
the Wealth report 2014
india real Estate outlook h1 2014
RECENT MARKET-LEADING RESEARCH PUBLICATIONS
Knight Frank research reports are available at KnightFrank.com/Research
Knight Frank commercial research provides strategic advice, consultancy services and forecasting to a wide range of clients worldwide including developers, investors, funding organisations, corporate institutions and the public sector. all our clients recognise the need for expert independent advice customised to their specific needs.
© Knight Frank LLP 2014this report is published for general information only and not to be relied upon in any way. although high standards have been used in the preparation of the information, analysis, views and projections presented in this report, no responsibility or liability whatsoever can be accepted by Knight Frank llp for any loss or damage resultant from any use of, reliance on or reference to the contents of this document. as a general report, this material does not necessarily represent the view of Knight Frank llp in relation to particular properties or projects. reproduction of this report in whole or in part is not allowed without prior written approval of Knight Frank llp to the form and content within which it appears. Knight Frank llp is a limited liability partnership registered in England with registered number oc305934. our registered office is 55 Baker Street, london, W1u 8an, where you may look at a list of members’ names.
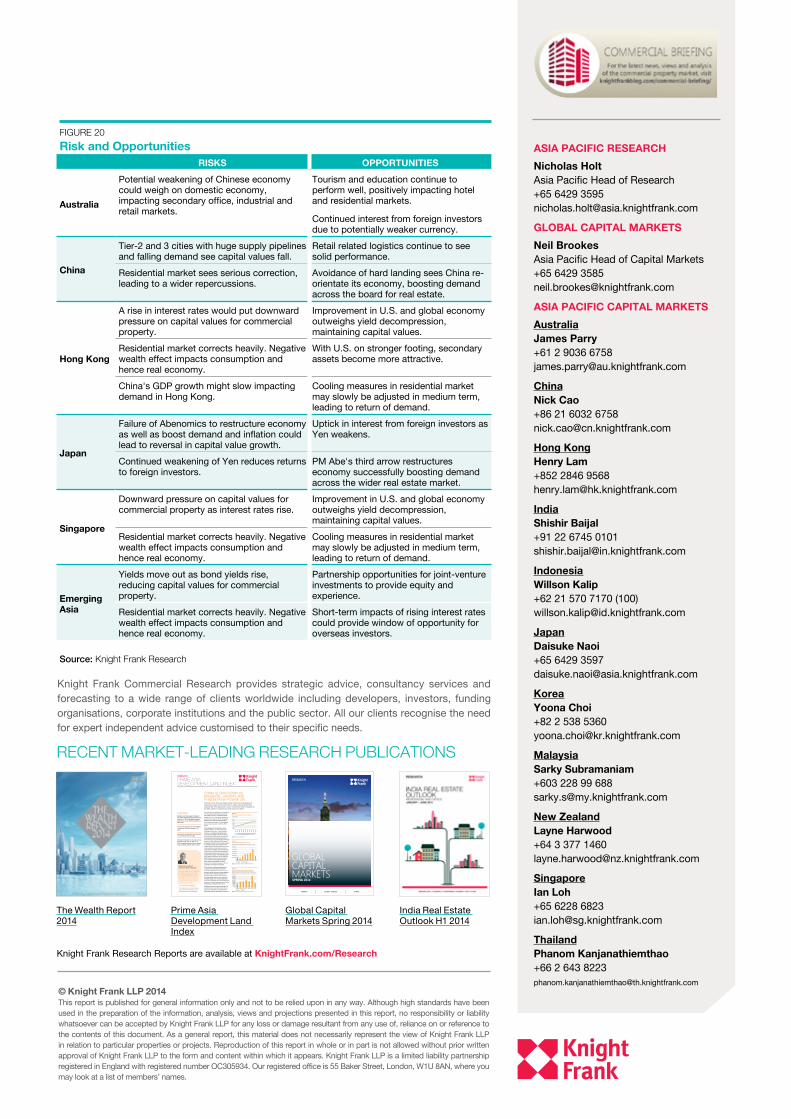
FIGURE 20
Risk and OpportunitiesRISKS OPPORTUNITIES
Australia
potential weakening of chinese economy could weigh on domestic economy, impacting secondary office, industrial and retail markets.
tourism and education continue to perform well, positively impacting hotel and residential markets.
continued interest from foreign investors due to potentially weaker currency.
China
tier-2 and 3 cities with huge supply pipelines and falling demand see capital values fall.
retail related logistics continue to see solid performance.
residential market sees serious correction, leading to a wider repercussions.
avoidance of hard landing sees china re-orientate its economy, boosting demand across the board for real estate.
Hong Kong
a rise in interest rates would put downward pressure on capital values for commercial property.
improvement in u.S. and global economy outweighs yield decompression, maintaining capital values.
residential market corrects heavily. negative wealth effect impacts consumption and hence real economy.
With u.S. on stronger footing, secondary assets become more attractive.
china's gDp growth might slow impacting demand in hong Kong.
cooling measures in residential market may slowly be adjusted in medium term, leading to return of demand.
Japan
Failure of abenomics to restructure economy as well as boost demand and inflation could lead to reversal in capital value growth.
uptick in interest from foreign investors as Yen weakens.
continued weakening of Yen reduces returns to foreign investors.
pm abe's third arrow restructures economy successfully boosting demand across the wider real estate market.
Singapore
Downward pressure on capital values for commercial property as interest rates rise.
improvement in u.S. and global economy outweighs yield decompression, maintaining capital values.
residential market corrects heavily. negative wealth effect impacts consumption and hence real economy.
cooling measures in residential market may slowly be adjusted in medium term, leading to return of demand.
Emerging Asia
Yields move out as bond yields rise, reducing capital values for commercial property.
partnership opportunities for joint-venture investments to provide equity and experience.
residential market corrects heavily. negative wealth effect impacts consumption and hence real economy.
Short-term impacts of rising interest rates could provide window of opportunity for overseas investors.
Source: Knight Frank Research