Asia · Consumer Foods First Pacific owns 50.1% of Indofood and has an economic interest of 40.3%...
34
HKEx: 00142 ADR: FPAFY www.firstpacific.com Copyright © First Pacific Company Limited 26 June 2020. All rights reserved. Investor Presentation Creating long-term value in Asia
Transcript of Asia · Consumer Foods First Pacific owns 50.1% of Indofood and has an economic interest of 40.3%...

HKEx: 00142ADR: FPAFY
www.firstpacific.com
Copyright © First Pacific Company Limited 26 June 2020. All rights reserved.
InvestorPresentation
Creatinglong-term value
in Asia
2
Consumer Foods
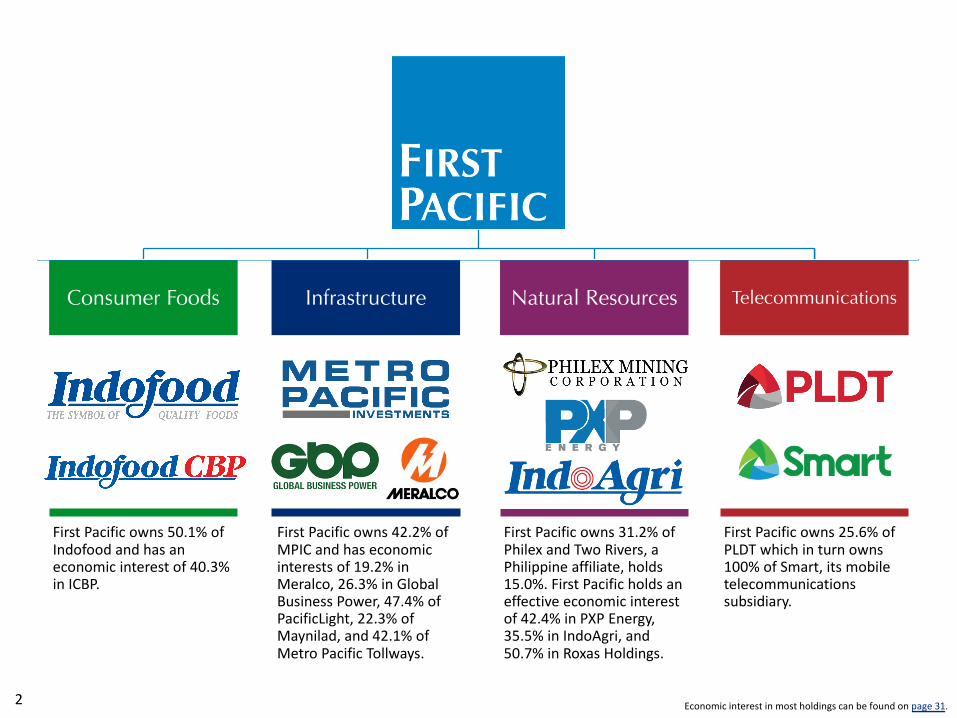
First Pacific owns 50.1% of Indofood and has an economic interest of 40.3% in ICBP.
Infrastructure
First Pacific owns 42.2% of MPIC and has economic interests of 19.2% in Meralco, 26.3% in Global Business Power, 47.4% of PacificLight, 22.3% of Maynilad, and 42.1% of Metro Pacific Tollways.
Telecommunications
First Pacific owns 25.6% of PLDT which in turn owns 100% of Smart, its mobile telecommunications subsidiary.
Natural Resources
First Pacific owns 31.2% of Philex and Two Rivers, a Philippine affiliate, holds 15.0%. First Pacific holds an effective economic interest of 42.4% in PXP Energy, 35.5% in IndoAgri, and 50.7% in Roxas Holdings.
Economic interest in most holdings can be found on page 31.

Senior Management of First Pacific
Chris H. YoungExecutive Director & CFO
Manuel V. PangilinanManaging Director & CEO
John W. RyanAssociate Director
Ray C. EspinosaAssociate Director
Stanley H. YangExec. Vice President,Corp. Development
Peter T.H. LinExec. Vice President,
Tax & Treasury
Richard P.C. ChanExec. Vice President,Financial Controller
Victorico P. VargasAssociate Director
Marilyn A. Victorio-Aquino
Associate Director
3
Joseph H.P. NgAssociate Director

4
Covid-19 Response
First Pacific Has Stress-Tested its Liquidityo The company has laid out several scenarios of potential
impacts on liquidityo Foreign exchange risko Cash inflow
o First Pacific holds sufficient cash resources, in particular cash proceeds from the sale of Goodman Fielder last year, to meet all cash requirements in 2020, including: the only borrowing falling due in 2020, all interest expense and Head Office overheads
o FPC pandemic response at Head Office includes temperature checks at building entrances, and persistent advocacy of thorough hand-washing, social distancing and the wearing of masks
o All business travel is suspended indefinitelyo Group companies in the Philippines are offering extended
payment terms where possible, introduced work-from-home policies where possible, ensured salary payments to staff, and released end-year bonus payments early
Philex and Roxas Are Helping Their Communitieso Philex, a large gold and copper mining company, has
introduced pandemic response policies at all its siteso Roxas, a sugar and alcohol producer, is producing 70%
ethyl alcohol for use in hand and surface disinfectants for use in hospitals and public places
Indofood Is Gearing up to Help Those in Needo In a practice it has followed for many years when
Indonesia faces natural disaster, Indofood is gearing up to help the Government ensure that all regions of the country have adequate food supplies
o Like other Group companies, Indofood and its subsidiaries are following government guidelines for helping to slow and isolate the pandemic, such as work-from-home policies where possible, temperature checks of staff and visitors, and other such practices
PLDT Is Ensuring its Data Network Remains Robusto PLDT is carrying out its public service obligation to ensure
that its data network is prepared to withstand greatly increased demands for bandwidth
o It has introduced data discounts and giveaways to protect public access to news and information
o PLDT has strengthened sanitation measures at stores and service centers and introduced temperature checks
MPIC Companies Are Adjusting to Evolving Demando The toll roads business has suspended construction
activitieso Meralco is observing declines in electricity demand from
the industrial and commercial sectors while residential demand rises with more people staying home
o The Maynilad water company has reported it has sufficient reserves of water through June and has commitments of further supply for the balance of the year
o MPIC’s 20%–owned hospitals business is undertaking crash preparations to help cope with the Covid-19 pandemic

Renewed Focus on Core Assets
Diverse Emerging ASEAN Portfolioo Our Hong Kong-based investment management and
holding company has developed three core assets in fast-growing ASEAN markets: Indofood, MPIC, and PLDT
o Together they offer earnings stability and high growth potential
o Capital is continually recycled to the most promising opportunities
Indofood (Gross Annual Revenues of $5.4 Billion)o One of the largest food companies in Indonesiao Largest instant wheat noodles producer in the worldo Largest flour and pasta manufacturer in Indonesiao Operator of one of the largest FMCG distribution networks
in Indonesia
PLDT (Gross Annual Revenues of $3.1 Billion)o The largest telecom services provider in the Philippineso Delivering the finest customer experience in the marketo Operator of the most technologically advanced network in
the countryo Gaining momentum in a new phase of sustained growth in
both subscriber numbers and data revenues
MPIC (Gross Annual Revenues of $1.7 Billion)o The largest infrastructure investment holding company in
the Philippines and expanding in other ASEAN marketso Invested in key natural monopolies in electricity
distribution and generation, toll roads, and water, as well as other growth investments, e.g. hospitals and logistics
Core Assets Are Engines of Growtho First Pacific’s key investments are based in the fast-
growing economies of Southeast Asia, a region we know well
o Our ambition is threefold:o Increase distributable earningso Narrow valuation discountso Nurture core holdings for growth
Non-core Investments to Be Guided to Exito First Pacific has selected a handful of investments to be
sold, freeing capital for debt reduction and distribution to shareholders via share repurchases
o These assets are outside our chosen geography of emerging Asia and outside our sector focus on consumer foods, infrastructure, telecommunications and natural resources
o Potential disposals after Goodman Fielder will come from non-core investments
Value Investmentso Our holding company is currently trading at a relatively
high discount to its net asset valueo Two of our three core investments are also trading at large
discounts – Indofood and MPICo First Pacific management is rigorously seeking to narrow
our NAV discount and release value to shareholderso Our key means is seeking disposal of those assets deemed
non-core while focusing on value-creation at core investments and narrowing interest and head-office costs
5

13 cmX
13 cm11.5 x 4.5
Gross Asset Value of $4.15 Billion
Objectiveso Unlock value, enhance cash flows to deliver
dividend/distribution returns, grow share price, and finance further investment in value-enhancing businesses, taking into consideration all relevant criteria, including Environmental, Social and Governance (ESG) factors, to better manage risk and generate sustainable long-term returns
Criteriao Be located in or trading with fast-growing economies of
emerging Asiao Be related to our four industry sectors (consumer foods,
infrastructure, natural resources and telecommunications)
o Have a strong or dominant market position in their sectors
o Possess the potential for substantial cash flowso Allow FPC to establish management control or
significant influence
Strategieso Identify undervalued or underperforming assets with
strong growth potential and possible synergieso Set strategic direction, develop business plans and
define targetso Raise reporting and ESG standards to world-class levels
at First Pacific and the companies we invest in
PLDT$1.39 bln
34% of GAV
MPIC$755 mln
18% of GAV
PhilexGroup$252 mln(6%)
Indofood$1.73 bln
42% of GAV
Data as at end-May 2020; rounding may affect totals. Head Office cash not included.
Roxas Holdings$20 mln (0.5%)
6

13.6 cmX
13.6 cm1.3 x 3.7
$24.8 Bln of Major Assets Represented in Portfolio
40%33%22%
5%
Consumer FoodsInfrastructureTelecommunicationsNatural Resources
Diversified Portfolio, Strong Returnso Balanced weighting of mature and growth
investmentso Balanced weighting of different sectorso 16 years of growth: Gross Asset Value
grew at a compound annual growth rate of 9% from end-2003 to end-2019
o CAGR of 17% in dividend income to First Pacific from 2003 to 2019
o First Pacific dividend policy of at least 25% of recurring profit since 2010
o First Pacific market cap: $841 million at end-May 2020Indofood
$3.46 blnMeralco$6.30 bln
MPIC $1.80 bln
ICBP$6.51 bln
PLDT$5.44 bln
Philex Group $399 m
ln
Plantations & Sugar $909 m
ln
Note: Area of pie chart segmentsrepresents market capitalization as atend-May 2020. Rounding may affecttotals. Data from Bloomberg.
7

7.0 x 11.013.1 x 11.2
89.5
325.0 218.8
(72.5)
(66.6) (17.8) (4.6) (0.4)
165.1 13.5
050
100150200250300350400
Ope
ning F
ree C
ash
Sale
of In
vestm
ent (n
et)
Net
Inter
est E
xpen
se
Dist
ributi
ons P
aymen
t
Cor
p. Ove
rhea
ds
Oth
ers
Tax
Paid
Divi
dend
& Fe
e Inc
ome
Net
New B
orro
wings
Clos
ing Fr
ee C
ash
7.1 x 11.013.1 x 3.8
289.5 290.0
(18.4)
(6.9)(4.3) (1.9) (1.4) (1.2)
28.7 5.9
230
240
250
260
270
280
290
300
2018
Goo
dman
Field
er
FPNR
FPM
Pow
er
Phil
ex
PLD
T
Hea
d Offic
e
Indo
food
MPIC 20
19
Core Holdings Deliver 9% Contribution Growth
o Turnover rose 4% to $8.1 billion vs. $7.7 billion on strong growth at Indofood and MPIC
o Contribution from three core holdings (Indofood, MPIC, PLDT) rose 9% to $409.5 million vs. $376.3 million a year earlier
o Contribution from operations rose at a slower 0.4% rate to $395.6 million vs. $393.9 million largely as a result of lower contribution from non-core investments
o Recurring profit was flat at $290.0 million vs. $289.5 million on lower lower corporate overhead offset by higher other costs
o First Pacific recorded a net loss of $253.9 million vs. net profit of $131.8 million a year earlier largely as a result of loss on disposal of Goodman Fielder and non-cash impairment in the value of investment in PacificLightPower
o Net interest expense was flat at $76.5 million vs. $76.4 million, corporate overheads fell 12% to $20.8 million vs. $23.7 million and other expenses rose 93% to $8.3 million vs. $4.3 million
o The sale of the Goodman Fielder stake in December 2019 delivered proceeds of $275.0 million
o Full-year distribution of 13.5 HK cents/share amounts to 26% of recurring profit, marking the 10th year in a row that First Pacific has distributed at least 25% of recurring profit to shareholders
10th Year of 25% Dividend Payout
2019 Recurring Profit (USD mln)
2019 Free Cash Flow (USD mln)
8

Gearing(times)
NetDebt/(Cash)
CoreProfit/(Loss)
TotalEquity
Headline Group Data 2019 & End-Year (USD mln)
PLDTMPIC(i)
MPIC - Head OfficeMPTCMeralcoGBPCBeacon Electric(ii)
Beacon PowerGenMayniladPhilexPXP EnergyIndofood(i)
ICBPIndoAgriSIMPLonsumFPM Power(i)
PacificLight PowerRoxasTotal
First Pacific - Head Office
GrossDebt
3,802.4 4,935.0 1,682.4 1,339.1
814.6 640.7
-179.3 811.3 202.9
-1,652.9
169.5 831.0 760.9
-501.2 501.2 186.0
19,010.4
1,655.6
CashOn Hand
481.2 1,574.0
764.4 216.4
1,543.3 229.4
9.0 14.3
231.8 15.7
4.9 988.8 601.3 128.6 123.6
81.4 52.7 52.6
9.2 7,122.6
325.0
InterestCover
5.8 5.1 4.9 5.3 n/a 3.3
30.8 2.7 7.3 n/a n/a 7.6
53.3 0.7 0.8 n/a n/a n/a n/a
2.0
EBITDA
1,547.7 793.2 217.6 257.3 737.4 191.4 121.5
27.1 316.0
32.3 (5.1)
923.0 608.3 134.9 134.6
41.8 3.3 5.8 0.5
6,088.5
147.4
(i) Consolidated.(ii) Excludes preferred shares of Pesos 23.1 billion (US$456 million).
PHP50.6451.57
IDR13,90114,146
FX rates vs. USDClosingAverage
SGD1.3461.363
3,321.2 3,361.0
918.0 1,122.7 (728.7)411.3
(9.0)165.0 579.5 187.2
(4.9)664.1
(431.8)702.4 637.3 (81.4)448.5 448.6 176.8
11,887.8
1,330.6
1.45 0.69 0.33 1.04 n/a
0.66 n/a
0.56 0.58 0.41 n/a
0.17 n/a
0.48 0.50 n/a n/a
2.02 0.98
0.76
2,296.6 4,858.7 2,745.8 1,080.8 1,663.3
618.5 1,832.4
296.5 996.9 453.6 108.9
3,899.2 1,918.6 1,450.5 1,279.1
611.4 -
222.4 181.3
26,514.7
1,740.0
3,280.7 1,709.5
251.1 358.8
6,172.5 469.7 126.1
27.8 465.2 131.7
1.4 5,414.5 2,990.0
965.0 965.0 261.5 713.4 713.4 217.4
25,234.6
8,054.7
Turnover
486.9 302.5 138.2 102.1 462.1
52.8 117.2
17.1 149.8
3.0 (1.5)
346.2 364.9 (49.3)(12.6)
17.9(38.6)(44.4)(15.8)
2,398.7
59.5
9
8.0 x 12.11.3 x 10.2
4.0 x 12.012.1 x 3.7
170
400
210
100
252
359
175
0
100
200
300
400
500
2020 2021 2022 2023 2024 2025 2026 2027 2028 2029
Unsecured Bank Loans Secured Bond Unsecured Bonds
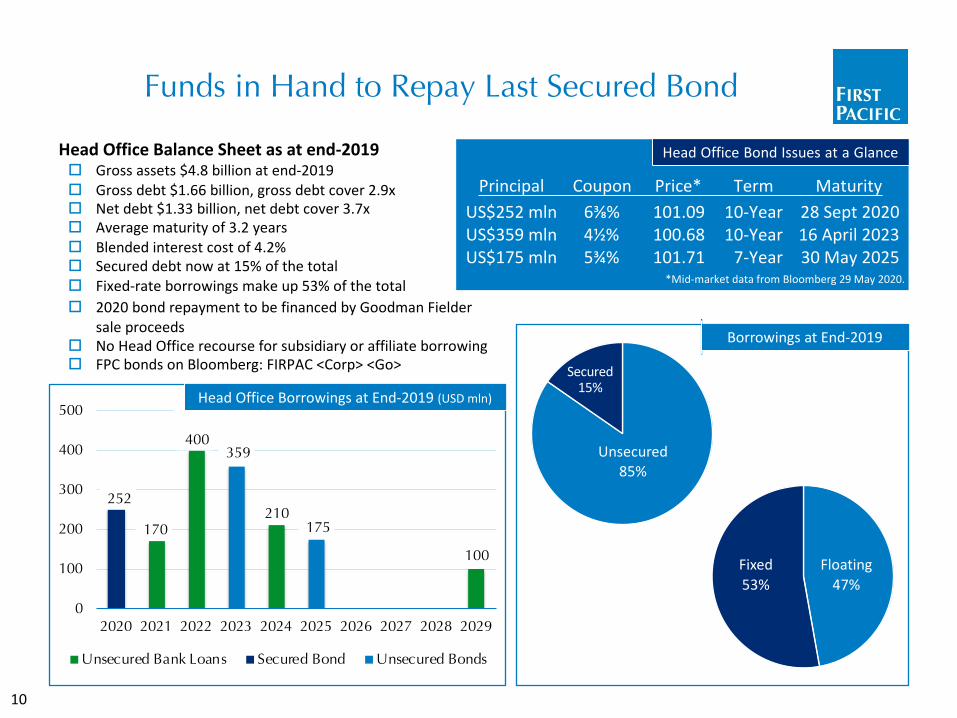
Funds in Hand to Repay Last Secured Bond
Head Office Balance Sheet as at end-2019o Gross assets $4.8 billion at end-2019o Gross debt $1.66 billion, gross debt cover 2.9xo Net debt $1.33 billion, net debt cover 3.7xo Average maturity of 3.2 yearso Blended interest cost of 4.2%o Secured debt now at 15% of the totalo Fixed-rate borrowings make up 53% of the total
Head Office Bond Issues at a Glance
*Mid-market data from Bloomberg 29 May 2020.
Coupon6⅜%4½%5¾%
Term10-Year10-Year
7-Year
Maturity28 Sept 202016 April 202330 May 2025
PrincipalUS$252 mlnUS$359 mlnUS$175 mln
Price*101.09 100.68 101.71
5.6 x 5.618.5 x 12.0
5.6 x 5.613.7 x 8.2
Borrowings at End-2019
Unsecured85%
Secured15%
Floating47%
Fixed53%
Head Office Borrowings at End-2019 (USD mln)
10
o 2020 bond repayment to be financed by Goodman Fielder sale proceeds
o No Head Office recourse for subsidiary or affiliate borrowingo FPC bonds on Bloomberg: FIRPAC <Corp> <Go>

3.5 x 22.81.3 x 14.5
5.5 x 12.01.3 x 8.8
Continuing Improvement in ESG Scores
ISS Governance QualityScore of 4; ISS ESG Prime Ratingo First Pacific has a QualityScore rating of 4 from Institutional
Shareholder Services as of June 2020o The scale ranges from a best score of 1 to a worst score of 10o First Pacific was awarded a “Prime” status by ISS ESG for fulfilling
“demanding requirements regarding sustainability performance” in our sector
o ISS ESG has awarded First Pacific a C rating, putting FPC in the second decile with “high relative performance”
ESG Reporting by Group Companies
GRI Standard First Report FrequencyCompany
YesYesYesYesYesYes
201320112016201520142015
AnnualAnnualAnnualAnnualAnnualAnnual
IndoAgriMayniladMPICPLDTPhilexRoxas
Historical FPC GHG EmissionsUnit
tonnes CO2-ekg CO2-e/ft2tonnes CO2-e/capitakg CO2-e/USD mln
Total GHG Emissions of FPC Head OfficeRatio indicator in terms of GFARatio indicator in terms of staff numberRatio indicator in terms of revenue
2013303.0
23.5 6.3
50.5
2014308.4
23.9 6.4
45.1
2015226.7
17.6 5.4
35.2
2016185.1
14.4 4.3
27.3
2017180.9
14.0 4.2
24.8
Governance Leads Improvements in 2019 & 2020o Finance Committee formed in 2019 to supervise all capital
allocationo A fifth INED was appointed to the Board in March 2020o ESG is a regular agenda item for Board and Corporate
Governance Committee meetingso First Pacific is committed to incorporating ESG considerations
in making and overseeing investmentso First Pacific’s inaugural ESG Report covered the 2016 financial
yearo FPC began publishing key ESG performance indicators for several
group companies in the 2017 ESG Reporto In 2018 First Pacific incorporated new data protection, privacy
and other policies to bring the company in line with evolving regulations and global best practices
o Our ESG Reports are available here
11
2018185.6
14.4 4.3
24.0
Member of Key ESG Indexeso First Pacific is a founding member of Bloomberg’s Gender
Equality Index – one of only two constituent HK firmso The Company is also a member of the Hang Seng Corporate
Sustainability Index
2019170.9
13.3 4.3
21.2

7.6 x 11.212.9 x 10.7
19,170 19,305
(331)
(268)
(66)
388 156
111 95 38 7 4
17,900
18,100
18,300
18,500
18,700
18,900
19,100
19,300
19,500
1Q19
Sales
Edib
le O
ils &
Fats
Bog
asari
Bev
erage
s
Noo
dles
Dair
y
Food
Seas
oning
s
Dist
ributi
on N
SF*
Plan
tatio
ns
Snac
k Foo
ds
1Q20
Sales
6.5 x 11.212.9 x 3.8
5,004 5,237 5,1365,414
1,354 1,308
299 320 279 346 87 1030
1,000
2,000
3,000
4,000
5,000
6,000
2016 2017 2018 2019 1Q19 1Q20
Net Sales Core Income
1Q 2020 Financial Highlightso Net sales rose 1% to IDR19.3 trillion vs. IDR19.2 trillion on 6% sales
growth at Consumer Branded Products unit and stronger sales at the Distribution division, offset by weaker sales in the Edible Oils & Fats and the Bogasari flour and pasta divisions
o Core income rose 23% to IDR1.52 trillion vs. IDR1.24 trillion driven by sales growth and lower growth in cost of goods sold
o Unit performance*:o CBP sales up 6% to IDR11.4 trillion, EBIT up 11% to IDR2.02
trillion driven by Noodles, Dairy, and Food Seasoningso Bogasari sales down 5% to IDR5.46 trillion, EBIT up 10% to
IDR553 billiono Agribusiness sales up 2% to IDR3.35 trillion, EBIT up 50% to
IDR167 billiono Distribution sales up 9% to IDR1.13 trillion, EBIT up 31% to
IDR76 billion
Outlooko Robust sales growth is seen continuing at CBP, supported by
strong product innovation and an extensive distribution networko Further expansion of CPO milling facilities to support production
growth, whilst expansion in flour milling and dairy will also boost production capacity
o Continued development of food services channels and export business will continue to accelerate growth
o With market leading positions in many categories, supported by an extensive and growing distribution network, Indofood’s products are readily available across Indonesia, and well positioned to capture growth in the FMCG sector
o CEO emphasizes ‘cautious” outlook, enhancing competitiveness
Noodles Business Leads Earnings Growth
Net Sales & Core Income (USD mln)
Change in Sales (IDR bln)
12*Nutrition and Specialty Foods
*Before elimination and unallocated expenses.

7.1 x 11.013.1 x 11.1
11,256
12,006
(151) (42)
487
186 182
55 33
10,400 10,600 10,800 11,000 11,200 11,400 11,600 11,800 12,000 12,200
1Q19
Sales
Elimin
ation
Bevera
ges
Noodl
esDair
y
Food
Seas
onin
gs
Snac
k Foo
ds NSF
1Q20
Sales
7.0 x 11.013.1 x 3.7
2,580 2,657 2,6882,990
795 814
276 298 295 36596 106
0
500
1,000
1,500
2,000
2,500
3,000
3,500
2016 2017 2018 2019 1Q19 1Q20
Net Sales Core Income
Change in Reported Sales (IDR bln)
1Q 2020 Financial Highlightso Net sales rose 7% in Rupiah terms to IDR12.0 trillion vs.
IDR11.3 trillion on growth led by Noodles, Dairy, and Food Seasonings
o EBITDA rose 41% to IDR3.16 trillion vs. IDR2.24 trillion as cost of goods sold grew more slowly than sales
o EBIT margin rose to 23.3% vs. 17.4%, lifted by Dairy margin growth to 17.0% vs. 16.3% as the Beverages margin swung to 4.1% vs. -10.3% and Snack Foods to 12.6% vs. -4.0%
o Core income rose 15% to IDR1.57 trillion vs. IDR1.37 trilliono End-quarter cash on hand at ICBP was IDR8.88 trillion o Outlook is for continuing sales growth led by pandemic-
induced rise in Noodles and Snack Foods saleso With steady and strong sales growth, Indomie noodles
remain well regarded all over the world
Net Sales & Core Income (USD mln)
Note: Figures are before elimination.
Earnings Surge on Stronger Margins
13
6.0 x 11.51.3 x 12.1
Overall Sales (IDR bln)
1Q19
7,452 2,054
714 673 223 454
(314)11,256
Change
7%9%8%
27%15%-9%48%
7%
1Q20
7,939 2,240
769 855 256 412
(465)12,007
NoodlesDairySnack FoodsFood SeasoningsNutrition & Specialty FoodsBeveragesEliminationTotal

5.0 x 12.012.1 x 3.7
1,029 1,091 1,173 984 965
(4)38 33 (16) (29)
-500
0
500
1,000
1,500
2015 2016 2017 2018 2019
External Sales Net Profit/(Loss)
4.5 x 12.012.1 x 8.9
0
100
200
300
400
500
1Q18 2Q18 3Q18 4Q18 1Q19 2Q19 3Q19 4Q19
4.5 x 12.012.1 x 13.6
0
2,000
4,000
6,000
8,000
10,000
1Q18 2Q18 3Q18 4Q18 1Q19 2Q19 3Q19 4Q19
2019 FY: Weak CPO Prices Impact Earnings
FY 2019 Financial Highlightso External sales fell 3% to IDR13.7 trillion vs. IDR14.1 trillion
mainly due to continuing weak commodity priceso Plantations sales fell 4% to IDR8.3 trillion while sales at the
larger Edible Oils & Fats division fell 1% to IDR10.3 trilliono Net loss increased to IDR411 billion from IDR222 billion on
weaker prices, higher provision for plasma receivables, impairment of assets, higher borrowing costs and income tax
o 4Q19 swung to a net profit after tax of IDR4 billion from a loss of IDR362 billion on strong CPO price recovery in the quarter
Operational Highlightso CPO production fell 9% to 840,000 tonnes owing to lower
external purchases of fresh fruit bunches while sales were flat at 882,000 tonnes, boosted owing to continuing sales of end-2018 stocks
o FFB nucleus production fell 2% to 3.3 million tonnes, external production declined 19% to 848,000 tonnes
o Palm kernel production fell 7% to 206,000 tonnes while sales of PK products rose 14% to 220,000 tonnes
Outlooko Replacing older palms in North Sumatra and Riau with
higher-yielding varietieso Milling facilities continue expanding with 45 tonne/hour
FFB mill in East Kalimantan to open in 4Q20o Maintaining competitive pricing strategy for Bimoli
branded cooking oil and expanding Delima as a second brand to capture more affordable product segment
o Increasing capacity to meet growing consumer demand
External Sales & Net Profit/(Loss) (USD mln)
14
CPO Price (IDR/kg)
CPO Sales (‘000 tonnes)
/
Note: IndoAgri reports earnings biannually.

8.0 x 12.911.2 x 10.2
38,792
41,797
(776)(446)
3,810 73
(454) (35)
664 169
37,000
38,000
39,000
40,000
41,000
42,000
43,000
1Q19 S
ervic
e Re
venue
s SM
S
Mobil
e Voice
Mobil
e Data
Inbo
und R
oamin
g et a
l
Fixe
d Voice
Misc
ellan
eous
Hom
e Bro
adban
d
Cor
p. Data
, Data
Cen
ters
1Q20 S
ervic
e Re
venue
s
6.1 x 12.911.2 x 3.8
3,298 3,000 2,892 3,129
744 822 584 549 491 487
127 126 0
500
1,000
1,500
2,000
2,500
3,000
3,500
2016 2017 2018 2019 1Q19 1Q20
Service revenues Core Income
Service Revenues Climb to Record High
Outlooko Service revenues seen rising to new record high in
2020, led by continuing double-digit data growtho 2020 telco core income outlook uncertain owing to
effect of Enhanced Community Quarantine (ECQ)o Dividend policy remains at 60% of telco core incomeo 2020 capex budgeted of ₱83.0 billion to see
deferment of 20-25% of spending to 2021 owing to limitations imposed owing to ECQ regime
o Capex spending to focus on upholding service quality and customer experience, e.g. network maintenance
o Market leadership in technology, service quality and consumer experience continues to grow
Revenues & Core Income (USD mln)
Wireless Fixed Line
Change in Service Revenues* (PHP mln)
1Q 2020 Financial Highlightso Service revenues (net) rose 9% to record high ₱41.5
billion due to a 19% surge in data and broadband revenues, partly offset by lower SMS revenues and voice revenues in wireless and fixed line businesses
o EBITDA rose 8% to ₱21.6 billion on stronger service revenues and lower cost of services and provisions, offset by higher cash opex and subsidies
o EBITDA margin was flat from a year earlier at 52%o Telco core income fell 5% to ₱6.9 billion on higher
depreciation and net financing costs partly offset by higher EBITDA
o Debt/EBITDA unchanged from year-end level at 2.0x when cost of layoffs is excluded
o Data and broadband revenues now account for 71% of all telco service revenues
15*Gross of interconnection costs.

4.5 x 11.013.1 x 13.7
8.48.68.89.09.29.49.69.8
1Q18 2Q18 3Q18 4Q18 1Q19 2Q19 3Q19 4Q19 1Q20
4.5 x 11.013.1 x 8.75
8.0
8.5
9.0
9.5
10.0
10.5
1Q18 2Q18 3Q18 4Q18 1Q19 2Q19 3Q19 4Q19 1Q20
4.5 x 11.013.1 x 3.8
0.0
5.0
10.0
15.0
20.0
25.0
1Q18 2Q18 3Q18 4Q18 1Q19 2Q19 3Q19 4Q19 1Q20
Data Service Revenues Drive Earnings Growth
Home Business Building Fixed Wireless for Fresh Surgeo 1Q 2020 Home service revenues rose 5% to ₱9.6 billion, now
23% of all service revenueso ECQ results in slashed installations, higher demand for home
broadband with surge in data demand in homeso Stronger take-up of fixed wireless while payment terms extendedo Total homes passed up 4% since end-2019 to 7.5 million, port
capacity up 2% to 3.58 million, fiber footprint up 5% to 338,500 cable km
Individual Business Leads Growth on Mobile Data Surgeo 1Q 2020 Individual service revenues rose 20% to ₱20.2 billion,
now 49% of totalo Individual business seen continuing strong revenue growth on
strength of industry-leading customer experienceo Exploding take-up of LTE handsets and SIMs doubles data usage
and puts upward pressure on prepaid ARPUo Mobile data consumption on Smart network overtook industry
rival in 3Q 2019; lead continues to widen in 2020
Individual Service Revenues (PHP bln)
Enterprise Service Revenues (PHP bln)
Home Service Revenues (PHP bln)
16
Businesses Continue to Choose PLDT Enterprise Firsto 1Q 2020 Enterprise service revenues rose 3% to ₱10.1 billion
with ICT/data center business recording 9% growth in the periodo Enterprise revenues now make up 24% of service revenueso Fourth quarter revenues reached ₱10.0 billion for the first time
ever and delivered continuing growth in the first quartero Enterprise segment impacted work-from-home policies under
quarantine, offset by revenues generated from the switcho Much billing has been suspended temporarily under ECQ
3.0 x 7.01.3 x 11.3
3.0 x 7.017.3 x 11.3
3.0 x 7.09.2 x 11.3
3.0 x 7.09.2 x 14.7
3.0 x 7.017.3 x 14.70 2 4 6
Globe
Smart
Upload Speed (mbps)
74 76 78 80 82 84
Globe
Smart
4G Availability (% of time)
0 20 40 60
Globe
Smart
Video Experience
35 36 36 37 37
Globe
Smart
Games Experience
64 64 65 65
Globe
Smart
Voice App Experience
3.0 x 7.01.3 x 14.7
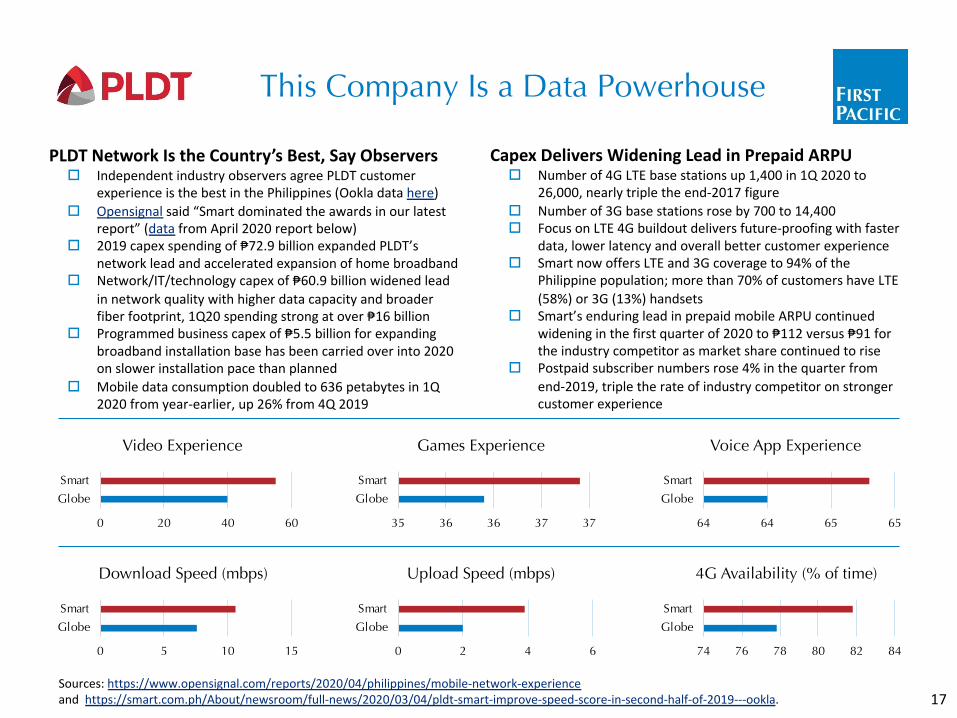
This Company Is a Data Powerhouse
17
PLDT Network Is the Country’s Best, Say Observerso Independent industry observers agree PLDT customer
experience is the best in the Philippines (Ookla data here)o Opensignal said “Smart dominated the awards in our latest
report” (data from April 2020 report below)o 2019 capex spending of ₱72.9 billion expanded PLDT’s
network lead and accelerated expansion of home broadbando Network/IT/technology capex of ₱60.9 billion widened lead
in network quality with higher data capacity and broader fiber footprint, 1Q20 spending strong at over ₱16 billion
o Programmed business capex of ₱5.5 billion for expanding broadband installation base has been carried over into 2020 on slower installation pace than planned
o Mobile data consumption doubled to 636 petabytes in 1Q 2020 from year-earlier, up 26% from 4Q 2019
Capex Delivers Widening Lead in Prepaid ARPUo Number of 4G LTE base stations up 1,400 in 1Q 2020 to
26,000, nearly triple the end-2017 figureo Number of 3G base stations rose by 700 to 14,400o Focus on LTE 4G buildout delivers future-proofing with faster
data, lower latency and overall better customer experienceo Smart now offers LTE and 3G coverage to 94% of the
Philippine population; more than 70% of customers have LTE (58%) or 3G (13%) handsets
o Smart’s enduring lead in prepaid mobile ARPU continued widening in the first quarter of 2020 to ₱112 versus ₱91 for the industry competitor as market share continued to rise
o Postpaid subscriber numbers rose 4% in the quarter from end-2019, triple the rate of industry competitor on stronger customer experience
0 5 10 15
Globe
Smart
Download Speed (mbps)
Sources: https://www.opensignal.com/reports/2020/04/philippines/mobile-network-experienceand https://smart.com.ph/About/newsroom/full-news/2020/03/04/pldt-smart-improve-speed-score-in-second-half-of-2019---ookla.

*Economic interest in Meralco and Global Business Power, respectively.
Toll Roads29%-100% stakes
Electricity46% & 62% stakes*
Water53%-100% stakes
Hospitals20%
16 Hospitals5 Primary Care
Clinics
Rail/Logistics/AFP20%-99% stakes
Light Rail Manila36%
MetropacMovers
99%
100%
35%
§ Largest healthcare provider in the Philippines
§ Present in all major island groups
§ Serving 3.7 mln outpatients and 200,000 inpatients annually
§ Approximately 8,600 accredited medical doctors
§ Approximately 3,300 beds
§ Targeting growth to 5,000 beds in total
10.5%
56% 14% § Largest water utility in the country
§ Serving 9.75 mln people
§ Aim to increase clean water supply to 2,500 MLD from 1,859 MLD currently
AF Payments20%
§ Meralco is the Philippines’ largest electricity distributor
§ It distributes 55% of the country’s electricity
18

7.0 x 11.31.3 x 11.1
940
1,241
1,576 1,710
334 334254 280 286 303
70 670
200
400
600
800
1,000
1,200
1,400
1,600
1,800
2016 2017 2018 2019 1Q19 1Q20
Revenues Core Income
7.0 x 11.013.1 x 11.1
4,954
4,690 (206)
(195)
(61)(43)
180 61
4,100 4,200 4,300 4,400 4,500 4,600 4,700 4,800 4,900 5,000
1Q19
Oth
ers
Toll
Roa
ds R
ail
Wate
r Util
ities
Pow
er
Logis
tics
1Q20
MPIC & Portfolio Strong Amid Pandemic
Responses to Enhanced Community Quarantine (ECQ)o All businesses pass stress test on cash flow under ECQ regimeo Full-year earnings are difficult to forecast but 2020 dividend
commitment remains unchanged from year earliero Priorities are led by staff welfare and business preservation
followed by profitabilityo Power business sees electricity demand lower by 20-30%o Toll road business sees sharply lower traffic, cuts most capexo Light rail operations have been suspended from mid-March as
LRMC prepares social distancing measures when journeys resume; end-May 2020 sell-down cuts stake to 36% vs. 55% for proceeds of ₱3.04 billion
o Hospitals business holds excess capacity to deal with COVID-19 amid sharply lower demand for elective hospital services
Contribution (PHP mln)Revenues & Core Income (USD mln)
1Q 2020 Financial Highlightso Contribution from operating companies fell 5% to ₱4.69 billion
vs. ₱4.95 billion on lower contribution from most businesses, offset by improved performance by Power and Logistics
o Core income declined 6% to ₱3.43 billion vs. ₱3.66 billion on lower contribution and smaller share of Hospitals business
o Non-recurring expenses rose to ₱1.54 billion vs. ₱118 million largely on provision of carrying value of Meralco’s investment in PacificLight Power in Singapore
o MPIC holds sufficient cash following sell-down of Hospitals business, sees no capital call from portfolio companies
o Performance in the first two months of 2020 was stronger at all major businesses prior to the arrival of the COVID-19 pandemic
19

6.2 x 12.211.9 x 12.2
261 256 274
61 6657 47 53
8 9 0
50
100
150
200
250
300
2017 2018 2019 1Q19 1Q20 Energy fee and others Core Income
7.6 x 12.211.9 x 3.8
1,193 1,183 1,1771,278
274 306411 401 425 462
107 113
0
200
400
600
800
1,000
1,200
1,400
1,600
2016 2017 2018 2019 1Q19 1Q20
Distribution Revenues Core Income
1Q 2020 Financial Highlights & Outlook: Meralcoo Distribution revenues rose 9% to ₱15.6 billion vs.
₱14.3 billion on 5% growth in volume sold and average distribution tariff lifted 4% by strong residential sales growth
o Core EBITDA fell 5% to ₱8.41 billion vs. ₱8.83 billion on 12% fall in pass-through revenues
o Core income rose 2% to ₱5.72 billion vs. ₱5.60 billion on share in earnings from San Buenaventura power plant which opened in September 2019
o During ECQ, higher residential demand offset much of the decline in demand by industry
o Volume sold in first quarter rose 5% to 10.9 GWho Overall electricity volume seen down in 2020
ECQ Puts Brakes on Power Demand Growth
1Q 2020 Financial Highlights & Outlook: GBPo Energy fee and other revenues rose 6% to ₱3.36
billion vs. ₱3.18 billion on increased volume soldo Core EBITDA rose 1% to ₱2.06 billion vs. ₱2.04 billion,
held back by higher provisions for uncollectable receivables
o Core income rose 10% to ₱439 million vs. ₱398 million on higher ATEC contribution due to opening of new 119 MW Saranggani expansion plant in October 2019
o Electricity demand seen falling 20-30% owing to ECQ
Distribution Revenues & Core Income (USD mln)
Energy Fee & Others, Core Income (USD mln)
Note: Meralco franchise until 2028.
20

6.1 x 11.113.0 x 3.8
250 260294
359
81 8369 78 84 102
22 180
50
100
150
200
250
300
350
400
2016 2017 2018 2019 1Q19 1Q20 Revenues Core Income
7.0 x 11.113.0 x 11.0
424
412 418 465
109 112 150 146 147 150
35 32
0
50
100
150
200
250
300
350
400
450
500
2016 2017 2018 2019 1Q19 1Q20
Revenues Core Income
1Q 2020 Financial Highlights & Outlook: Watero Maynilad revenues rose 0.5% to ₱5.71 billion vs. ₱5.69
billion as higher domestic demand offset lower commercial demand, held back by lower average tariff
o Core EBITDA flat at ₱3.79 billion vs. ₱3.80 billiono Core income fell 12% to ₱1.61 billion vs. ₱1.82 billion on
higher amortization and net interest expense as well as awarded tariff increases not yet implemented
o Dividend payments remain on hold in ECQ and concession uncertainty
o Billed volumes grew strongly in first two months of year, seen returning to growth trend in a post-ECQ economy
1Q 2020 Financial Highlights & Outlook: Toll Roadso Revenues fell 0.5% to ₱4.22 billion vs. ₱4.24 billion on a
sharp fall in traffic late in the period owing to ECQo Core EBITDA fell 5% to ₱2.73 billion vs. ₱2.87 billiono Core income declined more steeply, by 18% to ₱924
million vs. ₱1.12 billion on higher borrowing costs from additional drawdown and interest cost recognition on completed projects
o Dividend payments seen lower owing to lower traffico Traffic growth was sharply down in ECQ to less than a
quarter of ordinary levelso Post-ECQ traffic is expected to grow from 2019 levels
Toll Road Traffic Slumps in ECQ; Water Demand Steady
Revenues & Core Income (USD mln)
Note: NLEX concession until 2037; SCTEX until 2043; CAVITEX until 2033/2046.
Revenues & Core Income (USD mln)
Note: Maynilad concession until 2037.21

4.8 x 11.912.2 x 3.8
207 198158 143
31 3733 3311 3 (2) 2
-50
0
50
100
150
200
250
2016 2017 2018 2019 1Q19 1Q20
Revenues Core Income/ (Loss)
Revenues & Core Income (USD mln)
Swing to Profit on Surging Gold Price
4.6 x 10.71.3 x 13.1
Silangan Mineral Resource Estimate
Measured Indicated Total M&I Inferred Total
438 133 571 224 795
Metrictonnes(mln)
5,280 1,260 6,540 1,790 8,320
Cu(mln lb.)
0.55 0.43 0.52 0.36 0.47
Cu(percent)
Au(g/t)
0.67 0.47 0.62 0.48 0.58
Au(‘000 oz.)
9,390 2,010
11,400 3,490
14,890
Outlooko Padcal mine life extended by two years to 2022 with
declaration of further proved mineable reserveso Underground sub-level caving mining at the Silangan Project’s
Boyongan phase one planned to begin commercial production in 2022 following $750 million capex program to be paid for by entry of equity partner and project finance
o First Pacific is not seen adding equity to the projecto Definitive Feasibility Study for the first phase of production is
finalized, sees 81 million tons of high-grade ore containing copper and gold
o Initial mining stage of Boyongan ore body to see gold grade of 1.2 grams/tonne and 0.63% copper content
o Project will involve both flotation and leaching refining methods
o Financial and legal advisors have been appointed to secure equity partner and project finance
o Total of 571 million tonnes of mineral resources estimated at Silangan’s Boyongan, Bayugo and Kalayaan ore deposits
o Silangan is located at the northeastern tip of Mindanao Island
1Q 2020 Financial Highlightso Operating revenues rose 15% to ₽1.86 billion vs. ₽1.61 billion as
a result of higher volumes of ore milled and improved grades of gold and copper resulting in higher metal production, combined with higher gold prices, offset in part by lower copper prices and stronger Peso
o Cash production cost was flat at ₱1.07 billion on lower costs for power, labor, and materials and supplies, partly offset by higher cost of other expenses and purchased contracts
o Core income swung to ₽103 million vs. a core loss of ₽112 million a year earlier due to higher operating revenue
o Realized gold price rose 23% to $1,600 vs. $1,304 per oz.o Realized copper price fell 21% to $2.35 vs. $2.96 per lb.
1Q 2020 Production Highlightso Volume of ore milled rose 7% to 1.97 million tonneso Gold output 14,159 oz., up 35% from 10,493 oz.o Gold grade 0.283 grams/tonne vs. 0.239 grams/tonneo Copper output rose 18% to 6.74 million lb. vs. 5.73 million lb.o Copper grade at 0.188% vs. 0.175%o Co-production operating cost per ounce of gold was $1,330 vs.
$1,324, and $1.95 vs. $3.00 per pound of copper produced
22
/

AppendixShareholder InformationSelected Financial Data

Adjusted NAV per Share
(i) Based on quoted share prices applied to the Group’s economic interests.(ii) Based on quoted share price of RHI applied to the Group’s economic interest.(iii) Represents the carrying value of SMECI’s notes.
US$ millionsIndofood PLDT MPIC Philex PXP FP Natural Resources
Head Office - Other assets - Net debt
Total Valuation Number of Ordinary Shares in Issue (millions) Value per share - U.S. dollars
- HK dollars Company's closing share price (HK$) Share price discount to HK$ value per share (%)
At31 December
2019
2,506.2 1,077.8
908.7 127.5
94.8 25.5 99.5
(1,330.6)3,509.4 4,344.9
0.81 6.30 2.65 57.9
Basis(i) (i) (i) (i) (i) (ii) (iii)
At29 May
2020
1,730.2 1,391.9
755.1 102.3
50.4 19.9 99.6
(1,326.2)2,823.2 4,344.9
0.65 5.04 1.50 70.2
24

For the year ended 31 DecemberUS$ millionsIndofood PLDT(ii)
MPIC Philex(ii)
FPM Power FP Natural Resources FPW(iii)
Contribution from operations(iv)
Head Office items: – Corporate overhead – Net interest expense – Other expenses
Recurring profit(v)
Foreign exchange and derivative gains, net(vi)
Gain/(loss) on changes in fair value of biological assets Non-recurring items(vii)
(Loss)/profit attributable to owners of the parent
Contribution and Profit Summary
(i) After taxation and non-controlling interests, where appropriate.(ii) Associated companies.(iii) Joint venture and was sold on 16 December 2019.(iv) Contribution from operations represents the recurring profit contributed to the Group by its operating companies.(v) Recurring profit represents the profit attributable to owners of the parent excluding the effects of foreign exchange and derivative gains, gain/(loss) on changes in fair value of biological assets and non-
recurring items.(vi) Foreign exchange and derivative gains, net represent the net gains on foreign exchange translation differences on the Group’s unhedged foreign currency denominated net assets/liabilities and the changes in
the fair values of derivatives.(vii) Non-recurring items represent certain items, through occurrence or size, which are not considered as usual operating items. 2019’s non-recurring losses of US$553.7 million mainly represent (a) the Group’s loss
on disposal of Goodman Fielder (US$308.3 million), (b) impairment provisions for investment in PLP (US$249.5 million), Philex’s mining assets (US$37.5 million), and MPIC’s investments in Maynilad, MetroPacMovers, Inc. and other water investments (US$124.2 million), (c) PLDT’s manpower reduction cost (US$11.5 million), PLP’s provision for onerous contracts (US$6.9 million) and RHI’s write-off of deferred tax assets (US$6.7 million), partly offset by MPIC’s gain on deconsolidation of MPHHI (US$210.6 million). 2018’s non-recurring losses of US$157.8 million mainly represent the Group’s impairment provisions for assets, including the Group’s investment in Philex (US$82.1 million), PLDT’s wireless network assets, including accelerated depreciation (US$25.0 million), and Philex’s mining assets (US$10.3 million), PLP’s provision for onerous contracts (US$11.0 million), Head Office’s bond tender and debt refinancing costs (US$10.7 million) and Goodman Fielder’s network transformation costs (US$9.3 million).
2019
5,405.9 -
1,709.5 -
713.4 217.4
-8,046.2
2019
163.4 119.3 126.8
1.0 (10.5)
(7.3)2.8
395.6
(20.8)(76.4)
(8.3)290.0
6.8 3.0
(553.7)(253.9)
Contribution toGroup profit(i)Turnover
2018
5,136.1-
1,575.8 -
728.6 301.9
-7,742.4
2018
134.7 120.7 120.9
2.9 (6.2)(0.3)21.2
393.9
(23.7)(76.4)
(4.3)289.5
0.4 (0.3)
(157.8)131.8
25

Head Office Free Cash Flow(i)
(i) Excludes restricted cash as at 31 December 2019 of US$0.04 million and 1 January 2019, 31 December 2018 and 1 January 2018 of US$0.1 million.(ii) Principally represent net proceeds from disposal of Goodman Fielder less investments in PLP.(iii) Mainly payments for lease liabilities and the trustee for share purchase scheme.
For the year ended 31 DecemberUS$ millionsCash dividend and fee incomeHead Office overhead expenseNet cash interest expenseTax paidNet cash inflow from operating activitiesNet proceeds on sale of investment/(net investments)(ii)
Financing activities- Distributions paid- Net borrowings- Others(iii)
Net Increase(Decrease) in cash and cash equivalentsCash and cash equivalents at 1 JanuaryCash and cash equivalents at 31 December
2018
202.9 (26.2) (71.2)
(3.6) 101.9(32.9)
(74.6) 7.5
(3.0) (1.1)90.6 89.5
26
2019
165.1 (17.8) (72.5)
(0.4)74.4
218.8
(66.6) 13.5(4.6)
235.5 89.5
325.0

Group Net Debt and GearingConsolidated
(i) Includes short-term deposits and restricted cash.(ii) Calculated as net debt divided by total equity.(iii) Group adjustments mainly represents elimination of goodwill arising from acquisitions prior to 1 January 2001 against the Group’s retained earnings and other standard consolidation
adjustments to present the Group as a single economic entity.
At 31 December 2019 At 31 December 2018
Head OfficeIndofoodMPICFPM PowerFP Natural ResourcesGroup adjustments(iii)
Total
US$ millions
Associated CompaniesAt 31 December 2019 At 31 December 2018
US$ millionsPLDTPhilex
Net Debt(i)
Net Debt(i)
1,330.6664.2
3,361.0448.5174.1
-5,978.4
3,321.2187.2
TotalEquity
TotalEquity
1,740.03,886.04,842.5
-167.0
(1,877.5)8,758.0
2,296.6453.6
Gearing(ii)
(times)
Gearing(ii)(times)
0.76x0.17x0.69x
-1.04x
-0.68x
1.45x0.41x
NetDebt(i)
NetDebt(i)
1,550.2 1,444.7 3,083.9
498.7 206.4
-6,783.9
2,370.1 163.9
TotalEquity
TotalEquity
2,039.7 3,456.1 4,529.9
321.6 188.1
(1,825.0)8,710.4
2,218.8 450.7
Gearing(ii)
(times)
Gearing(ii)
(times)
0.76x0.42x0.68x1.55x1.10x
-0.78x
1.07x0.36x
27

$215 mln Bond Redemption(2012 7-yr)
28
$282 mln Rights Offer(One-for-five
at HK$3.40/share)
10-yr $400 mln 6.375% Secured Bond
($252 mln outstanding)
7-yr $400 mln 6.00% Unsecured Bond
(redeemed)
7-yr $300 mln 7.375% Secured Bond(redeemed)
10-yr $400 mln 4.50% Unsecured Bond
($359 mln outstanding)
7-yr $175 mln 5.75%Unsecured Bond
($175 mln outstanding)
$500 mln Rights Offer(One-for-eight
at HK$8.10/share)
$219 mln Bond Redemption(2010 7-yr)
$152 mln bond tender($69 mln of 2010 7-yr)
($83 mln of 2010 10-yr)
$220 mln bond tender($160 mln of 2012 7-yr)($60 mln of 2010 10-yr)
A Decade in the Capital Markets
2009 20122010 2013 20182015 20192017

13.4 x 13.41.3 x 4.5
Shareholding Structure of the Company
SalimGroup44.3%
Brandes
Remaining Board Directors & Mgt 2.2%
AllOthers15%
Shareholder Breakdown
Lazard
Seafa
rer
GIC
Investor
Brandes Investment PartnersGIC Asset ManagementLazard Asset ManagementSeafarer Capital PartnersDimensional Fund AdvisorsM&G Investment ManagementLetko, Brosseau & AssociatesGokongwei Investors Oldfield PartnersMarathon Asset ManagementThe Vanguard GroupMaple-Brown AbbottGuthrie Venture Prusik Investment ManagementCharles Schwab IMBlackRock Fund AdvisorsInvesco CanadaHof Hoorneman BankiersAcadian Asset ManagementNordea Investment ManagementValue SquareBanque Pictet & CieJPMorgan Securities City of Bradford District Council State Street Global Advisors
Mln Shares
8.1%3.6%3.6%2.2%1.6%1.6%1.6%1.6%1.6%1.5%1.4%1.3%1.2%1.2%1.1%1.0%0.8%0.7%0.6%0.5%0.5%0.5%0.4%0.3%0.3%
123456789
10111213141516171819202122232425
351 158 155
97 70 69 69 68 68 66 63 56 53 53 49 41 33 29 24 23 21 20 19 15 14
29
M&G
Data as at 29 May 2020, except directors’ interest (see next page). Analysis counts 264 institutional shareholders. Total shares out 4,344,931,044; free float 2,320,526,004.
Oldfield
% Stake
Dimensional

6.5 x 6.5
1.3 x 3.6
7.1 x 7.11.3 x 11.1
7.1 x 7.19.15 x 11.1
7.1 x 7.117.0 x 11.1
6.5 x 168.1 x 3.6
Insider Ownership & Institutional Shareholder Statistics
Geography Investment Style Concentration
ANZ 6%
Singapore 11%
Restof
Asia4%
UK16%
Europe 8%
Hong Kong 11%North
America45%
Value23%
Growth27%
N/A25%
Multi-Style12%
Index 7%
TheRest8%
Next 1528%
Next 2511%
of all shares held by institutionalinvestors are held by
the top 10.
Top 1052%
*Insider ownership data derived from stock exchange filings and includes unvested share awards. Pie chart data on institutional shareholdings as of 29 May 2020.
Directors’ Total Interest*
Anthoni SalimManuel PangilinanChris YoungTedy DjuharAxton SalimBenny SantosoEdward ChenPhilip FanMadeleine LeeMargaret LeungBlair Pickerel
NED, ChairmanED, CEOED, CFONEDNEDNEDINEDINEDINEDINEDINED
1,925,474,95770,493,078
8,385,189 ---
2,946,559 2,088,652
600,000 2,088,652
957,000
Shares-----
5,167,600 --
3,828,000 --
Options
30
Turnover
Low63%
Medium13%
Not Stated24%
Holding periods:Low: Longer than 3 yearsMedium: 2-3 yearsHigh: 1-2 yearsVery Active: <1 year
Very Active 0.2%High 0.1%
Quant 5%
Yield 0.1%Other 0.4%

25.6%
29.6%
50.1
%25.6
%
35.5%
40.3%
50.7%
46.2%
42.4%
32.1%
12.4%
19.2%
42.1%
22.3%
42.2%
18.9%
42.2%
FPC’s EconomicInterest(%)
15.1%
17.6%
12.4%
8.4%41.8%
26.3%
31

Notes
32

This presentation is provided for information purposes only. It does not constitute an offer or invitation to purchase or subscribe for any securities of First Pacific or any of its subsidiaries or other companies it is invested in, and no part of this presentation shall form the basis of or be relied upon in connection with any contract or commitment.
Certain statements contained in this presentation may be statements of future expectations and other forward-looking statements that are based on third-party sources and involve known and unknown risks and uncertainties. Forward-looking statements contained in this presentation regarding past trends or activities should not be taken as a representation that such trends or activities will continue in the future.
There is no obligation to update or revise any forward-looking statements, whether as a result of new information, future events or otherwise. You should not place undue reliance on forward-looking statements, which speak only as of the date of this presentation.
The dollar sign (“$”) is used throughout this presentation to represent U.S. dollars except where otherwise indicated.
We hope the hyperlinks in this document are useful. Please report any breakages or errors.
IMPORTANT NOTICE
33

Contact Us
First Pacific Company Limited(Incorporated with limited liability under the laws of Bermuda)
24th Floor, Two Exchange Square8 Connaught Place, Central
Hong KongTel: +852 2842 4374
Email us at [email protected]
firstpacific.com
33