
Ashok Agarwal, Sajal Gupta, and Rakesh Sharma · Ashok Agarwal, Sajal Gupta, and Rakesh Sharma 1...
23
Measurement of DNA Fragmentation in Spermatozoa by TUNEL Assay Using Bench Top Flow Cytometer Ashok Agarwal, Sajal Gupta, and Rakesh Sharma 1 Introduction DNA fragmentation endonucleases are activated during apoptosis. These nucleases degrade the higher-order sperm chromatin structure into fragments ~30 kb in length and then subsequently into smaller DNA pieces about ~50 kb in length. This fragmented DNA can be detected by the TUNEL (terminal deoxynucleotidyl transferase dUTP nick-end labeling) assay [1, 2]. It is a single-step staining method that labels DNA breaks with FITC-dUTP; flow cytometry is then used to identify the sites of the strand breaks [1, 2]. 2 Principle TUNEL utilizes a template-independent DNA polymerase called terminal deoxynucleotidyl transferase (TdT) that non-preferentially adds deoxyribonucleotides to 3′ hydroxyl (OH) single- and double-stranded DNA. Deoxyuridine tri- phosphate (dUTP) is the substrate that is added by the TdT enzyme to the free 3′-OH break ends of DNA (Fig. 24.1) [1, 2]. The more DNA strand break sites that are present, the more labels that are incorporated within a cell. 3 Specimen Collection A. Ideally, the sample is collected after a minimum of 48 h and not more than 72 h of sexual abstinence. Record the name of the patient, period of abstinence, date, time, and place of collection on the form accompanying each semen analysis. B. The sample should be collected in the privacy of a room near the laboratory. If not, it should be delivered to the laboratory within one hour of collection. 24 A. Agarwal, PhD, HCLD (ABB), ELD (ACE) (*) S. Gupta, MD, MS (Embryology), TS (ABB) R. Sharma, PhD Andrology Center and Reproductive Tissue Bank, American Center for Reproductive Medicine, Cleveland Clinic, Cleveland, OH, USA e-mail: [email protected]; [email protected]; [email protected] Fig. 24.1 Schematic of the DNA staining by the TUNEL assay 181 © Springer International Publishing Switzerland 2016 A. Agarwal et al. (eds.), Andrological Evaluation of Male Infertility, DOI 10.1007/978-3-319-26797-5_24
Transcript of Ashok Agarwal, Sajal Gupta, and Rakesh Sharma · Ashok Agarwal, Sajal Gupta, and Rakesh Sharma 1...
Measurement of DNA Fragmentation in Spermatozoa by TUNEL Assay Using Bench Top Flow Cytometer
Ashok Agarwal, Sajal Gupta, and Rakesh Sharma
1 Introduction
DNA fragmentation endonucleases are activated during
apoptosis. These nucleases degrade the higher-order sperm chromatin structure into fragments ~30 kb in length and then subsequently into smaller DNA pieces about ~50 kb in length. This fragmented DNA can be detected by the TUNEL (terminal deoxynucleotidyl transferase dUTP nick-end labeling) assay [1, 2]. It is a single-step staining method that labels DNA breaks with FITC-dUTP; flow cytometry is then used to identify the sites of the strand breaks [1, 2].
2 Principle
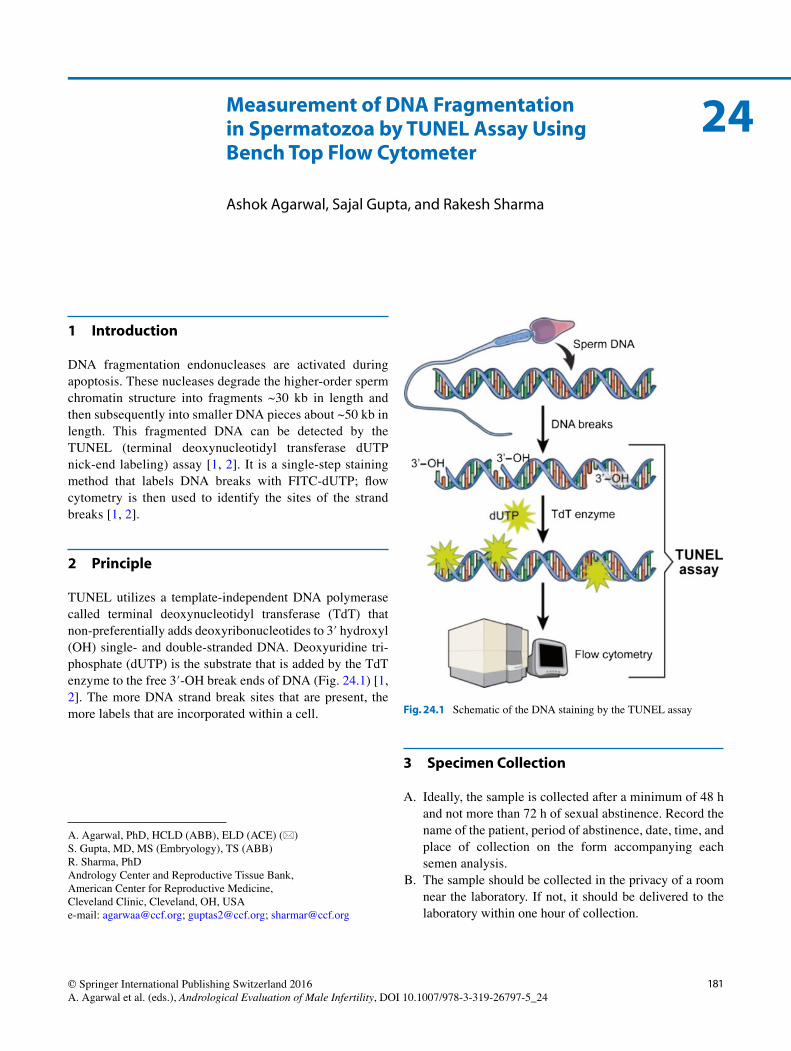
TUNEL utilizes a template-independent DNA polymerase called terminal deoxynucleotidyl transferase (TdT) that non- preferentially adds deoxyribonucleotides to 3′ hydroxyl (OH) single- and double-stranded DNA. Deoxyuridine tri-phosphate (dUTP) is the substrate that is added by the TdT enzyme to the free 3′-OH break ends of DNA (Fig. 24.1) [1, 2]. The more DNA strand break sites that are present, the more labels that are incorporated within a cell.
3 Specimen Collection
A. Ideally, the sample is collected after a minimum of 48 h and not more than 72 h of sexual abstinence. Record the name of the patient, period of abstinence, date, time, and place of collection on the form accompanying each semen analysis.
B. The sample should be collected in the privacy of a room near the laboratory. If not, it should be delivered to the laboratory within one hour of collection.
24
A. Agarwal, PhD, HCLD (ABB), ELD (ACE) (*) S. Gupta, MD, MS (Embryology), TS (ABB) R. Sharma, PhD Andrology Center and Reproductive Tissue Bank, American Center for Reproductive Medicine, Cleveland Clinic, Cleveland, OH, USAe-mail: [email protected]; [email protected]; [email protected]
Fig. 24.1 Schematic of the DNA staining by the TUNEL assay
181© Springer International Publishing Switzerland 2016A. Agarwal et al. (eds.), Andrological Evaluation of Male Infertility, DOI 10.1007/978-3-319-26797-5_24
182
C. The sample obtained by masturbation only and ejacu-lated into a clean, wide-mouth sterile plastic specimen cup. Lubricants should not be used to facilitate semen collection.
D. The sample should be protected from extreme tempera-tures (not less than 20 °C and not more than 40 °C) dur-ing transport to the laboratory.
E. Note any unusual collection or condition of specimen on the report form.
4 Reagents
Note: Use only approved fluids in the operation or cleaning of the instrument.
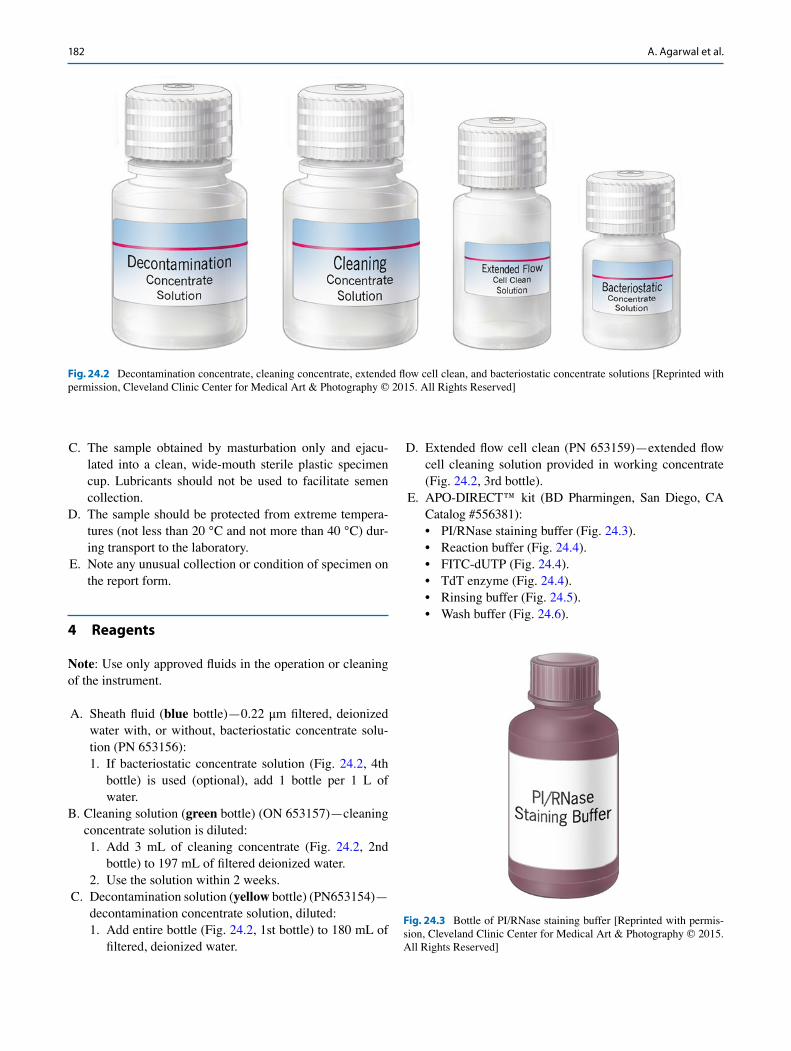
A. Sheath fluid (blue bottle)—0.22 μm filtered, deionized water with, or without, bacteriostatic concentrate solu-tion (PN 653156): 1. If bacteriostatic concentrate solution (Fig. 24.2, 4th
bottle) is used (optional), add 1 bottle per 1 L of water.
B. Cleaning solution (green bottle) (ON 653157)—cleaning concentrate solution is diluted: 1. Add 3 mL of cleaning concentrate (Fig. 24.2, 2nd
bottle) to 197 mL of filtered deionized water. 2. Use the solution within 2 weeks.
C. Decontamination solution (yellow bottle) (PN653154)—decontamination concentrate solution, diluted: 1. Add entire bottle (Fig. 24.2, 1st bottle) to 180 mL of
filtered, deionized water.
D. Extended flow cell clean (PN 653159)—extended flow cell cleaning solution provided in working concentrate (Fig. 24.2, 3rd bottle).
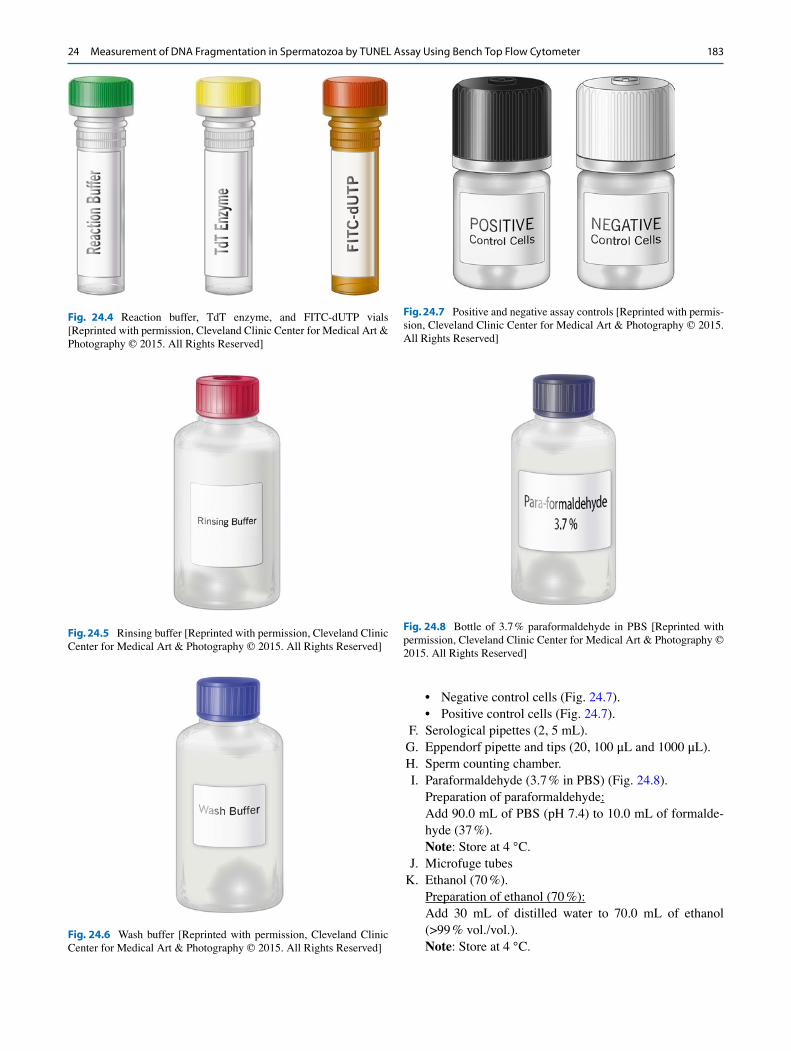
E. APO-DIRECT™ kit (BD Pharmingen, San Diego, CA Catalog #556381):• PI/RNase staining buffer (Fig. 24.3).• Reaction buffer (Fig. 24.4).• FITC-dUTP (Fig. 24.4).• TdT enzyme (Fig. 24.4).• Rinsing buffer (Fig. 24.5).• Wash buffer (Fig. 24.6).
Fig. 24.2 Decontamination concentrate, cleaning concentrate, extended flow cell clean, and bacteriostatic concentrate solutions [Reprinted with permission, Cleveland Clinic Center for Medical Art & Photography © 2015. All Rights Reserved]
Fig. 24.3 Bottle of PI/RNase staining buffer [Reprinted with permis-sion, Cleveland Clinic Center for Medical Art & Photography © 2015. All Rights Reserved]
A. Agarwal et al.
183
• Negative control cells (Fig. 24.7).• Positive control cells (Fig. 24.7).
F. Serological pipettes (2, 5 mL). G. Eppendorf pipette and tips (20, 100 μL and 1000 μL). H. Sperm counting chamber. I. Paraformaldehyde (3.7 % in PBS) (Fig. 24.8).
Preparation of paraformaldehyde:Add 90.0 mL of PBS (pH 7.4) to 10.0 mL of formalde-hyde (37 %).Note: Store at 4 °C.
J. Microfuge tubes K. Ethanol (70 %).
Preparation of ethanol (70 %):Add 30 mL of distilled water to 70.0 mL of ethanol (>99 % vol./vol.).Note: Store at 4 °C.
Fig. 24.4 Reaction buffer, TdT enzyme, and FITC-dUTP vials [Reprinted with permission, Cleveland Clinic Center for Medical Art & Photography © 2015. All Rights Reserved]
Fig. 24.5 Rinsing buffer [Reprinted with permission, Cleveland Clinic Center for Medical Art & Photography © 2015. All Rights Reserved]
Fig. 24.6 Wash buffer [Reprinted with permission, Cleveland Clinic Center for Medical Art & Photography © 2015. All Rights Reserved]
Fig. 24.7 Positive and negative assay controls [Reprinted with permis-sion, Cleveland Clinic Center for Medical Art & Photography © 2015. All Rights Reserved]
Fig. 24.8 Bottle of 3.7 % paraformaldehyde in PBS [Reprinted with permission, Cleveland Clinic Center for Medical Art & Photography © 2015. All Rights Reserved]
24 Measurement of DNA Fragmentation in Spermatozoa by TUNEL Assay Using Bench Top Flow Cytometer
184
L. Flow cytometer (fluorescence-activated cell sorting cali-ber, Becton and Dickinson, San Jose, CA) (Fig. 24.9).
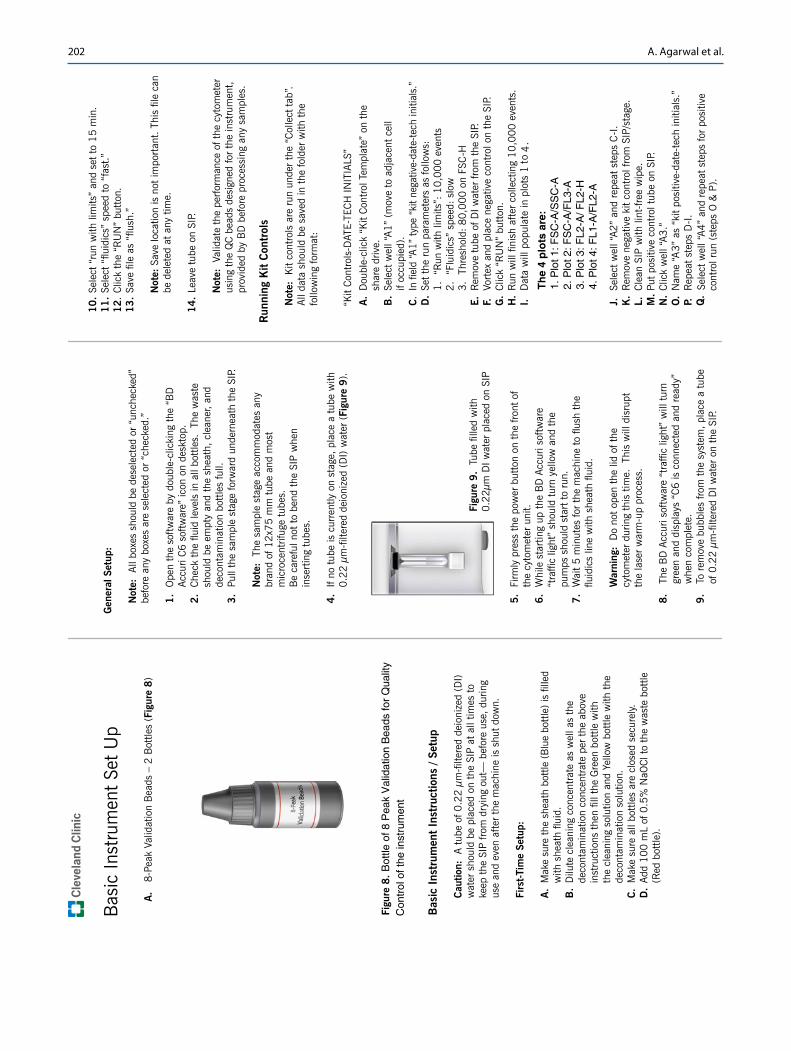
M. 8-peak validation beads—one bottle (Fig. 24.10).
5 Basic Instrument Instructions/Setup
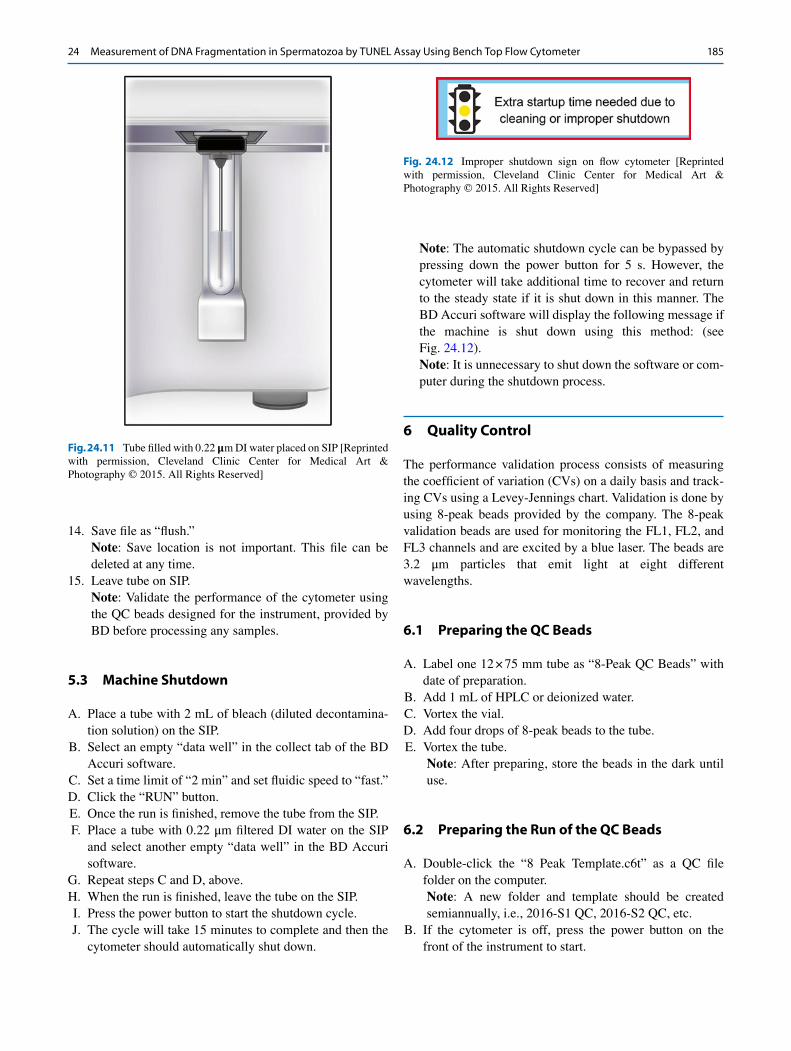
Caution: A tube of 0.22 μm filtered deionized (DI) water must placed on the sheath injection port (SIP) at all times to keep the SIP from drying out—before use, during use, and even after the machine is shut down.
5.1 First-Time Setup
A. Make sure the sheath bottle (blue bottle) is filled with sheath fluid.
B. Dilute cleaning concentrate as well as the decontamina-tion concentrate per the above instructions (B1 and C1) and then fill the green bottle with the cleaning solution and yellow bottle with the decontamination solution.
C. Make sure all bottles are closed securely. D. Add 100 mL of 0.5 % NaOCl to the waste bottle (red
bottle). E. Place the bottles in the fluidic bottle tray. F. Slide the red tab on the black end of the fluidic harness to
the unlock position and attach the black end of the fluidic harness to the back of the cytometer.
G. Slide the red tab to the lock position. H. Attach the other end of the fluidic harness to the appro-
priate bottles:1. Red line—waste bottle.2. Blue line—sheath bottle.3. Yellow line—decontamination bottle.4. Green line—cleaner bottle.
5.2 General Setup
Note: Deselect all boxes in the Collect Tab.
1. Open the software by double-clicking the “BD Accuri C6 software” icon on desktop.
2. Bottles in steps 2–4 above should always be filled as indicated and seated in the fluidic bottle tray.
3. Check the fluid levels in all bottles. The waste bottle must be empty and the sheath, cleaner, and decontami-nation bottles full.
4. Pull the sample stage forward underneath the SIP.Note: The sample stage accommodates any brand of 12 × 75 mm tube and most microcentrifuge tubes. Be careful not to bend or catch the SIP when inserting tubes.
5. If no tube is currently on stage, place a tube with 0.22 μm filtered DI water (Fig. 24.11).
6. Firmly press the power button on the front of the cytom-eter unit.
7. While starting up, the BD Accuri software “traffic light” should turn yellow, and the pumps should start to run.
8. Wait 5 min for the machine to flush the fluidic line with sheath fluid.Warning: Do not open the lid of the cytometer during this time. This will disrupt the laser warm-up process.
9. The BD Accuri software “traffic light” will turn green and display “C6 is connected and ready” when complete.
10. To remove bubbles from the system, place a tube of 0.22 μm filtered DI water on the SIP.
11. Select “run with limits” and set to 15 min. 12. Select “fluidic” speed to “fast.” 13. Click the “RUN” button.
Fig. 24.9 Flow cytometer instrumentation [Reprinted with permis-sion, Cleveland Clinic Center for Medical Art & Photography © 2015. All Rights Reserved]
Fig. 24.10 8-peak Validation Beads bottle [Reprinted with permission, Cleveland Clinic Center for Medical Art & Photography © 2015. All Rights Reserved]
A. Agarwal et al.
185
14. Save file as “flush.”Note: Save location is not important. This file can be deleted at any time.
15. Leave tube on SIP.Note: Validate the performance of the cytometer using the QC beads designed for the instrument, provided by BD before processing any samples.
5.3 Machine Shutdown
A. Place a tube with 2 mL of bleach (diluted decontamina-tion solution) on the SIP.
B. Select an empty “data well” in the collect tab of the BD Accuri software.
C. Set a time limit of “2 min” and set fluidic speed to “fast.” D. Click the “RUN” button. E. Once the run is finished, remove the tube from the SIP. F. Place a tube with 0.22 μm filtered DI water on the SIP
and select another empty “data well” in the BD Accuri software.
G. Repeat steps C and D, above. H. When the run is finished, leave the tube on the SIP. I. Press the power button to start the shutdown cycle. J. The cycle will take 15 minutes to complete and then the
cytometer should automatically shut down.
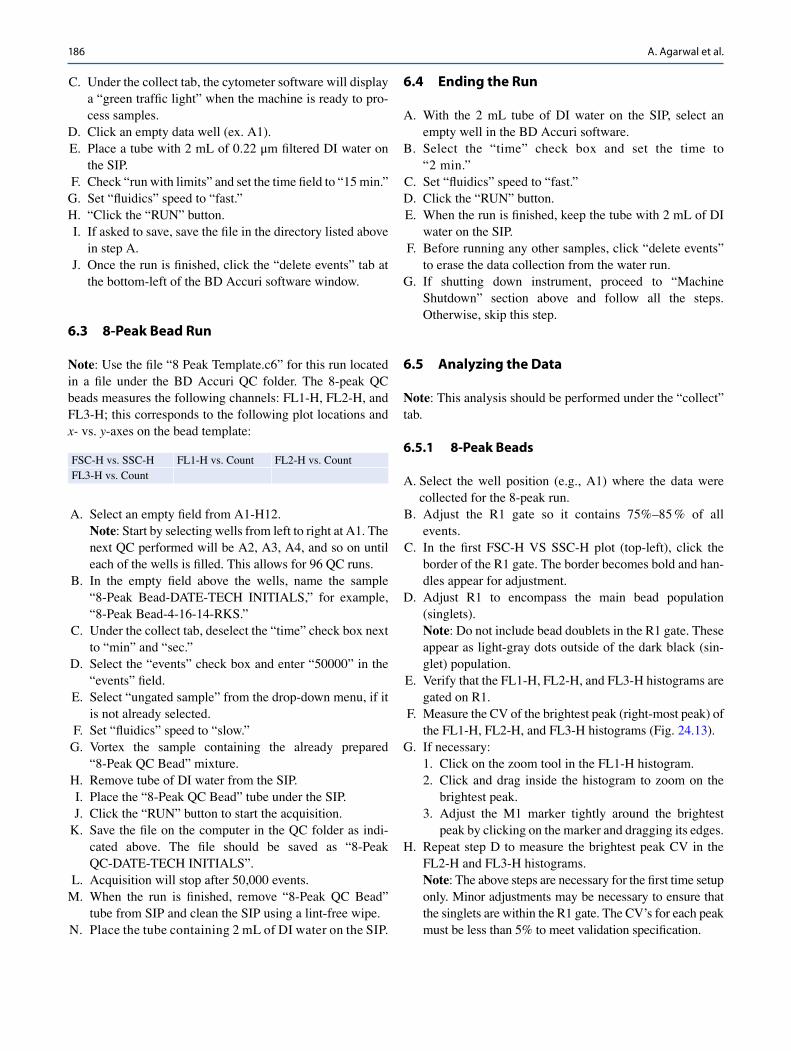
Note: The automatic shutdown cycle can be bypassed by pressing down the power button for 5 s. However, the cytometer will take additional time to recover and return to the steady state if it is shut down in this manner. The BD Accuri software will display the following message if the machine is shut down using this method: (see Fig. 24.12).Note: It is unnecessary to shut down the software or com-
puter during the shutdown process.
6 Quality Control
The performance validation process consists of measuring the coefficient of variation (CVs) on a daily basis and track-ing CVs using a Levey-Jennings chart. Validation is done by using 8-peak beads provided by the company. The 8-peak validation beads are used for monitoring the FL1, FL2, and FL3 channels and are excited by a blue laser. The beads are 3.2 μm particles that emit light at eight different wavelengths.
6.1 Preparing the QC Beads
A. Label one 12 × 75 mm tube as “8-Peak QC Beads” with date of preparation.
B. Add 1 mL of HPLC or deionized water. C. Vortex the vial. D. Add four drops of 8-peak beads to the tube. E. Vortex the tube.
Note: After preparing, store the beads in the dark until use.
6.2 Preparing the Run of the QC Beads
A. Double-click the “8 Peak Template.c6t” as a QC file folder on the computer.Note: A new folder and template should be created semiannually, i.e., 2016-S1 QC, 2016-S2 QC, etc.
B. If the cytometer is off, press the power button on the front of the instrument to start.
Fig. 24.11 Tube filled with 0.22 μm DI water placed on SIP [Reprinted with permission, Cleveland Clinic Center for Medical Art & Photography © 2015. All Rights Reserved]
Fig. 24.12 Improper shutdown sign on flow cytometer [Reprinted with permission, Cleveland Clinic Center for Medical Art & Photography © 2015. All Rights Reserved]
24 Measurement of DNA Fragmentation in Spermatozoa by TUNEL Assay Using Bench Top Flow Cytometer
186
C. Under the collect tab, the cytometer software will display a “green traffic light” when the machine is ready to pro-cess samples.
D. Click an empty data well (ex. A1). E. Place a tube with 2 mL of 0.22 μm filtered DI water on
the SIP. F. Check “run with limits” and set the time field to “15 min.” G. Set “fluidics” speed to “fast.” H. “Click the “RUN” button. I. If asked to save, save the file in the directory listed above
in step A. J. Once the run is finished, click the “delete events” tab at
the bottom-left of the BD Accuri software window.
6.3 8-Peak Bead Run
Note: Use the file “8 Peak Template.c6” for this run located
in a file under the BD Accuri QC folder. The 8-peak QC beads measures the following channels: FL1-H, FL2-H, and FL3-H; this corresponds to the following plot locations and x- vs. y-axes on the bead template:
FSC-H vs. SSC-H FL1-H vs. Count FL2-H vs. Count
FL3-H vs. Count
A. Select an empty field from A1-H12.Note: Start by selecting wells from left to right at A1. The next QC performed will be A2, A3, A4, and so on until each of the wells is filled. This allows for 96 QC runs.
B. In the empty field above the wells, name the sample “8-Peak Bead-DATE-TECH INITIALS,” for example, “8-Peak Bead-4-16-14-RKS.”
C. Under the collect tab, deselect the “time” check box next to “min” and “sec.”
D. Select the “events” check box and enter “50000” in the “events” field.
E. Select “ungated sample” from the drop-down menu, if it is not already selected.
F. Set “fluidics” speed to “slow.” G. Vortex the sample containing the already prepared
“8-Peak QC Bead” mixture. H. Remove tube of DI water from the SIP. I. Place the “8-Peak QC Bead” tube under the SIP. J. Click the “RUN” button to start the acquisition. K. Save the file on the computer in the QC folder as indi-
cated above. The file should be saved as “8-Peak QC-DATE-TECH INITIALS”.
L. Acquisition will stop after 50,000 events. M. When the run is finished, remove “8-Peak QC Bead”
tube from SIP and clean the SIP using a lint-free wipe. N. Place the tube containing 2 mL of DI water on the SIP.
6.4 Ending the Run
A. With the 2 mL tube of DI water on the SIP, select an empty well in the BD Accuri software.
B. Select the “time” check box and set the time to “2 min.”
C. Set “fluidics” speed to “fast.” D. Click the “RUN” button. E. When the run is finished, keep the tube with 2 mL of DI
water on the SIP. F. Before running any other samples, click “delete events”
to erase the data collection from the water run. G. If shutting down instrument, proceed to “Machine
Shutdown” section above and follow all the steps. Otherwise, skip this step.
6.5 Analyzing the Data
Note: This analysis should be performed under the “collect” tab.
6.5.1 8-Peak Beads
A. Select the well position (e.g., A1) where the data were collected for the 8-peak run.
B. Adjust the R1 gate so it contains 75%–85 % of all events.
C. In the first FSC-H VS SSC-H plot (top-left), click the border of the R1 gate. The border becomes bold and han-dles appear for adjustment.
D. Adjust R1 to encompass the main bead population (singlets).Note: Do not include bead doublets in the R1 gate. These appear as light-gray dots outside of the dark black (sin-glet) population.
E. Verify that the FL1-H, FL2-H, and FL3-H histograms are gated on R1.
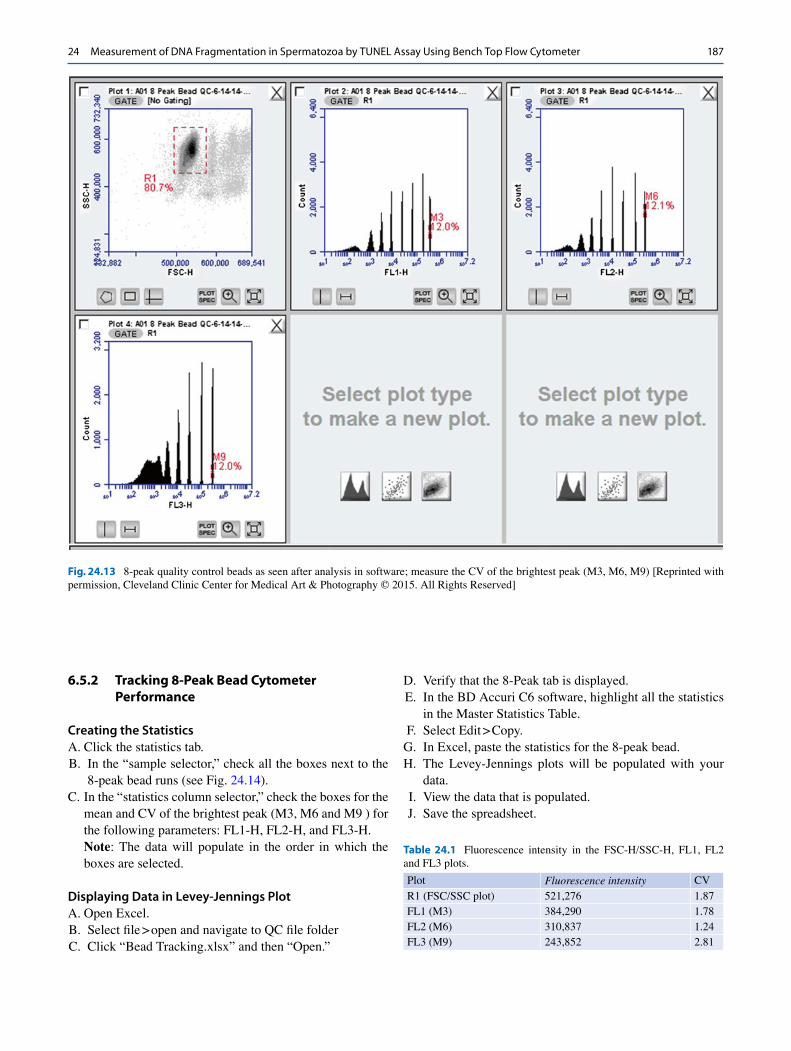
F. Measure the CV of the brightest peak (right-most peak) of the FL1-H, FL2-H, and FL3-H histograms (Fig. 24.13).
G. If necessary: 1. Click on the zoom tool in the FL1-H histogram. 2. Click and drag inside the histogram to zoom on the
brightest peak. 3. Adjust the M1 marker tightly around the brightest
peak by clicking on the marker and dragging its edges. H. Repeat step D to measure the brightest peak CV in the
FL2-H and FL3-H histograms.Note: The above steps are necessary for the first time setup only. Minor adjustments may be necessary to ensure that the singlets are within the R1 gate. The CV’s for each peak must be less than 5% to meet validation specification.
A. Agarwal et al.
187
6.5.2 Tracking 8-Peak Bead Cytometer Performance
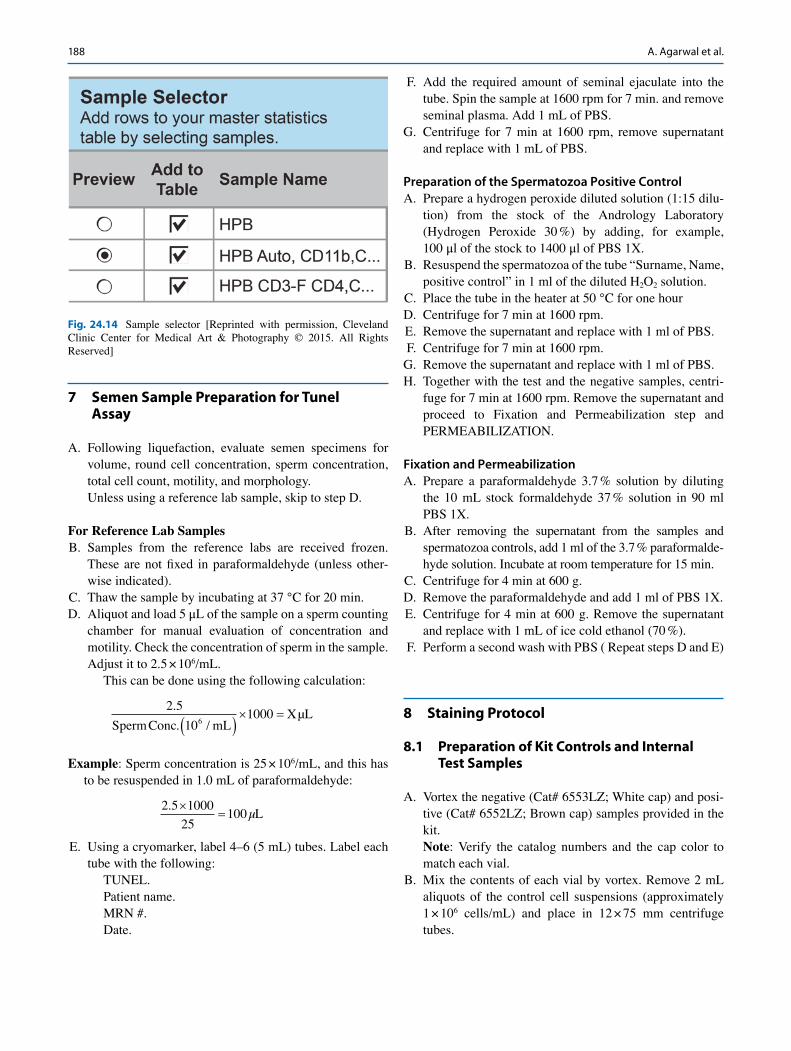
Creating the Statistics A. Click the statistics tab. B. In the “sample selector,” check all the boxes next to the
8-peak bead runs (see Fig. 24.14). C. In the “statistics column selector,” check the boxes for the
mean and CV of the brightest peak (M3, M6 and M9 ) for the following parameters: FL1-H, FL2-H, and FL3-H.Note: The data will populate in the order in which the boxes are selected.
Displaying Data in Levey-Jennings Plot A. Open Excel. B. Select file > open and navigate to QC file folder C. Click “Bead Tracking.xlsx” and then “Open.”
D. Verify that the 8-Peak tab is displayed. E. In the BD Accuri C6 software, highlight all the statistics
in the Master Statistics Table. F. Select Edit > Copy. G. In Excel, paste the statistics for the 8-peak bead. H. The Levey-Jennings plots will be populated with your
data. I. View the data that is populated. J. Save the spreadsheet.
Fig. 24.13 8-peak quality control beads as seen after analysis in software; measure the CV of the brightest peak (M3, M6, M9) [Reprinted with permission, Cleveland Clinic Center for Medical Art & Photography © 2015. All Rights Reserved]
Table 24.1 Fluorescence intensity in the FSC-H/SSC-H, FL1, FL2 and FL3 plots.
Plot Fluorescence intensity CV
R1 (FSC/SSC plot) 521,276 1.87
FL1 (M3) 384,290 1.78
FL2 (M6) 310,837 1.24
FL3 (M9) 243,852 2.81
24 Measurement of DNA Fragmentation in Spermatozoa by TUNEL Assay Using Bench Top Flow Cytometer
188
7 Semen Sample Preparation for Tunel Assay
A. Following liquefaction, evaluate semen specimens for volume, round cell concentration, sperm concentration, total cell count, motility, and morphology.
Unless using a reference lab sample, skip to step D.
For Reference Lab Samples B. Samples from the reference labs are received frozen.
These are not fixed in paraformaldehyde (unless other-wise indicated).
C. Thaw the sample by incubating at 37 °C for 20 min. D. Aliquot and load 5 μL of the sample on a sperm counting
chamber for manual evaluation of concentration and motility. Check the concentration of sperm in the sample. Adjust it to 2.5 × 10⁶/mL.
This can be done using the following calculation:
2 5
101000
6
.
. /SpermConc mLX L
( )× = µ
Example: Sperm concentration is 25 × 106/mL, and this has to be resuspended in 1.0 mL of paraformaldehyde:
2 5 1000
25100
. ×= µL
E. Using a cryomarker, label 4–6 (5 mL) tubes. Label each tube with the following:
TUNEL.Patient name.MRN #.Date.
F. Add the required amount of seminal ejaculate into the tube. Spin the sample at 1600 rpm for 7 min. and remove seminal plasma. Add 1 mL of PBS.
G. Centrifuge for 7 min at 1600 rpm, remove supernatant and replace with 1 mL of PBS.
Preparation of the Spermatozoa Positive Control A. Prepare a hydrogen peroxide diluted solution (1:15 dilu-
tion) from the stock of the Andrology Laboratory (Hydrogen Peroxide 30 %) by adding, for example, 100 μl of the stock to 1400 μl of PBS 1X.
B. Resuspend the spermatozoa of the tube “Surname, Name, positive control” in 1 ml of the diluted H2O2 solution.
C. Place the tube in the heater at 50 °C for one hour D. Centrifuge for 7 min at 1600 rpm. E. Remove the supernatant and replace with 1 ml of PBS. F. Centrifuge for 7 min at 1600 rpm. G. Remove the supernatant and replace with 1 ml of PBS.
H. Together with the test and the negative samples, centri-fuge for 7 min at 1600 rpm. Remove the supernatant and proceed to Fixation and Permeabilization step and PERMEABILIZATION.
Fixation and Permeabilization A. Prepare a paraformaldehyde 3.7 % solution by diluting
the 10 mL stock formaldehyde 37 % solution in 90 ml PBS 1X.
B. After removing the supernatant from the samples and spermatozoa controls, add 1 ml of the 3.7 % paraformalde-hyde solution. Incubate at room temperature for 15 min.
C. Centrifuge for 4 min at 600 g. D. Remove the paraformaldehyde and add 1 ml of PBS 1X. E. Centrifuge for 4 min at 600 g. Remove the supernatant
and replace with 1 mL of ice cold ethanol (70 %). F. Perform a second wash with PBS ( Repeat steps D and E)
8 Staining Protocol
8.1 Preparation of Kit Controls and Internal Test Samples
A. Vortex the negative (Cat# 6553LZ; White cap) and posi-tive (Cat# 6552LZ; Brown cap) samples provided in the kit.Note: Verify the catalog numbers and the cap color to match each vial.
B. Mix the contents of each vial by vortex. Remove 2 mL aliquots of the control cell suspensions (approximately 1 × 10⁶ cells/mL) and place in 12 × 75 mm centrifuge tubes.
Fig. 24.14 Sample selector [Reprinted with permission, Cleveland Clinic Center for Medical Art & Photography © 2015. All Rights Reserved]
A. Agarwal et al.
189
C. Return the vials to −20 °C. D. Include 3–4 samples with known DNA damage along
with the kit controls. E. Centrifuge at 1600 rpm for 7 min and discard the
supernatant. F. Centrifuge the control cell suspensions for 5 min at 1600
RPM and remove the 70 % (v/v) ethanol by aspiration, being careful to not disturb the cell pellet.
G. To the control and test samples, add 1.0 mL of “Wash Buffer” (6548AZ) (blue cap) and vortex. Centrifuge as before and discard the supernatant.
H. Repeat the “Wash Buffer” treatment. Centrifuge and dis-card the supernatant.
I. Number the tubes consecutively beginning with negative and positive kit controls, test samples, and internal controls.
9 Staining for TUNEL Assay
A. Check the number of tubes that will be required for the TUNEL assay. It is helpful to prepare the stain for addi-tional 5–7 tubes.
B. Remove the reaction buffer (green cap) from 4 °C and the TdT (yellow cap) and FITC-dUTP (orange cap) from −20 °C and place them at room temperature for 20 min to thaw.Note: Give a quick spin to the TdT vial to bring the reagent to the bottom of the vial.
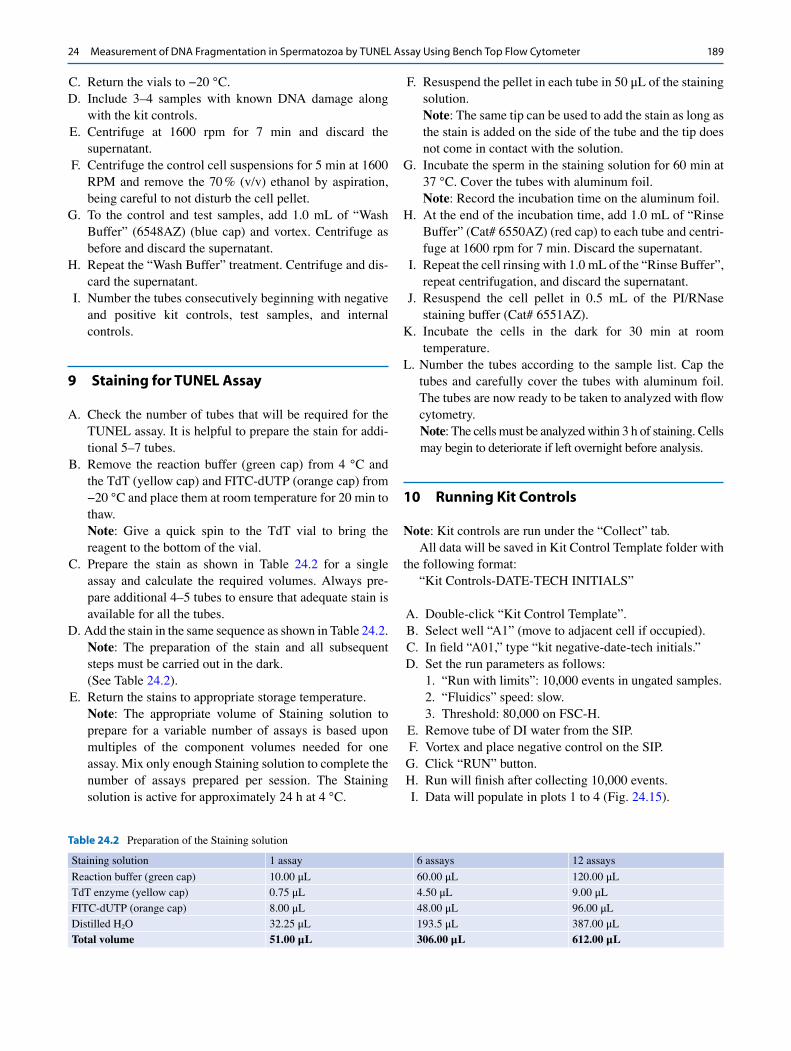
C. Prepare the stain as shown in Table 24.2 for a single assay and calculate the required volumes. Always pre-pare additional 4–5 tubes to ensure that adequate stain is available for all the tubes.
D. Add the stain in the same sequence as shown in Table 24.2.Note: The preparation of the stain and all subsequent steps must be carried out in the dark.(See Table 24.2).
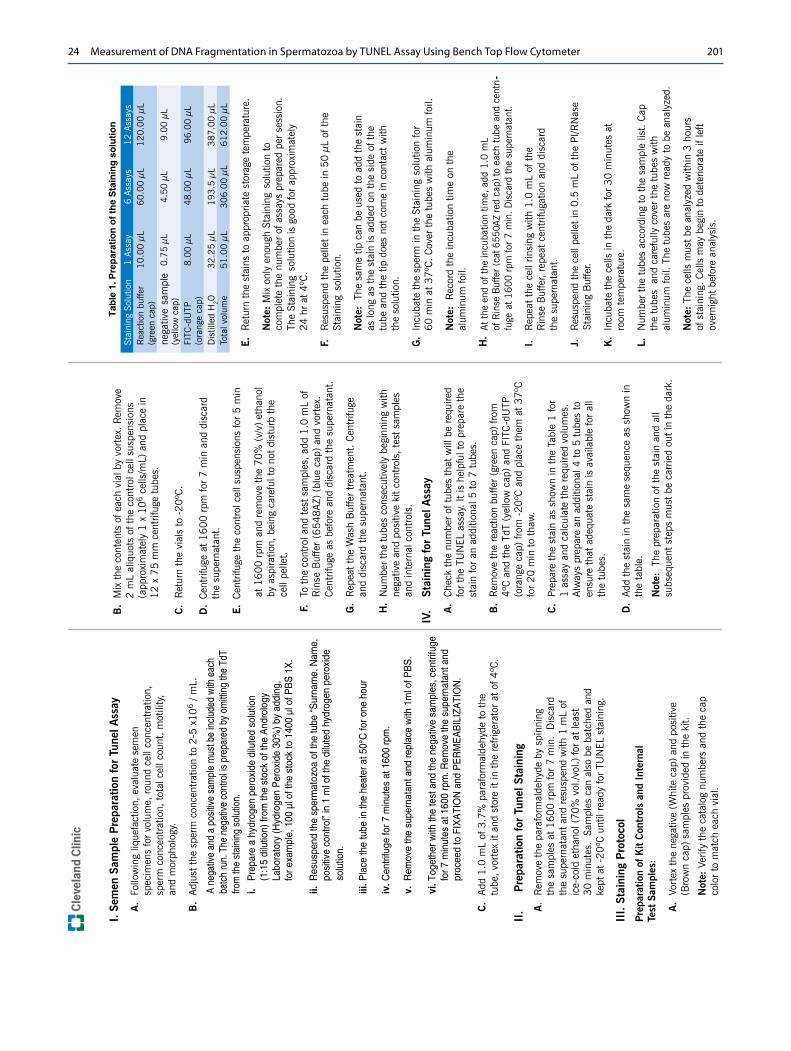
E. Return the stains to appropriate storage temperature.Note: The appropriate volume of Staining solution to prepare for a variable number of assays is based upon multiples of the component volumes needed for one assay. Mix only enough Staining solution to complete the number of assays prepared per session. The Staining solution is active for approximately 24 h at 4 °C.
F. Resuspend the pellet in each tube in 50 μL of the staining solution.Note: The same tip can be used to add the stain as long as the stain is added on the side of the tube and the tip does not come in contact with the solution.
G. Incubate the sperm in the staining solution for 60 min at 37 °C. Cover the tubes with aluminum foil.Note: Record the incubation time on the aluminum foil.
H. At the end of the incubation time, add 1.0 mL of “Rinse Buffer” (Cat# 6550AZ) (red cap) to each tube and centri-fuge at 1600 rpm for 7 min. Discard the supernatant.
I. Repeat the cell rinsing with 1.0 mL of the “Rinse Buffer”, repeat centrifugation, and discard the supernatant.
J. Resuspend the cell pellet in 0.5 mL of the PI/RNase staining buffer (Cat# 6551AZ).
K. Incubate the cells in the dark for 30 min at room temperature.
L. Number the tubes according to the sample list. Cap the
tubes and carefully cover the tubes with aluminum foil. The tubes are now ready to be taken to analyzed with flow cytometry.Note: The cells must be analyzed within 3 h of staining. Cells may begin to deteriorate if left overnight before analysis.
10 Running Kit Controls
Note: Kit controls are run under the “Collect” tab.All data will be saved in Kit Control Template folder with
the following format:“Kit Controls-DATE-TECH INITIALS”
A. Double-click “Kit Control Template”. B. Select well “A1” (move to adjacent cell if occupied). C. In field “A01,” type “kit negative-date-tech initials.” D. Set the run parameters as follows:
1. “Run with limits”: 10,000 events in ungated samples. 2. “Fluidics” speed: slow. 3. Threshold: 80,000 on FSC-H.
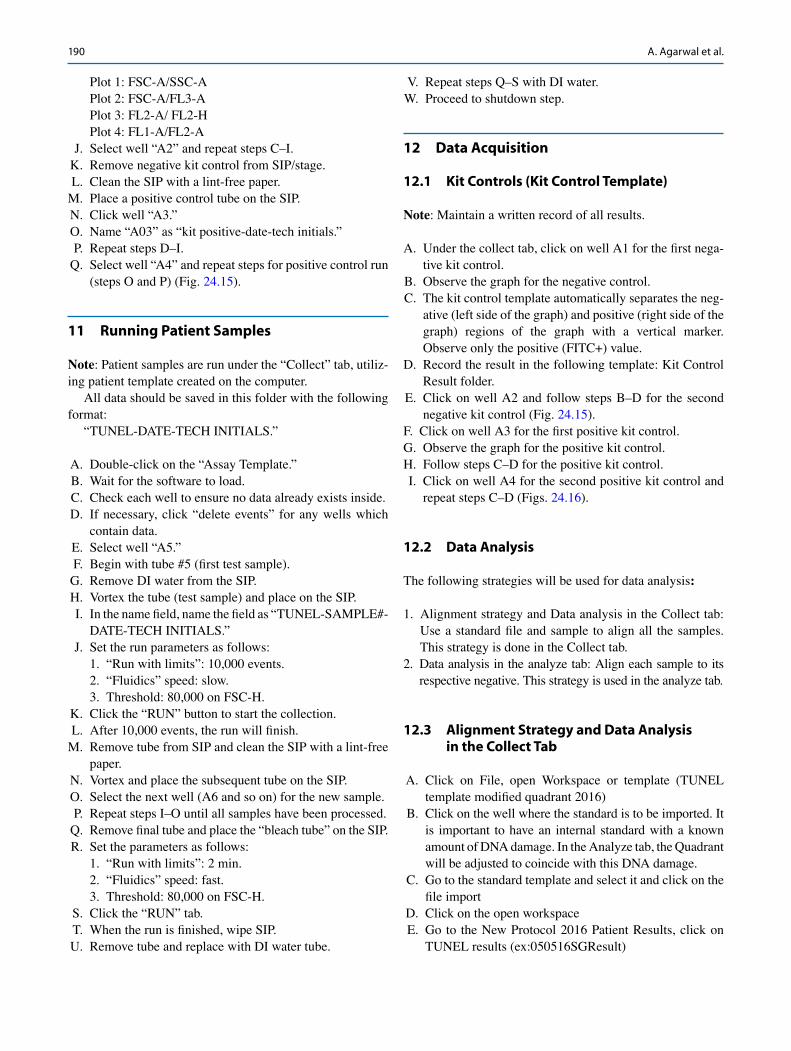
E. Remove tube of DI water from the SIP. F. Vortex and place negative control on the SIP. G. Click “RUN” button. H. Run will finish after collecting 10,000 events. I. Data will populate in plots 1 to 4 (Fig. 24.15).
Table 24.2 Preparation of the Staining solution
Staining solution 1 assay 6 assays 12 assays
Reaction buffer (green cap) 10.00 μL 60.00 μL 120.00 μL
TdT enzyme (yellow cap) 0.75 μL 4.50 μL 9.00 μL
FITC-dUTP (orange cap) 8.00 μL 48.00 μL 96.00 μL
Distilled H2O 32.25 μL 193.5 μL 387.00 μL
Total volume 51.00 μL 306.00 μL 612.00 μL
24 Measurement of DNA Fragmentation in Spermatozoa by TUNEL Assay Using Bench Top Flow Cytometer
190
Plot 1: FSC-A/SSC-APlot 2: FSC-A/FL3-APlot 3: FL2-A/ FL2-HPlot 4: FL1-A/FL2-A
J. Select well “A2” and repeat steps C–I. K. Remove negative kit control from SIP/stage. L. Clean the SIP with a lint-free paper. M. Place a positive control tube on the SIP. N. Click well “A3.” O. Name “A03” as “kit positive-date-tech initials.” P. Repeat steps D–I. Q. Select well “A4” and repeat steps for positive control run
(steps O and P) (Fig. 24.15).
11 Running Patient Samples
Note: Patient samples are run under the “Collect” tab, utiliz-
ing patient template created on the computer.All data should be saved in this folder with the following
format:“TUNEL-DATE-TECH INITIALS.”
A. Double-click on the “Assay Template.” B. Wait for the software to load. C. Check each well to ensure no data already exists inside. D. If necessary, click “delete events” for any wells which
contain data. E. Select well “A5.” F. Begin with tube #5 (first test sample). G. Remove DI water from the SIP. H. Vortex the tube (test sample) and place on the SIP. I. In the name field, name the field as “TUNEL-SAMPLE#-
DATE-TECH INITIALS.” J. Set the run parameters as follows:
1. “Run with limits”: 10,000 events. 2. “Fluidics” speed: slow. 3. Threshold: 80,000 on FSC-H.
K. Click the “RUN” button to start the collection. L. After 10,000 events, the run will finish. M. Remove tube from SIP and clean the SIP with a lint-free
paper. N. Vortex and place the subsequent tube on the SIP. O. Select the next well (A6 and so on) for the new sample. P. Repeat steps I–O until all samples have been processed. Q. Remove final tube and place the “bleach tube” on the SIP. R. Set the parameters as follows:
1. “Run with limits”: 2 min. 2. “Fluidics” speed: fast. 3. Threshold: 80,000 on FSC-H.
S. Click the “RUN” tab. T. When the run is finished, wipe SIP. U. Remove tube and replace with DI water tube.
V. Repeat steps Q–S with DI water. W. Proceed to shutdown step.
12 Data Acquisition
12.1 Kit Controls (Kit Control Template)
Note: Maintain a written record of all results.
A. Under the collect tab, click on well A1 for the first nega-tive kit control.
B. Observe the graph for the negative control. C. The kit control template automatically separates the neg-
ative (left side of the graph) and positive (right side of the graph) regions of the graph with a vertical marker. Observe only the positive (FITC+) value.
D. Record the result in the following template: Kit Control
Result folder. E. Click on well A2 and follow steps B–D for the second
negative kit control (Fig. 24.15). F. Click on well A3 for the first positive kit control. G. Observe the graph for the positive kit control. H. Follow steps C–D for the positive kit control. I. Click on well A4 for the second positive kit control and
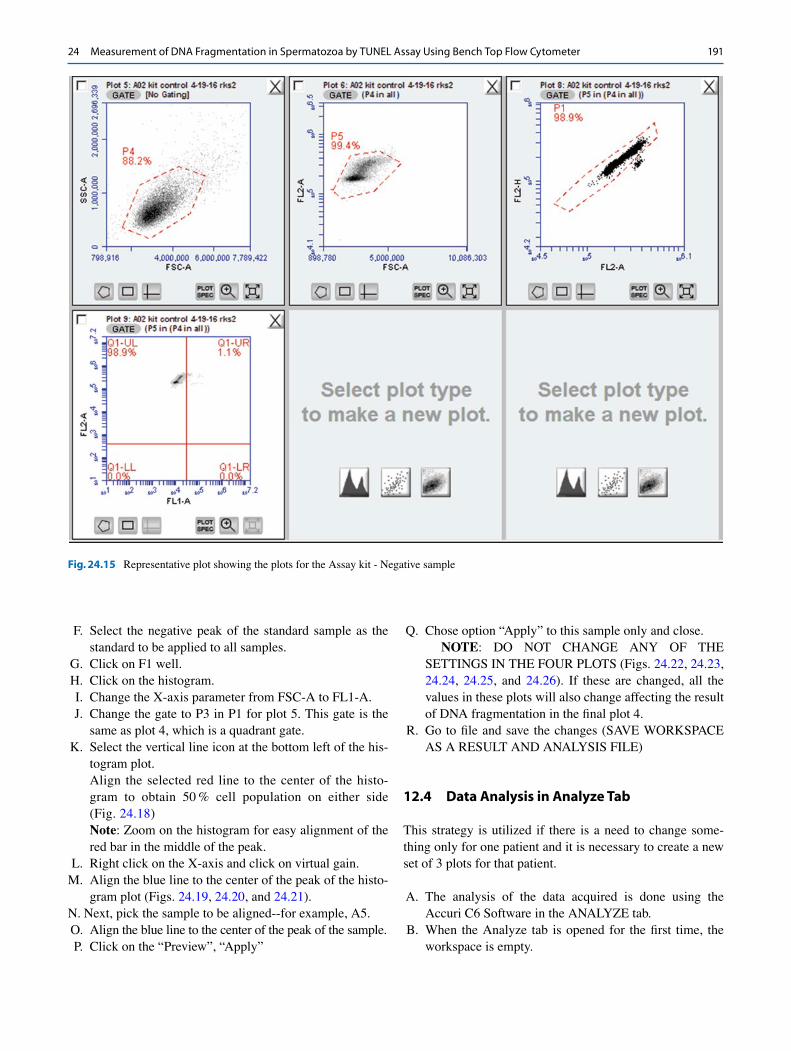
repeat steps C–D (Figs. 24.16).
12.2 Data Analysis
The following strategies will be used for data analysis:
1. Alignment strategy and Data analysis in the Collect tab: Use a standard file and sample to align all the samples. This strategy is done in the Collect tab.
2. Data analysis in the analyze tab: Align each sample to its respective negative. This strategy is used in the analyze tab.
12.3 Alignment Strategy and Data Analysis in the Collect Tab
A. Click on File, open Workspace or template (TUNEL template modified quadrant 2016)
B. Click on the well where the standard is to be imported. It is important to have an internal standard with a known amount of DNA damage. In the Analyze tab, the Quadrant will be adjusted to coincide with this DNA damage.
C. Go to the standard template and select it and click on the file import
D. Click on the open workspace E. Go to the New Protocol 2016 Patient Results, click on
TUNEL results (ex:050516SGResult)
A. Agarwal et al.
191
F. Select the negative peak of the standard sample as the standard to be applied to all samples.
G. Click on F1 well. H. Click on the histogram. I. Change the X-axis parameter from FSC-A to FL1-A. J. Change the gate to P3 in P1 for plot 5. This gate is the
same as plot 4, which is a quadrant gate. K. Select the vertical line icon at the bottom left of the his-
togram plot.Align the selected red line to the center of the histo-gram to obtain 50 % cell population on either side (Fig. 24.18)Note: Zoom on the histogram for easy alignment of the red bar in the middle of the peak.
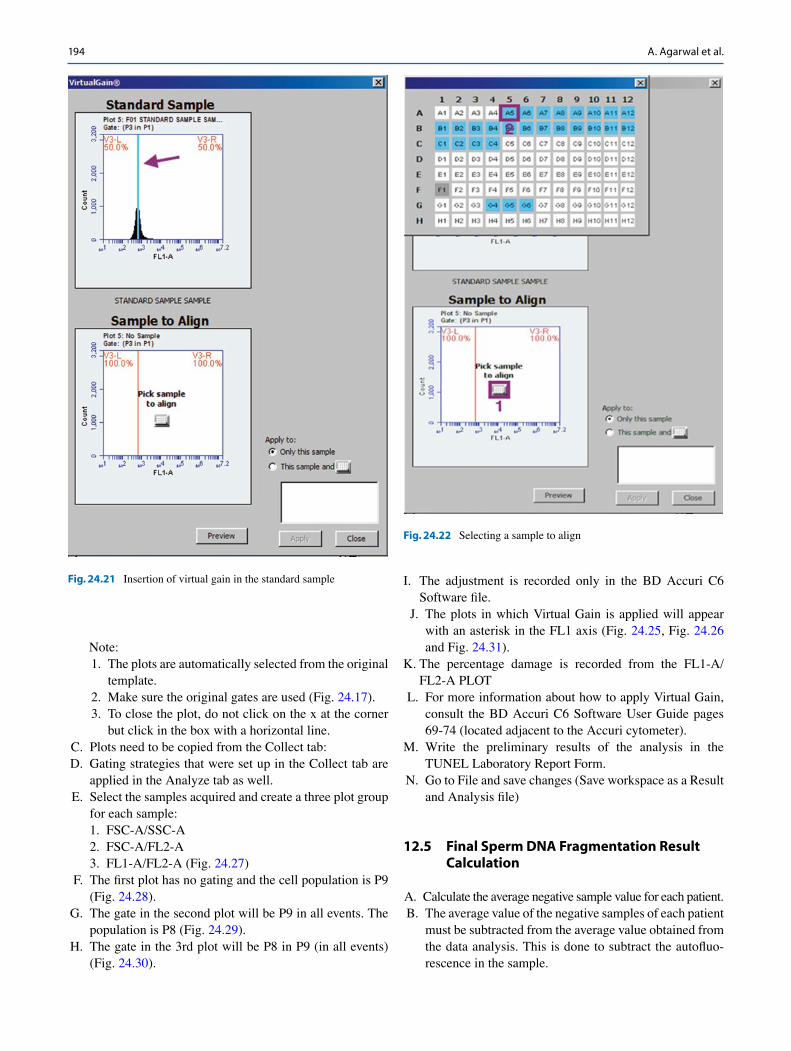
L. Right click on the X-axis and click on virtual gain. M. Align the blue line to the center of the peak of the histo-
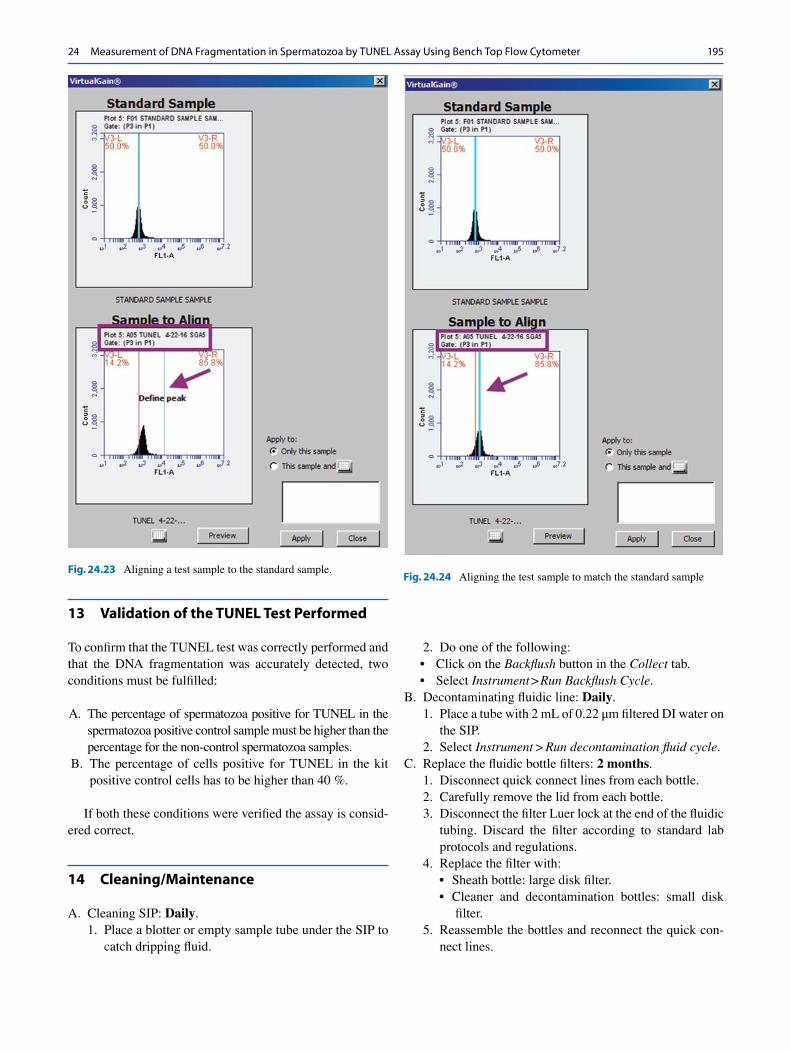
gram plot (Figs. 24.19, 24.20, and 24.21). N. Next, pick the sample to be aligned--for example, A5. O. Align the blue line to the center of the peak of the sample. P. Click on the “Preview”, “Apply”
Q. Chose option “Apply” to this sample only and close.NOTE: DO NOT CHANGE ANY OF THE
SETTINGS IN THE FOUR PLOTS (Figs. 24.22, 24.23, 24.24, 24.25, and 24.26). If these are changed, all the values in these plots will also change affecting the result of DNA fragmentation in the final plot 4.
R. Go to file and save the changes (SAVE WORKSPACE AS A RESULT AND ANALYSIS FILE)
12.4 Data Analysis in Analyze Tab
This strategy is utilized if there is a need to change some-thing only for one patient and it is necessary to create a new set of 3 plots for that patient.
A. The analysis of the data acquired is done using the Accuri C6 Software in the ANALYZE tab.
B. When the Analyze tab is opened for the first time, the workspace is empty.
Fig. 24.15 Representative plot showing the plots for the Assay kit - Negative sample
24 Measurement of DNA Fragmentation in Spermatozoa by TUNEL Assay Using Bench Top Flow Cytometer
192
Fig. 24.16 Representative figure showing the plots for the Assay kit - Positive sample
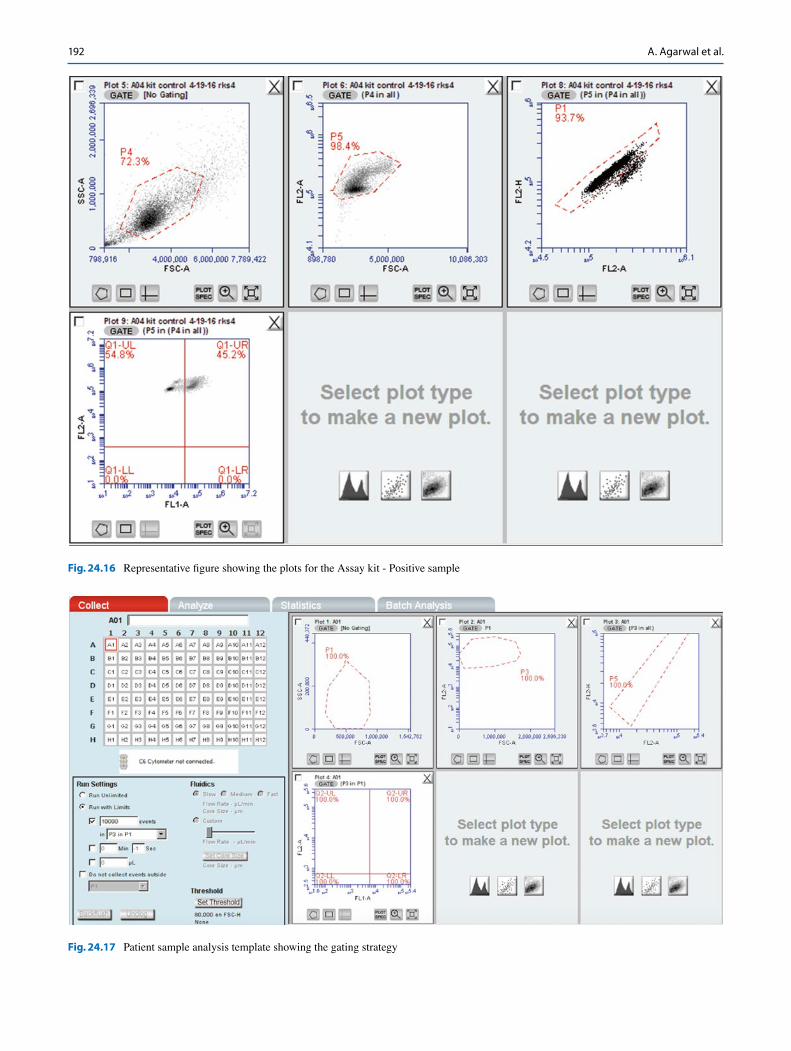
Fig. 24.17 Patient sample analysis template showing the gating strategy
A. Agarwal et al.
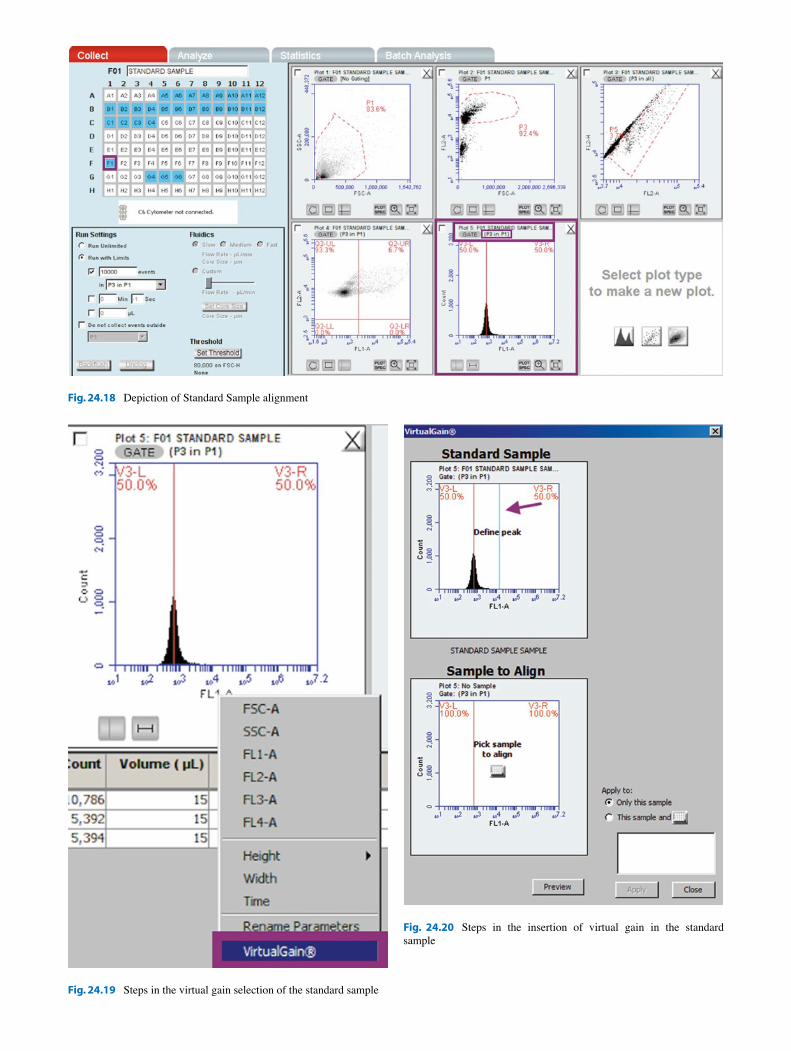
Fig. 24.18 Depiction of Standard Sample alignment
Fig. 24.19 Steps in the virtual gain selection of the standard sample
Fig. 24.20 Steps in the insertion of virtual gain in the standard sample
194
Note: 1. The plots are automatically selected from the original
template. 2. Make sure the original gates are used (Fig. 24.17). 3. To close the plot, do not click on the x at the corner
but click in the box with a horizontal line. C. Plots need to be copied from the Collect tab: D. Gating strategies that were set up in the Collect tab are
applied in the Analyze tab as well. E. Select the samples acquired and create a three plot group
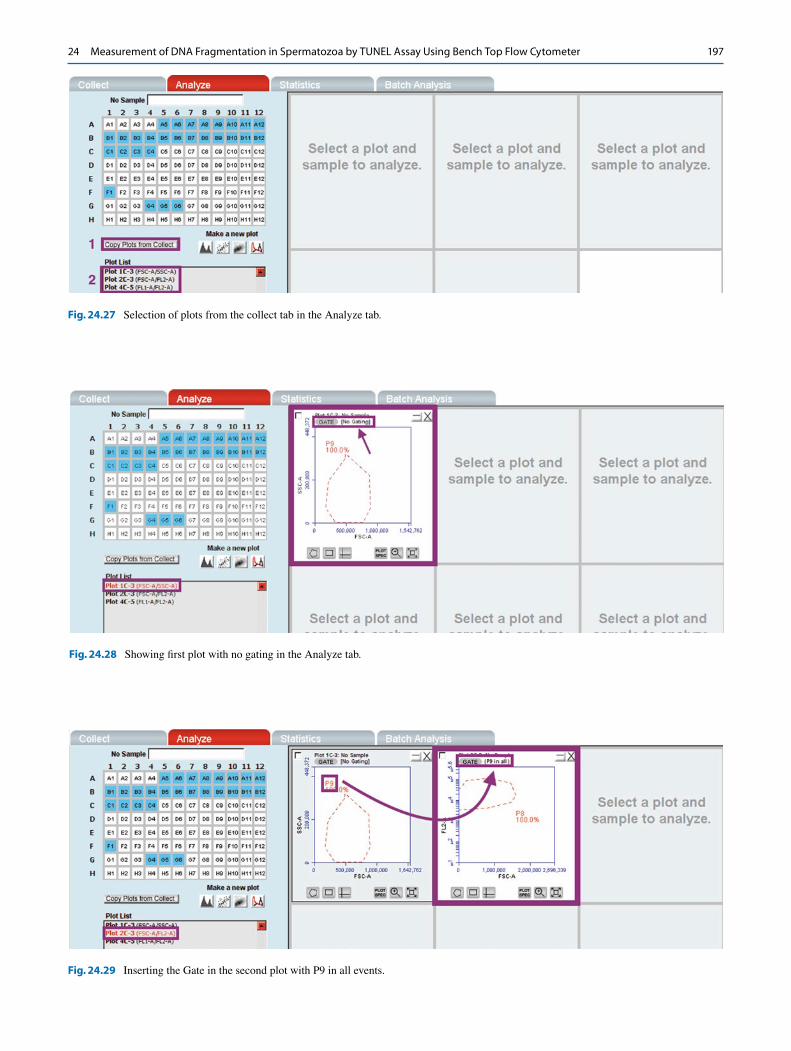
for each sample: 1. FSC-A/SSC-A 2. FSC-A/FL2-A 3. FL1-A/FL2-A (Fig. 24.27)
F. The first plot has no gating and the cell population is P9 (Fig. 24.28).
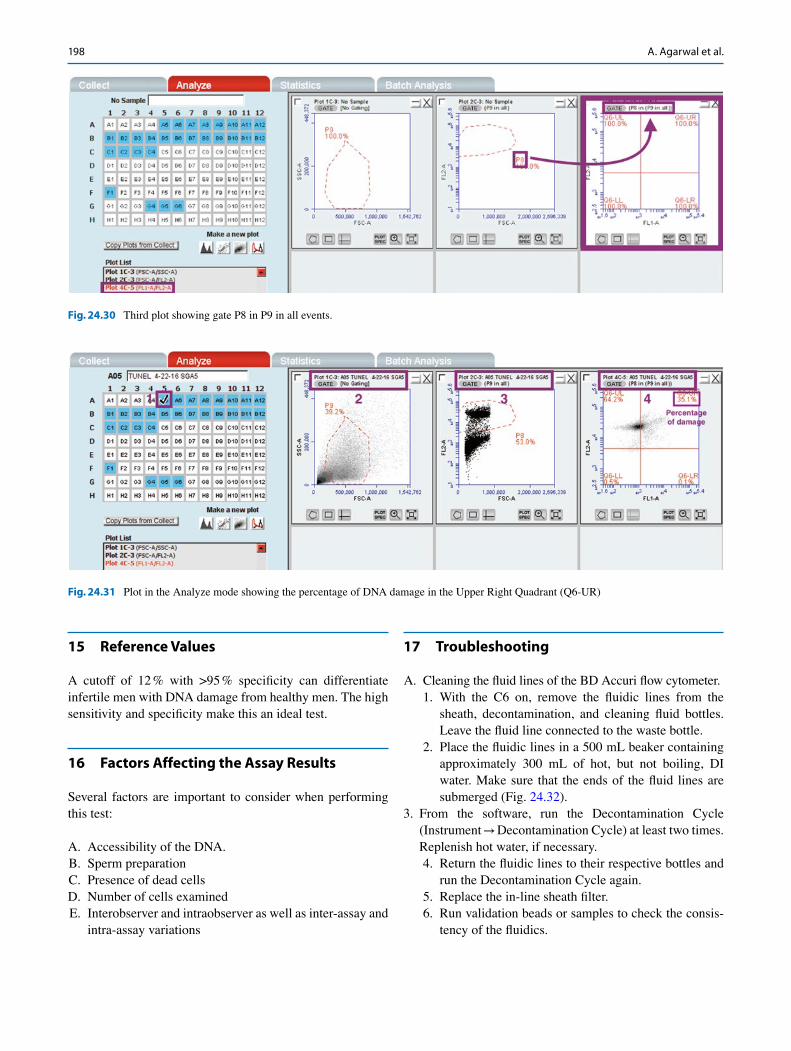
G. The gate in the second plot will be P9 in all events. The population is P8 (Fig. 24.29).
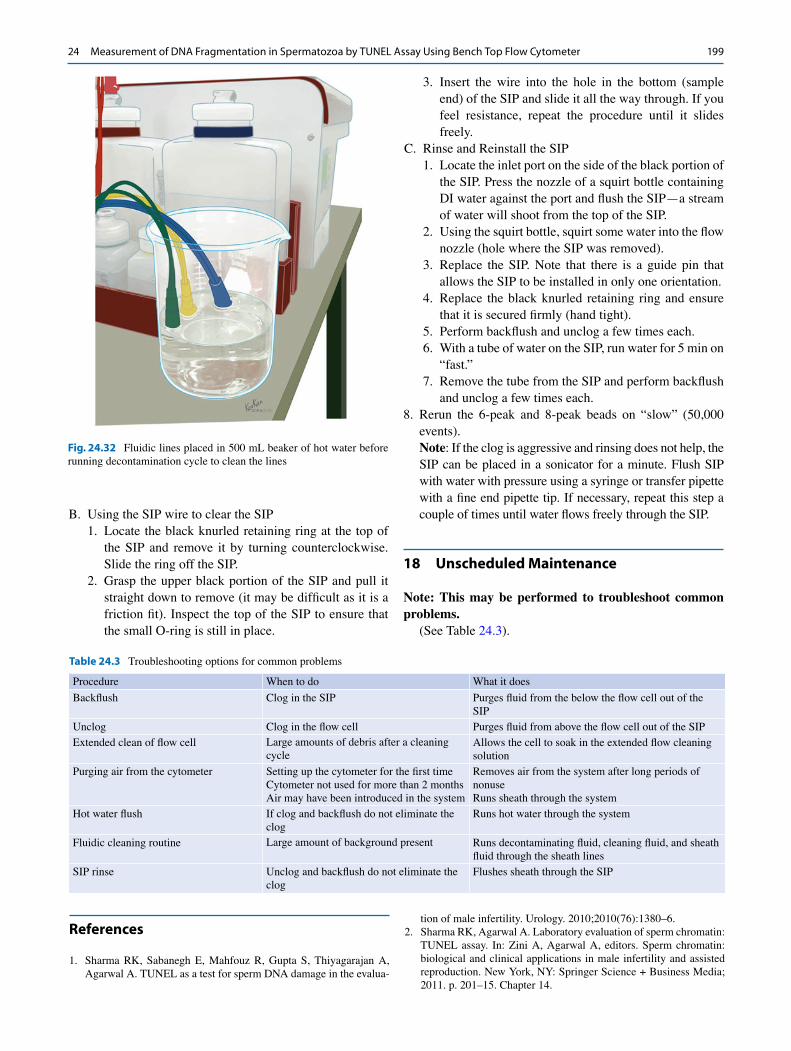
H. The gate in the 3rd plot will be P8 in P9 (in all events) (Fig. 24.30).
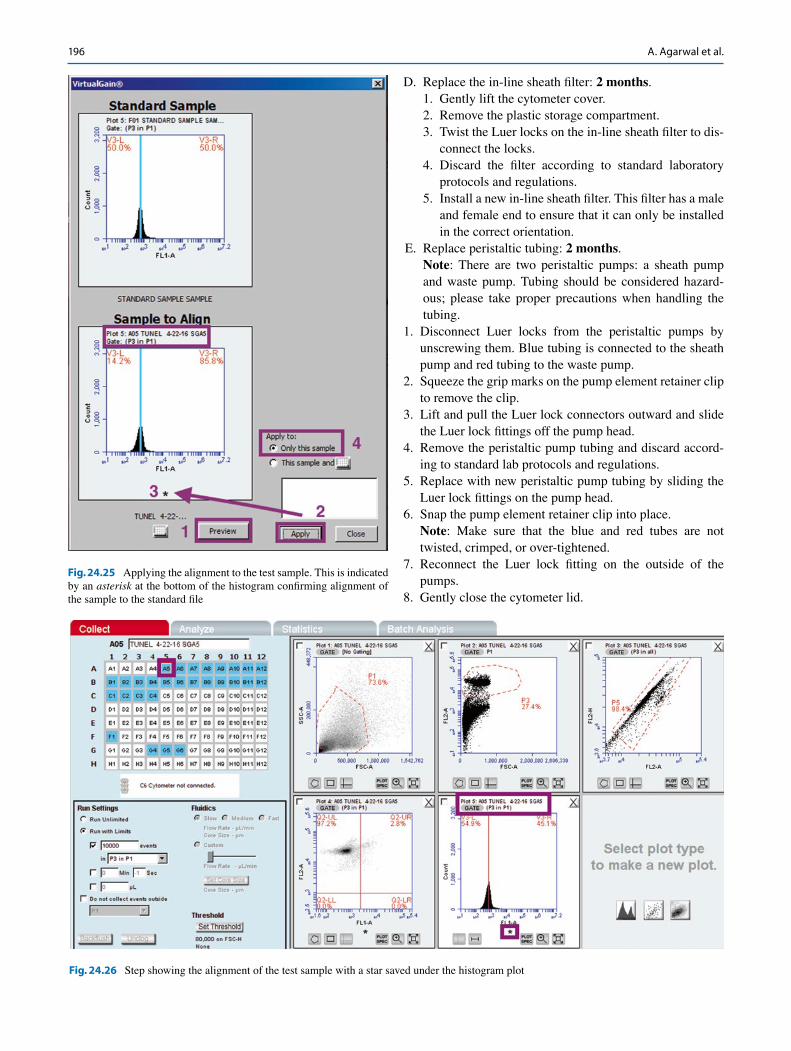
I. The adjustment is recorded only in the BD Accuri C6 Software file.
J. The plots in which Virtual Gain is applied will appear with an asterisk in the FL1 axis (Fig. 24.25, Fig. 24.26 and Fig. 24.31).
K. The percentage damage is recorded from the FL1-A/FL2-A PLOT
L. For more information about how to apply Virtual Gain, consult the BD Accuri C6 Software User Guide pages 69-74 (located adjacent to the Accuri cytometer).
M. Write the preliminary results of the analysis in the TUNEL Laboratory Report Form.
N. Go to File and save changes (Save workspace as a Result and Analysis file)
12.5 Final Sperm DNA Fragmentation Result Calculation
A. Calculate the average negative sample value for each patient. B. The average value of the negative samples of each patient
must be subtracted from the average value obtained from the data analysis. This is done to subtract the autofluo-rescence in the sample.
Fig. 24.21 Insertion of virtual gain in the standard sample
Fig. 24.22 Selecting a sample to align
A. Agarwal et al.
195
13 Validation of the TUNEL Test Performed
To confirm that the TUNEL test was correctly performed and that the DNA fragmentation was accurately detected, two conditions must be fulfilled:
A. The percentage of spermatozoa positive for TUNEL in the spermatozoa positive control sample must be higher than the percentage for the non-control spermatozoa samples.
B. The percentage of cells positive for TUNEL in the kit positive control cells has to be higher than 40 %.
If both these conditions were verified the assay is consid-ered correct.
14 Cleaning/Maintenance
A. Cleaning SIP: Daily. 1. Place a blotter or empty sample tube under the SIP to
catch dripping fluid.
2. Do one of the following:• Click on the Backflush button in the Collect tab.• Select Instrument > Run Backflush Cycle.
B. Decontaminating fluidic line: Daily. 1. Place a tube with 2 mL of 0.22 μm filtered DI water on
the SIP. 2. Select Instrument > Run decontamination fluid cycle.
C. Replace the fluidic bottle filters: 2 months. 1. Disconnect quick connect lines from each bottle. 2. Carefully remove the lid from each bottle. 3. Disconnect the filter Luer lock at the end of the fluidic
tubing. Discard the filter according to standard lab protocols and regulations.
4. Replace the filter with:• Sheath bottle: large disk filter.• Cleaner and decontamination bottles: small disk
filter. 5. Reassemble the bottles and reconnect the quick con-
nect lines.
Fig. 24.23 Aligning a test sample to the standard sample.Fig. 24.24 Aligning the test sample to match the standard sample
24 Measurement of DNA Fragmentation in Spermatozoa by TUNEL Assay Using Bench Top Flow Cytometer
196
D. Replace the in-line sheath filter: 2 months. 1. Gently lift the cytometer cover. 2. Remove the plastic storage compartment. 3. Twist the Luer locks on the in-line sheath filter to dis-
connect the locks. 4. Discard the filter according to standard laboratory
protocols and regulations. 5. Install a new in-line sheath filter. This filter has a male
and female end to ensure that it can only be installed in the correct orientation.
E. Replace peristaltic tubing: 2 months.Note: There are two peristaltic pumps: a sheath pump and waste pump. Tubing should be considered hazard-ous; please take proper precautions when handling the tubing.
1. Disconnect Luer locks from the peristaltic pumps by unscrewing them. Blue tubing is connected to the sheath pump and red tubing to the waste pump.
2. Squeeze the grip marks on the pump element retainer clip to remove the clip.
3. Lift and pull the Luer lock connectors outward and slide the Luer lock fittings off the pump head.
4. Remove the peristaltic pump tubing and discard accord-ing to standard lab protocols and regulations.
5. Replace with new peristaltic pump tubing by sliding the Luer lock fittings on the pump head.
6. Snap the pump element retainer clip into place.Note: Make sure that the blue and red tubes are not twisted, crimped, or over-tightened.
7. Reconnect the Luer lock fitting on the outside of the pumps.
8. Gently close the cytometer lid.
Fig. 24.25 Applying the alignment to the test sample. This is indicated by an asterisk at the bottom of the histogram confirming alignment of the sample to the standard file
Fig. 24.26 Step showing the alignment of the test sample with a star saved under the histogram plot
A. Agarwal et al.
197
Fig. 24.27 Selection of plots from the collect tab in the Analyze tab.
Fig. 24.28 Showing first plot with no gating in the Analyze tab.
Fig. 24.29 Inserting the Gate in the second plot with P9 in all events.
24 Measurement of DNA Fragmentation in Spermatozoa by TUNEL Assay Using Bench Top Flow Cytometer
198
15 Reference Values
A cutoff of 12 % with >95 % specificity can differentiate infertile men with DNA damage from healthy men. The high sensitivity and specificity make this an ideal test.
16 Factors Affecting the Assay Results
Several factors are important to consider when performing this test:
A. Accessibility of the DNA. B. Sperm preparation C. Presence of dead cells D. Number of cells examined E. Interobserver and intraobserver as well as inter-assay and
intra-assay variations
17 Troubleshooting
A. Cleaning the fluid lines of the BD Accuri flow cytometer. 1. With the C6 on, remove the fluidic lines from the
sheath, decontamination, and cleaning fluid bottles. Leave the fluid line connected to the waste bottle.
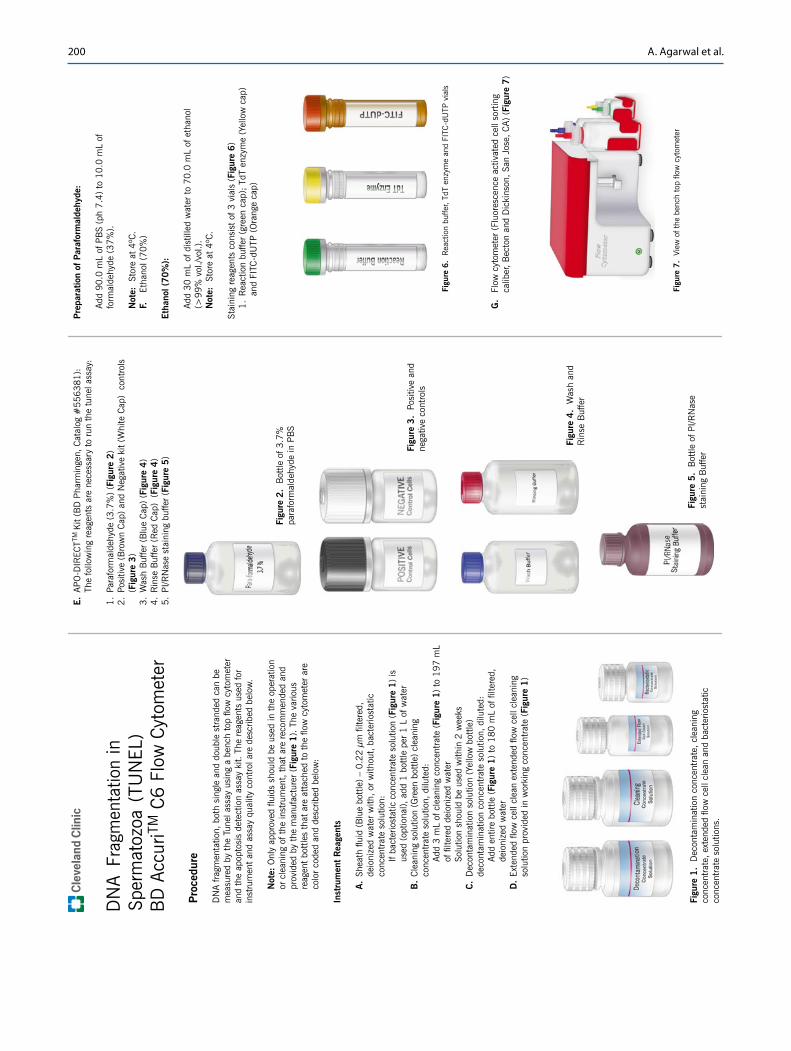
2. Place the fluidic lines in a 500 mL beaker containing approximately 300 mL of hot, but not boiling, DI water. Make sure that the ends of the fluid lines are submerged (Fig. 24.32).
3. From the software, run the Decontamination Cycle (Instrument → Decontamination Cycle) at least two times. Replenish hot water, if necessary. 4. Return the fluidic lines to their respective bottles and
run the Decontamination Cycle again. 5. Replace the in-line sheath filter. 6. Run validation beads or samples to check the consis-
tency of the fluidics.
Fig. 24.30 Third plot showing gate P8 in P9 in all events.
Fig. 24.31 Plot in the Analyze mode showing the percentage of DNA damage in the Upper Right Quadrant (Q6-UR)
A. Agarwal et al.
199
B. Using the SIP wire to clear the SIP 1. Locate the black knurled retaining ring at the top of
the SIP and remove it by turning counterclockwise. Slide the ring off the SIP.
2. Grasp the upper black portion of the SIP and pull it straight down to remove (it may be difficult as it is a friction fit). Inspect the top of the SIP to ensure that the small O-ring is still in place.
3. Insert the wire into the hole in the bottom (sample end) of the SIP and slide it all the way through. If you feel resistance, repeat the procedure until it slides freely.
C. Rinse and Reinstall the SIP 1. Locate the inlet port on the side of the black portion of
the SIP. Press the nozzle of a squirt bottle containing DI water against the port and flush the SIP—a stream of water will shoot from the top of the SIP.
2. Using the squirt bottle, squirt some water into the flow nozzle (hole where the SIP was removed).
3. Replace the SIP. Note that there is a guide pin that allows the SIP to be installed in only one orientation.
4. Replace the black knurled retaining ring and ensure that it is secured firmly (hand tight).
5. Perform backflush and unclog a few times each. 6. With a tube of water on the SIP, run water for 5 min on
“fast.”
7. Remove the tube from the SIP and perform backflush and unclog a few times each.
8. Rerun the 6-peak and 8-peak beads on “slow” (50,000 events).Note: If the clog is aggressive and rinsing does not help, the SIP can be placed in a sonicator for a minute. Flush SIP with water with pressure using a syringe or transfer pipette with a fine end pipette tip. If necessary, repeat this step a couple of times until water flows freely through the SIP.
18 Unscheduled Maintenance
Note: This may be performed to troubleshoot common problems.
(See Table 24.3).
Fig. 24.32 Fluidic lines placed in 500 mL beaker of hot water before running decontamination cycle to clean the lines
Table 24.3 Troubleshooting options for common problems
Procedure When to do What it does
Backflush Clog in the SIP Purges fluid from the below the flow cell out of the SIP
Unclog Clog in the flow cell Purges fluid from above the flow cell out of the SIP
Extended clean of flow cell Large amounts of debris after a cleaning cycle
Allows the cell to soak in the extended flow cleaning solution
Purging air from the cytometer Setting up the cytometer for the first timeCytometer not used for more than 2 monthsAir may have been introduced in the system
Removes air from the system after long periods of nonuseRuns sheath through the system
Hot water flush If clog and backflush do not eliminate the clog
Runs hot water through the system
Fluidic cleaning routine Large amount of background present Runs decontaminating fluid, cleaning fluid, and sheath fluid through the sheath lines
SIP rinse Unclog and backflush do not eliminate the clog
Flushes sheath through the SIP
References
1. Sharma RK, Sabanegh E, Mahfouz R, Gupta S, Thiyagarajan A, Agarwal A. TUNEL as a test for sperm DNA damage in the evalua-
tion of male infertility. Urology. 2010;2010(76):1380–6.2. Sharma RK, Agarwal A. Laboratory evaluation of sperm chromatin:
TUNEL assay. In: Zini A, Agarwal A, editors. Sperm chromatin: biological and clinical applications in male infertility and assisted reproduction. New York, NY: Springer Science + Business Media; 2011. p. 201–15. Chapter 14.
24 Measurement of DNA Fragmentation in Spermatozoa by TUNEL Assay Using Bench Top Flow Cytometer
200
A. Agarwal et al.
201
A ne
gativ
e an
d a
posi
tive
sam
ple
mus
t be
incl
uded
with
eac
hba
tch
run.
The
neg
ativ
e co
ntro
l is
prep
ared
by
omitt
ing
the
TdT
from
the
stai
ning
sol
utio
n.
Tab
le 1
. Pre
par
atio
n o
f th
e S
tain
ing
so
luti
on
24 Measurement of DNA Fragmentation in Spermatozoa by TUNEL Assay Using Bench Top Flow Cytometer
202
B
ottle
of 8
Pea
k V
alid
atio
n B
eads
for
Qua
lity
Con
trol
of t
he in
stru
men
t
A. Agarwal et al.
203
40
24 Measurement of DNA Fragmentation in Spermatozoa by TUNEL Assay Using Bench Top Flow Cytometer


![[AFTER NOTICE (FOR ADMISSION) - CRIMINAL CASES] · kumar sinha[int], abhishek agarwal[int], abhigya[int], v. maheshwari & co.[int], kirti renu mishra[impl], a [int] ... rakesh kumar](https://static.fdocuments.net/doc/165x107/5fc0477c5e91b27f2a12f53f/after-notice-for-admission-criminal-cases-kumar-sinhaint-abhishek-agarwalint.jpg)