Ashland Forest Resiliency Stewardship Project.doc.docx
33
Legacy Tree Monitoring in the Ashland Watershed with the Ashland Forest Resiliency Stewardship Project Photo Credit: Sean Bagshaw Amie Batham Janel Lajoie Senior Capstone Project Department of Environmental Studies Southern Oregon University Spring 2014
Transcript of Ashland Forest Resiliency Stewardship Project.doc.docx

Legacy Tree Monitoring in the Ashland Watershed
with the Ashland Forest Resiliency Stewardship Project
Photo Credit: Sean Bagshaw Amie Batham
Janel Lajoie
Senior Capstone Project
Department of Environmental Studies
Southern Oregon University
Spring 2014

COLLABORATION WITH ASHLAND FOREST RESILIENCY 2
Table of Contents
I. Introduction 4
II. Background 4
A. Ashland Watershed 4
B. Ashland Forest Resiliency Stewardship Project 4
III. Legacy Tree Monitoring 5
A. Ashland Forest Resiliency Stewarship Project Goals 5
B. Our Goals 6
IV. Relevant Studies 6
V. Methodology 10
A. Legacy Trees 10
B. Control Plots 12
VI. Results 14
A. Radial Plots 14
B. Sub-unit Plots 17
VII. Discussion 19
A. Radial Plots 19
B. Sub-unit Plots 20
VIII. Project Constraints 22
IX. Project Significance 22
X. Appendix A: Project Timeline 24
XI. Appendix B: Key AFR Monitoring Partners 25
XII. Appendix C: Additional Stakeholders 26

COLLABORATION WITH ASHLAND FOREST RESILIENCY 3
XIII. Appendix D: Legacy Tree Data Collection Sheet Sample 27
XIV. Appendix E: Control Plot Data Collection Sheet Sample 31
XV. References 32

COLLABORATION WITH ASHLAND FOREST RESILIENCY 4
I. Introduction
As a part of our Southern Oregon University Senior Capstone project, we worked
together with the Ashland Forest Resiliency Stewardship Project (AFR) to monitor legacy trees
in the Ashland watershed in Ashland, Oregon. We have gathered and analyzed data with the
intention of providing needed evidence to assess how the legacy trees’ vigor, growth rates, and
mortality rates respond to the applied treatments.
II. Background
A. Ashland Watershed
Due to more than a century of fire-suppression and wide-spread logging in the American
west, in conjunction with climate change, forest species composition has changed. Many forests
now consist of high density small trees, and shade tolerant, fire intolerant species. Due to this
anthropogenic interference, the Ashland watershed forests are now prone to high-intensity fires
with a frequent return interval. Large shade intolerant species, such as ponderosa and sugar pine
are dying at an accelerated rate. In the absence of fire, they are being replaced by
small diameter trees which comprise closed-canopy forests (Metlen, 2013). In order to restore
the forest to its natural pre-suppression fire regime, new forest management practices have been
implemented as a part of AFR.
B. Ashland Forest Resiliency Stewardship Project
AFR is a collaborative effort between four primary partners: The United States Forest
Service, the City of Ashland, The Nature Conservancy (TNC), and the Lomakatsi Restoration
Project. This multiparty monitoring group is responsible for observing the application of the
project in the Ashland watershed. The National Park Service, Klamath Bird Observatory, citizens
from the community, and students from Southern Oregon University (SOU) are also involved in
kmetlen
Highlight

COLLABORATION WITH ASHLAND FOREST RESILIENCY 5
the monitoring effort. All of these entities are stakeholders in the health and well-being of the
Ashland watershed. Batham and Lajoie are advised and supported by Dr. Kerry Metlen and
Derek Olson of TNC, and Dr. Mark Shibley, and Dr. Gregory Jones of Southern Oregon
University.
III. Legacy Tree Monitoring
A. Ashland Forest Resiliency Stewardship Project Goals
Preliminary work has been completed by Dr. Kerry Metlen, Derek Olson and others in
TNC, including remote sensing the watershed to determine the location of legacy trees and data
collection for each of the 163 legacy trees included in the study. Legacy trees are trees which are
of remarkable landscape, nature conservation, and/or cultural value due to their age, size or
condition. For the purposes of this monitoring effort, trees 150 years old or older are considered
legacy trees. The primary goal of legacy tree monitoring for the AFR project is to protect
Pseudotsuga menziesii (PSME), and Pinus ponderosa (PIPO) legacy trees, with a secondary goal
of protecting Arbutus menziesii (ARME), Quercus kelloggii (QUKE), and Pinus lambertiana
(PILA), legacy trees (Table 1).
Table 1. Legacy tree species code, scientific name, and common name.
Tree Species Code Scientific Name Common Name
PSME Pseudotsuga menziesii Douglas fir
PIPO Pinus ponderosa Ponderosa pine
ARME Arbutus menziesii Pacific madrone
QUKE Quercus kelloggii Black oak
PILA Pinus lambertiana Sugar pine

COLLABORATION WITH ASHLAND FOREST RESILIENCY 6
B. Our Goals
Volunteer hours were completed with TNC to aid in legacy tree monitoring within the
Ashland watershed. The objective of this portion of the project was to complete all field data
collection, to enter control plot and legacy tree data into a Microsoft Access database, and to
summarize and analyze the data. The ultimate goals of our contribution to the legacy tree
monitoring project were to help TNC establish a reference point for comparison of pre- and post-
treatment fieldwork; to display initial effects of AFR treatment methods on the composition of
the forest over time; and to gain experience and knowledge to prepare for a career in
environmental studies. Completing these goals required several group meetings, extensive
fieldwork and data analysis, and the cooperation of the AFR project, TNC, and all project
advisors.
IV. Relevant Studies
The major driving question of legacy tree monitoring is: How will the vigor, growth
rates, and mortality rates of legacy trees in the Ashland watershed be impacted by forest thinning
and prescribed burn treatments implemented as a part of the AFR project? This question will
take several years to evaluate; however, numerous studies have addressed similar questions
about forest and legacy tree responses to thinning and prescribed burn treatments. Many of them
have been completed in or near the Pacific Northwest and encompass a similar forest
composition. A review of these studies will provide an understanding of how legacy trees and the
rest of the Ashland watershed forest may respond to AFR thinning and burning techniques.
Various methods have been developed to protect legacy trees and overall forest health.
One of those methods is forest thinning. According to Graham et al., there are 5 general thinning
methods: Low, or thinning from below; crown, or thinning from above; selection, or diameter-

COLLABORATION WITH ASHLAND FOREST RESILIENCY 7
limit thinning; free thinning; and mechanical thinning (1999). In a study with over 25 years of
post-treatment data in the Sierra Nevada forests of California, several thinning treatments were
applied, including the thinning methods listed above (Stephens & Moghaddas, 2005). Over the
course of the study, thinning treatments shifted from a traditional silvicultural system to a more
modern approach over time. The effectiveness of seven systems and two types of reserves used
in the Sierra Nevada mixed conifer forests was evaluated in terms of vegetation structure, fuel
bed characteristics, modeled fire behavior, and potential wildfire related mortality. Traditional
treatments included plantation treatments, overstory removal, and individual tree selection, while
modern treatment consisted of low thinning and the institution of old-growth and young-growth
reserves. This broad range of methods provided an opportunity for comparison among the
treatments (Stephens & Moghaddas, 2005).
The results of this study indicated that the majority of the traditional silvicultural systems
did not effectively reduce potential fire behavior and its effects (2005). Average basal area per
hectare (the area of land occupied by trees) was significantly higher in low thinning, old-growth
reserve, young-growth reserve, and individual tree selection treatments. Overstory removal
treatment areas’ average basal area was similar to that of un-thinned, masticated, and pre-
commercially thinned plantations. In general, thinning from below, old-growth reserves, and
young-growth reserves were more effective at reducing predicted tree mortality. The authors
suggest the use of a combination of mechanical treatments and prescribed fire as a management
technique to reintroduce a fundamental ecosystem process into forests (Stephens & Moghaddas,
2005).
Another method for forest density management is including prescribed burn along with
forest thinning. In a study by Ritchie, Skinner, & Hamilton, the authors observed fire severity

COLLABORATION WITH ASHLAND FOREST RESILIENCY 8
among treated and untreated stands after a wildfire at Blacks Mountain Experimental Forest
(2007). The treatment areas were part of a large-scale experiment designed to evaluate stand
structure, grazing and prescribed fire in an interior ponderosa pine (Pinus ponderosa) forest. At
several locations in the forest, the wildfire burned from a dense, untreated forest stand, into an
area that had been recently treated with combinations of thinning and prescribed fire. Tree
survival and damage data was collected and analyzed using a logistic regression model relating
the probability of initial mortality to distance from treatment plot boundary, and treatment
history. Fire behavior simulation was used to evaluate the effectiveness of the pre-fire stand
treatments (Ritchie, Skinner, & Hamilton, 2007).
This study revealed that the combination of thinning and prescribed burn produced the
highest tree survival rates and drastically reduced fire intensity. Thinned units with prescribed
fire were predicted to have nearly 100% survival. Survival rates in thinned areas without
prescribed fire was higher than observed in other untreated areas of the forest, but generally
lower than the other treated units. The survival rate in the untreated area was nearly zero.
In another study, “Difference in Radial Growth Response to Restoration Thinning and
Burning Treatments between Young and Old Ponderosa Pine in Arizona”, thinning and
prescribed burn treatments were also applied (Skov, Kolb, & Wallin, 2005). The authors
examined the difference in response to 4 levels of thinning treatment among old, presettlement,
and young, postsettlement ponderosa pine trees over 3 years. Treatments included three levels of
thinning followed by prescribed fire and an unthinned and unburned control; treatments were
implemented on three different sites (Skov, Kolb, & Wallin, 2005).
The results from this study showed that thinning increased radial growth at breast height
of young, post-settlement trees in all 3 years after treatment and growth response was negatively
COLLABORATION WITH ASHLAND FOREST RESILIENCY 9
correlated with post-treatment stand basal area. In contrast, growth of old, pre-settlement trees
was not affected by thinning in most years, and there was no relationship between growth and
post-treatment stand basal area. Application of the same thinning prescription to stands with
different management history resulted in different post-treatment basal area and consequently
different growth response to thinning for post-settlement trees. These results indicate that 80-
year-old, post-settlement ponderosa pines are more responsive to restoration thinning than older
pre-settlement trees (Skov, Kolb, & Wallin, 2005).
Another factor to be considered when using thinning and prescribed burn techniques is
the relationship between prescribed burn and mortality. In a study by Maloney et al., the authors
compare the types of insect- and pathogen-mediated mortality on mixed-conifer trees in the
Teakettle experimental Forest east of Fresno, California, three years after treatment (2008). They
found that the number of bark beetle attacked trees and mortality was greater in burn treatments
than in no-burn treatments. Attacks were most common among larger diameter trees. Treatments
also increased the frequency and abundance of Ribes, an alternate host for white pine blister rust.
They conclude that continued monitoring is needed (Maloney et al., 2008).
Several studies have been conducted regarding thinning and prescribed burn to reduce
forest density, restore pre-fire suppression forest composition, and to protect and promote legacy
trees. Although prescribed burn poses the risk of initial tree mortality due to bark beetle attacks,
the combination of forest thinning and prescribed burn is shown to have the greatest positive
effect on legacy tree growth. Parties involved in the AFR project took several of these studies
into consideration when creating the project plan and have utilized similar techniques.

COLLABORATION WITH ASHLAND FOREST RESILIENCY 10
V. Methodology
A. Legacy Trees
The Environmental Impact Statement (EIS) for the AFR found that natural processes,
specifically fire, are not likely to function in a manner that maintain values of interest without
management intervention treatments, including fuel management and forest density reduction.
Retention of large old legacy trees and their response to treatments are key factors and a critical
component of AFR multiparty monitoring.
Sampling locations were selected within a 100 m buffer of the project footprint.
The Nature Conservancy developed a remotely sensed map of legacy conifer locations that
was used to target sample trees, and plot centers were allocated using GIS. Figure 1 displays
legacy tree plots, shown in light green.
Figure 1. Legacy tree and control plots in the Ashland watershed, Ashland, Oregon.
kmetlen
Highlight

COLLABORATION WITH ASHLAND FOREST RESILIENCY 11
Samples were stratified by treatment history, proposed treatment, and biophysical setting.
To avoid sampling bias, the living legacy tree with live canopy >20% closest to the remotely
sensed legacy tree pixel in the GIS data was measured. Legacy trees in close proximity to one
another, but of different species, were monitored whenever possible. Since conifers are more
easily remotely sensed than deciduous, ARME and QUKE samples were taken near conifer
legacy trees whenever possible, and then a potential tree list was compiled from previous efforts
in the watershed. The location of legacy trees are shown in figure 1 using small dark green tree
symbols.
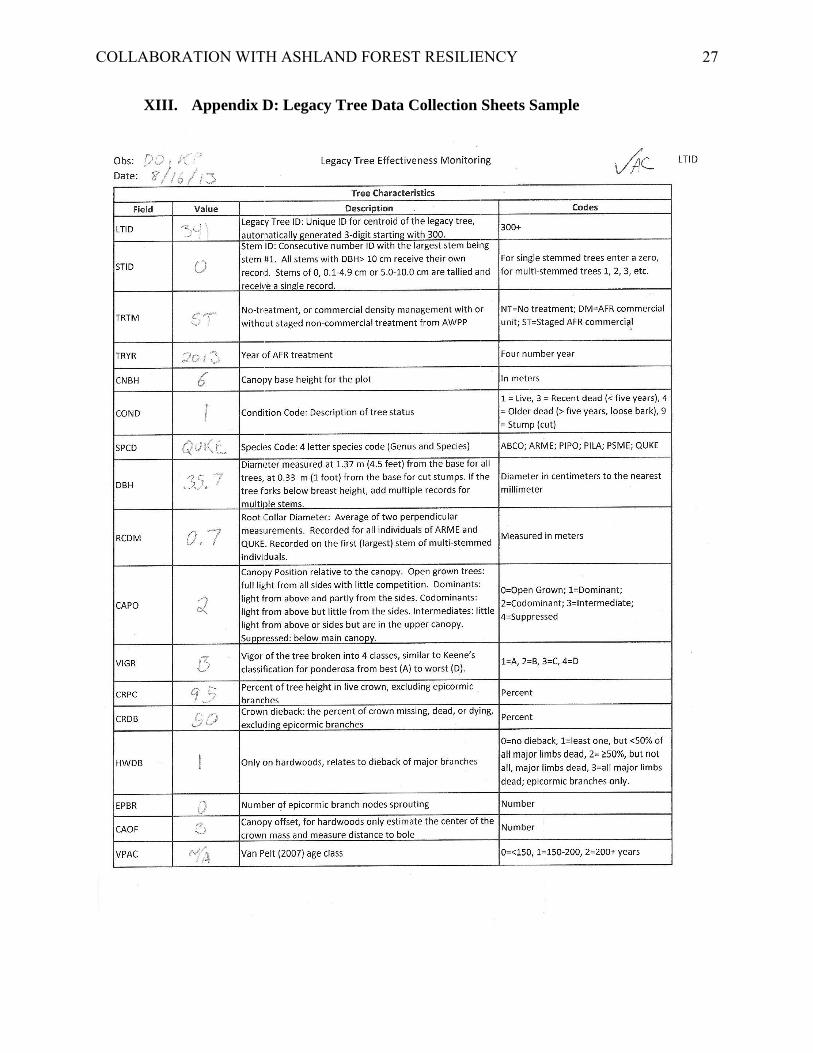
Throughout the watershed, 163 legacy trees have been identified, photographed, and
tagged with an individual identification number, with considerable additional data collected for
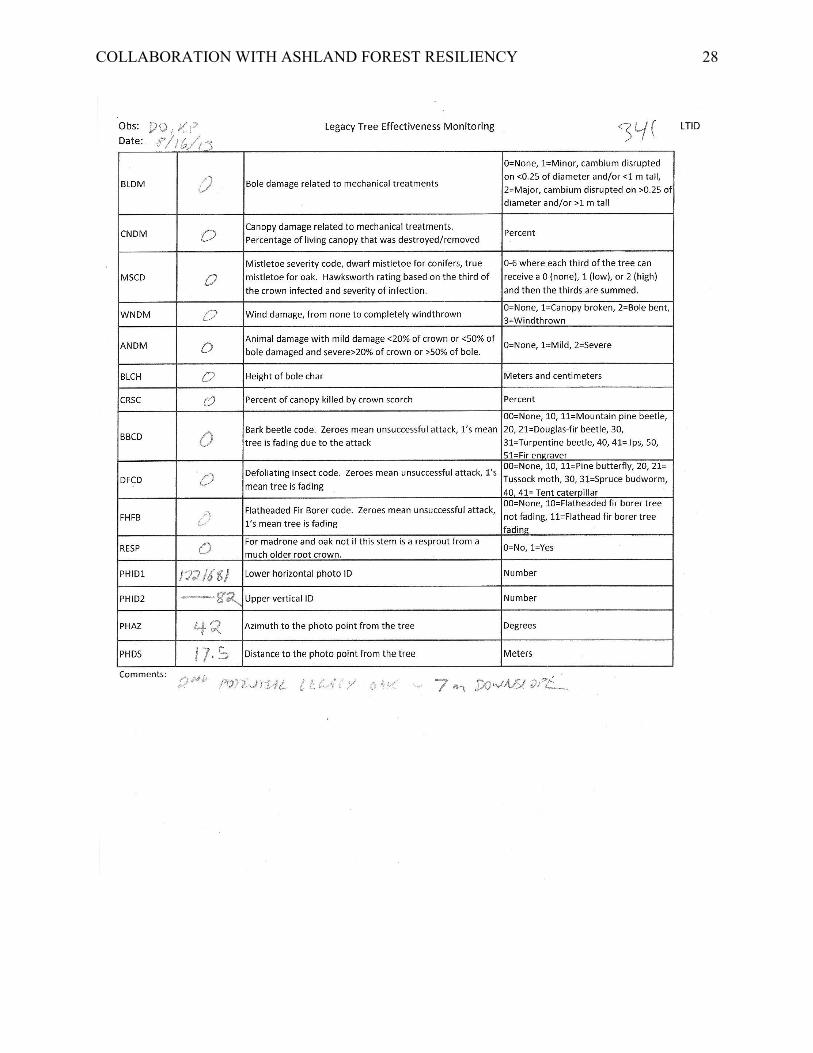
each tree. The data regarding each legacy tree includes, but is not limited to, diameter at breast
height (DBH), species, vigor, canopy base height, crown dieback, and animal and insect damage
(Shown in Appendix D). Plot characteristics were recorded in a one-tenth acre plot surrounding
each legacy tree. The number and species of live trees remaining in the plot were recorded, and
the stumps and species of trees were recorded according to treatment.
Three treatments have been and will continue to be performed suurounding each legacy
tree, including staged neighbor removal (ST), density management neighbor removal (DM), and
an untreated control group (NT). Currently, there are 25 treated tree plots consisting of 13
density management plots and 12 staged neighbor removal plots, and 10 untreated tree plots. In
the staged treatment non-commercial thinning was implemented in 2005. Commercial tree
harvest was implemented in 2013 in both the ST and DM only treatments.
kmetlen
Highlight

COLLABORATION WITH ASHLAND FOREST RESILIENCY 12
The data for the 163 legacy tree plots and legacy tree treatment plots was entered into a
Microsoft Access database, and was analyzed using Microsoft Excel and IBM SPSS software.
The quadratic mean diameter (QMD) of trees was calculated to determine the average diameter
of trees around each of the legacy tree species in radial plots. The average basal area per acre
(BA/ac) and average trees per acre (TPA) were calculated by radial plot and sub-unit plot,
around each of the legacy tree species, both pre- and post-treatment. Pre- and post-treatment data
were then used to determine the magnitude of treatment around each of the legacy trees in both
radial and sub-unit plots.
B. Control Plots
The control plots were created with ArcGIS software and are shown in a salmon color in
both figures 1 and 2.
Figure 2. Control plot example in the Ashland watershed, Ashland, Oregon.

COLLABORATION WITH ASHLAND FOREST RESILIENCY 13
The parameters for measuring control stand density plots include:
5 acre minimum stands with 5 plots per stand, or if there are multiple trees within a
stand, then 10 plots per stand
Plots a minimum of 100 feet from stand edge
Minimum of 66 feet between plots.
Each random point was evaluated with both a fixed radius plot and a variable radius
plot. The fixed radius plot was a 360-degree circle with a 3.6 meter radius beginning at due
north. From due north to due east, all hardwood saplings and seedlings with a diameter >5 inches
diameter at breast height (4.5 feet; DBH) were recorded. For the entire plot, all conifers with
DBH >5 inches height were recorded.
A variable radius plot survey for the entire 360 degree area surrounding the random point
was conducted with the aid of a Spiegel Relaskop relascope and TruPulse hypsometer. The
relascope was used to measure the basal area of a forest stand, and the hypsometer was used as a
rangefinder to evaluate the distance of individual trees in relation to the random point in the
control area. All PSME, PIPO, ARME, QUKE, PILA, Abies concolor (ABCO), Calocedrus
(CADE), and Chrysolepis chrysophylla (CHCH) of sufficient size were included in the count. By
using these tools and collecting consistent data, we are able to determine forest stand density,
timber stand volume, and growth. These methods were used in all 110 random points in control
areas throughout the legacy tree monitoring control area.
Data recorded in the field using data collection sheets (Appendix E) included plot
number1-110, species, height or diameter at breast height and tally in fixed plots, diameter at
breast height in variable plots. Additional data that was deemed important or unusual such as
kmetlen
Highlight
kmetlen
Highlight

COLLABORATION WITH ASHLAND FOREST RESILIENCY 14
Legacy Tree
Species Pre Post Pre Post Pre Post
ARME 10.23 13.73 8.81 8.81 9.63 12.87
PILA 10.01 11.73 10.90 10.90 9.38 14.82
PIPO 9.77 14.16 8.64 8.64 8.59 11.31
PSME 10.70 15.17 8.23 8.23 8.67 14.38
QUKE 11.27 14.83 9.39 9.39 8.90 12.32
DM NT ST
Quadratic Mean Diameter of Trees in Legacy Tree Radial Plots
extensive bark beetle invasion, widespread mortality, or tagged trees was noted in the comments
section of the data collection sheets.
After control plot data collection was complete, the information from the data collection
sheets was entered into a Microsoft Excel worksheet, to be transferred into an Access database
by TNC. After data was entered, our project goals expanded to address these reasearch questions:
What is the forest composition in the Ashland Watershed, pre- and post-treatment?
What is the magnitude of thinning treatments around legacy trees?
The data was analyzed using Microsoft Excel, to understand the pre-treatment forest
composition in the Ashland watershed, and to determine the magnitude of thinning treatment in
each of the treatment areas.
VI. Results
A. Radial Plots
Initial calculations reveal that the pre-treatment QMD of trees in the radial plots range
from 9.77 to 11.27 inches in DM, 8.23 to 10.90 in NT, and 8.59 to 9.63 in ST treatment areas
(Table 2). Post-treatment QMDs are higher, with a range of 11.73 to 15.17 inches in DM, 8.23 to
10.9 in NT, and 11.31 to 14.82 in ST treatment areas.
Table 2. Quadratic mean diameter of trees in legacy tree radial plots, by treatment, pre- and post-treatment.

COLLABORATION WITH ASHLAND FOREST RESILIENCY 15
Forest density is shown as mean TPA and mean BA/ac around legacy tree species, by
treatment type, in Radial plots (Table 3). Pre-treatment mean TPA values range from 327.27 to
633.64 trees per acre. Pre-treatment mean BA/ac range from 198.38 to 312.21. Post treatment
values are lower in DM and ST areas with TPA values ranging from 114.55 to 173.64 trees per
acre, and BA/ac values ranging from 79.87 to 169.38.
Table 3. Radial tree densities around legacy trees, pre- and post-treatment.

COLLABORATION WITH ASHLAND FOREST RESILIENCY 16
Treatment magnitude describes the amount of thinning treatment applied around the
legacy trees. A number closer to 1 implies that thinning was greater around that legacy tree
species. TPA treatment magnitude values range from 0.61 to 0.73 in DM areas, and 0.72 to 0.81
in ST areas, while BA/ac treatment magnitude values range from 0.37 to 0.63 in DM areas, and
0.39 to 0.66 in ST areas. Treatment magnitude is zero in NT areas (Table 4).
Table 4. Treatment magnitude on trees per acre and basal area per acre in Radial plots, around legacy tree species, by treatment.
Legacy Tree
Species TM (TPA) TM (BA/ac) TM (TPA) TM (BA/ac) TM (TPA) TM (BA/ac)
ARME 0.64 0.37 0.00 0.00 0.74 0.51
PILA 0.73 0.63 0.00 0.00 0.75 0.45
PIPO 0.68 0.45 0.00 0.00 0.81 0.66
PSME 0.70 0.41 0.00 0.00 0.75 0.39
QUKE 0.61 0.42 0.00 0.00 0.72 0.51
NT STDM
Treatment Magnitude in Legacy Tree Radial Plots

COLLABORATION WITH ASHLAND FOREST RESILIENCY 17
B. Sub-Unit Plots
Forest density was also calculated by sub-unit. Thinning was applied around random
points within the sub-units. Since legacy trees occurred within those sub-units, we were able to
determine unit thinned tree densities around the legacy tree species. Pre-treatment mean TPA
values range from 147.14 to 497.67 trees per acre. Pre-treatment mean BA/ac range from 126.86
to 228.64. Post treatment values are lower in DM and ST areas with TPA values ranging from
230.83 to 461.34 trees per acre, and BA/ac values ranging from 149.17 to 205.75 (Table 5).
Table 5. Unit tree densities by legacy tree species, pre- and post-treatment.
Legacy Tree
Species TPA σ BA/ac σ TPA σ BA/ac σ TPA σ BA/ac σ
ARME 497.67 179.72 221.75 31.67 231.00 76.09 188.80 53.05 293.18 118.18 220.27 27.52
PILA 435.50 159.49 223.50 49.97 193.40 48.31 194.20 23.03 255.73 67.20 211.64 37.34
PIPO 454.09 194.05 210.91 32.79 216.27 57.12 197.09 28.15 273.45 113.34 228.64 22.69
PSME 436.25 199.04 214.33 32.03 227.45 54.62 200.55 28.44 255.00 123.82 227.18 22.52
QUKE 296.09 68.18 199.09 20.42 147.14 114.92 126.86 83.39 276.64 103.27 172.64 30.48
Unit Density of Legacy Tree Sub-Units Pre-Treatment
DM NT ST
Legacy Tree
Species TPA σ BA/ac σ TPA σ BA/ac σ TPA σ BA/ac σ
ARME 461.34 169.57 187.15 32.55 231.00 76.09 188.80 53.05 266.37 120.44 181.78 51.85
PILA 400.24 165.18 187.12 51.15 193.40 48.31 194.20 23.03 233.17 70.60 193.95 37.40
PIPO 421.47 194.65 180.15 33.52 216.27 57.12 197.09 28.15 251.15 115.20 193.65 53.43
PSME 399.07 193.42 179.73 32.15 227.45 54.62 200.55 28.44 230.83 126.92 205.75 22.49
QUKE 270.42 65.01 175.63 15.47 147.14 114.92 126.86 83.39 246.71 98.21 149.17 18.86
Unit Density of Legacy Tree Sub-Units Post-Treatment
DM NT ST

COLLABORATION WITH ASHLAND FOREST RESILIENCY 18
TPA treatment magnitude values in sub-unit plots range from 0.07 to 0.09 in DM areas,
and 0.08 to 0.11 in ST areas (Table 6). BA/ac treatment magnitude values are higher with values
ranginging from 0.12 to 0.16 in DM areas, and 0.08 to 0.17 in ST areas. Treatment magnitude is
zero in NT areas.
Table 6. Treatment magnitude on trees per acre and basal area per acre in Sub-unit plots, around legacy tree species, by treatment.
Legacy Tree
Species TM (TPA) TM (BA/ac) TM (TPA) TM (BA/ac) TM (TPA) TM (BA/ac)
ARME 0.07 0.16 0.00 0.00 0.09 0.17
PILA 0.08 0.16 0.00 0.00 0.09 0.08
PIPO 0.07 0.15 0.00 0.00 0.08 0.15
PSME 0.09 0.16 0.00 0.00 0.09 0.09
QUKE 0.09 0.12 0.00 0.00 0.11 0.14
ST
Treatment Magnitude in Legacy Tree Sub-Unit PlotsDM NT

COLLABORATION WITH ASHLAND FOREST RESILIENCY 19
VII. Discussion
A. Radial Plots
QMDs are higher Post-treatment due to thinning of smaller trees, leaving larger trees that
increase QMD values. QMDs in NT areas do not change due to the fact that they are not treated.
PIPO had the lowest pre-treatment QMD values in 2 of the 3 treatments; however, QMD values
change significantly around PIPO legacy trees.
Mean TPA values in radial plots are significantly reduced post-treatment, while mean
BA/ac values are only moderately reduced (Table 3). This is due to the fact that many smaller
trees were removed, impacting trees per acre, while leaving larges trees’ basal areas in tact.
Figure 3 compares the TPA and BA/ac values in the DM and ST treatment areas. BA/ac values
show greater variance than TPA values. Hardwoods (ARME and QUKE) tend to have highest
remaining TPA and BA/ac, while PIPO has the lowest remaining TPA and BA/ac. This indicates
that treatment around PIPO trees is higher than the other legacy tree species.
Figure 3. Box plots depicting post-treatment trees per acre and basal area per acre, by legacy tree species and treatment in Radial plots in the Ashland watershed.
COLLABORATION WITH ASHLAND FOREST RESILIENCY 20
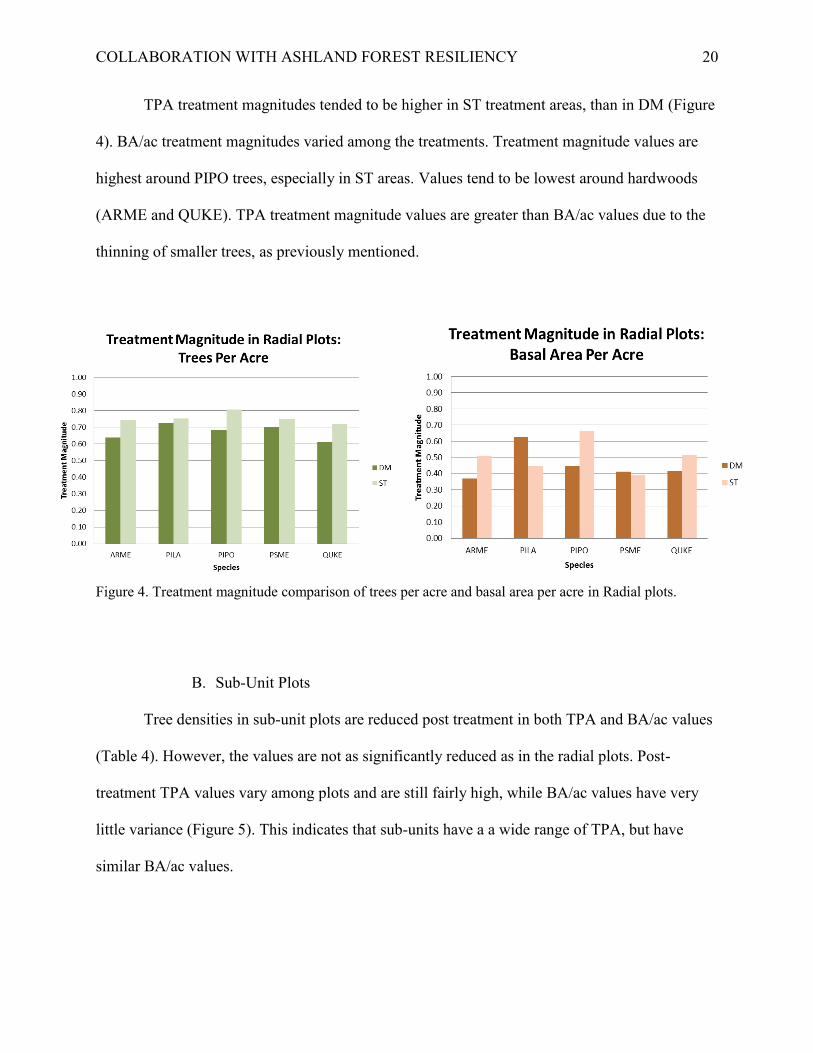
TPA treatment magnitudes tended to be higher in ST treatment areas, than in DM (Figure
4). BA/ac treatment magnitudes varied among the treatments. Treatment magnitude values are
highest around PIPO trees, especially in ST areas. Values tend to be lowest around hardwoods
(ARME and QUKE). TPA treatment magnitude values are greater than BA/ac values due to the
thinning of smaller trees, as previously mentioned.
Figure 4. Treatment magnitude comparison of trees per acre and basal area per acre in Radial plots.
B. Sub-Unit Plots
Tree densities in sub-unit plots are reduced post treatment in both TPA and BA/ac values
(Table 4). However, the values are not as significantly reduced as in the radial plots. Post-
treatment TPA values vary among plots and are still fairly high, while BA/ac values have very
little variance (Figure 5). This indicates that sub-units have a a wide range of TPA, but have
similar BA/ac values.

COLLABORATION WITH ASHLAND FOREST RESILIENCY 21
Figure 5. Box plots depicting trees per acre and basal area per acre, by legacy tree species and treatment in Sub-unit plots in the Ashland watershed.
Treatment magnitude values are much lower in sub-unit plots as compared to radial plots
(Figure 6). The TPA treatment magnitude values are lower than BA/ac values, also differing
from radial plots. This indicates that BA/ac is more impacted by thinning treatments than TPA.
BA/ac treatment magnitude values are also more varied than TPA values, similar to radial plots.
Figure 6. Treatment magnitude comparison of trees per acre and basal area per acre in Sub-unit plots.
COLLABORATION WITH ASHLAND FOREST RESILIENCY 22
VIII. Project Constraints
In the process of the Capstone project, there have been several project constraints. Firstly,
the AFR project is a multi-year monitoring project, so this work has been a contribution to the
effort, but was not intended to be concluded. The effects the thinning treatments will ultimately
have on the forest composition and legacy trees are temporal in nature. A more in-depth analysis
of the overall treatment effects cannot be evaluated in this capstone project, but could be useful
to incoming Capstone students in subsequent years.
The second constraint is obtaining data in dangerous, difficult to reach terrain. Much of
the watershed is located on fairly steep slopes; all but one of the control plots were created on
traversable slopes that were relatively accessible by 4-wheel drive and hiking. When the safety
of researchers is at risk, it is best not to attempt to collect the data. Due to the danger of the
situation, the inaccessibility of the plot, weather constraints, and the fact that the plot contained
only one legacy tree to monitor, no data was collected from one of the originally selected control
plots.
IX. Project Significance
At local scales, the weather is an extremely important factor in the control and spread of
fire. Topography also plays an important role, in that both south-facing and steep slopes often
burn with greater severity (Alexander, 2006). In the last 50 years, the Rogue Valley has
experienced increasingly dry conditions. The 2013 wildfire season was one of the most severe
for the region, and 2014 is poised to be the driest year on record, which could bring another high
severity fire year (Snow, 2014). Since 2010, Ashland has set several climate records including
highest barometer, highest average wind speed, warmest day, warmest night, and highest heat
index, which can all affect fire spread, intensity, and severity (Jones, 2014).

COLLABORATION WITH ASHLAND FOREST RESILIENCY 23
Climate change combined with years of fire suppression and improper forest
management techniques have led to overly dense forests in the Ashland watershed. Increased
fuel buildup in dense forests leads to higher intensity fires. High intensity fires are detrimental to
the vegetation, specifically legacy trees, and wildlife, and are extremely dangerous to nearby
civilizations. The combination of climate change and increased fuel load gives the Ashland
watershed greater opportunity for ignition. Considering the Ashland watershed is directly above
the city of Ashland and near the city of Talent, many human lives are at stake.
The AFR project is designed to help restore the forest to pre-fire suppression conditions
with applied forest thinning treatments. The treatments are designed to reduce forest density,
thereby reducing fire fuels, protecting legacy trees, and ultimately protecting human welfare. Our
work with TNC and other key stakeholders will aid in monitoring the various treatments
implemented in the Ashland watershed. Their involvement is crucial to establishing a reference
point for future evaluation of the AFR project. The knowledge gained from legacy tree
monitoring, as a part of the AFR project, will help to protect the forest and affected citizens and
can be used for future forest thinning projects.
COLLABORATION WITH ASHLAND FOREST RESILIENCY 24
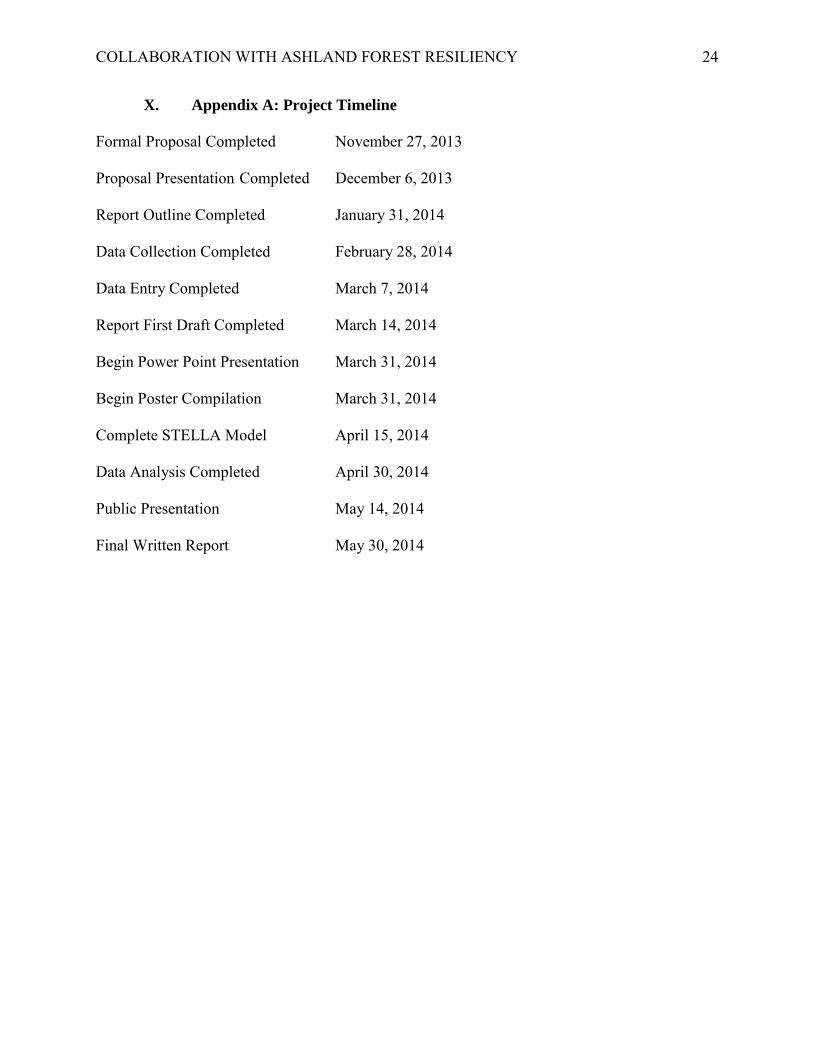
X. Appendix A: Project Timeline
Formal Proposal Completed November 27, 2013
Proposal Presentation Completed December 6, 2013
Report Outline Completed January 31, 2014
Data Collection Completed February 28, 2014
Data Entry Completed March 7, 2014
Report First Draft Completed March 14, 2014
Begin Power Point Presentation March 31, 2014
Begin Poster Compilation March 31, 2014
Complete STELLA Model April 15, 2014
Data Analysis Completed April 30, 2014
Public Presentation May 14, 2014
Final Written Report May 30, 2014

COLLABORATION WITH ASHLAND FOREST RESILIENCY 25
XI. Appendix B: Key AFR Monitoring Partners
Agency Name Address Contact Phone Email
The Nature Conservancy
33 N Central Ave Ste 405 Medford, OR 97501
Kerry Metlen, Ph.D.
(541) 770-7933 [email protected]
Derek Olson, Field Assistant
Southern Oregon University
1250 Siskiyou Blvd Ashland, OR 97520
Mark Shibley, Ph.D.
(541) 552-6761 [email protected]
Charles Welden, Ph.D.
(541) 552-6868 [email protected]
Gregory Jones, Ph.D.
(541) 552-6758 [email protected]
United States Forest Service Rogue River-Siskiyou National Forest
3040 Biddle Rd Medford, OR 97504
Don Boucher, AFR Project Manager
(541) 552-2913 [email protected]

COLLABORATION WITH ASHLAND FOREST RESILIENCY 26
XII. Appendix C: Additional Stakeholders
Agency Name Address Contact Phone Email
City of Ashland 20 East Main St Ashland, OR 97520
Chris Chambers (541) 552-2066 [email protected]
Lomakatsi Restoration Project
P.O. Box 3084 Ashland, OR 97520
Marko Bey (541) 488-0208 [email protected]
National Park Service
1250 Siskiyou Blvd Ashland, OR 97520
Daniel Sarr, PhD Ecologist/Program Manager
(541) 552-8575 [email protected]
Klamath Bird Observatory
1497 E Main St, Ashland, OR 97520
Jaime Stephens (541) 201-0866 [email protected]
Students from Southern Oregon University
Ashland, OR Amie Batham, Environmental Studies Captsone Student
(530) 351-2480 [email protected]
Janel Lajoie, Environmental Studies Captsone Student
(541) 821-2222 [email protected]
Citizens from the Ashland community
Ashland, OR
COLLABORATION WITH ASHLAND FOREST RESILIENCY 27
XIII. Appendix D: Legacy Tree Data Collection Sheets Sample
COLLABORATION WITH ASHLAND FOREST RESILIENCY 28

COLLABORATION WITH ASHLAND FOREST RESILIENCY 29

COLLABORATION WITH ASHLAND FOREST RESILIENCY 30

COLLABORATION WITH ASHLAND FOREST RESILIENCY 31
XIV. Appendix E: Control Plot Data Collection Sheet Sample

COLLABORATION WITH ASHLAND FOREST RESILIENCY 32
XV. References
Alexander, J. D., Seavy, N. E., Ralph, C. J., & Hogoboom, B. (2006). Vegetation and
topographical correlates of fire severity from two fires in the klamath-siskiyou region of
oregon and california. International Journal ofWildland Fire, (15), 237-245. Retrieved
from www.publish.csiro.au/journals/ijwf
Conroy, S. D. (2009). Ashland Forest Resiliency Final Environmental Impact Statement
(Environmental Impact Statement: Record of Decision). Jackson County, Oregon.
Retrieved from
http://a123.g.akamai.net/7/123/11558/abc123/forestservic.download.akamai.com/11558/
www/nepa/1582_FSPLT2_051645.pdf
Graham, R. T., Harvey, A. E., Jain, T. B., & Tonn, J. R. (1999). Effects of thinning and similar
stand treatments on fire behavior in western forests. Retrieved from
http://digitalcommons.usu.edu/barkbeetles/55/
Hood, S. M. (2010). Mitigating old tree mortality in long-unburned, firedependent forests: a
synthesis (Gen. Tech. Rep. No. RMRS-GTR-238) (p. 71). Fort Collins, CO: U.S.
Department of Agriculture,Forest Service, Rocky Mountain Research Station.
Jones, G. (2014). Sou: Ashland weather station. Retrieved from http://weather.sou.edu/
Latham, P., & Tappeiner, J. (2002). Response of old-growth conifers to reduction in stand
density in western Oregon forests. Tree Physiology, 22(2-3), 137–146.
Maloney, P. E., Smith, T. F., Jensen, C. E., Innes, J., Rizzo, D. M., & North, M. P. (2008).
Initial tree mortality insect pathogen Maloney.pdf. Canadian Journal of Forest Research,
38, 3011–3020.

COLLABORATION WITH ASHLAND FOREST RESILIENCY 33
Metlen, K. (2013). Ashland Forest Resiliency Stewardship Project Effectiveness Monitoring:
Legacy Tree Protocol. Retrieved from
http://ashland.or.us/Files/AFR%20Mon%20Plan%2020130910.pdf
Metlen, K., & Borgias, D. (2013). Ashland Forest Resiliency Stewardship Project Monitoring
Plan. Retrieved from http://ashland.or.us/Files/AFR%20Mon%20Plan%2020130910.pdf
Metlen, K., Olson, D., & Borgias, D. (2013). Conserving large old trees in restoring dry, fire
prone forests of the Rogue Basin. The Nature Conservancy.
Ritchie, M. W., Skinner, C. N., & Hamilton, T. A. (2007). Probability of tree survival after
wildfire in an interior pine forest of northern California: Effects of thinning and
prescribed fire. Forest Ecology and Management, 247(1-3), 200–208.
doi:10.1016/j.foreco.2007.04.044
Skov, K. R., Kolb, T. E., & Wallin, K. F. (2005). Difference in radial growth response to
restoration thinning and burning treatments between young and old ponderosa pine in
Arizona. Western Journal of Applied Forestry, 20(1), 36–43.
Snow, S. (2014). The drought of 2013-14 and climate change as of february
2014.Rogueclimate.org, DOI: http://www.rogueclimate.org/the_drought_of_2013_2014
Stephens, S. L., & Moghaddas, J. J. (2005). Silvicultural and reserve impacts on potential fire
behavior and forest conservation: Twenty-five years of experience from Sierra Nevada
mixed conifer forests. Biological Conservation, 125(3), 369–379.
doi:10.1016/j.biocon.2005.04.007