ASHADE BILAL OLALERE - myfik.unisza.edu.my
63
HEART DISEASE PREDICTION SYSTEM USING RULES BASED TECHNIQUE ASHADE BILAL OLALERE BACHELOR OF COMPUTER SCIENCE (SOFTWARE DEVELOPMENT) UNIVERSITI SULTAN ZAINAL ABIDIN 2018
Transcript of ASHADE BILAL OLALERE - myfik.unisza.edu.my

HEART DISEASE PREDICTION SYSTEM USING
RULES BASED TECHNIQUE
ASHADE BILAL OLALERE
BACHELOR OF COMPUTER SCIENCE
(SOFTWARE DEVELOPMENT)
UNIVERSITI SULTAN ZAINAL ABIDIN
2018

HEART DISEASE PREDICTION SYSTEM USING RULES
BASED TECHNIQUE
ASHADE BILAL OLALERE
BACHELOR OF COMPUTER SCIENCE (SOFTWARE DEVELOPMENT)
FACULTY OF INFORMATICS AND COMPUTING
UNIVERSITI SULTAN ZAINAL ABIDIN, TERENGGANU, MALAYSIA
2018

ii
DECLARATION
I hereby declare that this report is based on my original work except for quotations
and citations, which have been duly acknowledged. I also declare that it has not been
previously or concurrently submitted for any other degree at Universiti Sultan Zainal
Abidin or other institutions.
________________________________
Name : Ashade Bilal Olalere
Date : ..................................................

iii
CONFIRMATION
This is to confirm that:
The research conducted and the writing of this report was under my supervison.
________________________________
Name : Dr Nadiah Bint Zamri
Date : ..................................................

iv
DEDICATION
This thesis work is dedicated to my beloved Parents who have been a constant source
of support and encouragement during the challenges of graduate School and life. I am
truly thankful for having you in my life. This work is also dedicated to Brother
Lukman Olagoke, whose good examples have taught me to work hard for the things
that I aspire to achieve.

v
ABSTRACT
Every year over one million people died by suicide worldwide. 6.7% of them are due
to depression. High depression is one of the prevalent mental disorder problems. They
are less visible and can be continuously revised. Therefore, this study develops a
Mental Disorder Diagnosis and Stress Self Treatment System. This system offers users
with the set of a questionnaire to measure the stress, anxiety, and depression. The
questionnaire is generated using rule-based techniques. Besides, weighted sum
method is also used to calculate the sum of answer from the users. If the feedbacks
show the definite mental health problems, the users are given the stress self-treatment.
Also, this system can be used at all times and anywhere. Every year, over seventeen
million people died from heart disease worldwide. Heart disease is a general name for
conditions and disorders that affect the heart and the blood vessels. It can attack any
healthy people with no clues or sign, either young or old. They are less visible and can
be continuously revised. Therefore this study develops a Heart Prediction System.
This system is an end user support system and online consultation system. It allows
users to get the instant guidance about their heart issues through answering the set of
questionnaires about the heart disease. The system covers with various heart diseases
symptoms such as Angina, Arrhythmia, Atrial Fibrillation, Cardiomyopathy, Heart
failure, and heart attack. It allows the user to record their heart condition status and
guide them through the heart disease treatment. The questionnaire is generated using
data mining techniques. Also, this system can be used all times and anywhere.

vi
ABSTRAK
Setiap tahun lebih satu juta orang mati akibat bunuh diri di seluruh dunia. 6.7%
daripadanya disebabkan kemurungan. Kemurungan yang tinggi adalah salah satu
masalah gangguan mental yang lazim. Mereka kurang dapat dilihat dan boleh disemak
secara berterusan. Oleh itu, kajian ini membangunkan Diagnosis Gangguan Mental
dan Sistem Rawatan Diri Stres. Sistem ini menawarkan pengguna dengan set soal
selidik untuk mengukur tekanan, kebimbangan, dan kemurungan. Soal selidik dijana
menggunakan teknik berasaskan peraturan. Di samping itu, kaedah nilai tertimbang
juga digunakan untuk mengira jumlah jawapan daripada pengguna. Jika maklum balas
menunjukkan masalah kesihatan mental yang jelas, para pengguna diberi rawatan diri
tekanan. Juga, sistem ini boleh digunakan setiap saat dan di mana sahaja. Setiap tahun,
lebih daripada tujuh belas juta orang mati akibat penyakit jantung di seluruh dunia.
Penyakit jantung adalah nama umum untuk keadaan dan gangguan yang menjejaskan
jantung dan saluran darah. Ia boleh menyerang mana-mana orang yang sihat tanpa
petunjuk atau tanda, sama ada muda atau tua. Mereka kurang dapat dilihat dan boleh
disemak secara berterusan. Oleh itu kajian ini membangunkan Sistem Ramalan
Jantung. Sistem ini merupakan sistem sokongan pengguna akhir dan sistem
perundingan dalam talian. Ia membolehkan pengguna mendapat bimbingan segera
mengenai isu-isu jantung mereka dengan menjawab set soal selidik tentang penyakit
jantung. Sistem ini meliputi pelbagai gejala penyakit jantung seperti Angina,
Arrhythmia, Fibrillation Atrium, Cardiomyopathy, kegagalan jantung, dan serangan
jantung. menggunakan teknik perlombongan data. Juga, sistem ini boleh digunakan
sepanjang masa dan di mana sahaja

vii
CONTENTS
PAGE
DECLARATION ii
CONFIRMATION iii
DEDICATION Iv
ABSTRACT v
ABSTRAK vi
CONTENTS ix
LIST OF TABLES xii
LIST OF FIGURES xvi
LIST OF ABBREVIATIONS xv
CHAPTER I INTRODUCTION
1.1 Background 1
1.2 Problem statement 1
1.3 Objectives 2
1.4 Scopes 2
1.4.1 User Scope 2
1.4.2 Admin Scope 2
1.5 Expected Results 3
1.6 Limitation of Work 3
1.7 Report Organizing 3
CHAPTER II LITERATURE REVIEW
2.1 Introduction 5
2.2
2.3
Heart Disease
Exists System
5
6

viii
2.4
2.5
Statistical Case-Based Reasoning Expert System:
Application to Medical Diagnosis (Park et al.,
2006)
Decision Support System by Using Multilayer
Perception (Godara & Nirmal, 2010)
7
7
2.6 Rule-Based Concept and Theory 8
2.6.1 Rule Based System in general 9
2.7 Chapter Summary 9
CHAPTER III
METHODOLOGY
3.1 Introduction 11
3.2 Spiral Model 11
3.2.1 Requirement Gathering 12
3.2.2 Planning Phase 12
3.2.3 Analysis phase 13
3.2.4 Iteration Phase 13
3.2.5 Testing and Evaluation 14
3.2.6 Deployment Phase 14
3.3 System Design 14
3.3.1 Framework 14
3.3.2 Context Diagram 15
3.4 Data Flow Diagram Level 0 16
3.4.1 Data Flow Diagram Details Level 0 16
3.4.2 Manage Treatment 18
3.4.4 Manage Symptoms & Recommendation 18
3.4.5 View Record 19
3.5 Data Flow Diagram Level 1 19
3.5.1 Update Symptoms 20
3.5.2 Process Add Symptoms 20
3.5.3 Process Delete Symptoms
3.5.4 Process Update Recommendation
(Treatment and Medication)
20
20

ix
3.5.5 Process Add Recommendation
(Treatment and Medication)
3.5.6 Process Delete Recommendation
(Treatment and Medication)
20
20
3.5.6 Process Delete Recommendation
(Treatment and Medication)
20
3.5.7 Process View Symptoms &
Recommendation (Treatment and Medication)
20
3.6 Entity Relationship Model 21
3.7 Database Modelling
3.7.1 Database Design 22
3.7.1.1. Admin Table 22
3.7.1.2 Table Disease 22
3.7.1.3 Table Treatment 22
3.7.1.4 User Table 22
3.7.1.5 User_Test Table 23
3.7.1.6 User_Profile Table 23
CHAPTER IV
IMPLEMENTATION AND TESTING
25
4.1 Introduction 25
4.2 Homepage 25
4.2.1. Registration for User 26
4.2.2 Pop up 26
4.3 4.3 Login 27
4.3.1 List of Symptoms for User 27
4.3.2 Diagnosis 28
4.3.3 Test History 29
4.3.4 Print Report 29
4.3.5 Change password/ update profile 30
4.3.6 Pop up for update 30
4.4 Admin login
4.4.1 Admin Main Page
31
32
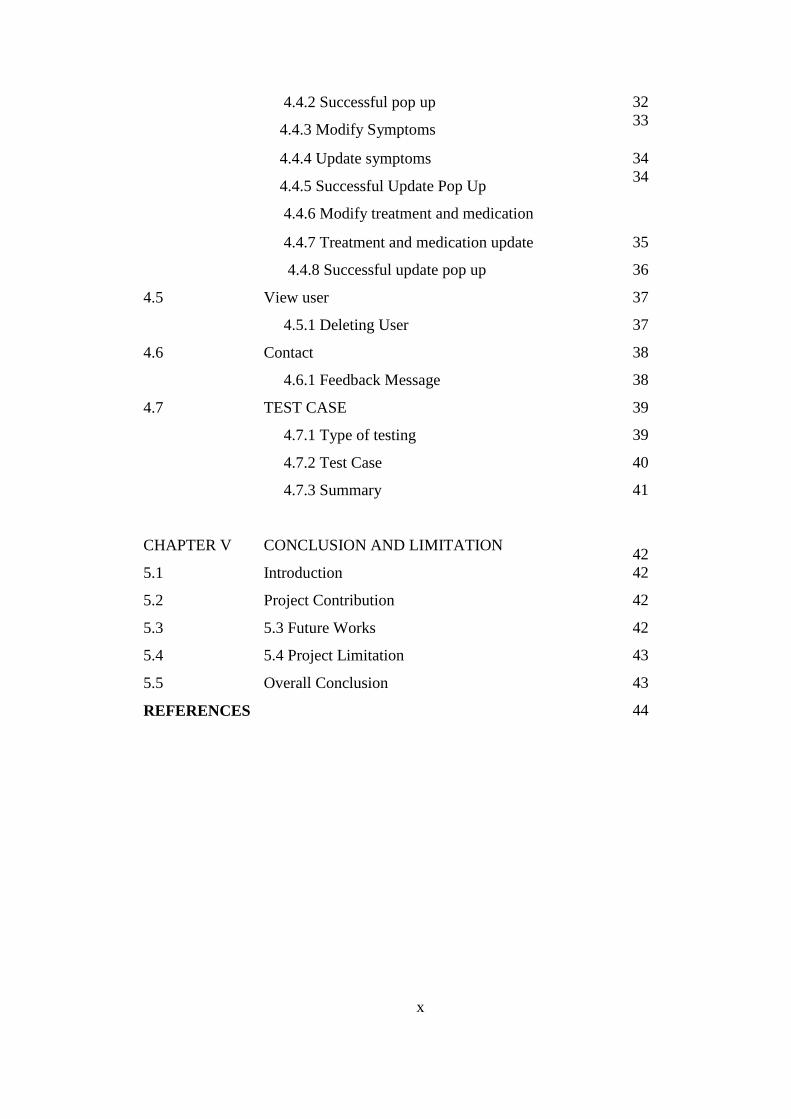
x
4.4.2 Successful pop up
4.4.3 Modify Symptoms
32
33
4.4.4 Update symptoms
4.4.5 Successful Update Pop Up
4.4.6 Modify treatment and medication
34
34
4.4.7 Treatment and medication update 35
4.4.8 Successful update pop up 36
4.5 View user 37
4.5.1 Deleting User 37
4.6 Contact 38
4.6.1 Feedback Message 38
4.7 TEST CASE 39
4.7.1 Type of testing 39
4.7.2 Test Case 40
4.7.3 Summary 41
CHAPTER V
CONCLUSION AND LIMITATION
42
5.1 Introduction 42
5.2 Project Contribution 42
5.3 5.3 Future Works 42
5.4 5.4 Project Limitation 43
5.5 Overall Conclusion 43
REFERENCES 44
xi
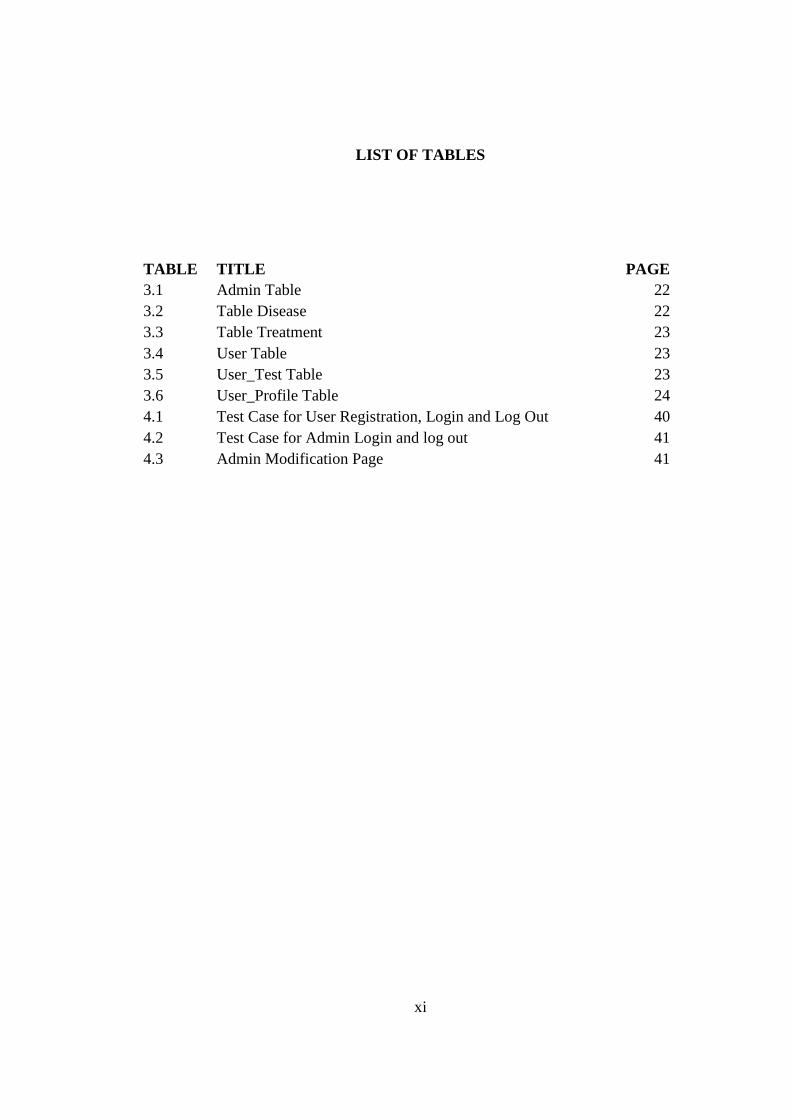
LIST OF TABLES
TABLE TITLE PAGE
3.1 Admin Table 22
3.2 Table Disease 22
3.3 Table Treatment 23
3.4 User Table 23
3.5 User_Test Table 23
3.6 User_Profile Table 24
4.1 Test Case for User Registration, Login and Log Out 40
4.2 Test Case for Admin Login and log out 41
4.3 Admin Modification Page 41

xii
LIST OF FIGURES
FIGURE TITLE PAGE
3.1 The Spiral Model 12
3.2 The Framework 15
3.3 The Context Diagram 16
3.4 The Data Flow level 0 17
3.5 The Data Flow Level 1 19
3.6 The Enhanced Entity Relationship 21
4.1 Homepage Interface 25
4.2 Registration Section 26
4.3 Pop up message 26
4.4 Login Phase 27
4.5 List of Symptoms for User 27
4.6 Diagnose Phase 28
4.7 History Phase 29
4.8 Print Report 29
4.9 Update Profile 30
4.10 Successful Pop-up Update 31
4.11 Admin Login Phase 31
4.12 Admin Update Page 32
4.13 Successful Pop-up Message 33
4.14 Modify Symptom Phase 33
4.15 Symptoms Update 34
4.16 Pop-up Update 34
4.17 Treatment and Medication Modification 35
4.18 Update Treatment/Medication 36
4.19 Successful Pop-up message update 36
4.20 View User/ Delete Phase 37
4.21 Successful Deleted Pop-up 37
4.22 Contact Phase 38
4.23 Feedback Message 38
xiii
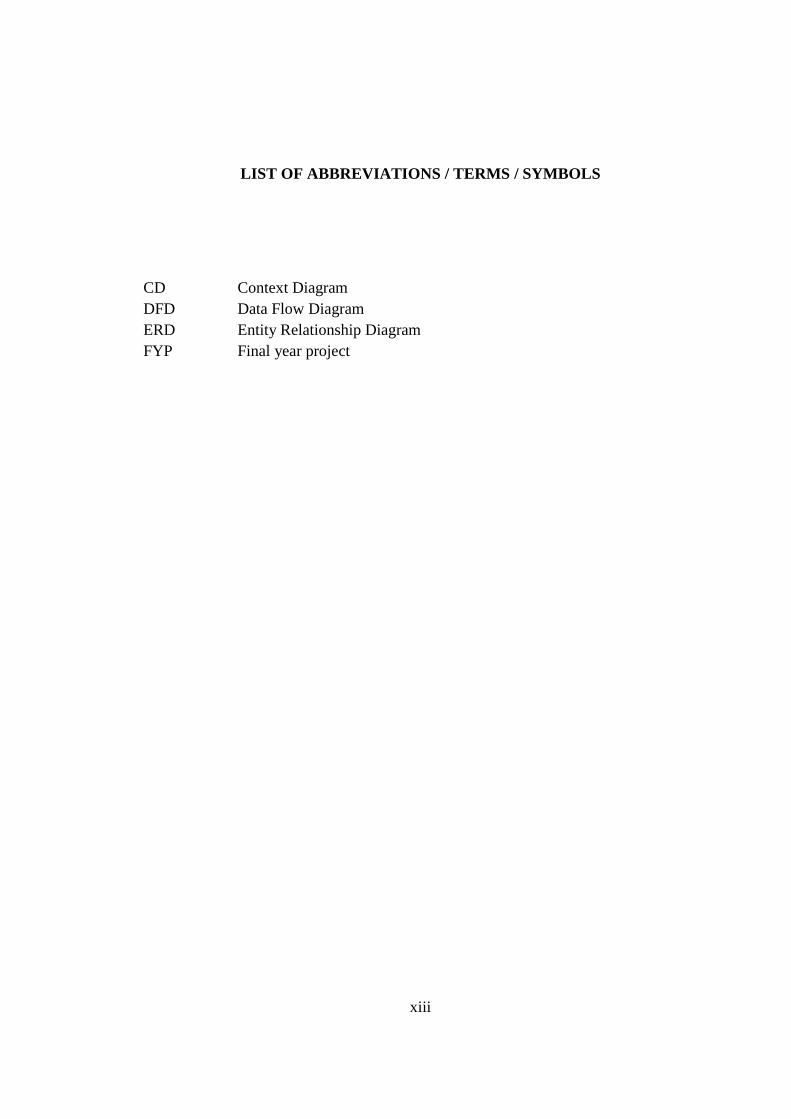
LIST OF ABBREVIATIONS / TERMS / SYMBOLS
CD Context Diagram
DFD Data Flow Diagram
ERD Entity Relationship Diagram
FYP Final year project

xiv
LIST OF APPENDICES
APPENDIX TITLE PAGE
A Ghent Chart 48
1
CHAPTER I
INTRODUCTION
1.1 Background
Heart disease is a general name for a variety of diseases that make the blood vessels to
be at risk. The manifestation of heart disease varies base on the particular types of
such sickness. There is a particular disease that affects the heart structure and
functions known as congenital heart disease as a result of different heart improvement
stage ahead delivery. The heart is meant to be congested when it fails to circulate
adequate blood to the other part of the human physique. There is numerous type of
problems that occur in the heart. That includes a cardiovascular disease that has a
medical term called an ischemic and coronary disease is referred to damage in the
heart that occurs because of a shortage of blood to the heart reduced.
1.2 Problem Statement
Heart disease prediction using data mining is one of the most exciting and challenging
work. The lack of expert and specialists and diagnoses that went high wrongly has
required the demand to develop or create an efficient and fast system for detection.
Without this system, diseases will be diagnosed manually by the doctor, and it will
involve cost and time. This system can identify the probability of the disease based on
the symptoms, then recommend the patients in going to the hospital or get treatment.

2
1.3 Objectives
The objective of a project is defined as the project outcome and how to achieve it. It is
also a supporting act to ensure the goals of the project are accomplished. The
objectives of this system are stated below:
1. To identify the heart disease based on the symptoms count of the patients.
2. To implement rule-based technique algorithm in given the specific symptoms to a
disease
3. To develop a system that can diagnose the patient and tell them the type of diseases
they have for further treatment.
1.4 Scope
The scope is essential to set a boundary on what the system will cover in the system’s
development, such that this will give a transparent platform on what people will
expect from this system when it is established later.
Thus, heart disease Detection Using Rule-Based System is focused on manages the
patient or user who has a heart disease results based on the test. Next, the admin
Expert will give the feedback based on the test or diagnose result. This system will
only interact with two primary users who are Admin and user or patient.
1.4.1 User Scope
i. Register user
ii. Diagnose or test using the rule-based technique
1.4.2 Admin Scope
i. Provide the test result or prediction of possible disease base on symptoms provided
ii. Generate report

3
i. System Login Module
- There is a registration and login access for user and admin to access this system.
ii. Suggestion Module
- The system will give advice and suggestions to the user after they predict disease
and the result are positive.
iii. Domain System
- The result will generate based on the answer from Registered User and analyses it
with the Rule-Based algorithm. i.e. (based on symptoms count)
1.5 Expected Results
This system is expected to give an accurate prediction about the heart disease based on
the symptoms that user have entered or base on the possible chosen symptoms that
have been given. This system also expected to give advice and suggestions to the user
after the prediction of the disease type and allow the user to share their health-related
issues for heart disease.
1.6 Limitation of Work
This system will focus on the prediction of heart disease based on the symptoms
details that have was choosing. This system does not give the decision on how it will
be treated or what so ever, it is just only to predict whether the person has heart
disease or not. The result may not be 100% accurate, but the result from this system
will help the user to quickly take action and alert for the heart disease by seeking
consultant from a doctor or diagnose. Which mean the system does not treat the user
or give medicine.
1.7 Report Organizing
The reports organizing each chapter that have on the report it arranges will refer to the
specific format and it easy for readers to understand the whole of the report. The
report is started with chapter 1 that explains the introduction, problem statement,
objective, and scope limitation of work, expected outcome and project planning. The

4
next chapter 2 explains about the literature review related paper research for the
system development. Then, chapter 3 discussed project methodology and requirement
of software and hardware that guide the system development. Chapter 4 deals with
project design and modelling are the core part of the development process. Lastly,
chapter 4 concludes on the project development.
5
CHAPTER 2
LITERATURE REVIEW
2.1 Introduction
Basically, in this chapter, the study of previous research is done. The associated
journal and articles were analyzed to find out what is the weakness of the previous
research that we can overcome. A research paper related to rule-based has proved to
be a powerful tool for decision-making systems, such as expert and pattern
classification systems. Rule-based has already been used in some medical expert
systems. Heart Disease Prediction System was capable of answering queries that the
conventional decision support systems were not able to. It facilitated the establishment
of vital knowledge, e.g., patterns, relationships amid medical factors connected with
heart disease.
2.2 Heart Disease
Heart disease involves the heart or blood vessels. Heart disease is the second leading
cause of death in the world. We have a different disease which is common. Most
people want to reduce those risk factors. In this case, the factors are:
1. Having diabetes is also a risk for heart disease.
2. Substance abuse such as cocaine
3. Being overweight
4. Smoking
5. High blood pressure increases the risks of and heart failure
6. Excess cholesterol in blood build up inside the walls of heart’s arteries (blood
vessels)

6
The help of people can decrease the disease by taking steps to cube aspect mentioned.
Like checking their blood pressure w the cholesterol level, refraining from smoking
and having enough exercise.
2.3 Exists System
In an existing study experimented on a sample database of patients’ records. The
neural net is tested and trained with 13 input variables such as Age, Blood Pressure,
Angiography’s report and the like. The supervised network has been favored for
diagnosis of heart diseases4. Training was carried out with the aid of backpropagation
algorithm. Whenever feed data that was not known doctor, the system identified the
unknown data from comparisons with the trained data and generated a list of probable
diseases that the patient is liable with. The success rate for imprecise inputs to retrieve
the desired output is closest to 100%.
In another study, the problem of identifying constrained association rules for heart
disease prediction was studied by5. The underlying dataset encompassed medical
records of people having heart disease with attributes for risk factors, heart perfusion
measurements and artery narrowing.
Three constraints were introduced to decrease the number of patterns. First one
necessitates the attributes to appear on only one side of the rule. The second one
segregates attributes into uninteresting groups. The ultimate constraint restricts the
number of attributes in a rule9. Experiments illustrated that the constraints reduced the
number of discovered rules remarkably besides decreasing the running time. Two
groups of rules envisaged the presence or absence of heart disease in four specific
heart arteries.
In 2010 A study was regulated for a prognostic model for the Ischemic Heart Disease
(IHD) The result shows that BPNN and BNN gave the highest classification accuracy
of 78.43 %, while RBF kernel SVM gave the lowest classification accuracy of 60.78
%. BNN presented the best sensitivity of 96.55 %, and RBF kernel SVM displayed the
lowest sensitivity of 41.38 %. Both polynomial kernel SVM and RBF kernel SVM

7
presented the minimum and maximum specificity of 45.45 % and 86.36 %,
respectively.
After reviewing the above pieces of literature, the researcher was motivated to work
on a classification model that is sought to predict heart disease cases based on patterns
generated from International Cardiovascular Hospital database7. This study is
different in two ways from the studies that are presented above; the first one is the
data that is used for this study is collected from transthoracic echocardiography report
of patients and the second one is the classification models are developed on a much
larger dataset. As far as the knowledge of the researcher is concerned this study will
be the first of its kind in Ethiopia that applied data mining to predict heart disease8. In
the medical field, several diagnostic tools for heart disease were developed in different
AI techniques.
2.4 Statistical Case-Based Reasoning Expert System: Application to Medical
Diagnosis (Park et al., 2006)
In the research of those authors, Statistical Case-Based Reasoning (SCBR), this new
knowledge extraction technique suggested in SCBR roles to adopt an optimal number
of neighbors dynamically by considering the distribution of the distances between
cases. It was improved from CBR and SCBR where a selection of the case is based on
the degree of similarity between the potential of neighbors in each other case that was
presented by the authors in this paper. Step one of SCBR was to scale data then learn
the distribution of distances of the database. Then, the authors found out the optimal
cut-off probability threshold by calculation, and the last step is to perform CBR by
selected neighbors and calculate the result.
The database used in this system is the same as the database used in this study. This
system implemented 13 attributes in SCBR to diagnose heart disease and compare the
result with the final attribute (Aha, 1988).

8
2.5 Decision Support System by Using Multilayer Perception (Godara & Nirmal,
2010)
This paper explains the supervised feed-forward neural network and the usage of
backpropagation learning algorithm with momentum term and augmented learning
rate. In this paper, researchers mentioned that data mining had been heavily used in
medical field to include patient diagnosis records to identify the result of the patients.
Multi-layer perception is a branch of a neural network with a supervised learning
algorithm and backpropagation. Researchers also provided the result for comparison
of the accuracy of multi-layer perception and multi-layer perception with digging
approach.
2.6 Rule-Based Concept and Theory
A rule-based system is a set of “if-then” statements that use a set of assertions, to
which are classic example of a rule-based system is the domain-specific expert system
that uses rules to make deductions or choices. For example, an expert system might a
doctor choose the correct diagnosis based on a cluster of symptoms, or select tactical
moves to play a game. In software development, rule-based systems can be used to
create software that will provide an answer to a problem in an expert system. This
type of system may also be called an expert system. Example of Rule-Based Concept:
IF (fever) THEN Malaria
IF (Coldness) THEN Malaria
IF (Throb) THEN Malaria
IF (Sweat) THEN Malaria
IF (Sometimes color of urine is black water fever) THEN Malaria
IF (Headache) THEN Malaria
IF (Vomiting) THEN Malaria
IF (Muscle pain) THEN Malaria
IF (High temperature) THEN Malaria
IF (Diarrhoea) THEN Malaria
IF (Coma (Seizure)) THEN Tuberculosis
IF (Stiff Neck) THEN Tuberculosis

9
IF (Headache) THEN Tuberculosis
IF (Abdominal Pain) THEN Tuberculosis
IF (Weight Pain) THEN Tuberculosis
IF (Fever) THEN Tuberculosis 13
IF (Masses along the neck) THEN Tuberculosis
IF (Draining Sinus) THEN Tuberculosis
IF (Small Reddish brown lesions (face, eyelid, nose, cheek, and ear)) THEN
Tuberculosis
IF (Reddish brown wart-like growth on the body) THEN Tuberculosis
IF (Skin lesions on hand, feet, elbow, and knees) THEN Tuberculosis
IF (Ulcer or abscesses on the Skin) THEN Tuberculosis
IF (Necrosis of infected Skin) THEN Tuberculosis
IF (Stiffness of the affected area) THEN Tuberculosis
IF (Blood present in Urine) THEN Tuberculosis
IF (Painful or uncomfortable Urination) THEN Tuberculosis
IF (Hemoptysis (coughing up blood)) THEN Tuberculosis
2.6.1 Rule Based System in general
Rule-based system is said to be one of the simplest form of artificial intelligence. The
rule based system uses a set of rules as the knowledge representation for knowledge
that is coded into the system. In short, rule-based system tries to mimic the reasoning
of human expert in solving a problem. Rule-based system represent knowledge in a set
of rules that tells the system what to do or what to conclude in different situations
instead of representing knowledge in a declarative, static way as a set of things which
are true.
A rule-based system is a way of encoding a human expert’s knowledge in a Narrow,
specialised domain into an automated system. The system is created by using a Set of
assertions and a set of rules that tells the system how to act on the assertion set. In a
typical ruled-based expert system, a rule consists of several premises.

10
Conclusively, if all the premises are true, then the conclusion is considered true. The
components of a ruled based expert system include the knowledge base, inference
engine, knowledge acquisition component, and explanation system.
2.7 Chapter Summary
This chapter discussed the collection of a literature review that had been reviewed
during the feasibility studies. The literature review helps a developer to discover the
problem of previous research or systems which needs to be overcome in this system
development. Besides that, it also can gain an understanding of the system that
undergoes the development process.

11
CHAPTER 3
METHODOLOGY
3.1 Introduction
The methodology is the process, step or stages used to collect information and data to
make decisions. The methodology is chosen from the life circle of software
development model. The SDLC that will be used for this project is Iterative and
Incremental Model. In this chapter, it will explain more detail about every phase that
involved with this project development. This model has been selected because project
can be developed through cycle of phase. The development of the project is that it
must follow the phase that is a phase at a time. If there is any correction, it can be
done in the middle of the process. Incremental model included five phases which are
requirement analysis, design, implementation and unit testing, integration and system
testing and operation.
3.2 Spiral Model
Spiral Model is a combination of sequential and prototype model. There are specific
activities that are done in one iteration; which is spiral where the output is the small
prototype of the large software. Thus, the same activities are repeated for all the
spirals until the whole software is built. There are six phases involved in the spiral

12
Figure 3.1 The Spiral Model
3.2.1 Requirement Gathering
Requirement gathering is the first step for this methodology for the project. On this
phase, all requirements are gathered together so that all of the needed requirement can
be stated, analyse and process. All the requirements will be analyse if it is suitable to
develop the system. Also on this phase, all the materials that are required have been
prepared.
i. Hardware
Personal Computer (PC)
ii. Software
a) Google Chrome
b) Notepad ++
c) XAMPP
d) Microsoft Office
e) MySQL server Workbench
3.2.2 Planning Phase
In the planning phase cost of building the system, benefit analysis, risk management
plan and feasibility study are included. It has also included the development of the
project planning such as schedules, Gantt Chart that function to plan, organize the
13
report progress for the system within the system environment and system management
plan. The most important in this phase is to develop an overall model while improving
the initial model before continuing to the next phase, an analysis phase.
3.2.3 Analysis phase
This phase includes the task that goes determining the needs and condition require in
order to build the system and to recognize the stakeholders (user) in building the
system. Analysis of user need and requirement the needs and requirement while
determining the main functionality which include creating a detailed of RSS
functional and non-functional requirement of the system.
Collection of data and information for the system is done in this phase. Data gathering
about information of finding the shortest route, djikstra’s algorithm that will be
applied in this system either from journals, articles, books white or research paper.
SWOT analysis also will be done as an early precaution to recognize the weakness of
the system, thus figuring a way to overcome it. All details gather are grouped into sets
and course areas and being broken down as at ask or model for iteration phase.
3.2.4 Iteration Phase
Every design of iteration will be designed in this phase and being built according to
the iteration as planned. Besides that, at each development of iteration some testing
and validation will be done in order to identify whether each development iteration are
in sync with the guidelines set in an earlier phase (planning phase).
3.2.4.1 Design
The first sketch (rough sketch) of iteration is the main challenge in this phase; it’s also
affecting the future of the whole system. The next iteration it will focus more on the
improvement and adoption of technology that are being used by the software feature in

14
which each iteration requires to produce a good model that give the best result for the end
product.
3.2.4.2 Development
This phase is done after the design phase and after all the design and inspection for
each feature are done successfully with a production of a complete function.
3.2.5 Testing and Evaluation
After the code are successfully being built each of its will be test and evaluate to
ensure that all the development meets the requirement of the software specification on
the compatibility and suitability of the architecture on the technology that has been
designed to be implemented.
3.2.6 Deployment Phase
This phase includes the implementation preparation of the system into the production
environment and resolution of problems identified in the integration. Once the system
passes the acceptance test, documentation for describing task on how to function and
maintain the system in production environment includes post implementation and in
process reviews are done.
3.3 SYSTEM DESIGN
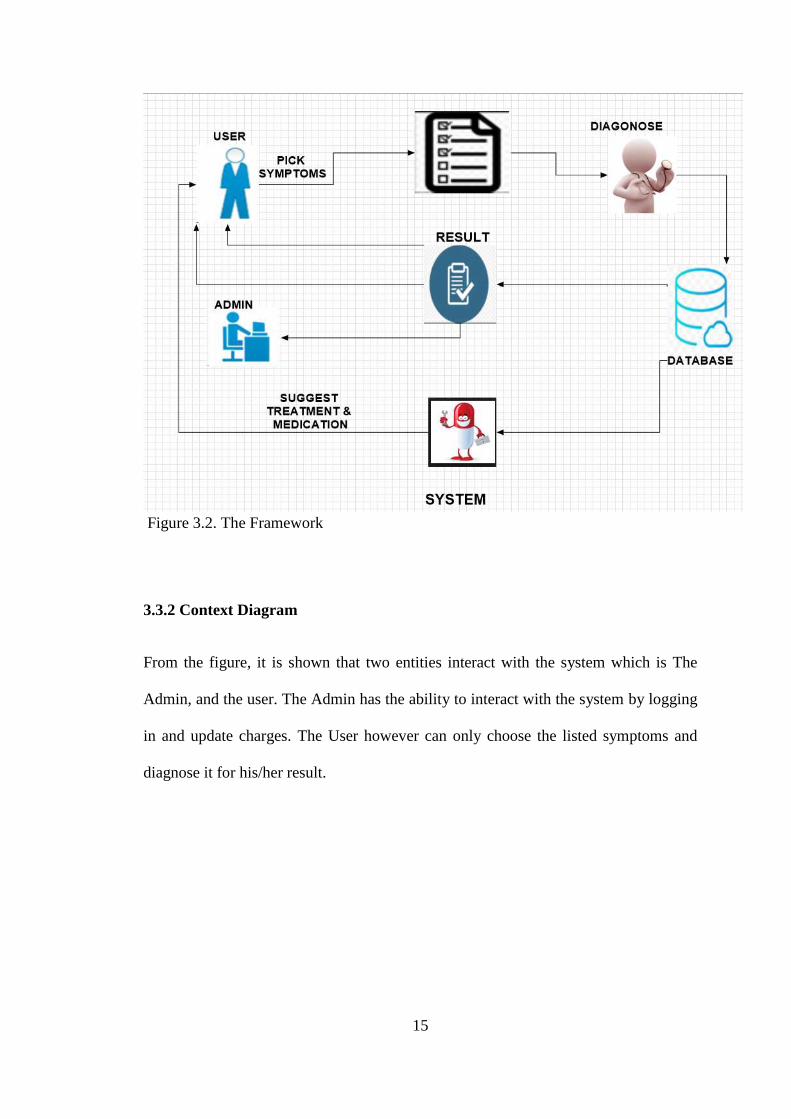
3.3.1 Framework
The figure 3.1 above the framework for the heart Disease Prediction System. The
figure explains how the interaction between system and user occurs. The user will
interact with the user interface and to display results, the system will response and
carries out reasoning whereby the ruled based system provide result.
15
Figure 3.2. The Framework
3.3.2 Context Diagram
From the figure, it is shown that two entities interact with the system which is The
Admin, and the user. The Admin has the ability to interact with the system by logging
in and update charges. The User however can only choose the listed symptoms and
diagnose it for his/her result.

16
Figure 3.3 The Context Diagram
3.4 DATA FLOW DIAGRAM LEVEL 0
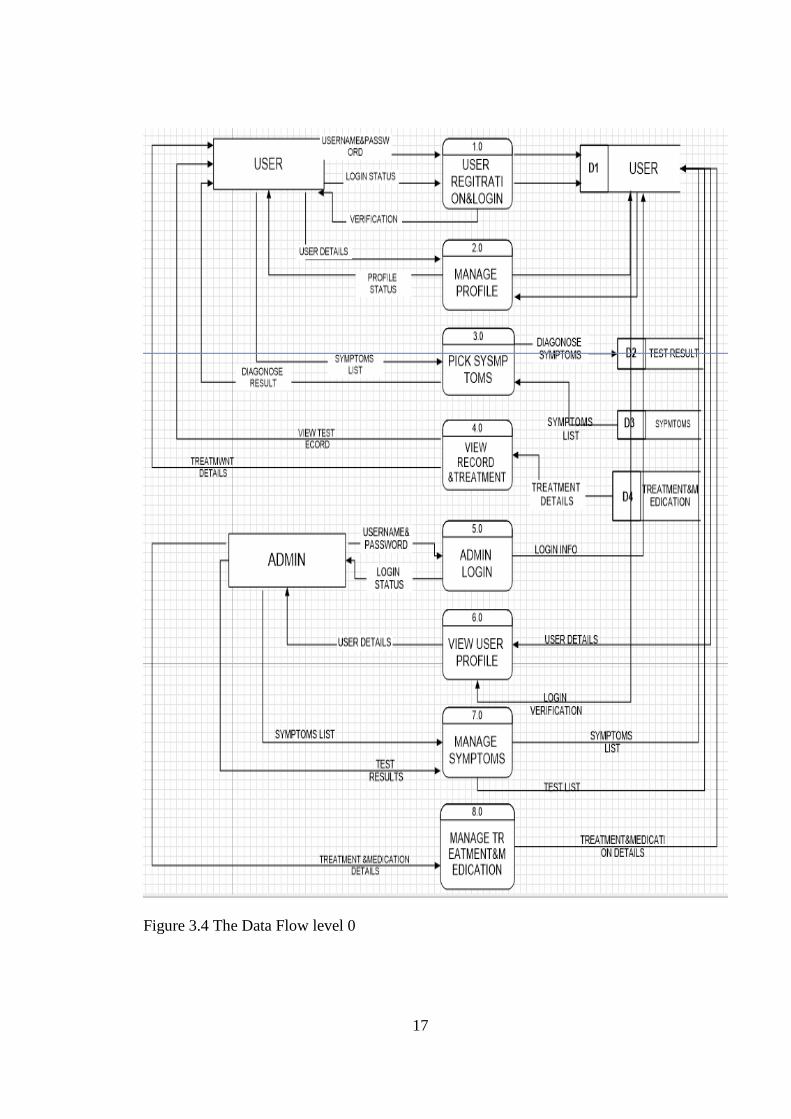
The Data Flow Diagram Level (DFD) in Figure 3.3 shown above shows the whole
system flow. There are currently six processes in this system which is registration
Login, Manage user profile, Manage symptoms, Manage treatment medication and
Manage treatment record. Every Process of the system will interact with their related
table or data store in the database in order to complete the Process.
3.4.1 Data Flow Diagram Details Level 0
3.4.1.1. Process 1.0 User Registration & Login
This module allows the user to register and log in into the system to use the system.
The system has one login page for user and admin. This verification will check in
database to verify which homepage it should head on as user. Password and username
for the user entities will be stored in user table.
17
Figure 3.4 The Data Flow level 0
18
3.4.1.2 Process 2.0 Manage User Profile
This module allows user to view and update their profile, breakdown of this will be
shown in DFD Level 1.
3.4.1.3 Process 3.0 Answer Test
This module allows user to take the symptoms provide by the system to diagnose the
symptoms selected, to know the perfect disease for the selected symptoms.
3.4.1.4 Process 4.0 View Record And Recommendation
This module allows user to view record of test taken by the user and provide
recommendation after the user take the result is show.
3.4.1.5 Process 5.0 Admin Login
This module allows the admin to log in into the system to use the system. The system
has one login page for user and admin. This verification will check in database to
verify which homepage it should head on as user and admin has different interface.
Password and username for the user entities will be stored in user table.
3.4.1.6 Process 6.0 View User Profile
This module allows the admin to view all the user profile and test results, treatment
and medication of all user.
3.4.2 Manage Treatment
This module allows the admin to view all the treatment. The admin is also allowed to
add new treatment and delete treatment from the system.
19
3.4.4 Manage Symptoms & Recommendation
This module allows the admin to change, delete or add the symptoms and
recommendation (see Figure 3.4).
3.4.5 View Record
This module allows the admin to view the record of diagnosed symptoms taken by the
user (see Figure 3.4).
3.5 Data Flow Diagram Level 1
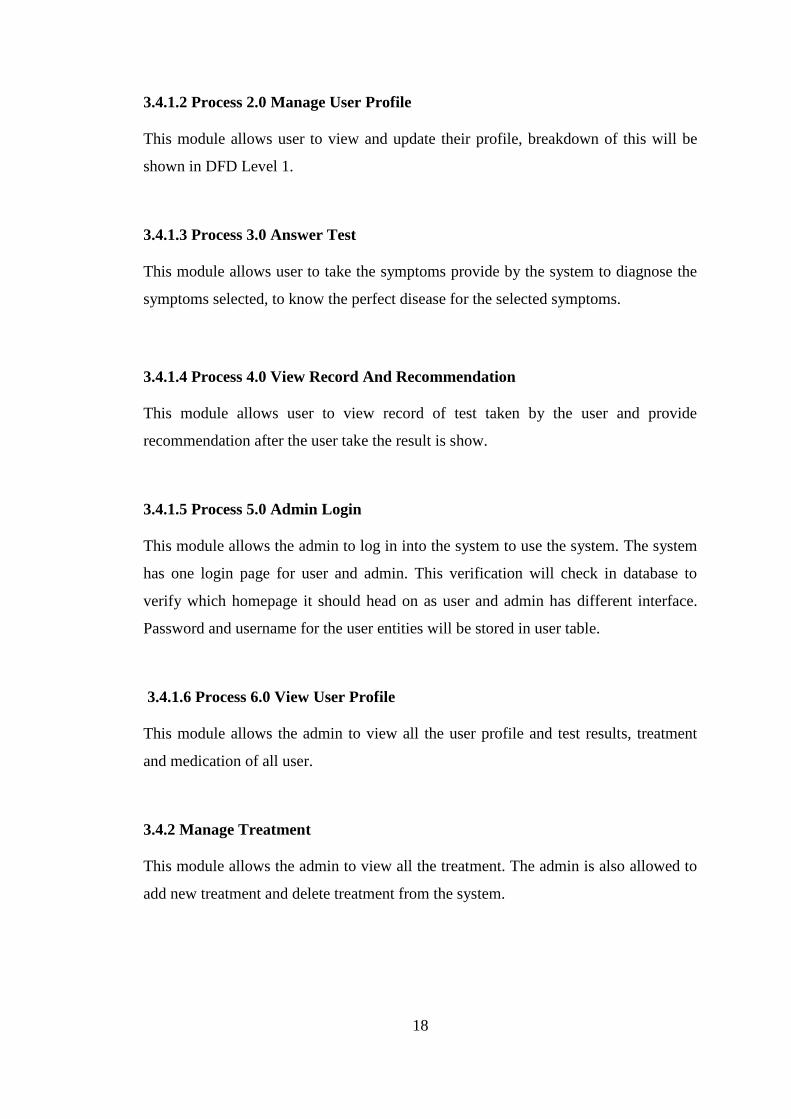
Data Flow Diagram Level 1 shows the system symptoms update view and controlled
by the admin.
Figure 3.5 The Data Flow Level 1

20
3.5.1 Update Symptoms
This module allows admin to update the symptoms. Admin will select which
symptoms to update and update it.
3.5.2 Process Add Symptoms
This module allows admin to add new symptoms in the list of symptoms.
3.5.3 Process Delete Symptoms
This module allows admin choose to remove symptoms from the list. Admin just
select the symptoms from the list and delete it.
3.5.4 Process Update Recommendation (Treatment and Medication)
This module allows admin to update the recommendation.
3.5.5 Process Add Recommendation (Treatment and Medication)
This module allows admin to add new recommendation in the list of recommendation
according to the recommendation prescript by the doctor.
3.5.6 Process Delete Recommendation (Treatment and Medication)
This module allows admin choose to remove recommendation from the list. Admin
just select the recommendation from the list and delete it.
3.5.7 Process View Symptoms & Recommendation (Treatment and Medication)
This module allows admin to view list of symptoms and recommendation

21
3.6 Entity Relationship Model
The entity relationship Model illustrates an information system’s entities and the
relationships between those entities; which is clearly described in the entity relationship
diagram (ERD) as shown in Figure 3.5. ERD composed of three things such as identifying
and defining the entities, determine entities‟ interaction and the cardinality of the
relationship. An entity relationship diagram (ERD) illustrates an information system’s
entities and the relationships between those entities. ERD composed of three things such
as identifying and defining the entities, determine entities interaction and the cardinality
of the relationship.
Figure 3.6 The Enhanced Entity Relationship

22
3.7 Database Modelling
The database is important part which is used to store data in systematically
way and can be accessed by authorized user.
3.7.1 Database Design
3.7.1.1. Admin Table
Table 3.1 shows user that contain Admin. The fields are username and password.
Table 3.1 Admin Table
3.7.1.2 Table Disease
Table 3.2 shows user that contain disease. The fields are ID, symptoms, disease and
status.
Table 3.2 Table Disease
3.7.1.3 Table Treatment
Table 3.3 shows user that contain treatment. The fields are ID, disease, treatment,
medication.

23
Table 3.3 Table Treatment
3.7.1.4 User Table
Table 3.4 shows user that contain users. The fields are surname, othername, address,
email, username, and password.
Table 3.4 User Table
3.7.1.5 User_Test Table
Table 3.5 shows user that contain users_test. The fields are ID, username, password,
disease, treatment, medication.
Figure 3.5 User_Test Table
3.7.1.6 User_Profile Table
Table 3.6 shows user that contain user-profile. The fields are Admin, disease,
treatment, users, users_test, users_profile

24
25
CHAPTER 4
IMPLEMENTATION AND TESTING
4.1 Introduction
This project is implemented as a web-based application using hypertext pre-processor
(PHP) language.
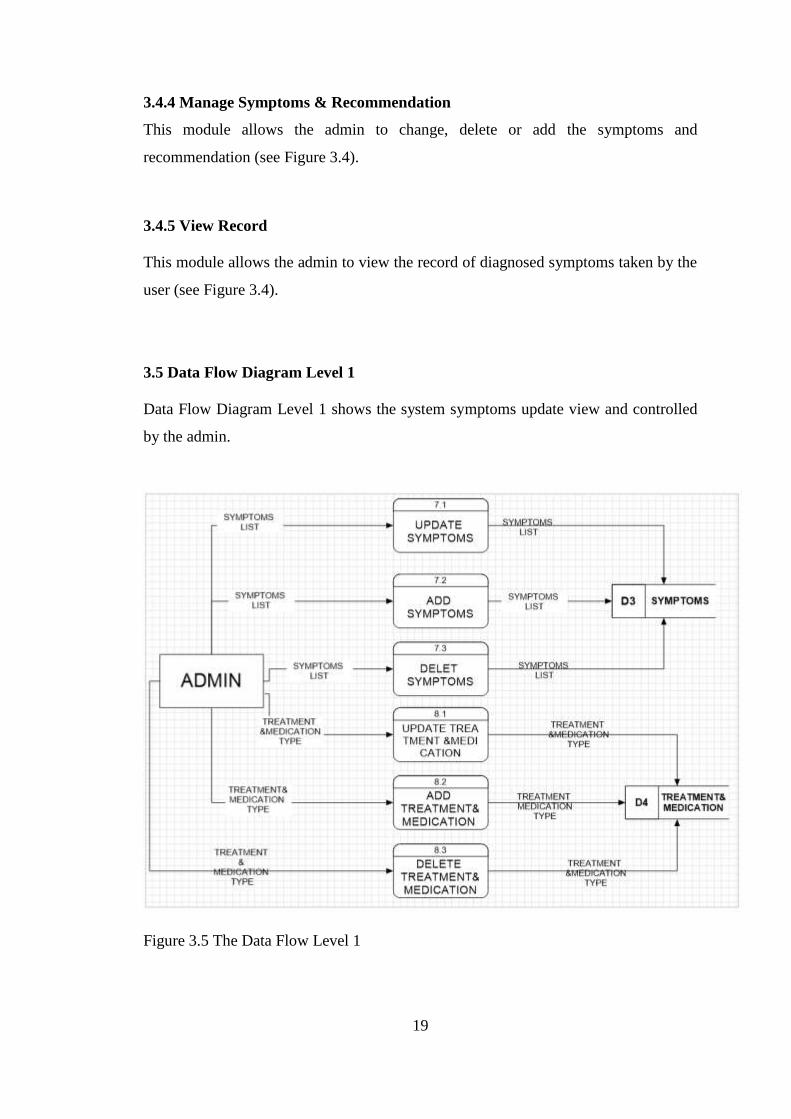
4.2. Homepage
Figure 4.1 shows the interface of the homepage for both the Admin and patient/user. It
also shows some information about the heart which includes structure, function,
diseases, risk factors, symptoms and diagnosis of the heart. It will be very advisable
for the user to read before he/she proceed.
Figure 4.1: Homepage Interface

26
4.2.1. Registration for User
Figure 4.2 shows the registration for the user before they could login to the system
Figure 4.2: Registration Section
4.2.2 Pop up
Figure 4.3 Pop up message after user have registered that say “successfully”
Figure 4.3: Pop up message

27
4.3 Login
Figure 4.4 shows the Login Phase of user login after he/she have registered.
Figure 4.4: Login Phase
4.3.1 List of Symptoms for User
Figure 4.5 shows the interphase after the user login, it will directly go this page where
the user can easily select the symptoms on what he/she is feeling.
Figure 4.5: List of Symptoms for User
28
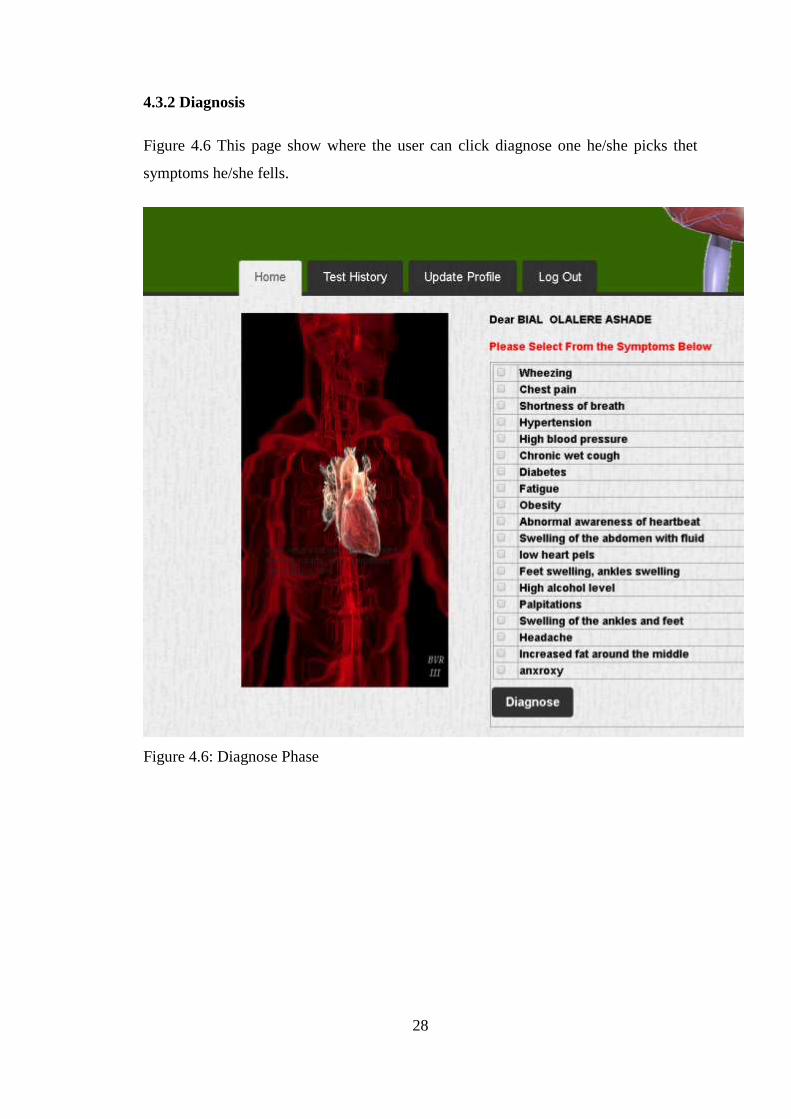
4.3.2 Diagnosis
Figure 4.6 This page show where the user can click diagnose one he/she picks thet
symptoms he/she fells.
Figure 4.6: Diagnose Phase

29
4.3.3 Test History
Figure 4.7 this page shows the test result of the user after he/she have diagnose the
symptoms he/she selected. In the test result there is a treatment and medication for
diagnosed symptoms.
Figure 4.7: Test History Phase
4.3.4 Print Report
Figure 4.8 this page shows the report that that can be pretended after the user have
seen his/her test result, then he/she can print the report out.
Figure 4.8: Print Report

30
4.3.5 Change password/ update profile
Figure 4.9 shows the page where the user can update his/her profile and where he can
also change his/ her password.
Figure 4.9: Update Profile
4.3.6 Pop up for update
Figure 4.10 shows the successful pop up to the user to if an update is been
successfully done on whatever the user which to update.
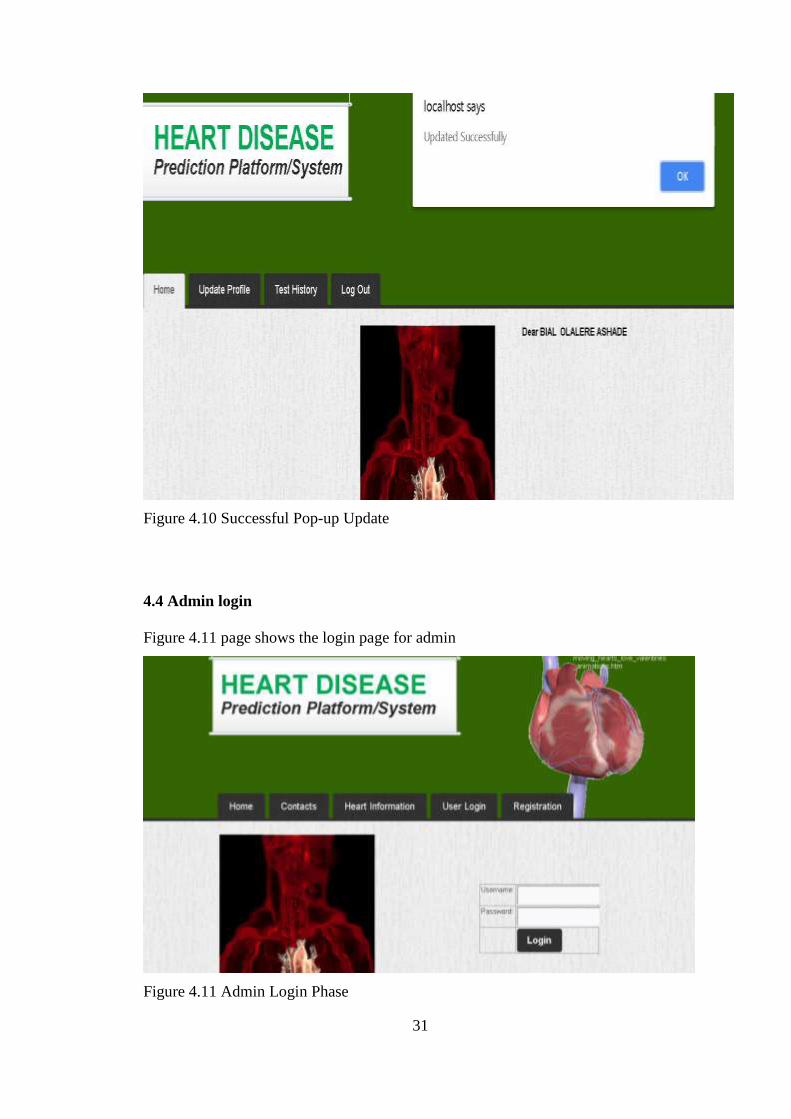
31
Figure 4.10 Successful Pop-up Update
4.4 Admin login
Figure 4.11 page shows the login page for admin
Figure 4.11 Admin Login Phase

32
4.4.1 Admin Main Page
Figure 4.12 shows that the main page for Admin after login, which can update his/her
password. At first the screen will appear to show if the admin wanted to make any
change to his profile, and if any changes were made, admin can click at “Update
button and pop up with massage “Updated successfully” will appear. After update has
been done then he can continue with other processes.
Figure 4.12 Admin Update Page
4.4.2 Successful pop up
Figure 4.13 shows that the admin have updated his/her profile and pop a “successfully
updated” message.
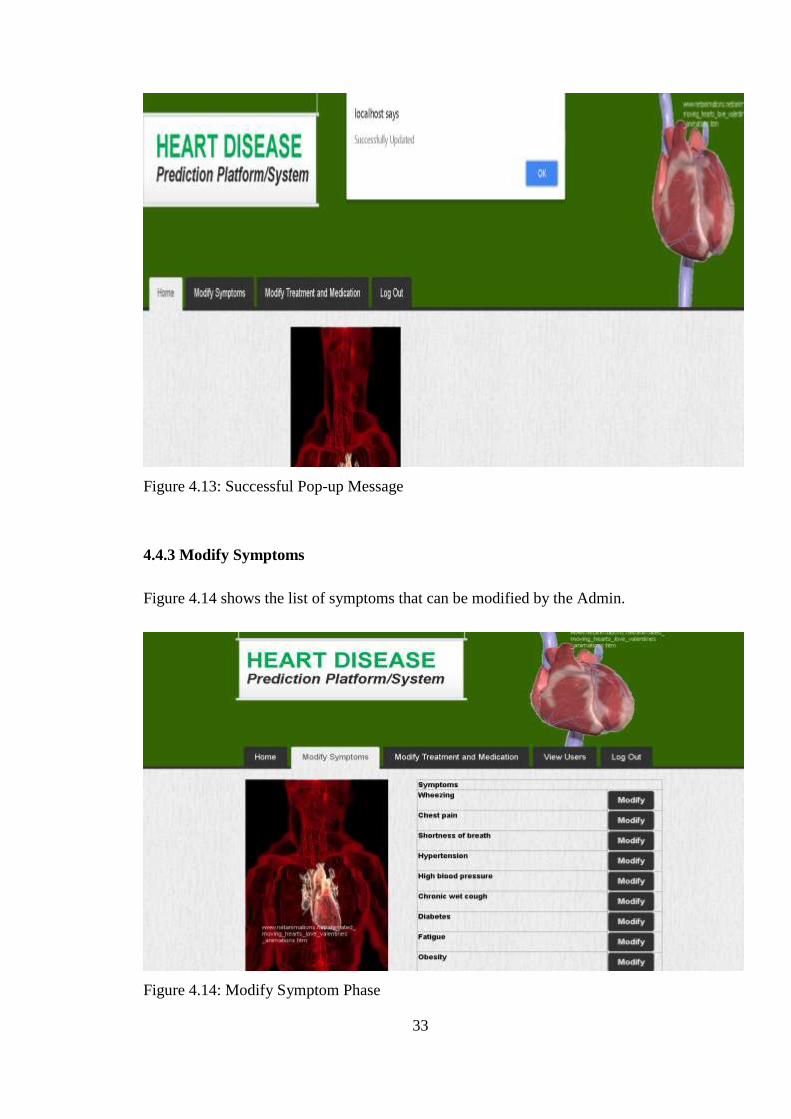
33
Figure 4.13: Successful Pop-up Message
4.4.3 Modify Symptoms
Figure 4.14 shows the list of symptoms that can be modified by the Admin.
Figure 4.14: Modify Symptom Phase

34
4.4.4 Update symptoms
Figure 4.15 shows the update prosse of the symptoms.
Figure 4.15: Symptoms Update
4.4.5 Successful Update Pop Up
Figure 4.16 shows a pop message after an update have been made on the symptoms
table which includes deletion and insertion.
Figure 4.16: Pop-up Update

35
4.4.6 Modify treatment and medication
Figure 4.17 this page shows the list of each disease that can be updated to different
treatment and medication
Figure 4.17: Treatment and Medication Modification
4.4.7 Treatment and medication update
Figure 4.18 shows the process of each modification. This describes how the treatment
and medication is updated

36
Figure 4.18: Update Treatment/Medication
4.4.8 Successful update pop up
Figure 4.19 shows the page of pop up message after the update of the treatment and
medication saying “successfully updated’
Figure 4.19: Successful Pop-up message update

37
4.5 View user
Figure 4.20 show where the admin can view all the user that have used the system, the
list of all user that login to the system. It shows their surname, other name, username
and password. And it is also possible for the admin to delete any user from the list.
4.20: View User/ Delete Phase
4.5.1 Deleting User
Figure 4.21 this page shows the deletion of a user. And also shows the pop up
message that it has been successfully deleted.
4.21: Successful Deleted Pop-up

38
4.6 Contact
Figure 4.22 this page shows the contact form, how the user can contact the admin by
filling the form and sending the admin message through email.
Figure 4.22: Contact Phase
4.6.1 Feedback Message
Figure 4.23 this shows the automatic feedback reply after a message has been sent to
the admin.
Figure 4.23: Feedback Message

39
4.7 TEST CASE
A test case is a set of condition under which a tester will determine whether an
application, software system or one of its features is working as it was originally
established for it to do. The process of doing test case can help to find out problems on
the system requirement. In a test case, it consists of component which describes an
input, action or event and an expected response. All of these are used to determine the
application software system is functioning properly. The table below show the test
case for the several process o the system.
4.7.1 Type of testing
There are three type of testing which are unit testing, integration testing and system
testing. The reason why the system is needed to be tested is that to see whether the
system is fully functioning error free and also to meets the user requirement. For unit
testing, it is needed to verify the functionality of the specific code while integration
testing works on expose defect in the interface and the interaction between
components or between the nodules. Moreover, end-to-end testing tests a completely
integrated system to verify so that it will meet its requirement.
4.7.1.1 Black Box Testing
Black box testing is a testing technique in which to test the functionality of the
software without looking at the internal code structure, implementation details and
knowledge of the internal paths of the software. So we can conclude that this type of
testing is just based on the software requirement and specification by just focusing on
the input and output of the software without bothering the knowledge of the software
program.
4.7.1.2 White Box Testing
White box testing will be focusing on strengthening security, improving design and
usability, the flow of input and output through the application. It will test the software
internal structure or work application. It also involves testing a series of predefine
40
input against the desired output so that when a specific input does not come out as the
expected output, you have encountered a bug. This is because the basic objective of
this testing is that to verify its working flow for an application.
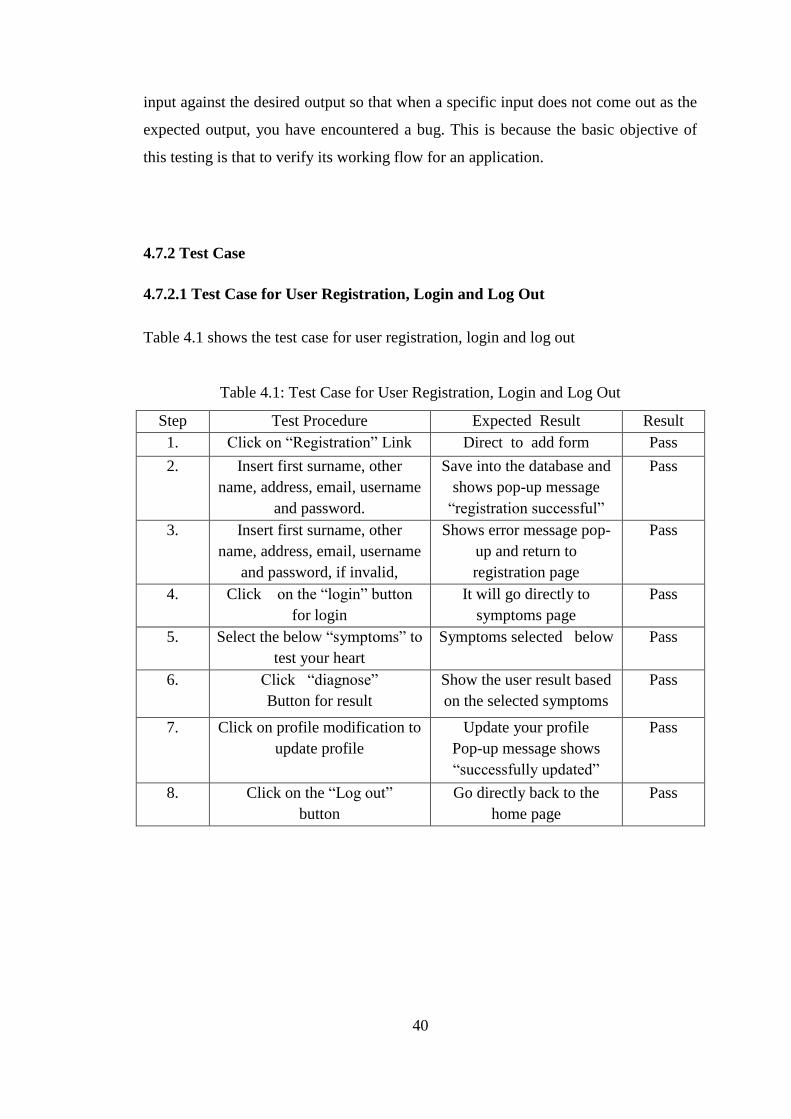
4.7.2 Test Case
4.7.2.1 Test Case for User Registration, Login and Log Out
Table 4.1 shows the test case for user registration, login and log out
Table 4.1: Test Case for User Registration, Login and Log Out
Step Test Procedure Expected Result Result
1. Click on “Registration” Link Direct to add form Pass
2. Insert first surname, other
name, address, email, username
and password.
Save into the database and
shows pop-up message
“registration successful”
Pass
3. Insert first surname, other
name, address, email, username
and password, if invalid,
Shows error message pop-
up and return to
registration page
Pass
4. Click on the “login” button
for login
It will go directly to
symptoms page
Pass
5. Select the below “symptoms” to
test your heart
Symptoms selected below Pass
6. Click “diagnose”
Button for result
Show the user result based
on the selected symptoms
Pass
7. Click on profile modification to
update profile
Update your profile
Pop-up message shows
“successfully updated”
Pass
8. Click on the “Log out”
button
Go directly back to the
home page
Pass

41
4.7.2.2 Test Case for Admin Login and log out
Table 4.2 indicates the test case for admin login and log out
Table 4.2: Test Case for Admin Login and log out
Step Action Expected Result Result
1. Click on the “login” button
for login
It will go directly to symptoms
page
Pass
2. Insert username and password It will go to modification page Pass
3. Click on the “Log out” button Go directly back to the home
page
Pass
4.7.2.3 Admin Modification Page
Table 4.3 explains the admin modification page
Table 4.3 Admin Modification Page
Step Action Expected Result Result
1. Click on profile modification
to update profile
Update your profile Pop-up
message shows “successfully
updated”
Pass
2. Click on symptoms
modification to update
symptoms
Update your symptoms Pop-up
message shows “successfully
updated”
Pass
3 Click on disease modification
to update diseases
Update your disease Pop-up
message shows “successfully
updated”
Pass
4.7.3 Summary
In order to use the platform, the registered user must login into the system first while
unregistered user needs to register.
42
CHAPTER 5
CONCLUSION AND LIMITATION
5.1 Introduction
This section concludes the documentation of this project in the aspect of planning
designing, implementation and testing.
5.2 Project Contribution
Heart disease prediction system was developed base on objective to assist a patient
with having problems with their heart condition. In this case the users of this system
are patients and admin. The rule-base method is implemented in this system to know
the result of a disease that affects a patient vase on a certain symptoms selected a
result will be shown base on the method. The user will be given some
recommendation after the result have been shown. The user will also be advised to see
a doctor where by a report can be printed to show a doctor for special medication or
treatment and maybe a cross check-up for confirmation. In this case the admin will
know if the prediction right, close or wrong.
5.3 Future Works
One of the key features of these types of analysis is that they have the capability to be
extended or modified based on new datasets. First, by accessing a medical record that
has the patients as separate instances, the system can take into account the co
prevalence of more than two diseases to produce a more complex conditional
probability structure, that itself can be used for more sophisticated graphical models
than naive Bayes or ICI. These predictive powers can be combined using an expert
system that can be trained to weight the distances between diseases in each network
and combine them in one single number representing the similarity. Forth, using
timeline in analysis not only can provide the capacity of modelling the dynamic of
emergence and progression of diseases but also helps to identify whether the
43
comorbidity of two diseases is due to a causal relation between them or just a
correlation resulting from mutual risk factors.
5.4 Project Limitation
The system only allowed the patient to test the disease of the heart at early stage based
on Symptoms and travel area. This system also recommends them to go to the
hospital for a blood test and further treatment if the result from test shows a disease
for a certain user. The patient can also contact the admin for help, query, observation
or recommendation related to the system or their heart issues.
5.5 Overall Conclusion
In this project the problem of constraining and summarizing the algorithms of data
rule-base used in the field of disease and medical prediction are discussed. The focus
is on using the algorithms and combinations of several target attributes for intelligent
and effective heart disease prediction using rule base. For predicting heart disease,
significantly 19 attributes symptoms are listed and with basic rule base technique
other approaches like Association Rule The outcome of predictive rule base technique
on the same symptoms reveals that Decision Tree outperforms and sometime
Bayesian classification is having similar accuracy as of decision tree but other
predictive methods like KNN, Neural Networks, Classification based on clustering are
not performing well. The proposed work can be further enhanced and expanded for
the automation of Heart disease prediction. Real data from Health care organizations
and agencies needs to be collected and all the available techniques will be compared
for the optimum accuracy.

44
REFERENCES
Niti Guru, Anil Dahiya, Navin Rajpal 2007 Decision Support System for Heart
Disease Diagnosis Using Neural Network", Delhi Business Review
Frawley and G. Piatetsky -Shapiro 1996 Knowledge Discovery in Databases: An
Overview. AAAI Press/ The MIT Press, Menlo Park, C.A
Heon Gyu Lee, Ki Yong Noh, Keun Ho Ryu 2007:Mining Biosignal Data: Coronary
Artery Disease Diagnosis using Linear and Nonlinear Features of HRV, LNAI 4819:
Emerging Technologies in Knowledge Discovery and Data Mining pp 56-66
Sharma Purushottam, Dr Kanak Saxena, Richa Sharma” Efficient Heart Disease
Prediction System using Decision Tree” in IEEE International Conference on
Computing Communication and Automation (ICCCA-2015), May 2015.
Sellappan Palaniappan, Ra_ah Awang Intelligent Heart Disease Prediction System
Using Data Mining Techniques", IJCSNS International Journal of Computer Science
and Network Security, Vol.8 No.8
Yanwei, X.; Wang, J.; Zhao, Z.; Gao, Y 1997. Combination data mining models with
new medical data to predict outcome of coronary heart disease. Proceedings
International Conference on Convergence Information Technology

45
APPENDICES
APPENDIX A
Ghent Chart
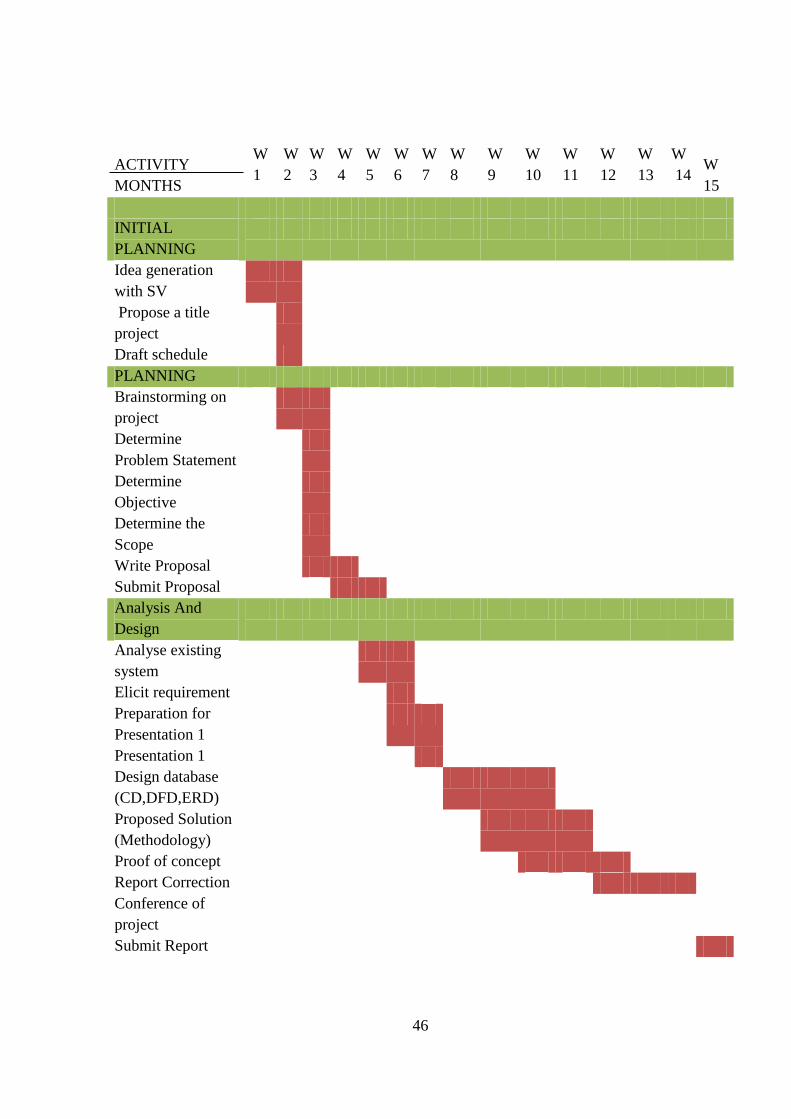
46
ACTIVITY
MONTHS
W
1
W
2
W
3
W
4
W
5
W
6
W
7
W
8
W
9
W
10
W
11
W
12
W
13
W
14 W
15
INITIAL
PLANNING
Idea generation
with SV
Propose a title
project
Draft schedule
PLANNING
Brainstorming on
project
Determine
Problem Statement
Determine
Objective
Determine the
Scope
Write Proposal
Submit Proposal
Analysis And
Design
Analyse existing
system
Elicit requirement
Preparation for
Presentation 1
Presentation 1
Design database
(CD,DFD,ERD)
Proposed Solution
(Methodology)
Proof of concept
Report Correction
Conference of
project
Submit Report

47

48
ACTIVITY
MONTHS
W
1
W
2
W
3
W
4
W
5
W
6
W
7
W
8
W
9
W
10
W
11
W
12
W
13
W
14 W
15
INITIAL PLANNING
Idea generation with
SV
Propose a title project
Draft schedule
PLANNING
Brainstorming on
project
Determine Problem
Statement
Determine Objective
Determine the Scope
Write Proposal
Submit Proposal
ANALYSIS AND
DESIGN
Analyse existing
system
Elicit requirement
Preparation for
Presentation 1
Presentation 1
Design database
(CD,DFD,ERD)
Proposed Solution
(Methodology)
Proof of concept
Report Correction
Conference of project
Submit Report