Asgard archaea illuminate the origin of eukaryotic ... · Asgard archaea illuminate the origin of...
19
00 MONTH 2017 | VOL 000 | NATURE | 1 ARTICLE doi:10.1038/nature21031 Asgard archaea illuminate the origin of eukaryotic cellular complexity Katarzyna Zaremba-Niedzwiedzka 1 *, Eva F. Caceres 1 *, Jimmy H. Saw 1 *, Disa Bäckström 1 , Lina Juzokaite 1 , Emmelien Vancaester 1 †, Kiley W. Seitz 2 , Karthik Anantharaman 3 , Piotr Starnawski 4 , Kasper U. Kjeldsen 4 , Matthew B. Stott 5 , Takuro Nunoura 6 , Jillian F. Banfield 3 , Andreas Schramm 4 , Brett J. Baker 2 , Anja Spang 1 & Thijs J. G. Ettema 1 The origin of the eukaryotic cell is regarded as one of the major evolu- tionary innovations in the history of life on our planet. Yet, the emer- gence of the complex and compartmentalized nature of eukaryotic cells represents a major conundrum in modern biology 1–3 . Most recent insights support symbiogenic scenarios of eukaryotic evolution 3,4 —that the emergence of the first eukaryotic cell was triggered by a merger between an archaeal host cell 5–9 and an alphaproteobacterial (mitochondrial) endosymbiont 10 . Whereas the alphaproteobacterial provenance of mitochondria is overwhelming, the identity and nature of the archaeal host cell have remained elusive until recently. The iden- tification and genomic characterization of Lokiarchaeota, a clade of archaea found in deep marine sediments, has provided several crucial insights into the archaeal origin of eukaryotes 11 . First, phylogenomic analyses of carefully selected genomic data sets placed Lokiarchaeota as the most closely related group to eukaryotes, providing further com- pelling evidence for the two-domain tree of life 12 , in which eukaryotes branch from within the archaeal domain. Furthermore, a careful analy- sis of genome content of the composite Lokiarchaeum genome revealed that it encodes a multitude of genes that were previously regarded specific to eukaryotes 11 . These so-called eukaryotic signature proteins 13 included several cytoskeletal components (actin homologues and gel- solin-domain proteins), ESCRT complex proteins (including ESCRT-I, -II and -III components), and a wide variety of small GTPases 11 , including Gtr/Rag family GTPase orthologues 14,15 —proteins that in eukaryotes are involved in various regulatory processes including cytoskeleton remodelling, signal transduction, nucleocytoplasmic transport and vesicular trafficking. The discovery of Lokiarchaeota has reignited debates about the nature of the archaeal host cell from which eukaryotes emerged. For example, on the basis of analyses of the available lokiarchaeal genome data, inferences have been made about its level of cellular complexity 14,16–19 its membrane composition 20 and its metabolism 21,22 , leading to renewed efforts to explain the origin and early evolution of eukaryotes. Though insightful, these deductions are preliminary as they are based, so far, on a single genomic data set. Here we describe the metagenomic discovery of the Asgard superphylum, which, as well as Lokiarchaeota, includes several new uncultivated archaeal lineages that reside in a wide variety of environments. We show that these lineages comprise novel phylum-level groups that rep- resent the closest archaeal relatives of eukaryotes. Detailed analyses of their reconstructed genomes provide new insights into the identity and genetic nature of the archaeal ancestor of eukaryotes and the primal stages of eukaryogenesis. Metagenomic discovery of Asgard archaea To gain insight into the archaea-to-eukaryote transition, we aimed to identify and characterize novel archaeal lineages related to the recently described Lokiarchaeota 11 , an archaeal clade that was previously shown to be more closely related to eukaryotes than any other prokaryotic lineage. We sampled aquatic sediments from seven geographically separated sites which differed markedly with respect to their biological and chemical parameters: Loki’s Castle, Yellowstone National Park, Aarhus Bay, an aquifer near Colorado River, Radiata Pool, Taketomi Island Vent and the White Oak River estuary (Extended Data Fig. 1a, Supplementary Table 1). Total DNA was extracted from all samples and sequenced, resulting in a total of 644.88 gigabase pairs (Gbp) of paired end reads. Sequence assembly generated a total of 3.28 Gbp of conti- guous sequences (contigs) ≥5 kb (Supplementary Table 2). To assess the presence of potential Lokiarchaeota-related lineages, contigs containing at least six genes of a conserved 15-ribosomal protein (RP15) gene cluster were extracted and subjected to phylogenomic analysis. This analysis revealed the presence of numerous archaeal contigs that were relatively closely related to the previously described Lokiarchaeota 11 The origin and cellular complexity of eukaryotes represent a major enigma in biology. Current data support scenarios in which an archaeal host cell and an alphaproteobacterial (mitochondrial) endosymbiont merged together, resulting in the first eukaryotic cell. The host cell is related to Lokiarchaeota, an archaeal phylum with many eukaryotic features. The emergence of the structural complexity that characterizes eukaryotic cells remains unclear. Here we describe the ‘Asgard’ superphylum, a group of uncultivated archaea that, as well as Lokiarchaeota, includes Thor-, Odin- and Heimdallarchaeota. Asgard archaea affiliate with eukaryotes in phylogenomic analyses, and their genomes are enriched for proteins formerly considered specific to eukaryotes. Notably, thorarchaeal genomes encode several homologues of eukaryotic membrane-trafficking machinery components, including Sec23/24 and TRAPP domains. Furthermore, we identify thorarchaeal proteins with similar features to eukaryotic coat proteins involved in vesicle biogenesis. Our results expand the known repertoire of ‘eukaryote-specific’ proteins in Archaea, indicating that the archaeal host cell already contained many key components that govern eukaryotic cellular complexity. 1 Department of Cell and Molecular Biology, Science for Life Laboratory, Uppsala University, SE-75123 Uppsala, Sweden. 2 Department of Marine Science, University of Texas-Austin, Marine Science Institute, Port Aransas, Texas 78373, USA. 3 Department of Earth and Planetary Sciences, and Department of Environmental Science, Policy, and Management, University of California, Berkeley, California, USA. 4 Section for Microbiology and Center for Geomicrobiology, Department of Bioscience, Aarhus University, DK-8000 Aarhus, Denmark. 5 GNS Science, Extremophile Research Group, Private Bag 2000, Taupo ˉ 3352, New Zealand. 6 Research and Development Center for Marine Biosciences, Japan Agency for Marine-Earth Science and Technology, Yokosuka 237-0061, Japan. †Present address: Department of Plant Systems Biology, VIB and Department of Plant Biotechnology and Bioinformatics, Ghent University, Technologiepark 927, B-9052 Ghent, Belgium. *These authors contributed equally to this work. © 2017 Macmillan Publishers Limited, part of Springer Nature. All rights reserved.
Transcript of Asgard archaea illuminate the origin of eukaryotic ... · Asgard archaea illuminate the origin of...

0 0 M O N T H 2 0 1 7 | V O L 0 0 0 | N A T U R E | 1
ARTICLEdoi:10.1038/nature21031
Asgard archaea illuminate the origin of eukaryotic cellular complexityKatarzyna Zaremba-Niedzwiedzka1*, Eva F. Caceres1*, Jimmy H. Saw1*, Disa Bäckström1, Lina Juzokaite1, Emmelien Vancaester1†, Kiley W. Seitz2, Karthik Anantharaman3, Piotr Starnawski4, Kasper U. Kjeldsen4, Matthew B. Stott5, Takuro Nunoura6, Jillian F. Banfield3, Andreas Schramm4, Brett J. Baker2, Anja Spang1 & Thijs J. G. Ettema1
The origin of the eukaryotic cell is regarded as one of the major evolu-tionary innovations in the history of life on our planet. Yet, the emer-gence of the complex and compartmentalized nature of eukaryotic cells represents a major conundrum in modern biology1–3. Most recent insights support symbiogenic scenarios of eukaryotic evolution3,4—that the emergence of the first eukaryotic cell was triggered by a merger between an archaeal host cell5–9 and an alphaproteobacterial (mitochondrial) endosymbiont10. Whereas the alphaproteobacterial provenance of mitochondria is overwhelming, the identity and nature of the archaeal host cell have remained elusive until recently. The iden-tification and genomic characterization of Lokiarchaeota, a clade of archaea found in deep marine sediments, has provided several crucial insights into the archaeal origin of eukaryotes11. First, phylogenomic analyses of carefully selected genomic data sets placed Lokiarchaeota as the most closely related group to eukaryotes, providing further com-pelling evidence for the two-domain tree of life12, in which eukaryotes branch from within the archaeal domain. Furthermore, a careful analy-sis of genome content of the composite Lokiarchaeum genome revealed that it encodes a multitude of genes that were previously regarded specific to eukaryotes11. These so-called eukaryotic signature proteins13 included several cytoskeletal components (actin homologues and gel-solin-domain proteins), ESCRT complex proteins (including ESCRT-I, -II and -III components), and a wide variety of small GTPases11, including Gtr/Rag family GTPase orthologues14,15—proteins that in eukaryotes are involved in various regulatory processes including cytoskeleton remodelling, signal transduction, nucleocytoplasmic transport and vesicular trafficking. The discovery of Lokiarchaeota has reignited debates about the nature of the archaeal host cell from which eukaryotes emerged. For example, on the basis of analyses of the available lokiarchaeal genome data, inferences have been made about its level of cellular complexity14,16–19 its membrane composition20 and its
metabolism21,22, leading to renewed efforts to explain the origin and early evolution of eukaryotes. Though insightful, these deductions are preliminary as they are based, so far, on a single genomic data set. Here we describe the metagenomic discovery of the Asgard superphylum, which, as well as Lokiarchaeota, includes several new uncultivated archaeal lineages that reside in a wide variety of environments. We show that these lineages comprise novel phylum-level groups that rep-resent the closest archaeal relatives of eukaryotes. Detailed analyses of their reconstructed genomes provide new insights into the identity and genetic nature of the archaeal ancestor of eukaryotes and the primal stages of eukaryogenesis.
Metagenomic discovery of Asgard archaeaTo gain insight into the archaea-to-eukaryote transition, we aimed to identify and characterize novel archaeal lineages related to the recently described Lokiarchaeota11, an archaeal clade that was previously shown to be more closely related to eukaryotes than any other prokaryotic lineage. We sampled aquatic sediments from seven geographically separated sites which differed markedly with respect to their biological and chemical parameters: Loki’s Castle, Yellowstone National Park, Aarhus Bay, an aquifer near Colorado River, Radiata Pool, Taketomi Island Vent and the White Oak River estuary (Extended Data Fig. 1a, Supplementary Table 1). Total DNA was extracted from all samples and sequenced, resulting in a total of 644.88 gigabase pairs (Gbp) of paired end reads. Sequence assembly generated a total of 3.28 Gbp of conti-guous sequences (contigs) ≥ 5 kb (Supplementary Table 2). To assess the presence of potential Lokiarchaeota-related lineages, contigs containing at least six genes of a conserved 15-ribosomal protein (RP15) gene cluster were extracted and subjected to phylogenomic analysis. This analysis revealed the presence of numerous archaeal contigs that were relatively closely related to the previously described Lokiarchaeota11
The origin and cellular complexity of eukaryotes represent a major enigma in biology. Current data support scenarios in which an archaeal host cell and an alphaproteobacterial (mitochondrial) endosymbiont merged together, resulting in the first eukaryotic cell. The host cell is related to Lokiarchaeota, an archaeal phylum with many eukaryotic features. The emergence of the structural complexity that characterizes eukaryotic cells remains unclear. Here we describe the ‘Asgard’ superphylum, a group of uncultivated archaea that, as well as Lokiarchaeota, includes Thor-, Odin- and Heimdallarchaeota. Asgard archaea affiliate with eukaryotes in phylogenomic analyses, and their genomes are enriched for proteins formerly considered specific to eukaryotes. Notably, thorarchaeal genomes encode several homologues of eukaryotic membrane-trafficking machinery components, including Sec23/24 and TRAPP domains. Furthermore, we identify thorarchaeal proteins with similar features to eukaryotic coat proteins involved in vesicle biogenesis. Our results expand the known repertoire of ‘eukaryote-specific’ proteins in Archaea, indicating that the archaeal host cell already contained many key components that govern eukaryotic cellular complexity.
1Department of Cell and Molecular Biology, Science for Life Laboratory, Uppsala University, SE-75123 Uppsala, Sweden. 2Department of Marine Science, University of Texas-Austin, Marine Science Institute, Port Aransas, Texas 78373, USA. 3Department of Earth and Planetary Sciences, and Department of Environmental Science, Policy, and Management, University of California, Berkeley, California, USA. 4Section for Microbiology and Center for Geomicrobiology, Department of Bioscience, Aarhus University, DK-8000 Aarhus, Denmark. 5GNS Science, Extremophile Research Group, Private Bag 2000, Taupo 3352, New Zealand. 6Research and Development Center for Marine Biosciences, Japan Agency for Marine-Earth Science and Technology, Yokosuka 237-0061, Japan. †Present address: Department of Plant Systems Biology, VIB and Department of Plant Biotechnology and Bioinformatics, Ghent University, Technologiepark 927, B-9052 Ghent, Belgium.* These authors contributed equally to this work.
© 2017 Macmillan Publishers Limited, part of Springer Nature. All rights reserved.

2 | N A T U R E | V O L 0 0 0 | 0 0 M O N T H 2 0 1 7
ARTICLERESEARCH
and Thorarchaeota23 phyla, but we also identified several sequences that were only distantly related but still part of the same archaeal clade (Fig. 1a). We decided to name this archaeal clade Asgard, after the realm of the gods in Norse mythology. Apart from Lokiarchaeota- and Thorarchaeota-related lineages, we could define two additional candidate phyla in the Asgard clade, which we hereafter refer to as Odinarchaeota and Heimdallarchaeota (Supplementary Table 3, Supplementary Discussion 1). Whereas contigs from Odinarchaeota were exclusively identified in hot spring metagenomes (Yellowstone National Park and Radiata Pool), contigs from Heimdallarchaeota were detected in marine sediments (Loki’s Castle and Aarhus Bay; Fig. 1a).
To analyse the genomic content and evolutionary history of these novel Asgard lineages, contigs were binned into metagenome- assembled genomes on the basis of their tetra-nucleotide sequence frequencies and DNA sequence coverage patterns across samples
(Extended Data Fig. 1b, Supplementary Discussion 2). We recon-structed near-complete genome bins for representatives of each major Asgard clade (Fig. 1a, Extended Data Table 1). Analysis of the small subunit rRNA genes identified in these genome bins revealed that Asgard archaea are present in sediments of a wide variety of anaerobic environments (Extended Data Fig. 1c). In contrast to Lokiarchaeota, which are relatively abundant and mostly present in marine sediments, relatives of Heimdall-, Odin- and Thorarchaeota seem to represent low-abundance community members based on 16S rRNA gene surveys (Extended Data Fig. 1c). In accordance with the above-mentioned RP15 analyses, Odinarchaeota seem to be almost exclusively present in high-temperature habitats (97.5% of all available 16S rRNA gene sequences). Moreover, we found that the 16S rRNA sequence of the Heimdallarchaeota genome bin from Aarhus Bay is closely related to the ancient Archaea group (AAG)24.
a
0.1
Lokiarchaeum
sp. G
C14_75
Odinarchaeote LCB_4
Heimdallarchaeote AB_125
Thorarchaeote WOR_83
Heimdallarchaeote LC_3
Thorarchaeote AB_25
Heimdallarchaeote LC_2
Thorarchaeote WO
R_45
Lokiarchaeote CR
_4
LCLCBCRWORRPAB, 0.25 m.b.s.f.AB, 0.5 m.b.s.f.AB, 1.25 m.b.s.f.AB, 1.75 m.b.s.f.
b
c0.3
Thorarchaeote WOR_83
Odinarchaeote LCB_4
Bathyarchaeota
Lokiarchaeum sp. GC14_75
Thorarchaeote AB_25
Korarchaeota
Aigarchaeota
Heimdallarchaeote LC_3
Heimdallarchaeote AB_125
Euryarchaeota
Odinarchaeote RP_19
Thaumarchaeota
Heimdallarchaeote LC_2
Lokiarchaeote CR_4
Crenarchaeota
91
74
100
100100
82
84
100
100
87
42
100
46
100
85
28
52
97
100
4194100
Eukarya
0.2
Heimdallarchaeote LC_2
Lokiarchaeum sp. GC14_75
Aigarchaeota
Heimdallarchaeote LC_3
Thorarchaeote WOR_45
Thaumarchaeota
Crenarchaeota
Odinarchaeote LCB_4
Eukarya
Korarchaeota
Thorarchaeote WOR_83
Lokiarchaeote CR_4
Heimdallarchaeote AB_125
Bathyarchaeota
Thorarchaeote AB_25
1
10.94
1
1
1
1
1
0.99
0.541
0.99
1
10.98
1
0.77
0.94
TACK
d
Lokiarchaeum sp. GC14_75
Lokiarchaeote CR_4
Odinarchaeote LCB_4
Thorarchaeote AB_25
Thorarchaeote WOR_45
Thorarchaeote WOR_83
Heimdallarchaeote AB_125
Heimdallarchaeote LC_2
Heimdallarchaeote LC_3
Information processing
Cell division/cytoskeleton
DN
A po
lym
eras
e, ε-
like
Topo
isom
eras
e IB
RN
A po
lym
eras
e, A
fuse
d
RN
A po
lym
eras
e, s
ubun
it G
(rpb
8)
Rib
osom
al p
rote
in L
22e
Rib
osom
al p
rote
in L
28e/
Mak
16Tu
bulin
s*
Actin
-rel
ated
pro
tein
(AR
P-lik
e)
Con
serv
ed lo
kiac
tins
Gel
solin
-dom
ain
prot
ein
Pro�
lin
Endosomal sorting
Ubiquitin system
Traf�cking machinery
Ostcomplex
ARP
2/3
com
plex
, sub
unit
4-lik
e
ESC
RT-
I: st
eadi
ness
box
dom
ain
ESC
RT-
I: Vp
s28-
like
ESC
RT-
II: V
ps25
-like
ESC
RT-
II: E
AP30
dom
ain
ESC
RT-
III: V
ps2/
24/4
6-lik
e
ESC
RT-
III: V
ps20
/32/
60-li
ke
Ubi
quiti
n-do
mai
n pr
otei
n
Ubi
quiti
n-ac
tivat
ing
E1 c
andi
date
s
E2-li
ke u
biqu
itin
conj
ugat
ing
prot
ein
Expa
nsio
n of
sm
all G
TPas
es
Long
in-d
omai
n pr
otei
n
Euka
ryot
ic R
LC7
fam
iliy p
rote
in
TRAP
P-do
mai
n pr
otei
n
Sec2
3/24
-like
pro
tein
WD
40–A
rmad
illo g
ene
clus
ter
Arre
stin
-dom
ain
Rib
opho
rin I
OST
3/O
ST6-
like
STT3
-like
Hei
md
alla
rcha
eota
Lokiarchaeota
Odi
narc
haeo
ta
Thorarchaeota
Figure 1 | Identification and phylogenomics of Asgard archaea. a, Maximum-likelihood tree, inferred with RAxML and PROTCATLG model, based on metagenomic contigs containing conserved ribosomal proteins (see Methods) revealing the Asgard superphylum. Slow, non-parametric maximum-likelihood bootstrap support values above 50 and 90 are indicated with empty and filled circles, respectively. Abbreviations of the sites mentioned are as follows: LC, Loki’s Castle; CR, Colorado River aquifer (USA); LCB, Lower Culex Basin (Yellowstone National Park, USA); WOR, White Oak River (USA); AB: Aarhus Bay (Denmark); RP, Radiata Pool (New Zealand); m.b.s.f., metres below sea floor. b, c, Bayesian inference of 55 concatenated archaeo-eukaryotic ribosomal proteins inferred with PhyloBayes and CAT-GTR model (b) and maximum-likelihood analysis of concatenated small and large subunit rRNA gene
sequences inferred with RAxML and GTRGAMMA model (c) showing high support for the phylogenetic affiliation between Asgard archaea and eukaryotes (support values in red). a–c, Scale bars indicate number of substitutions per site. Numbers at branches refer to Bayesian posterior probabilities (b) and slow non-parametric maximum-likelihood bootstrap values (c). Trees were rooted with Euryarchaeota + DPANN (a, b) and with Bacteria (c). Branch length value corresponding to cut branch in c is 0.6769. d, Schematic tree of Asgard lineages and corresponding overview of identified ESPs. Black circles, ESP predicted based on presence of arCOG, (TopoIB, rpb8, RNA polymerase) or IPR domain (all others); grey circles, putative ESP homologues present; empty circles, no ESP homologue identified (Extended Data Table 2). * Most Asgard genomes encode distantly related FtsZ homologues (Supplementary Discussion 3).
© 2017 Macmillan Publishers Limited, part of Springer Nature. All rights reserved.

0 0 M O N T H 2 0 1 7 | V O L 0 0 0 | N A T U R E | 3
ARTICLE RESEARCH
Asgard archaea and eukaryotes share a common ancestryTo carefully determine the phylogenetic position of the novel Asgard lineages in relation to other Archaea and to eukaryotes, we performed various in-depth phylogenomic analyses of concatenated rRNA gene and conserved marker protein sequence datasets. Resolving the phy-logenetic position of such deep evolutionary splits in the tree of life is extremely difficult as the nature of sequence evolution can poten-tially invoke a number of phylogenetic artefacts25. First of all, it is challenging to select appropriate markers since vertically inherited genes shared by evolutionary distantly related lineages are generally limited. Furthermore, while a broad sampling of representative taxa is important, computational feasibility limits the dataset size that can be analysed with current methods. Inclusion of distantly related taxa is known to cause phylogenetic artefacts (such as long branch attraction) and it is therefore important to employ phylogenetic approaches that can adequately account for mutational saturation (resulting in loss of evolutionary signal) and unequal mutation rates across different sites over time and between different taxa (that is, heterotachy and compo-sitional bias, respectively).
To address these challenges, we based our analyses on a carefully selected set of taxa and genetic markers and employed phylogenetic approaches that capture heterogeneity of the evolutionary process26, as well as data treatments (amino acid recoding) designed to deal with mutational saturation and model violations (see Methods for details; Supplementary Discussion 3). We performed phylogenomic analyses on three different concatenated datasets, comprising 16S and 23S rRNA genes, universally conserved marker genes, and an extended set of ribo-somal (r-) proteins that, in addition to universal r-proteins, includes r-proteins only shared between archaea and eukaryotes. This latter set was used to assess potential artefacts resulting from distant outgroup rooting (Supplementary Discussion 3).
By assessing variations in gene/protein datasets, alignment trim-ming settings, taxon selection, amino acid recoding, removal of biased positions and phylogenetic inference methods, we deter-mined a robust phylogenetic affiliation between Asgard lineages and eukaryotes (Supplementary Tables 4 and 5). Throughout all analyses Asgard archaea formed a well-supported monophyletic group within archaea that emerged as sister group to the TACK superphylum and comprised four distinct archaeal clades (Fig. 1b, c and Extended Data Fig. 2). We propose a phylum level status for Loki-, Thor-, Odin- and Heimdallarchaeota, and superphylum status for Asgard (Supplementary Table 3, Supplementary Discussion 1). Importantly, our phylogenomic analyses placed eukaryotes inside the Asgard superphylum, with high support for the concatenated r-proteins (posterior probability (PP) = 1; Fig. 1b), and conserved marker pro-teins (PP = 0.95; Extended Data Fig. 2), as well as for the rRNA gene dataset (bootstrap support (BS) = 91; Fig. 1c). Notably, the majority of the converged (maxdiff < 0.3) Bayesian phylogenetic analyses link eukaryotes to Heimdallarchaeota as the closest branching clade, albeit with insignificant support values (PP = 0.77 in Fig. 1b; BS = 28–42 in Fig. 1c; PP = 0.77 in Extended Data Fig. 2; Supplementary Table 4, Supplementary Discussion 3). Hence, while the phylogenetic affili-ation between Asgard archaea and eukaryotes is strong, our analy-ses failed to resolve the exact position of eukaryotes relative to the Asgard superphylum (either as a sister group or nested within), or the positions of Asgard phyla relative to each other (Supplementary Tables 4–6). Several reasons could potentially explain this lack of phylogenetic resolution, but we suspect that an improved taxon availability of Asgard lineages could further resolve this problem (Supplementary Discussion 3).
Eukaryotic signatures in Asgard genomesNext, to gain further insight into the emergence of eukaryotic gene content, we identified potential eukaryotic signature proteins (ESPs) in the reconstructed Asgard genomes. Notably, all Asgard lineages were found to be enriched for such ESPs, suggesting that these are
widespread across the Asgard superphylum (Extended Data Table 2, Supplementary Tables 7 and 8). ESPs identified in the new Asgard genomes previously identified in the composite Lokiarchaeum genome11,14 included an expanded set of GTPases (Extended Data Fig. 3, Supplementary Table 8), eukaryotic RLC7 family proteins (Supplementary Fig. 1), actin homologues (Supplementary Fig. 2), gel-solin-domain proteins, components of eukaryotic ESCRT (I, II and III) systems including two sub-families of SNF7 proteins (Supplementary Fig. 3), ubiquitin modifier system components (Supplementary Fig. 4) and homologues of eukaryotic protein translocation and glycosylation pathways (Extended Data Table 2, Extended Data Fig. 4). Notably, in the genomes of Heimdallarchaeote AB_125 and Odinarchaeote LCB_4, genes encoding ESCRT and ubiquitin modifier system components are co-organized in the same gene cluster (Extended Data Fig. 5). This observation supports the proposal that these systems might be involved in ESCRT-mediated protein degradation11, a pathway previously only known in eukaryotes27. Yet, the fact that the ubiquitin modifier system is absent from thorarchaeal genomes suggests that these ESCRT pro-teins could be associated with alternative functions, or that these latter archaea have a different mechanism for cargo recognition.
We identified several new eukaryotic signatures in Asgard lineages that were not previously detected in the composite Lokiarchaeum genome. These newly identified ESPs comprise a functionally diverse set of proteins that generally display a punctuated distribution across Asgard archaea. Remarkably, we identified a bona fide tubulin ortho-logue in members of the Odinarchaeota (Extended Data Fig. 6a) that is more closely related to eukaryotic tubulins than those previously reported in Thaumarchaeota (artubulins)28. This finding, together with the identification of conserved ‘lokiactins’ (Supplementary Fig. 2), gelsolin- and profilin-domain proteins and homologues of subunit 4 of the ARP2/3 complex in different lineages (Extended Data Table 2, Supplementary Table 7, Supplementary Discussion 4), indicates that Asgard archaea contain sophisticated cytoskeletal machineries, with orthologues of key cytoskeletal components in eukaryotes. In addition, the newly identified ESPs include proteins with information processing functions, such as the putative homologues of the ε DNA polymer-ase subunit (Extended Data Fig. 6b, c) and of ribosomal protein L28e/Mak16 (Extended Data Fig. 6d), both of which were identified in the genome of Heimdallarchaeote LC_3. While the ε -like DNA polymer-ase of Heimdallarchaeote LC_3 represents the closest homologue of eukaryotic ε DNA polymerases found so far and contains one of two characteristic C-terminal zinc-fingers, it lacks a domain of unknown function (PF08490) that is present in all eukaryotic ε DNA polymer-ases (Extended Data Fig. 6c) and may be derived from an additional inactivated PolB29 (Supplementary Discussion 4). This suggests that this domain was recruited later in eukaryotic evolution, perhaps after the acquisition of the mitochondrial endosymbiont.
Furthermore, some ESPs previously found in TACK archaea (which are related to Asgard) but absent from the Lokiarchaeum genome, were identified in some Asgard lineages (Fig. 1d), including homologues of the G subunit of the RNA polymerase (Rpb8) in Odinarchaeota and Heimdallarchaeote LC_3, of topoisomerase IB in Thorarchaeota and of a fused RNA polymerase A in Heimdallarchaeote LC_3 (but see Supplementary Discussion 4, Supplementary Fig. 5a, b).
Identification of membrane-trafficking componentsGenerally, many of the Asgard ESPs were functionally assigned to intracellular trafficking and secretion (Extended Data Fig. 7, Supplementary Discussion 4). A close inspection of these ESPs revealed that Thorarchaeota genomes uniquely encode several homologues of eukaryotic proteins involved in membrane-trafficking processes. We found that each thorarchaeal genome encoded proteins belonging to two orthologous protein families with domain signatures of the eukar-yotic TRAPP complex. In eukaryotes, TRAPP complexes represent multi-subunit vesicle-tethering factors that are involved in various trafficking activities, including endoplasmic reticulum to Golgi and
© 2017 Macmillan Publishers Limited, part of Springer Nature. All rights reserved.

4 | N A T U R E | V O L 0 0 0 | 0 0 M O N T H 2 0 1 7
ARTICLERESEARCH
trans-Golgi transport30. The genes encoding thorarchaeal TRAPP domain proteins are part of a gene cluster that also encodes a protein with a more distantly related V4R domain, which is present in both archaeal and bacterial genomes (Fig. 2a). Phylogenetic analyses of the thorarchaeal TRAPP domain proteins revealed that they form a mono-phyletic group with eukaryotic TRAPPC3 (Bet3 family), TRAPPC5 and TRAPPC6 family proteins. This indicates that the thorarchaeal homo-logues are more closely related to eukaryotic TRAPP proteins than any of the V4R domain proteins previously detected in prokaryotes, including those of Lokiarchaeum and Ignicoccus hospitalis (Fig. 2b)14,31. These findings, which are also supported by protein structure predic-tion analyses (Fig. 2a, Supplementary Table 9), underline the archaeal ancestry of eukaryotic TRAPP family proteins C3, C5 and C631.
In addition, thorarchaeal genomes encode homologues of eukar-yotic Sec23/24 family proteins, which are essential components of COPII, a protein complex responsible for vesicle-mediated ER-to-Golgi transport of protein cargo32. Protein domain and structure prediction analysis of these thorarchaeal Sec23/24 homologues indicate that they
contain the zinc-finger, trunk and β -sandwich domains of eukaryotic Sec23/24 family proteins, but lack the C-terminal helical and gelsolin domains (Fig. 2c). The basal position of the thorarchaeal Sec23/24 homologues relative to their eukaryotic counterparts in phylogenetic analyses suggests an archaeal ancestry of the eukaryotic proteins (Fig. 2d). During eukaryotic COPII-mediated vesicle biogenesis, Sec23 and Sec24 function as GTPase-activating protein (GAP) and cargo acceptor, respectively, while these functions are mediated by longin domain proteins in other vesicle coats33.
The present identification of Sec23/24 domain proteins in all our thorarchaeal genome bins, in addition to the presence of longin domain proteins in Lokiarchaeota11,14 as well as in Heimdall- and Odinarchaeota (Extended Data Table 2, Fig. 1d) prompted us to search for potential coatomer proteins. Eukaryotic coatomers are characteristically composed of N-terminal β -propeller folds followed by a C-terminal α -solenoid fold. While proteins containing either β -propeller or α -solenoid folds are widespread among prokaryotes34, including all Asgard lineages (Supplementary Table 10 and 11),
1 kb
WD40ARM TPRWD40
Small GTPaseRoadblock-domain protein
WD40-repeat protein
ARM-repeat protein
Sec23/24-like protein
Small GTPase
Thorarchaeote AB_25
Thorarchaeote WOR_45
1 kb
Thorarchaeote AB_25
Thorarchaeote WOR_45
Thorarchaeote WOR_83
V4R arTRAPPtype I
arTRAPPtype II
1 kb
Thorarchaeote AB_25
Thorarchaeote WOR_45
Thorarchaeote WOR_83
0.5
Thorarchaeote WOR_83 [AM324_06465]
Crenarchaeal and Asgardian
Thorarchaeote WOR_45 [AM325_04700]
Thorarchaeote WOR_83 [AM324_15435]
Thorarchaeote AB_25 [ThorAB25_09780]
Thorarchaeote WOR_83 [AM324_07845]
TRAPPC5 (TRS31)
Thorarchaeote AB_25 [ThorAB25_09740]
Thorarchaeote WOR_45 [AM325_04720]
TRAPPC3 (Bet3)
TRAPPC6 (TRS33)
Thorarchaeote WOR_83 [AM324_07825]
1/100
0.95/89
0.5/41
0.98/90
0.92/570.97/74
0.97/85
0.99/76
0.99/98
1/100
0.78/30
V4R proteinsTy
pe
IITy
pe
I
b d
0.7
Loki’s Castle sediment metagenome [816702733]
Loki’s Castle sediment metagenome [816568378]
Loki’s Castle sediment metagenome [816697524]
Loki’s Castle sediment metagenome [816699656]
Eukaryotic Sec23/24
Thorarchaeote_WOR_83 [AM324_00350]
Thorarchaeote_WOR_83 [AM324_14460]
Thorarchaeote_WOR_45 [AM325_07805]
Thorarchaeote_AB_25 [ThorAB25_11510]
1/1001/100
0.99/98
0.98/82
1/100
0.99/100
1/100
0.81/82
0.86/50
0.63/60
Bacterial vWFA proteins
ca
von Willebrand factor, type AGelsolin domains
Sec23/Sec24 domains
EukaryoticSec23/24
ArchaealSec23/24-like
protein homologues
BacterialvWFA proteins
IPR002035
IPR006895 IPR012990
IPR006900
IPR029006IPR007123IPR006896
IPR002035
IPR006895 IPR006896
IPR002035
IPR012990
Sec23/Sec24, helical domain
e f g
Figure 2 | Vesicular trafficking components in Asgard archaea. a, Conserved thorarchaeal gene clusters comprising archaeal (ar) TRAPP- and V4R-domain-encoding genes and corresponding predicted protein models of Thorarchaeote AB_25 homologues. b, Bayesian inference of thorarchaeal Bet3 homologues and subunits of the eukaryotic TRAPP complex. The tree was rooted with crenarchaeal and Asgard V4R-domain proteins. c, Domain topology of archaeal and eukaryotic Sec23/24 proteins, and prokaryotic von Willebrand factor proteins. d, Bayesian inference of thorarchaeal and metagenomic Sec23/24 homologues that branch basal to eukaryotic Sec23/Sec24 sequences. The tree was rooted with bacterial von Willebrand factor proteins. e, Thorarchaeal gene
clusters encoding a protein with a predicted β -propeller fold (WD40-repeat protein), an adjacent protein with a predicted α -solenoid fold (ARM-repeat protein), and one or more small GTPases. f, Thorarchaeal gene clusters that encode a TPR-domain protein located next to a WD40-repeat protein. g, Schematic depiction of a putative archaeal proto-coatomer complex. a, c, Scale bar indicates the number of substitutions per site. Numbers at branches refer to Bayesian (a) and slow non-parametric maximum-likelihood bootstrap values (c). b, e, f, Protein models for Thorarchaeota AB_25 are shown above the respective genes, with proteins for structures shown in e and f being artificially fused before modelling (Supplementary Tables 6 and 7).
© 2017 Macmillan Publishers Limited, part of Springer Nature. All rights reserved.

0 0 M O N T H 2 0 1 7 | V O L 0 0 0 | N A T U R E | 5
ARTICLE RESEARCH
proteins containing both folds are extremely rare outside the eukaryotic domain35. Notably, all three thorarchaeal genomes contain gene clusters that encode a WD40-repeat protein with a predicted β -propeller fold, an adjacent protein with a predicted α -solenoid domain (armadillo (ARM)-repeat protein), in addition to one or more small GTPases (Fig. 2e). Structure predictions of the concate-nated thorarchaeal WD40- and ARM-repeat proteins revealed that these resemble eukaryotic COP α and β subunits (with 97% of the residues modelled at > 90% confidence in Thorarchaeote AB_25; Supplementary Table 9). According to a recent study, α -solenoid-fold proteins can be comprised of tetratricopeptide repeats (TPR)36. We also identified thorarchaeal gene clusters in which genes encoding a TPR-domain protein and a WD40-repeat protein were located adja-cently (Fig. 2f). Notably, the TPR-domain protein shows a significant domain hit to the COP ε subunit, and, upon concatenation, struc-tural homology to the COP α subunit was observed (with 87% of the residues modelled at > 90% confidence in Thoarchaeote AB_25; Fig. 2f and Supplementary Table 9). Other WD40-domain proteins detected in Asgard lineages do not seem to be located adjacent to putative α -solenoid-fold proteins (Supplementary Tables 10 and 11).
The discovery of the basic building blocks of eukaryotic coatomers, archaeal Sec23/24 and TRAPP C3/C5/C6 homologues in addition to the previous detection of longin- and gelsolin-domain proteins as well as a plethora of small GTPases in Asgard lineages11,14,15, brings a new perspective on the origin and early evolution of eukaryotic membrane- trafficking machineries. First of all, we demonstrate that several fundamental building blocks for the evolution of a primordial vesicular machinery derive from the archaeal ancestor of eukaryotes rather than from the mitochondrial endosymbiont34 (Supplementary Discussion 4). Our findings indicate that the origin of the eukaryotic trafficking machinery predates the mitochondrial origin.
Furthermore, our study provides support to the protocoatomer hypothesis35,37, which posits that all major eukaryotic membrane deforming complexes evolved from an ancestral proto-coatomer domain architecture comprising β -propeller and α -solenoid folds38. Support for this hypothesis is based on structural homology of subunits of the COP complexes, clathrin adaptor proteins (AP1–5), nuclear pore complex (Sec13/31), intraflagellar transport complex and several less-studied trafficking complexes, such as TSET, SEA and HOPS/CORVET35. The presence of β -propeller/α -solenoid gene clusters in archaea basal to eukaryotes suggests an archaeal provenance of this architecture.
Based on these findings, the last common ancestor of Asgard archaea and eukaryotes could have had the ability to assemble primordial coatomer (Fig. 2g) and ‘proto-TRAPP’ complexes, the latter comprising TRAPPC3/5/6 subunits, longin domain proteins and cognate small GTPases. These early trafficking complexes subsequently evolved by gene fusion (for example, of β -propellers and α -solenoids) and dupli-cation events in the early stages of eukaryogenesis39.
Discussion and future perspectiveIn this study, we employed a metagenomics approach to reveal the existence of uncultivated archaeal lineages that are distantly related to the recently described Lokiarchaeota. We have shown that these lineages form a candidate superphylum, designated Asgard archaea, that affiliates robustly with eukaryotes in phylogenetic analyses, and that reconstructed Asgard genomes encode an enriched repertoire of eukaryotic signature proteins. Apart from reinforcing the validity of the two-domain topology of the tree of life and symbiogenic scenarios17, the findings reported here provide several new insights into the process of eukaryogenesis. Asgard archaea encode many key components underlying the emergence of eukaryotic cellular complexity, including homologues of eukaryotic proteins involved in cytoskeletal functions and vesicle formation and trafficking (Extended Data Fig. 8). In addi-tion, Asgard genomes seemingly encode a large amount of proteins that are most similar to bacterial proteins, which may explain some of the bacterial genes present in eukaryotic genomes40–42. Altogether, this
indicates that the genetic repertoire of the archaeal ancestor of eukaryotes was more complex than anticipated previously43.
Yet what do these findings tell us about the level of cellular complexity of the Asgard lineages, and, by inference, of the last archaeo-eukaryotic common ancestor (LAECA)? As the phylogenetic and comparative analyses presented here do not allow us to pinpoint the molecular functions of these ESPs, experimental verification is needed to assess whether these proteins are functionally equivalent to their presumed eukaryotic counterparts. LAECA, however, lived around 2 billion years ago, in a world that was very different from what we observe today, and cell biological research on Asgard archaea might therefore hold limited relevance for inferring cellular characteristics of LAECA. Assuming that all ESPs currently identified in various Asgard lineages were present in LAECA and functionally equivalent to their eukaryotic homologues, how ‘eukaryotic’ was this ancestor in terms of its cellular complexity? In the prokaryotic world, the ability to form both extracellular and intra-cellular membrane structures and/or compartments is by no means exceptional. Many bacterial lineages are known to sustain internal membrane structures (for example, thylakoids in cyanobacteria, magnetosomes in magnetotactic bacteria, power-generating mem-branes in various nitrifying and methylotrophic bacteria, membrane structures of unknown function in Planctomycetes; reviewed in ref. 44). Notably, the crenarchaeon Ignicoccus hospitalis has the ability to form ‘intermembrane’ vesicles that are thought to mediate transport between its unusual inner and outer membranes45. Moreover, the presence of two membranes has recently also been confirmed in other archaeal lineages (reviewed in ref. 46). As such, and given the observed sets of ESPs in Asgard genomes, it seems therefore possible that members of the Asgard archaea (and LAECA) have (had) the ability to bend mem-branes and to form and transport internal vesicles, albeit at a much more primitive level than observed in modern eukaryotes.
The central question with regard to eukaryogenesis entails, however, why a particular Asgard lineage evolved the far higher level of cellular complexity characteristic of eukaryotes, whereas other prokaryotic lin-eages did not. The genomic repertoire of Asgard archaea suggests that mitochondria were acquired after the invention of several fundamental building blocks for the evolution of complex eukaryotic features. While these findings may suggest the ability of simple phagocytic capabili-ties in the archaeal host17,47–49, the exact time point and mechanism of symbiont acquisition require further investigation2. Nevertheless, in line with many symbiogenic hypotheses3,4, we believe that the driving force behind the increase in complexity seen in eukaryotic cells has been the acquisition of the mitochondrial endosymbiont. The uncou-pling of energy production from the host cell’s external membrane to the mitochondrial inner membrane as well as the increase of energy availability allowed the increase in cell size and volume50, and evolution of more complex and energy-demanding cellular structures, including sophisticated endomembrane systems, the nucleus and fully-fledged endocytic and phagocytic machineries. The emergence of such capa-bilities was an essential step in the evolution of eukaryotes.
Future exploration of novel branches in the tree of life, including novel members of the Asgard, as well as deep-branching eukaryotes, and the detailed characterization of their metabolic repertoires and cell-biological features, will undoubtedly provide new fundamental insights into the process of eukaryogenesis, and ultimately reveal how eukaryotic cells evolved their complex and compartmentalized nature.
Online Content Methods, along with any additional Extended Data display items and Source Data, are available in the online version of the paper; references unique to these sections appear only in the online paper.
Received 30 June; accepted 2 December 2016.
Published online 11 January 2017.
1. Embley, T. M. & Martin, W. Eukaryotic evolution, changes and challenges. Nature 440, 623–630 (2006).
2. López-García, P. & Moreira, D. Open questions on the origin of eukaryotes. Trends Ecol. Evol. 30, 697–708 (2015).
© 2017 Macmillan Publishers Limited, part of Springer Nature. All rights reserved.

6 | N A T U R E | V O L 0 0 0 | 0 0 M O N T H 2 0 1 7
ARTICLERESEARCH
3. Koonin, E. V. Origin of eukaryotes from within Archaea, archaeal eukaryome and bursts of gene gain: eukaryogenesis just made easier? Phil. Trans. R. Soc. Lond. B 370, 20140333 (2015).
4. Martin, W. F., Garg, S. & Zimorski, V. Endosymbiotic theories for eukaryote origin. Phil. Trans. R. Soc. Lond. B 370, 20140330 (2015).
5. Cox, C. J., Foster, P. G., Hirt, R. P., Harris, S. R. & Embley, T. M. The archaebacterial origin of eukaryotes. Proc. Natl Acad. Sci. USA 105, 20356–20361 (2008).
6. Guy, L. & Ettema, T. J. The archaeal ‘TACK’ superphylum and the origin of eukaryotes. Trends Microbiol. 19, 580–587 (2011).
7. Raymann, K., Brochier-Armanet, C. & Gribaldo, S. The two-domain tree of life is linked to a new root for the Archaea. Proc. Natl Acad. Sci. USA 112, 6670–6675 (2015).
8. McInerney, J. O., O’Connell, M. J. & Pisani, D. The hybrid nature of the Eukaryota and a consilient view of life on Earth. Nat. Rev. Microbiol. 12, 449–455 (2014).
9. Williams, T. A., Foster, P. G., Nye, T. M., Cox, C. J. & Embley, T. M. A congruent phylogenomic signal places eukaryotes within the Archaea. Proc. R. Soc. Lond. B 279, 4870–4879 (2012).
10. Gray, M. W., Burger, G. & Lang, B. F. Mitochondrial evolution. Science 283, 1476–1481 (1999).
11. Spang, A. et al. Complex Archaea that bridge the gap between prokaryotes and eukaryotes. Nature 521, 173–179 (2015).
12. Williams, T. A., Foster, P. G., Cox, C. J. & Embley, T. M. An archaeal origin of eukaryotes supports only two primary domains of life. Nature 504, 231–236 (2013).
13. Hartman, H. & Fedorov, A. The origin of the eukaryotic cell: a genomic investigation. Proc. Natl Acad. Sci. USA 99, 1420–1425 (2002).
14. Klinger, C. M., Spang, A., Dacks, J. B. & Ettema, T. J. Tracing the archaeal origins of eukaryotic membrane-trafficking system building blocks. Mol. Biol. Evol. 33, 1528–1541 (2016).
15. Surkont, J. & Pereira-Leal, J. B. Are there Rab GTPases in Archaea? Mol. Biol. Evol. 33, 1833–1842 (2016).
16. Dey, G., Thattai, M. & Baum, B. On the archaeal origins of eukaryotes and the challenges of inferring phenotype from genotype. Trends Cell Biol. 26, 476–485 (2016).
17. Koonin, E. V. Archaeal ancestors of eukaryotes: not so elusive any more. BMC Biol. 13, 84 (2015).
18. Archibald, J. M. Endosymbiosis and eukaryotic cell evolution. Curr. Biol. 25, R911–R921 (2015).
19. Martin, W. F., Neukirchen, S., Zimorski, V., Gould, S. B. & Sousa, F. L. Energy for two: new archaeal lineages and the origin of mitochondria. BioEssays 38, 850–856 (2016).
20. Villanueva, L., Schouten, S. & Damsté, J. S. Phylogenomic analysis of lipid biosynthetic genes of Archaea shed light on the ‘lipid divide’. Environ. Microbiol. (2016).
21. Sousa, F. L., Neukirchen, S., Allen, J. F., Lane, N. & Martin, W. F. Lokiarchaeon is hydrogen dependent. Nat. Microbiol. 1, 16034 (2016).
22. Mariotti, M. et al. Lokiarchaeota marks the transition between the archaeal and eukaryotic selenocysteine encoding systems. Mol. Biol. Evol. 33, 2441–2453 (2016).
23. Seitz, K. W., Lazar, C. S., Hinrichs, K. U., Teske, A. P. & Baker, B. J. Genomic reconstruction of a novel, deeply branched sediment archaeal phylum with pathways for acetogenesis and sulfur reduction. ISME J. 10, 1696–1705 (2016).
24. Takai, K. & Horikoshi, K. Genetic diversity of Archaea in deep-sea hydrothermal vent environments. Genetics 152, 1285–1297 (1999).
25. Delsuc, F., Brinkmann, H. & Philippe, H. Phylogenomics and the reconstruction of the tree of life. Nat. Rev. Genet. 6, 361–375 (2005).
26. Lartillot, N. & Philippe, H. A Bayesian mixture model for across-site heterogeneities in the amino-acid replacement process. Mol. Biol. Evol. 21, 1095–1109 (2004).
27. Raiborg, C. & Stenmark, H. The ESCRT machinery in endosomal sorting of ubiquitylated membrane proteins. Nature 458, 445–452 (2009).
28. Yutin, N. & Koonin, E. V. Archaeal origin of tubulin. Biol. Direct 7, 10 (2012).29. Tahirov, T. H., Makarova, K. S., Rogozin, I. B., Pavlov, Y. I. & Koonin, E. V. Evolution
of DNA polymerases: an inactivated polymerase-exonuclease module in Pol epsilon and a chimeric origin of eukaryotic polymerases from two classes of archaeal ancestors. Biol. Direct 4, 11 (2009).
30. Sacher, M., Kim, Y. G., Lavie, A., Oh, B. H. & Segev, N. The TRAPP complex: insights into its architecture and function. Traffic 9, 2032–2042 (2008).
31. Podar, M., Wall, M. A., Makarova, K. S. & Koonin, E. V. The prokaryotic V4R domain is the likely ancestor of a key component of the eukaryotic vesicle transport system. Biol. Direct 3, 2 (2008).
32. Barlowe, C. et al. COPII: a membrane coat formed by Sec proteins that drive vesicle budding from the endoplasmic reticulum. Cell 77, 895–907 (1994).
33. Lee, M. C., Miller, E. A., Goldberg, J., Orci, L. & Schekman, R. Bi-directional protein transport between the ER and Golgi. Annu. Rev. Cell Dev. Biol. 20, 87–123 (2004).
34. Gould, S. B., Garg, S. G. & Martin, W. F. Bacterial vesicle secretion and the evolutionary origin of the eukaryotic endomembrane system. Trends Microbiol. 24, 525–534 (2016).
35. Devos, D. et al. Components of coated vesicles and nuclear pore complexes share a common molecular architecture. PLoS Biol. 2, e380 (2004).
36. Fournier, D. et al. Functional and genomic analyses of alpha-solenoid proteins. PLoS One 8, e79894 (2013).
37. Field, M. C., Sali, A. & Rout, M. P. Evolution: on a bender–BARs, ESCRTs, COPs, and finally getting your coat. J. Cell Biol. 193, 963–972 (2011).
38. Schlacht, A. & Dacks, J. B. Unexpected ancient paralogs and an evolutionary model for the COPII coat complex. Genome Biol. Evol. 7, 1098–1109 (2015).
39. Dacks, J. B. & Field, M. C. Evolution of the eukaryotic membrane-trafficking system: origin, tempo and mode. J. Cell Sci. 120, 2977–2985 (2007).
40. Ku, C. et al. Endosymbiotic origin and differential loss of eukaryotic genes. Nature 524, 427–432 (2015).
41. Pittis, A. A. & Gabaldón, T. Late acquisition of mitochondria by a host with chimaeric prokaryotic ancestry. Nature 531, 101–104 (2016).
42. Ettema, T. J. Evolution: mitochondria in the second act. Nature 531, 39–40 (2016).
43. Koonin, E. V. & Yutin, N. The dispersed archaeal eukaryome and the complex archaeal ancestor of eukaryotes. Cold Spring Harb. Perspect. Biol. 6, a016188 (2014).
44. Shively, J. M. in Complex Intracellular Structures in Prokaryotes (ed. Jessup M. Shively) 3–22 (Springer Berlin Heidelberg, 2006).
45. Küper, U., Meyer, C., Müller, V., Rachel, R. & Huber, H. Energized outer membrane and spatial separation of metabolic processes in the hyperthermophilic archaeon Ignicoccus hospitalis. Proc. Natl Acad. Sci. USA 107, 3152–3156 (2010).
46. Klingl, A. S-layer and cytoplasmic membrane—exceptions from the typical archaeal cell wall with a focus on double membranes. Front. Microbiol. 5, 624 (2014).
47. Yutin, N., Wolf, M. Y., Wolf, Y. I. & Koonin, E. V. The origins of phagocytosis and eukaryogenesis. Biol. Direct 4, 9 (2009).
48. Martijn, J. & Ettema, T. J. From archaeon to eukaryote: the evolutionary dark ages of the eukaryotic cell. Biochem. Soc. Trans. 41, 451–457 (2013).
49. Poole, A. M. & Gribaldo, S. Eukaryotic origins: how and when was the mitochondrion acquired? Cold Spring Harb. Perspect. Biol. 6, a015990 (2014).
50. Lane, N. & Martin, W. The energetics of genome complexity. Nature 467, 929–934 (2010).
Supplementary Information is available in the online version of the paper.
Acknowledgements We thank L. Guy, S. L. Jørgensen, T. Williams, N. Lartillot, B. Quang Minh and J. Dacks for useful advice and discussions. We are grateful to D. R. Colman and C. Takacs-Vesbach for collecting the YNP sediment samples under permit #YELL-2010-SCI-5344, to the Japan Agency for Marine-Earth Science & Technology (JAMSTEC) for taking sediment samples from the Taketomi shallow submarine hydrothermal system, and to the Nga ti Tahu Nga ti Whaoa Runanga Trust for their enthusiasm for our research, and assistance in access and sampling of the Ngatamariki geothermal features. We acknowledge the Yellowstone Center for Resources for their assistance and for facilitating this research. We thank A. Simpson for suggesting the name ‘Heimdallarchaeota’. Sequencing of the White Oak River and Colorado River sediment metagenomes was conducted at the Joint Genome Institute, a US Department of Energy Office of Science User Facility, via the Community Science Program. The remaining metagenomes were sequenced at the National Genomics Infrastructure sequencing platforms at the Science for Life Laboratory at Uppsala University, a national infrastructure supported by the Swedish Research Council (VR-RFI) and the Knut and Alice Wallenberg Foundation. We thank the Uppsala Multidisciplinary Center for Advanced Computational Science (UPPMAX) at Uppsala University and the Swedish National Infrastructure for Computing (SNIC) at the PDC Center for High-Performance Computing for providing computational resources. This work was supported by grants of the European Research Council (ERC Starting grant 310039-PUZZLE_CELL), the Swedish Foundation for Strategic Research (SSF-FFL5) and the Swedish Research Council (VR grant 2015-04959) to T.J.G.E., by Marie Curie IIF (331291 to J.H.S.) and IEF (625521 to A.S.) grants by the European Union to the Ettema laboratory, by grants to Bo Barker Jørgensen (Aarhus University, Denmark) from the European Research Council (ERC Advanced Grant 294200-MICROENERGY) and the Danish National Research Foundation (DNRF104) to support the Center for Geomicrobiology at Aarhus University, and by the US Department of Energy (Sustainable Systems Scientific Focus Area grant DE-AC02-05CH11231 to J.F.B.).
Author Contributions T.J.G.E. conceived the study. A.Sc., P.S., K.U.K., M.B.S. and T.N. took/provided environmental samples. L.J. purified environmental DNA and prepared sequencing libraries. K.Z.-N., E.F.C, J.H.S., K.A., J.F.B, K.W.S., B.J.B. and E.V. performed metagenomic sequence assemblies and metagenomic binning analyses. K.Z.-N., E.F.C., J.H.S., A.Sp. and T.J.G.E. analysed genomic data and performed phylogenetic analyses. A.Sp., D.B., E.F.C. and T.J.G.E analysed genomic signatures. K.Z.-N., E.F.C., J.H.S., A.Sp. and T.J.G.E. wrote, and all authors edited and approved, the manuscript.
Author Information Reprints and permissions information is available at www.nature.com/reprints. The authors declare no competing financial interests. Readers are welcome to comment on the online version of the paper. Correspondence and requests for materials should be addressed to T.J.G.E. ([email protected]).
Reviewer Information Nature thanks J. Gilbert, E. Koonin, A. Roger and the other anonymous reviewer(s) for their contribution to the peer review of this work.
© 2017 Macmillan Publishers Limited, part of Springer Nature. All rights reserved.

ARTICLE RESEARCH
METHODSNo statistical methods were used to predetermine sample size.Sample acquisition. Metagenomic samples were obtained from the following loca-tions: AB (Aarhus Bay, Denmark), LC (Loki’s Castle hydrothermal vent field)51, LCB (Lower Culex Basin, Yellowstone National Park, USA)52, RP (Radiata Pool, Ngatamariki, New Zealand), WOR (White Oak River estuary, USA)23, CR (aquifer near Colorado River, USA)53, and TIV (Taketomi Island shallow submarine hydro-thermal field, Japan)54. Four sediment samples from AB were retrieved from gravity cores at station M5 and at depths (0.25, 0.75, 1.25 and 1.75 m below sea floor). Subsamples were taken from the original core samples using sterile, cut-off 5-ml syringes less than 4 h after retrieval and stored at − 80 °C until further processing. Sediment from TIV was taken by a push corer with scuba diving. The sediment cores were sectioned every 5 cm, and stored at − 80 °C and − 25 °C. The GPS coor-dinates of the locations from which samples were obtained are: AB (56° 06′ 12′ ′ N, 10° 27′ 28.2′ ′ E), LC (73° 45′ 47.4′ ′ N, 8° 27′ 50.4′ ′ E), RP (38° 31′ 48.0′ ′ S, 176° 10′ 12.0′ ′ E), LCB (44° 34′ 23.0′ ′ N, 110° 47′ 40.5′ ′ W), WOR (34° 44′ 35.5′ ′ N, 77° 07′ 26.1′ ′ W), CR (39° 31′ 44.69′ ′ N, 107° 46′ 19.71′ ′ W), and TIV (24° 20′ 54.0′ ′ N, 124° 06′ 06.0′ ′ E).DNA extraction and sequencing. Detailed descriptions of DNA extraction, metagenomic library preparation, and sequencing for LC, LCB, WOR and CR samples have been provided as part of previous studies23,51–53. DNA from TIV sedi-ment sample 617-1-3 was extracted from approximately 10 g of sediment material using Power Max Soil DNA isolation kit (MoBio Labs) following manufacturer’s instructions. The extracted DNA in 5 ml of water was purified using the Aurora system (Boreal Genomics) to remove potential inhibitors. DNA from RP hot spring sample P1.0019 was extracted from approximately 10 g of sediment material using FastDNA 50 ml spin kit for soil (MP Biomedicals) spiked with 400 μ l of PolyA (10 ng μ l−1; Sigma-Aldrich). The DNA eluted in 5 ml of water was further cleaned using the Aurora system. DNA concentrations at various stages of extraction and library construction were measured with ND-3300 fluorescent Nanodrop instru-ment (Thermo Scientific). DNA from AB samples was extracted using two methods: a protocol established by Lever et al.55 abbreviated as MM, and by PowerMax Soil DNA Isolation Kit (MoBio Labs; abbreviated as PM) to enable differential coverage binning further downstream. DNA was extracted from approximately 5 g of sediment materials for each of the samples, resulting in eight different DNA extractions for metagenomic sequencing: MM1/PM1, MM2/PM2, MM3/PM3, and MM4/PM4.
Metagenomic sequencing libraries for AB, RP, and TIV samples were prepared from 50 ng, 50 ng, and 1 ng of purified DNA, respectively. Nextera DNA library preparation kit was used for AB and RP samples and Nextera XT DNA library preparation kit was used for the TIV sample. Metagenomic sequence data for AB, TIV, and RP samples was generated with Illumina HiSeq 2000 and HiSeq 2500 instruments at Uppsala SNP&SEQ Technology Platform. The amount of total raw sequence data generated for the metagenomes was: AB (8 samples, 211 Gbp, 2 × 150 or 2 × 250 bp), TIV (1 sample, 49 Gb, 2 × 250 bp), and RP (1 sample, 33 Gb, 2 × 150 bp). Additional sequences for LC sample were generated from the same MDA-treated library from the previous study51 resulting in a total of 232 Gb of combined sequence data from five separate sequencing runs.Abundance and distribution of the Asgard members. Silva and NCBI nucleotide databases were searched by BLASTN for positive hits to the Asgard members (E value cut-off of 1 × 10⁻⁵) and accession numbers of hits were retrieved to identify their sources of isolation. A custom Python script was used to tabulate the results and to calculate their abundance and distribution.Metagenome assembly and binning. Preprocessing of raw Illumina sequences to remove adaptor sequences and poor-quality regions was carried out using a combination of the following tools: Trimmomatic56, Scythe (https://github.com/vsbuffalo/scythe), and Sickle (https://github.com/najoshi/sickle). Detailed para-meters used with the trimming tools are described in the Supplementary Methods. Metagenomic sequences were assembled with either IDBA-UD57 (AB, CR, RP, TIV, WOR, and LCB) or Ray Meta58 (LC) assemblers. With the exception of AB samples, all the metagenomes were assembled individually. For the AB samples, MM1 and PM1 metagenomes were co-assembled and PM3 was assembled separately.
Binning of the metagenomic assemblies was done with a combination of the following methods and tools: emergent self-organizing maps (ESOM)59, CONCOCT60, PhymmBL61, ABAWACA62, and multi-metagenome63. Details on the assembly and binning of Thorarchaeotes WOR_45 and WOR_83 have been described previously23. All bins were subjected to careful individual contamination removal and quality assessment procedures as described in the Supplementary Methods. In brief, Thorarchaeote AB_25 genome bin was extracted from the MM1/PM1 co-assembly by first using CONCOCT and by further manually cleaning the initial bin using mmgenome tool63. Heimdallarchaeote AB_125 genome bin from PM3 was identified through two rounds of ESOM binning, setting the minimum
nucleotide fragment length to 10 kb in the first round and 5 kb in the second round and also further manually cleaned using mmgenome tool. Odinarchaeote LCB_4 genome bin was first extracted from YNP metagenome by ESOM binning and sub-sequently read pairs mapped to the contigs assigned to the bin were reassembled using SPAdes64 (version 3.5.0). The metagenomic contigs from CR sample were initially binned using the ABAWACA tool62 and contigs that could not be assigned to any cluster assigned by ABAWACA were binned using ESOM. Lokiarchaeote CR_4 came from a cluster binned using ESOM. Heimdallarchaeota LC_2 and LC_3 were extracted from the LC sample using both PhymmBL and ESOM binning, by taking the intersection of contigs identified by these two independent methods. Further cleaning was performed using coverage information from the unamplified metagenome. The three marine Korarchaeotes were extracted from the TIV metagenome using ESOM binning (see Supplementary Methods for details). Completeness, contamination, and strain heterogeneity of all the genome bins were assessed using CheckM65 and micomplete51 tools.Annotation of genome bins. Coding sequences were identified using Prodigal66 using ‘-p single’ option for Odinarchaeote LCB_4, ‘-m -p meta’ for Lokiarchaeote CR_4, or ‘-p meta’ option for all other genomic bins. Genes of Thorarchaeotes WOR_45 and WOR_82 bins were predicted using the JGI IMG/MER system23,67. Ribosomal RNA-coding regions (16S, 23S, 5S) and transfer RNA-coding regions were predicted with Barrnap (https://github.com/tseemann/barrnap) and tRNAscan-SE68, respectively. All proteomes were queried against nr (using NCBI database as of February 2015) and protein domains were determined using InterProScan69 with default parameters and RPS-BLAST against the NCBI CDD database70. Furthermore, all proteins were assigned to existing arCOGs71 (archaeal cluster of orthologous groups), while new arCOGs were generated as described previously51. Potential ESPs were identified by determining all Asgard proteins that retrieved hits to eukaryote-specific IPR domains (see Extended Data Table 2, Supplementary Tables 7 and 8). Several of these ESPs, were further investigated using PFAM72, SMART73 and Hmmpred74 for remote homology detection, the protein structure prediction tool Phyre275 for homology modelling and through phylogenetic analyses (see single gene phylogenies in Supplementary Information). Predicted models were viewed and analysed further using Chimera76 (Supplementary Tables 9 and 10).Comparison of full length 16S sequences. 16S identities were calculated using needle (-gapopen 10 -gapexend 0.5) for each pair of full-length 16S sequences (Heimdallarchaeote AB_125, Heimdallarchaeote LC_3, Odinarchaote LCB_4, Odinarchaote RP_19, Lokiarchaeote CR_4, Lokiarchaeum and Thorarchaeote WOR_83). In the case of Thorarchaeote WOR_83, long unaligned regions were excluded from the calculation (positions 815–1,558 and 1,746–1,799 removed).Phylogenomic analysis using concatenated ribosomal proteins to assess the diversity of Asgard in metagenomes. A custom pipeline written in Python was used to identify r-protein-containing contigs in all the metagenomes analysed in this study. Briefly, the pipeline uses PSI-BLAST to search for a set of 15 syntenic r-proteins that occur on a single contig given a minimum cutoff of 6 proteins. The set of r-proteins (L2, L3, L4, L5, L6P, L14, L15, L18, L22, L24, S3, S8, S10, S17, and S19) was chosen according to Castelle et al.53. All identified r-proteins were then aligned individually, trimmed with trimAl and concatenated. RAxML77 (version 8.1.17) with fast bootstrapping was used to infer maximum likelihood phylogenies, using the PROTCATLG model of protein evolution.Identification of taxonomic marker genes. Taxonomic marker genes used for concatenated phylogenetic analyses were identified as described previously51,78. Single-gene RAxML phylogenies were performed for all those markers to assess contamination and suitability for inclusion in concatenated data set. This yielded a final data set of 48 single-copy marker genes. The full list of marker genes selected for phylogenomic analyses is shown in Supplementary Table 9 and includes 31 universal ribosomal proteins (r-proteins). Additional 25 r-proteins shared between Archaea and Eukarya and universally present among Archaea were identified through arCOGs based on Yutin et al.79 to generate a ribosomal protein data set (Supplementary Table 13). Asgard proteins that were classified into ribosomal arCOGs were aligned and end-trimmed to create HMM profiles. Bins were translated into six reading frames and HMMsearch was performed using Asgard-specific ribosomal profiles to retrieve missing ribosomal proteins from Asgard proteomes. Eukaryotic copies of the r-proteins were identified by PSI-BLAST with an E value threshold of 1 × 10⁻⁶. Single gene RAxML phylogenies were performed to verify the selection of the eukaryotic copies.Phylogenomic analyses of concatenated protein datasets. Taxa included in this analysis were selected carefully to yield a representative set of Archaea, Bacteria and Eukarya. Each of the 48 single-copy marker genes (from Eukarya, Bacteria and Archaea) as well as the 55 ribosomal proteins (from Archaea and Eukarya) were aligned using MAFFT-L-INS-i80, manually inspected and edited to trim the beginning and end of alignments. Further trimming was performed using using
© 2017 Macmillan Publishers Limited, part of Springer Nature. All rights reserved.

ARTICLERESEARCH
BMGE81 using the BLOSUM30 matrix or trimAl82 using the ‘gappyout’ option. Final alignments for each of the two gene sets were generated by concatenating the 48 marker genes and the 55 ribosomal proteins, respectively. Bayesian infer-ence phylogenies were inferred using PhyloBayes83 MPI 1.5a, using the CAT-GTR model. Four chains were run in parallel until topological convergence and half of the generations were regarded as burn-in and removed to obtain the summaries for all runs (Supplementary Table 4 and Supplementary Methods). Maximum likelihood phylogenies were inferred using IQ-TREE84 with mixture models (see Supplementary Methods for details) with ultrafast bootstrapping85, as well as the Shimodaira–Hasegawa–like approximate likelihood-ratio test86.
To test robustness of the phylogenies, the two data sets were subjected to several treatments and tests. First, influence of the alignment filtering treatment was assessed by comparing alignments trimmed with BMGE81 and trimAl82, as well as with and without manual end-trimming. In addition, taxon removal was used to assess the robustness of the placement of eukaryotes, for example, by removing DPANN Archaea and Bacteria in case of the universal markers concatenation. Posterior predictive tests were performed using PhyloBayes83 (-comp option) to detect violation of the assumption of homogenous composi-tion. The test statistic calculates maximum square deviation between taxa and the global empirical frequencies and the value observed for the data are com-pared to the posterior distribution giving z-scores and P values (Supplementary Table 4). Taxa identified as most compositionally biased87 were removed (Supplementary Table 14 and Supplementary Methods for all the numbers and the list of removed taxa) and yielded a non-biased dataset that included all of the Asgard lineages. Further, eukaryotes were removed to reconstruct the relationships within Asgard. Finally, SR4-recoding was used to evaluate potential biases coming from model mis-specification and saturation of the phylogenetic signal88.Phylogenomic analysis using concatenated ribosomal RNA genes. Small subunit (SSU) and large subunit (LSU) ribosomal RNA (rRNA) genes from representative archaeal clades were aligned together with those from Asgard lineages using MAFFT-L-INS-i, trimmed with BMGE and concatenated. Heimdallarchaeote LC_2 genome bin lacks the SSU rRNA but has a partial LSU rRNA gene and was included in the alignment. Maximum-likelihood phylogenetic analyses were performed using RAxML77 v.8.0.22, calculating 100 non-parametric bootstraps and using the GTRGAMMA model of sequence evolution and Bayesian inference was carried out with PhyloBayes83 MPI (v.1.5a) using CAT-GTR model until convergence was reached between at least two independent chains with a ‘maxdiff ’ below 0.3. Several lineages such as the members of DPANN (Diapherotrites, Parvarchaeota, Aenigmarchaeota, Nanoarchaeota, Nanohaloarchaeota, Woesearchaeota, and Pacearchaeota) and Methanopyrus kandleri were excluded in the analyses shown in Fig. 1c to prevent potential phylogenetic artefacts. However, taxon sampling experiments were also constructed with and without Bacteria, DPANN members and eukaryotes to check the robustness of Asgard clade and the affiliation between Asgard members and eukaryotes.Phylogenetic analyses of selected eukaryotic signature proteins. Sec23/24 and TRAPP. Eukaryotic Sec23 and Sec24 homologues are composed of several charac-teristic IPR domains (Fig. 2c), including zinc-finger (IPR006895), von Willebrand factor (vWF) (IPR002035) and a Sec23/24 β -sandwich (IPR012990) domains. Thorarchaeal proteins were identified that contained these domains and that displayed similarity to eukaryotic Sec23/24 proteins (Supplementary Table 4). No other archaeal or bacterial sequences containing both IPR006895 and IPR002035 domains were found. Taxonomically representative sets of eukaryotic putative Sec23/24 and Sec23/24-like sequences with domain hits to IPR006895, IPR006896/IPR002035 and IPR012990, were retrieved from UniProt. Furthermore, additional Asgard and metagenomic homologues with domain hits to at least IPR006895 and IPR002035 were added to this dataset. Three bacterial von Willebrand factor proteins with the IPR002035 domain were identified using thorarchaeal sequences as queries against nr (excluding eukaryotes) and included as outgroup. Pairwise comparisons of bacterial and thorarchaeal vWF domain proteins with human Sec23 and Sec24 homologues, respectively, revealed that only thorarchaeal homo-logues displayed significant similarity to eukaryotic sequences. For instance, while E values for the homology between human Sec24 and Sec23 and Thorarchaeote AB25 (ThorAB25_11510) were 7 × 10⁻¹¹ and 4 × 10⁻⁴, respectively, they were only 0.13 and 4.1 for Chryseobacterium (WP_055983045). Therefore, thorarchaeal homologues seemed to be intermediate between bacterial homologues and eukar-yotic Sec23/24 domain proteins and the bacterial sequences were used to root this phylogeny.
Sequences with domain hits to the transport protein particle component (IPR007194) were downloaded from a taxonomically representative set of eukar-yotes, including homologues of for the three Bet3-like subfamilies: TRAPPC3 (Bet3), TRAPPC5 and TRAPPC6. Prokaryotic proteins containing significant hits to IPR007194 (that is, Ignicoccus hospitalis, A8AC56) as well as all Asgard
proteins with domain hits to IPR007194 were added to this dataset. Homologous V4R domain proteins (IPR024096) from Crenarchaeota and Asgard members were included as outgroup.
Sequence sets including V4R/TRAPP and vWF/Sec23/24 homologues, were aligned using MAFFT-L-INS-i80 version 7 with default parameters. After removal of poorly aligned ends, alignments were trimmed using trimAl82 with the gap-pyout option yielding 470 (Sec23/24) and 146 (TRAPP) positions, respectively. Subsequently, trimmed alignments were subjected to maximum likelihood and Bayesian phylogenetic inferences. RAxML77 v.8.0.22 analyses were run under the GAMMA-LG model (generating ten independent trees for optimization) and 100 non-parametric bootstrap replicates were generated. PhyloBayes83 MPI 1.5 was run using the CAT-GTR model of protein evolution. Four chains were run in parallel until the ‘maxdiff ’ was below 0.15 and consensus trees were obtained discarding 20% of the generations as burn-in. RAxML bootstrap values were mapped onto the PhyloBayes topologies using the sumtrees program, which is part of the DendroPy package89.Tubulins. All tubulin sequences (Interpro accession number IPR000217) were down-loaded from the UniProt database, resulting in a dataset comprising 33,296 Eukarya, 22 Bacteria, 9 Archaea, and 4 unclassified sequences. This dataset was further separated into alpha, beta, gamma, delta, epsilon, theta, and cryptic tubulins for Eukarya and reduced to 198 sequences after removal of near-identical sequences and FtsZ homologues. Odinarchaeal tubulin sequences along with the selected homologues were aligned using MAFFT-L-INS-I80, manually end-trimmed, and further trimmed using trimAl82 with gappyout option yielding a final alignment of 446 amino acids. Maximum likelihood phylogenetic tree was inferred using RAxML77 v.8.0.22 with the GAMMA-LG model of evolution and Bayesian inference phylogenetic trees were obtained using PhyloBayes83 MPI (version 1.5).DNA polymerase B. Bacterial and eukaryotic sequences were selected based on a previously published dataset90 and downloaded from NCBI. Archaeal and Asgard polymerase B family proteins assigned to arCOG00328 (PolB3), arCOG00329 (PolB2) and arCOG15272 (PolB1) were added to this dataset after removal of partial and redundant sequences. Sequences were aligned with Mafft-LINSi80 version 7 and ends were trimmed manually before final trimming using BMGE81 with the BLOSUM30 matrix. The final alignment (631 positions) was subjected to maximum likelihood phylogenetic inferences using RAxML77 v.8.0.22 with the GAMMA-LG model of evolution, generating ten independent trees for optimiza-tion and 100 slow and non-parametric bootstrap replicates.Ribosomal protein L28e. A representative set of eukaryotic L28e (PF01778) and MAK16 homologues (PF01778 and PF04874) was downloaded from UniProt (Extended Data Fig. 6d). So far, these protein domains have exclusively been found in eukaryotes, with the sole exception of a homologue in Pontibacillus halophilus, which was 100% identical to the ribosomal protein L28 of Chlamydomonas reinhardtii, indicating contamination. Heimdallarchaeota LC_3 was the only Asgard representative that encoded a protein with a ribosomal L28e/Mak16 domain (PF01778) but lacking the second N-terminal PF domain character-istic of eukaryotic MAK16 homologues (PF04874). A protein blast against the NCBI database (September 2015) revealed one homologous metagenomic sequence, that was also included in our analysis. All sequences were aligned using Mafft-LINSi80 version 7, ends were trimmed manually and final trimming was performed trimAl82 with the gappyout option. The final alignment comprised 122 amino acid positions spanning the first protein domain shared between r-protein L28 and MAK16. Maximum likelihood phylogenetic analyses were performed using RAxML77 v.8.0.22 with the GAMMA-LG model, generating ten independent trees for optimization and 100 slow and non-parametric bootstrap replicates.Data availability. The genome bins described in this study have been deposited at DDBJ/EMBL/GenBank under the BioProject ID PRJNA319486 and WGS acces-sions MDVT00000000 (archaeon Odin LCB_4), MEHG00000000 (Candidatus Thorarchaeota archaeon AB_25), MEHH00000000 (archaeon Heimdall AB_125), MDVS00000000 (archaeon Heimdall LC_3) and MDVR00000000 (archaeon Heimdall LC_2). The versions described in this paper are versions MDVT01000000, MEHG01000000, MEHH01000000, MDVS01000000 and MDVR01000000, respectively. The Lokiarchaeote CR_4 bin has been deposited under the BioProject ID PRJNA288027 with WGS accession MBAA00000000 and the version described in this paper is MBAA01000000. The Thorarchaeote bins SMTZ1-83 and SMTZ1-45 are available under BioProject ID PRJNA270657 and WGS accession numbers LRSK00000000 and LRSL00000000.
51. Saw, J. H. et al. Exploring microbial dark matter to resolve the deep archaeal ancestry of eukaryotes. Phil. Trans. R. Soc. Lond. B 370, 20140328 (2015).
52. Baker, B. J. et al. Genomic inference of the metabolism of cosmopolitan subsurface Archaea, Hadesarchaea. Nat. Microbiol. 1, 16002 (2016).
53. Castelle, C. J. et al. Genomic expansion of domain Archaea highlights roles for organisms from new phyla in anaerobic carbon cycling. Curr. Biol. 25, 690–701 (2015).
© 2017 Macmillan Publishers Limited, part of Springer Nature. All rights reserved.

ARTICLE RESEARCH
54. Hirayama, H. et al. Culture-dependent and -independent characterization of microbial communities associated with a shallow submarine hydrothermal system occurring within a coral reef off Taketomi Island, Japan. Appl. Environ. Microbiol. 73, 7642–7656 (2007).
55. Lever, M. A. et al. A modular method for the extraction of DNA and RNA, and the separation of DNA pools from diverse environmental sample types. Front. Microbiol. 6, 476 (2015).
56. Bolger, A. M., Lohse, M. & Usadel, B. Trimmomatic: a flexible trimmer for Illumina sequence data. Bioinformatics 30, 2114–2120 (2014).
57. Peng, Y., Leung, H. C., Yiu, S. M. & Chin, F. Y. IDBA-UD: a de novo assembler for single-cell and metagenomic sequencing data with highly uneven depth. Bioinformatics 28, 1420–1428 (2012).
58. Boisvert, S., Raymond, F., Godzaridis, E., Laviolette, F. & Corbeil, J. Ray Meta: scalable de novo metagenome assembly and profiling. Genome Biol. 13, R122 (2012).
59. Dick, G. J. et al. Community-wide analysis of microbial genome sequence signatures. Genome Biol. 10, R85 (2009).
60. Alneberg, J. et al. Binning metagenomic contigs by coverage and composition. Nat. Methods 11, 1144–1146 (2014).
61. Brady, A. & Salzberg, S. L. Phymm and PhymmBL: metagenomic phylogenetic classification with interpolated Markov models. Nat. Methods 6, 673–676 (2009).
62. Brown, C. T. et al. Unusual biology across a group comprising more than 15% of domain Bacteria. Nature 523, 208–211 (2015).
63. Albertsen, M. et al. Genome sequences of rare, uncultured bacteria obtained by differential coverage binning of multiple metagenomes. Nat. Biotechnol. 31, 533–538 (2013).
64. Bankevich, A. et al. SPAdes: a new genome assembly algorithm and its applications to single-cell sequencing. J. Comput. Biol. 19, 455–477 (2012).
65. Parks, D. H., Imelfort, M., Skennerton, C. T., Hugenholtz, P. & Tyson, G. W. CheckM: assessing the quality of microbial genomes recovered from isolates, single cells, and metagenomes. Genome Res. 25, 1043–1055 (2015).
66. Hyatt, D. et al. Prodigal: prokaryotic gene recognition and translation initiation site identification. BMC Bioinformatics 11, 119 (2010).
67. Markowitz, V. M. et al. IMG: the integrated microbial genomes database and comparative analysis system. Nucleic Acids Res. 40, D115–D122 (2012).
68. Lowe, T. M. & Eddy, S. R. tRNAscan-SE: a program for improved detection of transfer RNA genes in genomic sequence. Nucleic Acids Res. 25, 955–964 (1997).
69. Jones, P. et al. InterProScan 5: genome-scale protein function classification. Bioinformatics 30, 1236–1240 (2014).
70. Marchler-Bauer, A. et al. CDD: NCBI’s conserved domain database. Nucleic Acids Res. 43, D222–D226 (2015).
71. Makarova, K. S., Wolf, Y. I. & Koonin, E. V. Archaeal clusters of orthologous genes (arCOGs): an update and application for analysis of shared features between Thermococcales, Methanococcales, and Methanobacteriales. Life 5, 818–840 (2015).
72. Finn, R. D. et al. The Pfam protein families database: towards a more sustainable future. Nucleic Acids Res. 44 (D1), D279–D285 (2016).
73. Letunic, I., Doerks, T. & Bork, P. SMART: recent updates, new developments and status in 2015. Nucleic Acids Res. 43, D257–D260 (2015).
74. Söding, J., Biegert, A. & Lupas, A. N. The HHpred interactive server for protein homology detection and structure prediction. Nucleic Acids Res. 33, W244–W228 (2005).
75. Kelley, L. A., Mezulis, S., Yates, C. M., Wass, M. N. & Sternberg, M. J. The Phyre2 web portal for protein modeling, prediction and analysis. Nat. Protocols 10, 845–858 (2015).
76. Pettersen, E. F. et al. UCSF Chimera–a visualization system for exploratory research and analysis. J. Comput. Chem. 25, 1605–1612 (2004).
77. Stamatakis, A. RAxML version 8: a tool for phylogenetic analysis and post-analysis of large phylogenies. Bioinformatics 30, 1312–1313 (2014).
78. Guy, L., Saw, J. H. & Ettema, T. J. The archaeal legacy of eukaryotes: a phylogenomic perspective. Cold Spring Harb. Perspect. Biol. 6, a016022 (2014).
79. Yutin, N., Puigbò, P., Koonin, E. V. & Wolf, Y. I. Phylogenomics of prokaryotic ribosomal proteins. PLoS One 7, e36972 (2012).
80. Katoh, K. & Standley, D. M. MAFFT multiple sequence alignment software version 7: improvements in performance and usability. Mol. Biol. Evol. 30, 772–780 (2013).
81. Criscuolo, A. & Gribaldo, S. BMGE (block mapping and gathering with entropy): a new software for selection of phylogenetic informative regions from multiple sequence alignments. BMC Evol. Biol. 10, 210 (2010).
82. Capella-Gutiérrez, S., Silla-Martínez, J. M. & Gabaldón, T. trimAl: a tool for automated alignment trimming in large-scale phylogenetic analyses. Bioinformatics 25, 1972–1973 (2009).
83. Lartillot, N., Rodrigue, N., Stubbs, D. & Richer, J. PhyloBayes MPI: phylogenetic reconstruction with infinite mixtures of profiles in a parallel environment. Syst. Biol. 62, 611–615 (2013).
84. Nguyen, L. T., Schmidt, H. A., von Haeseler, A. & Minh, B. Q. IQ-TREE: a fast and effective stochastic algorithm for estimating maximum-likelihood phylogenies. Mol. Biol. Evol. 32, 268–274 (2015).
85. Minh, B. Q., Nguyen, M. A. & von Haeseler, A. Ultrafast approximation for phylogenetic bootstrap. Mol. Biol. Evol. 30, 1188–1195 (2013).
86. Guindon, S. et al. New algorithms and methods to estimate maximum-likelihood phylogenies: assessing the performance of PhyML 3.0. Syst. Biol. 59, 307–321 (2010).
87. Viklund, J., Ettema, T. J. & Andersson, S. G. Independent genome reduction and phylogenetic reclassification of the oceanic SAR11 clade. Mol. Biol. Evol. 29, 599–615 (2012).
88. Susko, E. & Roger, A. J. On reduced amino acid alphabets for phylogenetic inference. Mol. Biol. Evol. 24, 2139–2150 (2007).
89. Sukumaran, J. & Holder, M. T. DendroPy: a Python library for phylogenetic computing. Bioinformatics 26, 1569–1571 (2010).
90. Makarova, K. S., Krupovic, M. & Koonin, E. V. Evolution of replicative DNA polymerases in Archaea and their contributions to the eukaryotic replication machinery. Front. Microbiol. 5, 354 (2014).
© 2017 Macmillan Publishers Limited, part of Springer Nature. All rights reserved.
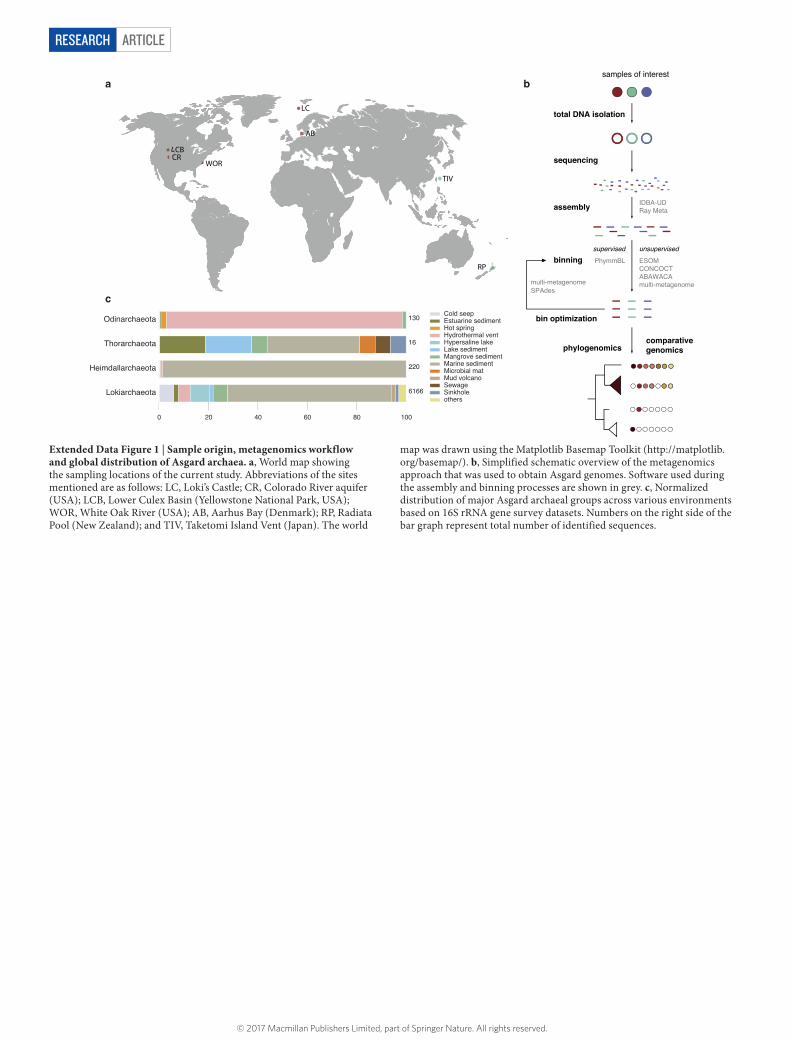
ARTICLERESEARCH
Extended Data Figure 1 | Sample origin, metagenomics workflow and global distribution of Asgard archaea. a, World map showing the sampling locations of the current study. Abbreviations of the sites mentioned are as follows: LC, Loki’s Castle; CR, Colorado River aquifer (USA); LCB, Lower Culex Basin (Yellowstone National Park, USA); WOR, White Oak River (USA); AB, Aarhus Bay (Denmark); RP, Radiata Pool (New Zealand); and TIV, Taketomi Island Vent (Japan). The world
map was drawn using the Matplotlib Basemap Toolkit (http://matplotlib.org/basemap/). b, Simplified schematic overview of the metagenomics approach that was used to obtain Asgard genomes. Software used during the assembly and binning processes are shown in grey. c, Normalized distribution of major Asgard archaeal groups across various environments based on 16S rRNA gene survey datasets. Numbers on the right side of the bar graph represent total number of identified sequences.
© 2017 Macmillan Publishers Limited, part of Springer Nature. All rights reserved.

ARTICLE RESEARCH
Aigarchaeota
Heimdallarchaeote LC_2
Euryarchaeota
Heimdallarchaeote LC_3
Euryarchaeota (Thermococcales)
Eukarya
Euryarchaeota (Methanobacteriales)
Lokiarchaeum sp. GC14_75
Thorarchaeote WOR_45
Heimdallarchaeote AB_125
Crenarchaeota
Euryarcheota (Methanococcales)
Thorarchaeote AB_25
Odinarchaeote LCB_4
Korarchaeota
Thorarchaeote WOR_83
DPANN
Thaumarchaeota
Bathyarchaeota
Lokiarchaeote CR_4
0.98
0.99
0.99
1
0.92
0.99
0.57
0.96
0.99
0.990.78
1
1
0.86
0.89
1
0.86
0.86
0.95
0.87
0.77
0.98
0.99
0.79
10.72
0.3
Extended Data Figure 2 | Bayesian phylogenetic inference of 48 concatenated marker genes. The tree was inferred using CAT + GTR model and rooted with Bacteria, showing high support for the phylogenetic affiliation between Asgard archaea and eukaryotes (support value in red). Numbers at branches represent posterior probabilities and scale bar indicates the number of substitutions per site.
© 2017 Macmillan Publishers Limited, part of Springer Nature. All rights reserved.

ARTICLERESEARCH
111
8698 273
15526 17
4526
2626
37
4 3 33 2 4 0 0
0.0
0.5
1.0
1.5
2.0
Lokiarc
haeum
sp. G
C14_7
5
Lokiarc
haeote
CR_4
Heimdall
arch
aeote
LC_3
Naegle
ria g
rube
ri
Dictyo
steliu
m d
iscoid
eum
Heimdall
arch
aeote
AB_1
25
Odinar
chae
ote L
CB_4
Heimdall
arch
aeote
LC_2
Thorarc
haeote
AB_2
5
Thorarc
haeote
WOR_8
3
Thorarc
haeote
WOR_4
5
Sacch
arom
yces
cere
visiae
S28
8c
Hydro
geno
bacte
r the
rmop
hilus
Aciduli
prof
undu
m b
oone
i T46
9
Korar
chae
um cr
ypto
filum
_OPF8
Pyrob
aculu
m a
erop
hilum
IM2
Caldiar
chae
um su
bter
rane
um
Myx
ococ
cus x
anth
us D
K1622
Nitros
opum
ilus m
aritim
us S
CM1
Bacillu
s sub
tilis B
sn5
Archaea Bacteria Eukaryota
Per
cen
t
Extended Data Figure 3 | Asgard genomes encode an expanded GTPase repertoire. Graph showing small Ras and Arf-type GTPases (containing any of the following domains: IPR006762, IPR024156, IPR006689, IPR006687, IPR001806, IPR003579, IPR020849, IPR003578, IPR021181,
IPR031260, IPR002041, IPR019009) per Asgard genomic bin normalized to the total amount of proteins predicted per genome and compared with selected eukaryotic, archaeal and bacterial taxa. Numbers refer to the total amount of GTPases per genome.
© 2017 Macmillan Publishers Limited, part of Springer Nature. All rights reserved.

ARTICLE RESEARCH
0.4
Thorarchaeote WOR_83 [AM324_00050]
Marine Sediment Metagenome [X0SUW6|X0SUW6]
Odinarchaeote LCB_4 [OdinLCB4_11710]
Eukarya
Marine Sediment Metagenome [X1CVT5|X1CVT5]
Bathyarchaeota archaeon BA2 [A0A0P9E7H4|]
Thorarchaeote WOR_45 [AM325_15205]
Marine Sediment Metagenome [X1CAT3|X1CAT3]
Lokiarchaeum sp. GC14_75 [Lokiarch_43710]
Uncultured archaeon C2 [jgi2574367198]
Marine Sediment Metagenome [X1F8R2|X1F8R2]
MCG_SG8-32-1 [921072887]
Marine Sediment Metagenome [A0A0F9TD68]
MCG_SG8-32-3 [921071312|]
Heimdallarchaeote AB_125 [HeimAB125_05010]
Lokiarchaeote CR_4 [RBG13Loki_2913]
Thorarchaeote AB_25 [ThorAB25_02870]
93
80
100
100
100
100
100
100
99
77
100
67
98
100
Thorarchaeota
Lokiarchaeota
Heimdallarchaeota
Odinarchaeota
Bathyarchaeota
35
36
b
a
0.7
Korarchaeota
DPANN
Thorarchaeote AB_25 [ThorAB25_06650]
Marine Sediment Metagenome [A0A0F9LF76]
Archaeoglobi/ Methanomicrobia/ Halobacteria
Heimdallarchaeote LC_2 [HeimC2_16400]
Bacteria
Eukarya
Lokiarchaeum sp. GC14_75 [Lokiarch_28460]
Crenarchaeota
Thermococci/ Micrarchaeum
Aig-/ Bathyarchaeota
Thorarchaeote WOR_45 [AM325_12185]
Marine Sediment Metagenome [A0A0F9PXR2]
Heimdallarchaeote AB_125 [HeimAB125_10560]
Thaumarchaeota
Heimdallarchaeote LC_3 [HeimC3_02240]
Thorarchaeote WOR_83 [AM324_16555]
Odinarchaeote LCB_4 [OdinLCB4_10270]
Thorarchaeote WOR_83 [AM324_02325]
Methanococci/ Methanobacteriaceae
Thermoplasmata
Marine Sediment Metagenome [A0A0F9S4X2]
0.81/ 6
0.99/ 64
0.56/ 430.99/ 82
1/ 100
0.85/ 75
1/ 100
1/ 99
1/ 84
1/ 93
1/ 100
0.99/ 73
0.99/ 62
1/ 97
0.78/ 64
1/ 99
1/ 100
1/ 79
1/ 100
1/ 100
1/ 100
1/ 100
0.95/ 34
1/ 73
0.63/ 45
1/ 100
1/ 84
0.56/ 15
1/ 100
1/ 99
0.92/ 79
1/ 100
Heimdallarchaeota
Thorarchaeota
Lokiarchaeota
Odinarchaeota
Extended Data Figure 4 | Phylogenetic analysis of oligosaccharyl-transferase-complex-related proteins. a, Bayesian inference of STT3-domain proteins (598 aligned amino acid positions) present in all three domains of life. This phylogenetic tree was rooted with bacterial sequences. Numbers at branches refer to Bayesian and non-parametric RAxML bootstrap values, respectively. b, Unrooted maximum likelihood
phylogenetic analysis of ribophorin domain proteins (357 aligned amino acid positions) including all prokaryotic homologues identified so far. Numbers at branches show slow, non-parametric maximum-likelihood bootstrap support values. Scale bars indicate the number of substitutions per site.
© 2017 Macmillan Publishers Limited, part of Springer Nature. All rights reserved.

ARTICLERESEARCH
1 kb
Heimdallarchaeote AB_125
Lokiarchaeote CR_4
Heimdallarchaeote LC_2
Heimdallarchaeote LC_3
Odinarchaeote LCB_4
Lokiarchaeum sp. GC14_75
Thorarchaeote WOR_45
Thorarchaeote WOR_83
Thorarchaeote AB_25
Ubiquitin System ESCRT System
Putative E1-like* - IPR000594
Putative E2-like ubiquiting conjugating enzyme - IPR000608
Ubiquitin-domain protein - IPR029071, IPR000626
Putative E3-Ilike* - IPR013083
Putative deubiquitinating enzyme* - IPR000555
UFM1-domain protein - IPR018611
Other
ESCRT-I: Vps28-like - IPR007143
ESCRT-II: EAP30 domain - IPR007286
ESCRT-II: Vps25-like - IPR014041, IPR008570
Vps4 like - IPR007330 IPR015415
ESCRT-III: Snf7 domain - IPR005024
ESCRT-I: Steadiness Box domain - IPR017916
Extended Data Figure 5 | Genomic conservation links ESCRT and ubiquitin modifier systems. Schematic overview of ubiquitin and ESCRT gene clusters identified in Asgard genomes. Contiguous contigs from Heimdallarchaeote AB_125 are represented with a double line at the end of the contig. E1-like and putative deubiquitinating proteins not belonging to any ubiquitin cluster are not shown.
© 2017 Macmillan Publishers Limited, part of Springer Nature. All rights reserved.

ARTICLE RESEARCH
0.4
R-protein L28e
MBGB_SG8-8-3 [921077408]
MAK16
Heimdall. LC_3 [HeimC3_14460]100
97
100
49PF01778 PF04874
Heimdallarchaeote LC_3 [HeimC3_00430]Lokiarchiarch. sp. GC14_75 [816390261]
Homo sapiens [62198237]
*several archaeal DNA polymerases B homologs also have a Zinc finger domain at their CTD
500 1000 1500 2000
PF03104, DNA polymerase family B, exonuclease domainPF00136, DNA polymerase family BPF08490, Domain of unknown function, CTD of epsilon catalytic subunit of DNA polymerase
Zinc fingers*, CXXC -10-22*X – CX(X)C(distant Polymerase B homolog, with inactivated Exonuclease and Polymerase domain)
100
96
Pol- Heimdallarchaeote LC_3
arCOG00329
Pol-B2
Pol-Pol-
Pol-
0.5
arCOG00328COG00417
Pol-B3
Pol
arCOG15272
Pol-B1
arCOG00328
Pol-B3
[HeimC3_00430]
b
0.7
bacterial tubulin A
gamma tubulin
beta tubulin
delta tubulin
Odinarchaeote LCB_4 [OdinLCB4_01330]
“Candidatus Nitrosoarchaeum limnia SFB1” [329138201]
epsilon tubulin
Odinarchaeote RP_19 [KX764884]
alpha tubulin
“Candidatus Nitrosoarchaeum koreensis MY1” [339520150]
bacterial tubulin B
Thaumarchaeota archaeon N4 [851357707]
cryptic tubulin
100
85
63 100
94
100
43
41
100
10045
99
100
98
100
81
32
78
100
artubulins
a
dc
Extended Data Figure 6 | Phylogenetic analyses of selected ESPs. a, Tubulin protein family maximum-likelihood tree, highlighting Odinarchaeota homologues branching basal to major eukaryotic tubulin families (red clades). Green clade reflects bacterial tubulin genes probably acquired horizontally from eukaryotes. The tree was rooted with thaumarchaeal artubulins. b, Unrooted maximum-likelihood phylogenetic tree of the replicative polymerase B family depicting a Heimdallarchaeote LC_3 sequence and its corresponding protein model (red), branching basal to the eukaryotic Pol-ε (protein model in grey: PDB ID 4M8O of S. cerevisiae). Bootstrap support values of ≥ 99, ≥ 90 and ≥ 50 for major clades are indicated by black, grey and white circles, respectively. Eukaryotic, bacterial and archaeal clades are shaded red,
green and purple, respectively. c, PFAM domain topology analysis of family B polymerases, indicating that the heimdallarchaeal homologue lacks the C-terminal DUF1744 domain characteristic of eukaryotic Pol-ε . d, Unrooted maximum-likelihood tree of RPL28e homologues, including eukaryotic RPL28e and MAK16, a RPL28e-like sequence identified in the Heimdallarchaeote LC_3 genome and a metagenomic homologue. Eukaryotic MAK16 proteins (implicated in rRNA maturation) contain an additional C-terminal domain absent in the heimdallarchaeal protein. a, b, d, Scale bars indicate the number of substitutions per site and numbers at branches show slow, non-parametric maximum-likelihood bootstrap support values.
© 2017 Macmillan Publishers Limited, part of Springer Nature. All rights reserved.

ARTICLERESEARCH
Information storage & processing Cellular processes and signaling Metabolism
Lokiarchaeumsp. G
C14_75
LokiarchaeoteC
R_4
Heim
dallarchaeote
AB
_125H
eimdallarchaeote
LC_2
Heim
dallarchaeoteLC
_3O
dinarchaeote
LCB
_4Thorarchaeote
AB
_25Thorarchaeote
WO
R_45
ThorarchaeoteW
OR
_83
Tran
slatio
n, ri
boso
mal
struc
ture
and
biog
enes
is
Trans
cript
ion
Replic
ation
, rec
ombin
ation
and
repa
ir
Cell cy
cle co
ntro
l, cell
divi
sion,
chro
mos
ome
parti
tionin
g
Defens
e m
echa
nism
s
Signal
trans
ducti
on m
echa
nism
s
Cell w
all/m
embr
ane/
enve
lope
bioge
nesis
Cell m
otilit
y
Cytosk
eleto
n
Intra
cellu
lar tr
affic
king,
secr
etion
,
and
vesic
ular t
rans
port
Posttr
ansla
tiona
l mod
ificat
ion,
prot
ein tu
rnov
er, c
hape
rone
s
Mob
ilom
e: p
roph
ages
, tra
nspo
sons
Energ
y pro
ducti
on a
nd co
nver
sion
Carbo
hydr
ate
trans
port
and
met
aboli
sm
Amino
acid
tran
spor
t and
met
aboli
sm
Nucleo
tide
trans
port
and
met
aboli
sm
Coenz
yme
trans
port
and
met
aboli
sm
Lipid
trans
port
and
met
aboli
sm
Inor
ganic
ion
trans
port
and
met
aboli
sm
Secon
dary
met
aboli
tes b
iosyn
thes
is,
trans
port
and
cata
bolis
m
0
100
200
0
100
200
0
100
200
0
100
200
0
100
200
0
100
200
0
100
200
0
100
200
0
100
200
CO
Gs
coun
ts
Archaea Bacteria Eukaryota Other
81
50
20
41
64
14
25
24
16
Extended Data Figure 7 | Asgard ESPs are enriched for intracellular trafficking and secretion functions. Overview of functional classification (arCOGs and EggNOG categories) of Asgard proteins assigned to major taxonomic levels. Taxonomic levels are shown in different colours. Note that, in some cases, one protein can be assigned to more than one functional category.
© 2017 Macmillan Publishers Limited, part of Springer Nature. All rights reserved.

ARTICLE RESEARCH
Nucleus
ER
Golgi
LysosomeLL
Endosommee
MVBVB
N-glycosylation
OSTSec61
ESCRT
Ribosomal proteins
L28e/Mak16L22e
Trafficking machinery
TRAPP domainSec23/24-like
Arrestin domainWD40-ARM clusterWD40-TPR cluster
Longin domainEukaryotic RLC7
Small GTPases
ESCRT machinery
VPS25-likeEAP30 domain
Steadiness Box domainVPS20/32/60-like
VPS28-like
VPS2/24/46-like
Ribophorin ISTT3-like
OST3/OST6-like
Sec61*
Cytoskeleton
ProfilinGelsolin domain
ARP-like
ARP2/3 subunit 4-likeTubulin
Conserved Lokiactins
Ubiquitin system
E1-likeE2-like
DUB
Ubiquitin domain
Ubiquitin
Sec23/24-like
TR
AP
PI
Coatomer
Tubulin
Heimdallarchaeote AB_125
Lokiarchaeote CR_4
Heimdallarchaeote LC_2
Heimdallarchaeote LC_3
Odinarchaeote LCB_4
Lokiarchaeum sp. GC14_75
Thorarchaeote WOR_45
Thorarchaeote WOR_83
Thorarchaeote AB_25
Gelsolindomain
Actin
Profilin
ARP2/3 subunit 4-like
Extended Data Figure 8 | Eukaryotic signatures in Asgard archaea. Schematic representation of a eukaryotic cell in which ESPs that have been identified in Asgard archaea are highlighted, including their phylogenetic distribution pattern. The overall picture indicates that the
archaeal ancestor of eukaryotes already contained many key components underlying the emergence of cellular complexity that is characteristic of eukaryotes. DUB, deubiquitinating enzyme; MVB, multi-vesicular body; ER, endoplasmatic reticulum.
© 2017 Macmillan Publishers Limited, part of Springer Nature. All rights reserved.

ARTICLERESEARCH
Extended Data Table 1 | Assembly statistics and quality metrics of reconstructed Asgard genome bins
© 2017 Macmillan Publishers Limited, part of Springer Nature. All rights reserved.
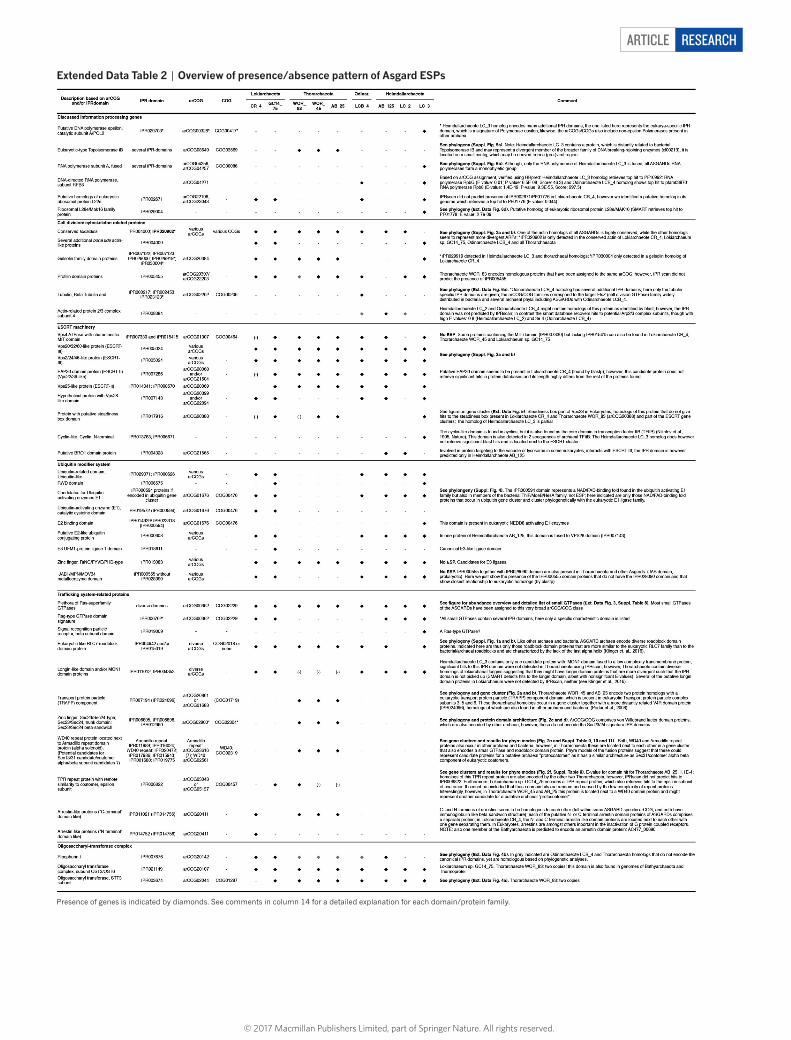
ARTICLE RESEARCH
Extended Data Table 2 | Overview of presence/absence pattern of Asgard ESPs
Presence of genes is indicated by diamonds. See comments in column 14 for a detailed explanation for each domain/protein family.
© 2017 Macmillan Publishers Limited, part of Springer Nature. All rights reserved.