ASEAN Sustainable Business Leader - Credit Suisse
24
ASEAN Sustainable Business Leader HK Conference Hosted by Credit Suisse April 5, 2016 Agenda: 1. Key Drivers and Opportunities 2. Performance Summary and Key Indicators 3. Appendix
Transcript of ASEAN Sustainable Business Leader - Credit Suisse
ASEAN Sustainable Business Leader
HK ConferenceHosted by Credit Suisse
April 5, 2016
Agenda:1. Key Drivers and Opportunities2. Performance Summary and Key Indicators3. Appendix

P. 2
1. Key Drivers and Opportunities
P. 3
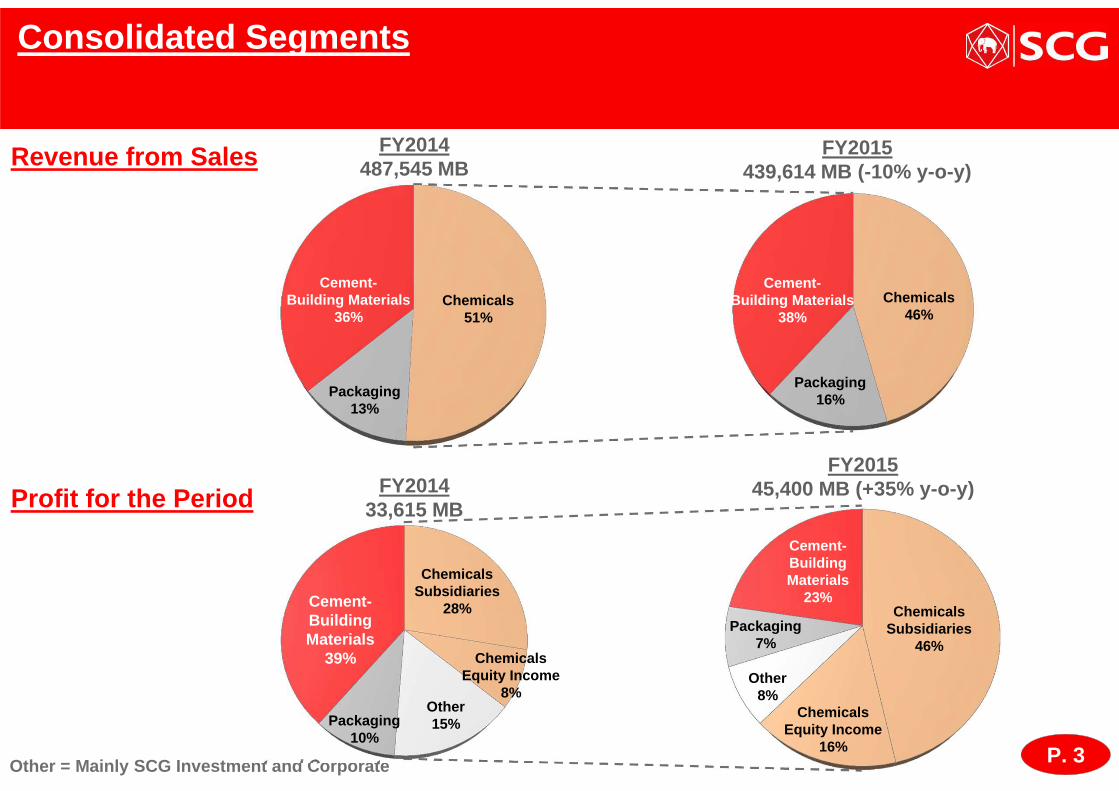
Consolidated Segments
Other = Mainly SCG Investment and Corporate
Revenue from Sales
Profit for the Period
FY2014487,545 MB
Cement-Building Materials
36%
Packaging13%
Chemicals51%
FY2015439,614 MB (-10% y-o-y)
Cement-Building Materials
38%
Packaging16%
Chemicals46%
FY201433,615 MB
FY201545,400 MB (+35% y-o-y)
Other15%
ChemicalsEquity Income
8%
Chemicals Subsidiaries
28%Cement-Building Materials
39%
Packaging10%
Other8%
ChemicalsEquity Income
16%
Chemicals Subsidiaries
46%
Cement-Building Materials
23%
Packaging7%

P. 4
Chemicals: ASEAN portfolio
Flexible products (metathesis)
Thailand VietnamCrackers (SCG 2/3, DOW 1/3)
ROC (1999)Rayong Olefins
1.2 MT C2 + C3
MOC (2010)Map Ta Phut
Olefins1.7MT C2 + C3
Downstream
Subsidiaries Associates
PEPP
PVCOthers
� Dow� Mitsui
Chemicals� Mitsubishi
Rayon� BST
Indonesia Cracker (SCG 30%)
CAP (1995)Chandra Asri
0.9 MT C2 + C3
De-bottleneck(Jan/16 ramp up)
1.3 MT C2 + C3
Cracker
Long Son Petrochemicals(LSP) - $4.5 Billion
+1 MT C2 + C3
Downstream
Subsidiaries Associates
PEPPSMBD
Michelin SSBR (2017 start)
Project Details
JV basisLocated in Southern Vietnam
Update: finalizing JV partner structure.
Flexible feedstock cracker

P. 5
Chemicals product outlook
PE (C2) consumer goods (food packaging)
PP (C3) capital goods (electronics, automotive)
PVC construction related
MMA (C4) consumer / capital goods
BD (C4) rubber substitutes
PTA textiles industry
olefins
aromatics

P. 6
0
100
200
300
400
500
600
700
800
900
1,000
1994 1996 1998 2000 2002 2004 2006 2008 2010 2012 2014 2016 2018
Extended chemicals cycle: HDPE – Naphtha
$/ton
$300/ton trough$20-30 oil & 38-40 Baht FX
Asian crisisUS crisis
EU crisis
$400/ton trough$80-100 oil & 28-33 Baht FX
global operating rate of 93%
P. 7
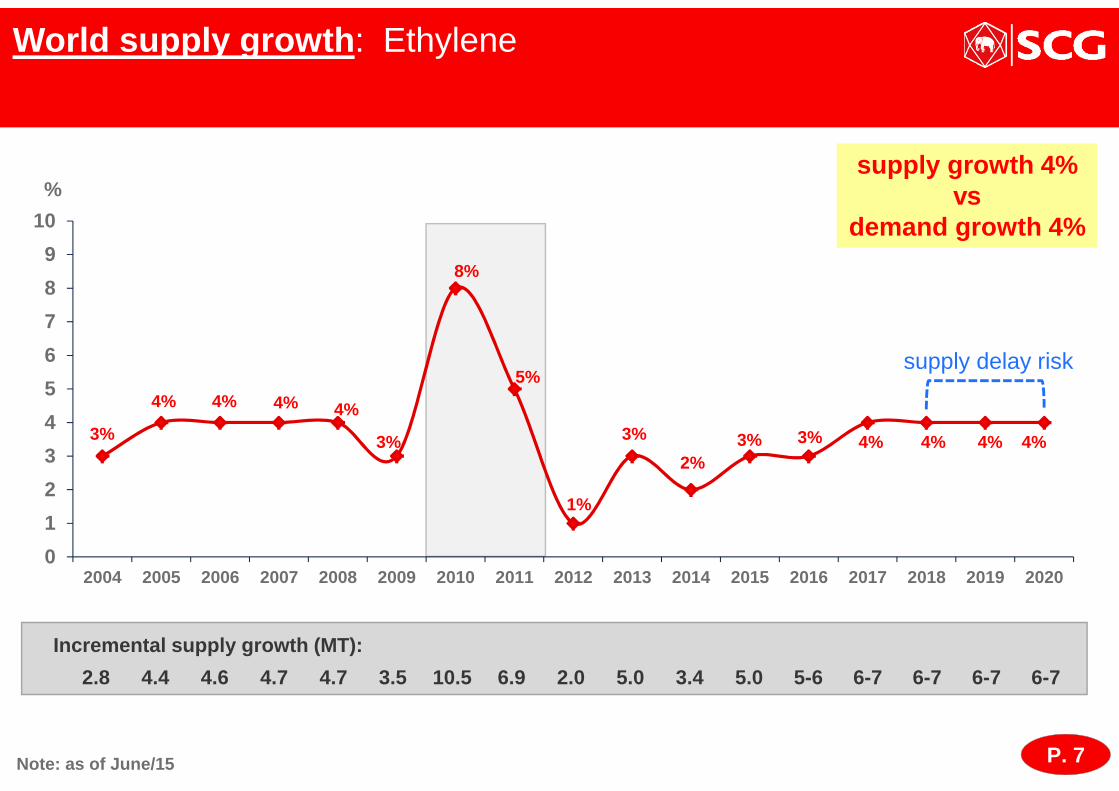
%
3%
8%
5%
1%
3%2%
3%
World supply growth : Ethylene
Incremental supply growth (MT):
4% 4% 4% 4%
3% 3% 4% 4%
2.8 4.4 4.6 4.7 4.7 3.5 10.5 6.9 2.0 5.0 3.4 5.0 5-6 6-7 6-7 6-7 6-7
Note: as of June/15
4% 4%
0
1
2
3
4
5
6
7
8
9
10
2004 2005 2006 2007 2008 2009 2010 2011 2012 2013 2014 2015 2016 2017 2018 2019 2020
supply growth 4%vs
demand growth 4%
supply delay risk

P. 8
HDPE – Naphtha price gap
Note : Prices refer to SEA regional prices

P. 9
PP – Naphtha price gap
Note : Prices refer to SEA regional prices

P. 10
Cement expansion : Leveraging new capacity across ASEAN
Yangon
Khammouan Plant
55 km to Thai border
Phnom Penh
Mawlamyine Plant
KampotPlant
130 km to Phnom Penh
330 km to YangonRecent startup:
Cambodia #2 0.9 MT Oct/15
Indonesia 1.8 MT Nov/15
Existing:
Thailand 23 MT
Cambodia #1 1.1 MT
Vietnam 0.2 MT
North Thai plant
Central Thai plant
South Thai plant
Under Construction:
Myanmar 1.8 MT mid-2016
Laos 1.8 MT mid-2017
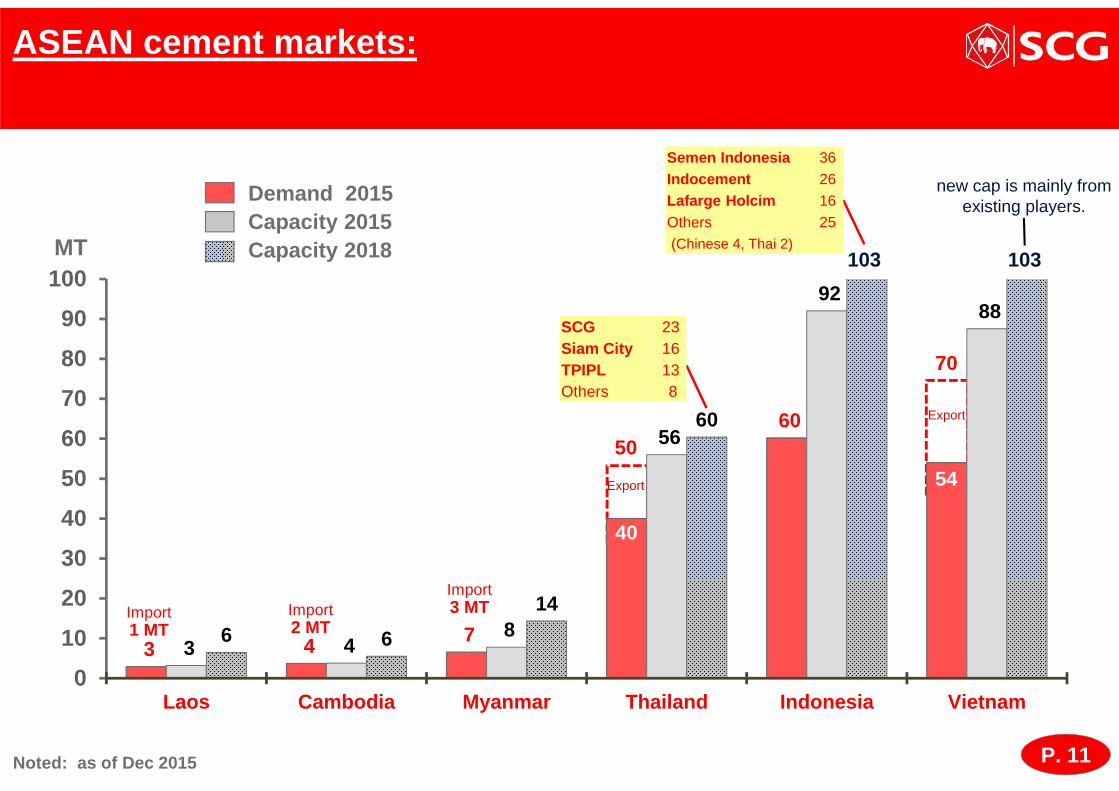
P. 11
3 4 7
60
3 4 8
56
92 88
6 6
14
60
0
10
20
30
40
50
60
70
80
90
100
Laos Cambodia Myanmar Thailand Indonesia Vietnam
Export
50
40
ASEAN cement markets:
Noted: as of Dec 2015
MT
Export
70
54
Import2 MT
Import1 MT
103 103
Demand 2015Capacity 2015Capacity 2018
Import3 MT
SCG 23Siam City 16TPIPL 13Others 8
Semen Indonesia 36Indocement 26Lafarge Holcim 16Others 25(Chinese 4, Thai 2)
new cap is mainly from existing players.

P. 12
Thailand Cambodia Indonesia Myanmar Laos Vietnam
Demand Growth
FY2015 0% +9% +1% +11% +5% to +7% +8%
FY2014 -1% +10% +3% +11% +6% +11%
Market price: ex-factory (FY2015)
US$ / ton $50 - $52 $58 - $68 $50 - $60 $53 - $63 $75 - $80 $50 - $56
Local currency / ton1,800 to 1,850
234,958 to275,468
692,789 to 831,346
68,488 to 81,410
611,245 to651,995
1,094,500 to 1,225,840
FX rate / USD 36.0 4,051 13,856 1,292 8,150 21,890
Note: Indonesia’s cement demand is based on data fr om the Indonesian cement association (ASI).Vietnam’s cement demand in 2015 included only the f irst eleven months.
ASEAN cement markets: FY2015

P. 13
Cement: Thailand’s domestic market segments
Total market growth (y-o-y)
FY132014 2015
Q1 Q2 Q3 Q4 FY14 Q1 Q2 Q3 Q4 FY15
7% 4% 0% -3% -3% -1% -2% 2% -1% 2% 0%
Segments
Commercial 20% 1% 14% 5% -4% -8% -6% 1% -3% 0% -2%(approx 20%)
Government 3% -1% 1% -2% -3% 0% 10% 11% 11% 12% 11%(approx 30%)
Residential 6% -1% 1% -1% -2% -3% -7% -3% -7% -4% -5%
(approx 50%)

P. 14
Packaging: name change = business model change
Packaging Chain - Rengo’s 30% stake in box businesses and Vietnam’s packaging paper plants.
Fibrous Chain - Nippon Paper’s 30% stake.
Recycled Paper(Imported + Local)
Packaging Paper2.3 MT
• Tertiary (1.0 MT)
• Secondary
• Primary
Tree farmed eucalyptus
(mainly contract farm)
Woodchip Pulp0.47 MT
• Dissolving Grade Pulp (textile)
• Hygienic Food Application
• Printing and Writing
Baling station(across ASEAN)

P. 15
Packaging: positive GDP linkage
Fibrous ChainFibrous Chain
Capacity (unit: tons/year) :as of Dec 2015
• Packaging Paper 2,306,000(Thailand, Philippines, Vietnam)
• Consumer & Industrial PackagingCorrugated Containers 1,013,000(Thailand, Singapore, Vietnam, Indonesia, Malaysia)Flexible Packaging 520 million sq.m. (Thailand, Vietnam)
Capacity (unit: tons/year) :as of June 2015
• Pulp* 470,000(Thailand) Dissolving Pulp 96,000
• Printing & Writing Paper 570,000(Thailand)
Packaging ChainPackaging Chain
*While produces dissolving pulp, a capacity of Pulp line will be 325,000 tons per year.

P. 16
2. Performance Summary and Key Indicators

P. 17
HVA: High value added products and services
HVA’s Revenue from Sales
HVA attributes: 5-10% higher margin Performance Solutions provider
Service & Design Branding
Business 2013 2014 2015
Cement- Building Materials 41% 42% 41%
Chemicals 27% 27% 31%
Chemicals (Includes associates) 50% 50% 53%
Packaging 38% 39% 39%

P. 18
Net debt:Internal leverage target of 2.5 times (Net debt / EBITDA)
100.5 103.0 99.9
120.5 122.0
83.6
112.1
137.6
157.8164.4 162.5
1.9 1.8 2.0
3.12.6
1.8
2.4
3.02.6 2.5
2.0
0
1
2
3
4
5
6
7
8
9
10
0
50
100
150
200
250
2005 2006 2007 2008 2009 2010 2011 2012 2013 2014 2015
Billion Baht(Net Debt)
Times (x)(Leverage)
Net Debt on EBITDA
• 2.0x Net Debt / EBITDA • 0.7x Net Debt / Equity • 40,729 MB cash on hand• 98% Thai Baht
• 93% fixed rate retail debenture
• 3.9% coupon
P. 19
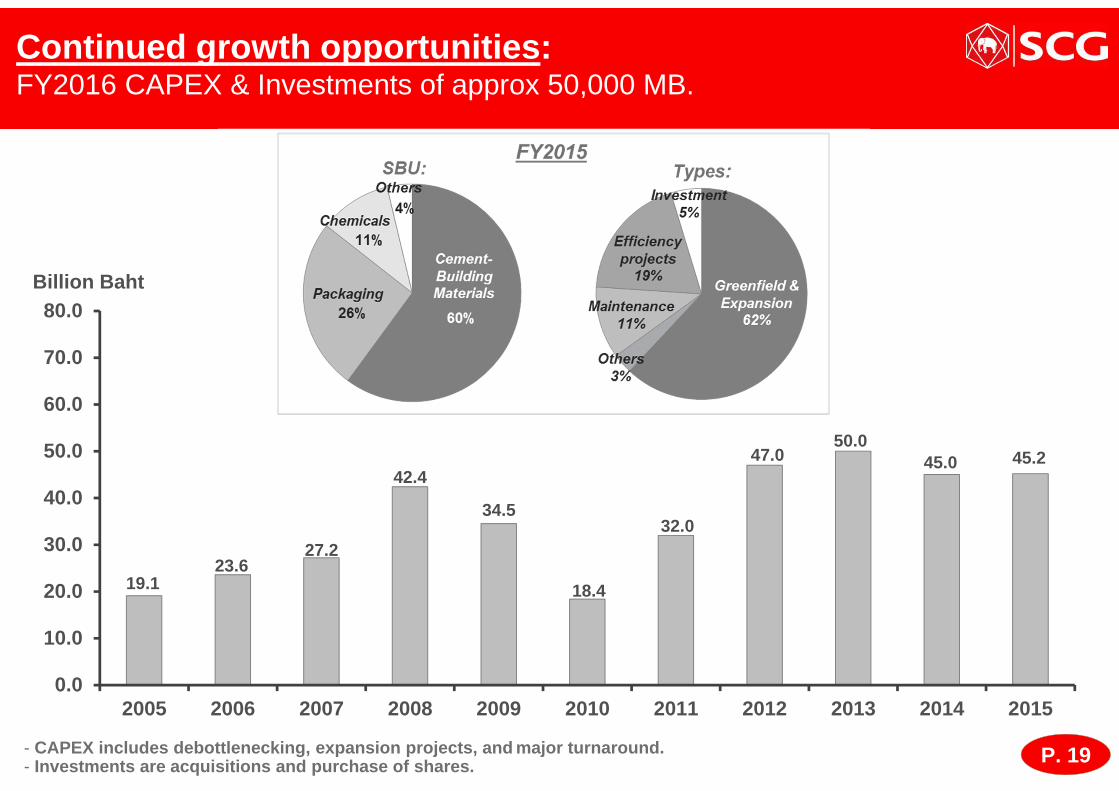
Continued growth opportunities:FY2016 CAPEX & Investments of approx 50,000 MB.
- CAPEX includes debottlenecking, expansion projects, and major turnaround.- Investments are acquisitions and purchase of shares .
19.123.6
27.2
42.4
34.5
18.4
32.0
47.050.0
45.0 45.2
0.0
10.0
20.0
30.0
40.0
50.0
60.0
70.0
80.0
2005 2006 2007 2008 2009 2010 2011 2012 2013 2014 2015
Billion Baht

P. 20
0.01.0
3.0
6.0
15.0 15.0 15.0 15.0
7.58.5
12.5 12.5
11.0
15.5
12.5
16.0
0.0
2.0
4.0
6.0
8.0
10.0
12.0
14.0
16.0
2000 2001 2002 2003 2004 2005 2006 2007 2008 2009 2010 2011 2012 2013 2014 2015
Dividend policy
Note: Dividend policy established in 2008
Payout ratio = 40-50%
100 yrspecial
dividend
Baht / Share
% ofNet Profit
0% 16% 25% 36% 49% 56% 61% 59% 54% 42% 40% 55% 56% 51% 45% 42%
P. 21
3. Appendix
P. 22
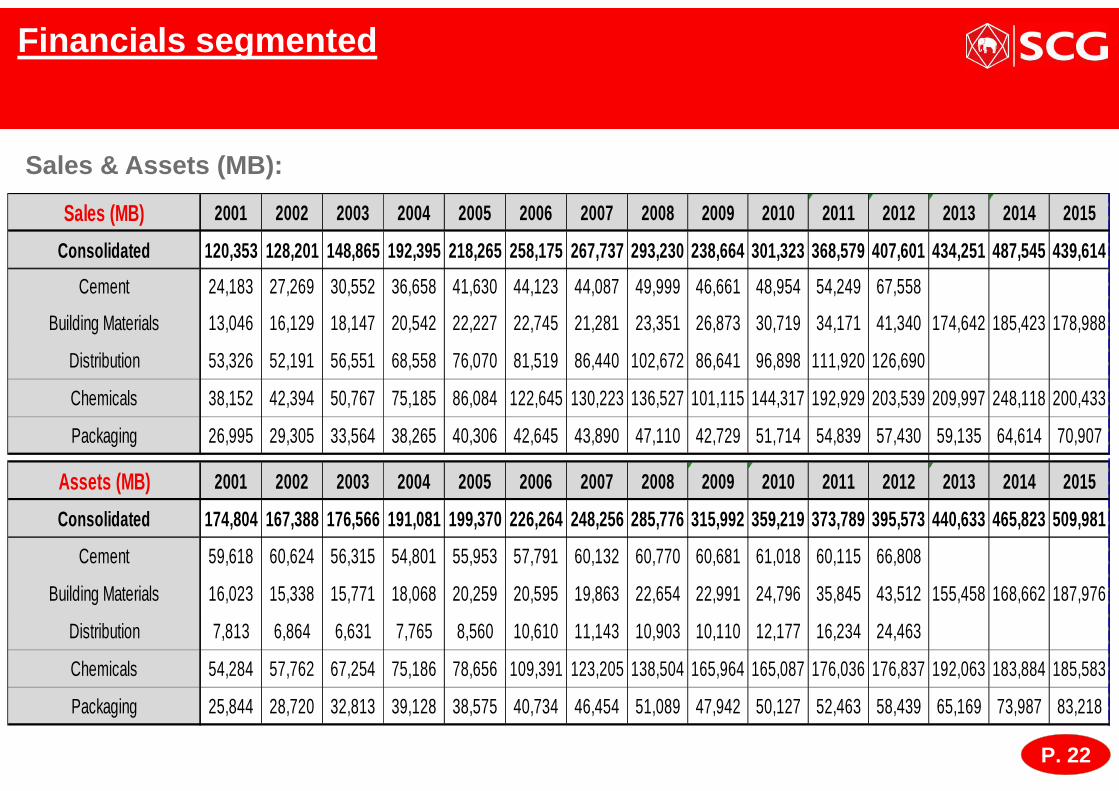
Financials segmented
Sales & Assets (MB):
Sales (MB) 2001 2002 2003 2004 2005 2006 2007 2008 2009 2010 2011 2012 2013 2014 2015
Consolidated 120,353 128,201 148,865 192,395 218,265 258, 175 267,737 293,230 238,664 301,323 368,579 407,601 434,251 487,545 439,614
Cement 24,183 27,269 30,552 36,658 41,630 44,123 44,087 49,999 46,661 48,954 54,249 67,558
Building Materials 13,046 16,129 18,147 20,542 22,227 22,745 21,281 23,351 26,873 30,719 34,171 41,340 174,642 185,423 178,988
Distribution 53,326 52,191 56,551 68,558 76,070 81,519 86,440 102,672 86,641 96,898 111,920 126,690
Chemicals 38,152 42,394 50,767 75,185 86,084 122,645 130,223 136,527 101,115 144,317 192,929 203,539 209,997 248,118 200,433
Packaging 26,995 29,305 33,564 38,265 40,306 42,645 43,890 47,110 42,729 51,714 54,839 57,430 59,135 64,614 70,907
Assets (MB) 2001 2002 2003 2004 2005 2006 2007 2008 2009 2010 2011 2012 2013 2014 2015
Consolidated 174,804 167,388 176,566 191,081 199,370 226, 264 248,256 285,776 315,992 359,219 373,789 395,573 440,633 465,823 509,981
Cement 59,618 60,624 56,315 54,801 55,953 57,791 60,132 60,770 60,681 61,018 60,115 66,808
Building Materials 16,023 15,338 15,771 18,068 20,259 20,595 19,863 22,654 22,991 24,796 35,845 43,512 155,458 168,662 187,976
Distribution 7,813 6,864 6,631 7,765 8,560 10,610 11,143 10,903 10,110 12,177 16,234 24,463
Chemicals 54,284 57,762 67,254 75,186 78,656 109,391 123,205 138,504 165,964 165,087 176,036 176,837 192,063 183,884 185,583
Packaging 25,844 28,720 32,813 39,128 38,575 40,734 46,454 51,089 47,942 50,127 52,463 58,439 65,169 73,987 83,218

P. 23
EBITDA & Profit for the Period (MB):
Financials segmented : continued
EBITDA (MB) 2001 2002 2003 2004 2005 2006 2007 2008 2009 2010 2011 2012 2013 2014 2015
Consolidated 28,884 30,418 37,188 54,626 53,507 57,151 50, 008 38,783 47,116 45,949 46,253 45,716 61,265 66,493 82,690
Cement 7,615 7,917 11,581 13,175 13,235 12,200 10,198 11,272 11,616 10,810 12,781 14,824
Building Materials 3,140 3,605 4,382 5,307 5,387 4,856 3,928 4,085 4,907 5,489 5,060 6,661 26,274 26,683 24,395
Distribution 1,268 1,214 602 1,541 1,546 1,498 1,576 1,739 1,581 1,440 1,532 1,564
Chemicals 6,443 6,452 9,851 23,642 19,653 26,199 22,611 12,598 19,482 16,024 14,394 8,628 20,342 26,142 42,900
Packaging 8,205 9,536 9,819 9,840 9,496 9,634 7,943 6,660 7,901 9,129 8,811 8,844 9,473 9,718 10,831
Profit for the Period (MB) 2001 2002 2003 2004 2005 2006 2007 2008 2009 2010 2011 2012 2013 2014 2015
Consolidated 7,634 14,604 19,954 36,483 32,236 29,451 30,3 52 16,771 24,346 37,382 27,281 23,580 36,522 33,615 45,400
Cement 859 2,006 5,313 6,582 7,916 6,652 5,463 6,006 6,214 6,014 7,288 9,163
Building Materials 410 1,521 2,253 2,700 3,071 1,939 950 778 1,617 1,872 1,476 2,949 16,092 13,180 10,250
Distribution 680 586 251 968 1,079 1,021 939 1,211 1,077 1,061 1,075 1,035
Chemicals 2,611 5,285 7,777 20,523 16,656 17,574 16,982 6,136 12,556 22,609 11,190 2,690 11,292 12,461 28,488
Packaging 3,272 4,079 4,424 4,122 3,689 3,574 2,353 1,658 2,286 3,490 3,331 3,560 3,587 3,448 3,463


![ASEAN + ME [ASEAN object traveler]](https://static.fdocuments.net/doc/165x107/568c534f1a28ab4916ba3e5d/asean-me-asean-object-traveler.jpg)