ASEAN Fuel Economy Roadmap for the Transport Sector 2018 ... · 70A Jalan Sisingamangaraja Jakarta...
104
ASEAN Fuel Economy Roadmap for the Transport Sector 2018-2025: with Focus on Light-Duty Vehicles
Transcript of ASEAN Fuel Economy Roadmap for the Transport Sector 2018 ... · 70A Jalan Sisingamangaraja Jakarta...

ASEAN Fuel Economy Roadmapfor the Transport Sector 2018-2025:with Focus on Light-Duty Vehicles


ASEAN Fuel Economy Roadmap for the Transport Sector 2018-2025:
with Focus on Light-Duty Vehicles
The ASEAN SecretariatJakarta

The Association of Southeast Asian Nations (ASEAN) was established on 8 August 1967. The Member States of the Association are Brunei Darussalam, Cambodia, Indonesia, Lao PDR, Malaysia, Myanmar, Philippines, Singapore, Thailand and Viet Nam.
The ASEAN Secretariat is based in Jakarta, Indonesia.
For inquiries, contact:The ASEAN SecretariatCommunity Relations Division (CRD)70A Jalan SisingamangarajaJakarta 12110, IndonesiaPhone : (62 21) 724-3372, 726-2991Fax : (62 21) 739-8234, 724-3504E-mail : [email protected]
Catalogue-in-Publication Data
ASEAN Fuel Economy Roadmap for Transport Sector 2018-2025: With Focus on Light-Duty VehiclesJakarta, ASEAN Secretariat, February 2019
388.09591. ASEAN – Transportation – Policy 2. LDV – Fuel Economy Platform
ISBN 978-602-5798-32-0
ASEAN: A Community of Opportunities for All
With the Support of:
The ASEAN Fuel Economy Roadmap for the Transport Sector 2018-2025: With Focus on Light-Duty Vehicles has been produced with the support of the German international development agency Deutsche Gesellschaft für Internationale =XVDPPHQDUEHLW��*,=��XQGHU�WKH�$6($1�*HUPDQ�7HFKQLFDO�&RRSHUDWLRQ�3URMHFW�RQ�(QHUJ\�(I¿FLHQF\�DQG�&OLPDWH�Change Mitigation in the Land Transport Sector of the ASEAN Region Phase II, funded by the German Federal Ministry for Economic Cooperation andDevelopment.
Findings, interpretations and conclusions expressed in this publication are based on information gathered by GIZ and its FRQVXOWDQWV��SDUWQHUV��DQG�FRQWULEXWRUV��7KH\�GR�QRW�QHFHVVDULO\�UHÀHFW�WKH�YLHZV�RI�*,=�RU�$6($1�RU�LWV�0HPEHU�6WDWHV�
GIZ or ASEAN does not guarantee the accuracy or completeness of information in this document, and shall not be held responsible for any errors, omissions or losses which emerge from its use.
The text of this publication may be freely quoted or reprinted, provided proper acknowledgement is given and a copy containing the reprinted material is sent to the Community Relations Division (CRD) of the ASEAN Secretariat, Jakarta.
General information on ASEAN appears online at the ASEAN Website: www.asean.org
Copyright Association of Southeast Asian Nations (ASEAN) 2019.
All rights reserved.

3
Table of ContentsTable of Contents ....................................................................................................................... 3Table of Figures, Tables and Boxes ........................................................................................... 5Abbreviations............................................................................................................................... 7Preface ................................................................................................................................ 11Executive summary ..................................................................................................................... 1 Introduction .......................................................................................................................... 17 1.1 Regional policy context: KLTSP, fuel economy platform and this roadmap.................... 17 1.2 6FRSH�DQG�GH¿QLWLRQV ..................................................................................................... 19
2 Current status in the ASEAN region ................................................................................... 21 2.1 Economic development and motorisation ...................................................................... 21 2.2 LDV energy use and CO2 emissions ............................................................................. 22 2.3 The LDV market in the ASEAN region ........................................................................... 23 2.4 LDV fuel economy in the ASEAN region and the Member States .................................. 24 2.5 Overview of LDV fuel economy policies in the ASEAN regio ......................................... 26 2.6 Gaps and Barriers .......................................................................................................... 28
3 Vision, goals and recommended actions towards 2025 ................................................... 30 3.1 2025 Vision ..................................................................................................................... 39 3.2 Aspirational goals towards 2025 .................................................................................... 30 3.3 Recommended actions to meet the goals ...................................................................... 33
4 Options for fuel economy policy development ................................................................. 36 4.1 'H¿QLWLRQ�RI�LQGLFDWRUV�DQG�methodologies ..................................................................... 37 4.2 Consumer information .................................................................................................... 40 4.3 Fiscal policy measures ................................................................................................... 41 4.3.1 Fuel economy-based vehicle registration tax feebate schemes ............................ 41 4.3.2 Fuel economy-based vehicle circulation tax .......................................................... 42 4.3.3 Fuel taxation .......................................................................................................... 43 4.4 Regulatory policy measures ........................................................................................... 43 4.4.1 Fuel economy standards ....................................................................................... 43 4.4.2 Fuel quality regulation ........................................................................................... 44 4.5 Vehicle maintenance ...................................................................................................... 44 4.6 In-use fuel economy measures ...................................................................................... 45
5 Annex 5.1 Global context for fuel economy policy ........................................................................... 46 5.1.1 Transport energy use, emissions and climate change .......................................... 46 5.1.2 Light-duty vehicle fuel economy standards around the world ............................... 46 5.2 &RVWV��EHQH¿WV�DQG�LPSDFW�DVVHVVPHQW�RI�/'9�IXHO�HFRQRP\�policy ............................ 47 5.2.1 Introduction to LDV fuel economy technology ....................................................... 49 5.2.2 (FRQRPLF�FRVWV�DQG�EHQH¿WV�RI�/'9�IXHO�HFRQRP\ .............................................. 49 5.2.3 0HWKRGRORJ\�DQG�WRROV�IRU�FRVW�EHQH¿W�DQDO\VLV�RI�IXHO�economy policy within AMSs .......................................................................................................... 53 5.2.4 Impact assessment of the aspirational fuel economy goal .................................... 55 5.3 Existing fuel economy policies in ASEAN Member States ............................................. 59 5.4 Gaps and barriers to fuel-economy policy in ASEAN and AMS ..................................... 64 5.4.1 The lack of knowledge and data for developing fuel economy baselines ............. 64

4
5.4.2 The role of second-hand imported vehicles .......................................................... 65 5.4.3 Administrative barriers for fuel economy policy development ............................... 66 5.4.4 Behavioural challenges ......................................................................................... 66 5.5 Policy and technical toolbox for comprehensive fuel economy policy ............................ 67 5.5.1 International experience: strategies for fuel economy improvement ..................... 67 5.5.2 Strategies for consumer awareness of fuel consumption ...................................... 68 5.5.3 Feebate design and implementation ..................................................................... 70 5.5.4 Circulation tax design and implementation ............................................................ 74 5.5.5 Fuel tax design and implementation ...................................................................... 76 5.5.6 Design and implementation of fuel economy standards ........................................ 76 5.5.7 Air pollutant emission standards and fuel economy .............................................. 81 5.5.8 Fuel quality regulation ........................................................................................... 84 5.6 Methodological considerations ....................................................................................... 86 5.6.1 Options for determining the level of ASEAN’s aspirational LDV fuel consumption goal ............................................................................................. 86 5.6.2 'H¿QLWLRQ�RI�SDVVHQJHU�FDUV�DQG�light commercial vehicles in major markets ...... 89 5.6.3 Examples of light-duty vehicles ............................................................................. 90 5.6.4 Conversion factors ................................................................................................ 90 5.6.5 Fuel economy versus fuel consumption ................................................................ 91 5.7 Widening the scope beyond LDV fuel economy ............................................................. 92 5.7.1 Heavy-duty vehicle fuel economy .......................................................................... 92 5.7.2 Electric vehicles and shared mobility .................................................................... 95 5.7.3 Two-wheelers ........................................................................................................ 97
6 References ............................................................................................................................ 99

5
Table of Figures, Tables and Boxes)LJXUH���� +LVWRULFDO�WRWDO�¿QDO�HQHUJ\�XVH�E\�IXHO�DQG�E\�VHFWRU�LQ������������DQG������ in the ASEAN region.................................................................................................................. 22Figure 2: Energy-related CO2 emission external costs in the ASEAN region by sector in 2018 and 2025
22Figure 3: Overview of vehicle sales and production in the ASEAN region (Excluding two- and three-wheelers) ......................................................................................... 23Figure 4: Fuel Economy Baselines Study conducted by GFEI in ASEAN and the World ......................... 24Figure 5: New LDV characteristics in the ASEAN region compared to the world in 2015 ........................ 25Figure 6: New LDV characteristics in Indonesia, Malaysia, the Philippines, Thailand and the ASEAN region in 2015......................................................................................................... 26Figure 7: Non-mandatory fuel consumption standards for passenger cars in Thailand and Viet Nam compared to the mandatory standard in the EU ................................................. 28Figure 8: Enacted and Proposed LDV Fuel Economy Targets around the World – � ZLWK�8QL¿HG�&DQDGD�DQG�86������WDUJHWV�UHSUHVHQWLQJ�SDVVHQJHU�YHKLFOHV�DQG�OLJKW�WUXFNV .. 30Figure 9: The ASEAN LDV fuel consumption goal in comparison to enacted and proposed � /'9�IXHO�HFRQRP\�±�1RWH��&DQDGD�DQG�86�WDUJHWV�DUH�XQL¿HG�IRU������DQG� represent passenger cars and light trucks together. ................................................................. 31Figure 10: Schematic overview of the roadmap vision, goals and actions ................................................. 35Figure 11: Overview of fuel economy policy measure categories .............................................................. 36Figure 12: Global urban and non-urban transport CO2 emissions ............................................................. 46Figure 13: Global passenger light-duty vehicle emission reduction potential ............................................. 47Figure 15 GFEI target to double vehicle fuel economy by reducing new vehicle fuel consumption by 50% by 2030 ................................................................................................... 47Figure 14: Overview of the global status of light-duty and heavy-duty vehicle fuel economy policies ....... 48Figure 15: CO2 reduction potential and additional direct manufacturing costs for a segment c petrol car for the years 2015, 2020 and 2025. .................................................................................... 51Figure 16: Comparison of technology costs and fuel savings of passenger cars....................................... 52Figure 17: LDV energy use in the ASEAN 2000 to 2050 under the benchmark scenario (BMS) as well as the ASEAN Fuel Economy Policies Scenario (FEPS) .............................................. 56Figure 18: LDV transport energy intensity in the ASEAN 2000 to 2050 under the benchmark scenario (BMS) and the ASEAN Fuel Economy Policies Scenario (FEPS) ........................................................ 56Figure 19: LDV wheel-to-wheel CO2 emissions in the ASEAN 2000 to 2050 under the benchmark scenario (BMS) and the ASEAN Fuel Economy Policies Scenario (FEPS) .............................. 57Figure 20: Total transport well-to-wheel CO2 Emissions and LDV emission reductions in the ASEAN for selected years under the benchmark scenario (BMS) as well as the ASEAN Fuel Economy Policies Scenario (FEPS) ............................................................... 57Figure 21: Cumulative costs of new LDV purchases and fuel use 2018 to 2025 and 2018 to 2040 in the ASEAN region under a business- as- usual (BAU) as well as the ASEAN FE RM Scenario ..................................................................................................... 58Figure 22: Fuel economy baseline coverage of the ASEAN LDV market 2015.......................................... 64Figure 23��� 6WDNHKROGHU�GLDJUDP�WR�LGHQWLI\�UROHV�DQG�UHVSRQVLELOLWLHV�RI�YHKLFOH�IXHO�HI¿FLHQF\� related government agencies in Thailand ................................................................................. 66Figure 24: Vehicle size evolution across the world 2005-15....................................................................... 67Figure 25: Historical fuel economy improvement and annual fuel economy improvement rate for selected EU countries and the EU27 ............................................................................ 67Figure 26��� 6SHFL¿F�IXHO�FRQVXPSWLRQ�SHU�HQJLQH�SRZHU�DV�D�IXQFWLRQ�RI�HQJLQH�SRZHU� for various LDV markets ............................................................................................................ 68Figure 27: Fuel economy labels of Singapore, Thailand and Viet Nam ..................................................... 69Figure 28: The fuel economy label of the United States............................................................................. 69Figure 29: Schematic illustration of a fuel consumption -based feebate scheme....................................... 71Figure 30: Feebate schemes of France 2016 and 2017 and Singapore 2015. The Singaporean CEVS was replaced by a multi-pollutant Vehicular Emissions Scheme in 2018. ...................... 73Figure 31: Annual average circulation and one-off registration tax for selected EU countries ................... 76Figure 32: Sales by CO2 emission class (left), and sales by powertrain type (right), and powertrain and sales-weighted average CO2 emissions and fuel consumption for Turkey, 2005 to 2015 . 77

6
Figure 33: Vehicle prices and taxation selected models in Turkey, Germany, France and the Netherlands. 78Figure 34��� 6FKHPDWLF�SURFHGXUH�RI�VHWWLQJ�D�PDQXIDFWXUHU�VSHFL¿F�DQG�DWWULEXWH��EDVHG�&2�� emission standard ..................................................................................................................... 79Figure 35: Weight- versus size- based fuel consumption and CO2 emission standard ............................. 80Figure 36: CO2 emission target curves for PLDVs and LCVs in the European Union for the years 2017 to 2020 and post 2020............................................................................................................... 81Figure 37: Overview of vehicle pollutant emission standards in selected AMSs and other global jurisdictions ................................................................................................................................ 83Figure 39: Annual GHG emissions and fuel consumption from tractor-trailers and rigid trucks � ZRUOGZLGH�E\�HI¿FLHQF\�VFHQDULR����������� ............................................................................ 93Figure 40�� 9HKLFOH�IXHO�FRQVXPSWLRQ��OHIW��DQG�ORDG�VSHFL¿F�IXHO�FRQVXPSWLRQ��ULJKW��RI�EDVHOLQH�WUDFWRU� trailers over the world heavy duty vehicle cycle (WHVC) at empty, half, and full load .............. 94Figure 41: Global electric vehicle stock by country .................................................................................... 96Figure 42: Powertrain and fuel costs for conventional cars, battery electric vehicles and plug-in hybrids for the years 2015 and 2030 for the US, China, Japan and Europe ......................................... 96Figure 43: Motorcycle Sales and Production in ASEAN and the World ...................................................... 98
Table 1: Summary of the goals and actions of the roadmap ..................................................... 15Table 2: Vision and goals of the KLTSP with regard to sustainable transport ........................... 18Table 3: Actions and milestones of the KLTSP with regard to fuel economy ............................ 18Table 4: Vehicle ownership, saturation level and GDP per capita today and future projections 21Table 5: Gasoline Prices in AMSs and Reference Countries .................................................... 28Table 6: Suggested measures, indicators, conversion factors and methodologies for fuel economy policy development, enacting and monitoring .................................. 38Table 7: Enacted fuel consumption standards around the world ............................................... 487DEOH������ 9HKLFOH�WHFKQRORJLHV�IRU�IXHO�HI¿FLHQF\�LPSURYHPHQW�E\ category .............................. 50Table 9: Cost effectiveness of light-duty vehicle�HI¿FLHQF\�VWDQGDUGV�DURXQG�WKH�ZRUOG ........... 52Table 10: Overview of the status of fuel economy policies in the ASEAN region ........................ 59Table 11: Import regulation for used vehicles in the ASEAN region ............................................ 65Table 12: Overview of annual circulation tax schemes around the world .................................... 75Table 13: Overview of vehicle emissions .................................................................................... 82Table 14: Pros and cons of harmonisation of ASEAN fuel quality standards .............................. 857DEOH������'H¿QLWLRQ�RI�SDVVHQJHU cars and light commercial vehicles in major markets ............ 89Table 16: Examples of light-duty vehicles ................................................................................... 90Table 17: Fuel�VSHFL¿F�FRQYHUVLRQ�IDFWRUV�WR�QRUPDOLVH�IXHO�FRQVXPSWLRQ�YDOXHV� to the energy content of gasoline ................................................................................ 917DEOH������)XHO�VSHFL¿F�&2� emission factors ............................................................................. 91Table 19: Tractor-trailer baseline fuel consumption for various world markets ........................... 94
Box 1: Fuel consumption baseline setting methodology ........................................................... 39Box 2: The Global Fuel Economy Initiative ................................................................................ 47Box 3: Spotlight on modelling tools ........................................................................................... 54

7
Abbreviations2DS 2-degree scenario8DCT 8-gear dual-clutch transmissionACE ASEAN Centre for EnergyADB Asian Development BankADEME French Environment and Energy Management Agency
(Agence de l’Environnement et de la Maîtrise de l’Énergie)AMS ASEAN Member StatesAPAEC ASEAN Plan of Action for Energy CooperationASEAN Association of Southeast Asian NationsASI avoid-shift-improveAtkCPS Atkinson cycle engine with cam phase shiftingBAU business as usualBEV battery electric vehicleBMS benchmark scenarioBOI board of investmentCAFE corporate average fuel economy&%$� FRVW�EHQH¿W�DQDO\VLVCEGR cooled exhaust gas recirculationCEVS carbon emissions-based vehicle schemeCNG compressed natural gasCO2 carbon dioxideDEDE Department of Alternative Energy Development and
(I¿FLHQF\DLT Department of Land TransportED Excise DepartmentEE&C-SSN� (QHUJ\�(I¿FLHQF\�DQG�&RQVHUYDWLRQ�6XE�6HFWRU�1HWZRUNEEA European Environmental AgencyEGSLT Expert Group on Sustainable Land Transport(332� (QHUJ\�3ROLF\�DQG�3ODQQLQJ�2I¿FHEU European UnionEV electric vehicleEVI Electric Vehicle InitiativeFEPIT Fuel Economy Policy Impact ToolFEPS Fuel Economy Policy Scenario

8
gCO2 gramme carbon dioxideGDP gross domestic productGFEI Global Fuel Economy InitiativeGHG greenhouse gasGIZ German international development agency (Gesellschaft für
Internationale Zusammenarbeit)GVW gross vehicle weightHC hydro carbonHDV heavy-duty vehicleHEPS High Energy Performance StandardHFT heavy freight truckICCT International Council on Clean TransportationICE internal combustion engineIEA International Energy AgencyIMMA International Motorcycle Manufacturers AssociationITF International Transport ForumJC08 Japan Chassis 08kg kilogrammeKLTSP Kuala Lumpur Transport Strategic Plankm/L kilometre per litrekW kilowattL litreL/100km litre per 100 kilometresLCV light commercial vehicleLDV light-duty vehicleLGE litres of gasoline equivalentLGe/100km litres of gasoline equivalent per 100 kilometresLPG� OLTXL¿HG�SHWUROHXP�JDVM5 manual 5-gear transmissionMEPS Minimal Energy Performance StandardMFT medium freight truckMPV multi-purpose vehicleMt megatonneMtoe megatonne of oil equivalentNAMA Nationally Appropriate Mitigation ActionNDC Nationally Determined ContributionNEDC New European Driving Cycle

9
NMT non-motorised transportNO nitrous oxideNO2 nitrous dioxideOBD on board diagnosticOECD Organisation for Economic Co-operation and DevelopmentOICA International Organization of Motor Vehicle Manufacturers
(Organisation Internationale des Constructeurs d’Automobiles)
OIE� 2I¿FH�RI�,QGXVWULDO�(FRQRPLFVONEP� 2I¿FH�RI�1DWXUDO�5HVRXUFHV�DQG�(QYLURQPHQWDO�3ROLF\�DQG�
PlanningOTP� 2I¿FH�RI�7UDQVSRUW�DQG�7UDI¿F�3ROLF\�3ODQQLQJPC passenger carPCD Pollution Control DepartmentPHEV plug-in hybrid electric vehiclePLDV passenger light-duty vehiclePM particulate matterPPM parts per millionPTIT Petroleum Institute of ThailandRL road loadSGTDI stoichiometric gasoline turbocharged direct injectionSOx sulphur oxidesSS start stopSUV sports utility vehicleTAI Thailand Automotive InstituteTISI Thai Industrial Standards InstituteUNEP United Nations Environment ProgrammeVAT value added taxVTPI Victoria Transport Policy InstituteWHVC World Heavy Duty Vehicle CycleWLTC Worldwide Harmonized Light-Duty Vehicles Test Cycle


11
Preface
Within the next ten years, passenger car travel is projected to double across the ten Member States of the Association for Southeast Asian Nations (ASEAN) (IEA 2012a). By 2025, sales of passenger cars are estimated to be well above 3 million cars per year, from about 1.5 million in 2015 (OICA 2016). With increasing car ownership but overall still low motorisation levels in ASEAN, it is realistic to expect substantial further growth in motorisation, along with growth in fuel consumption and emissions of CO2 and other pollutants. As a result, stepping up fuel economy policy efforts is vital for making these growth trends compatible with climate change efforts, including towards urban air quality and the need for resource HI¿FLHQF\��
6XVWDLQDEOH� WUDQVSRUW� KDV� EHHQ� LGHQWL¿HG�DV� D� IXQGDPHQWDO� SLOODU� RI�$6($1¶V� UHJLRQDO�transport agenda under the Kuala Lumpur Transport Strategic Plan 2016-2025 (KLTSP). (QHUJ\� HI¿FLHQF\� RI� WUDQVSRUWDWLRQ� LV� D� NH\� DVSHFW� RI� WKH� SODQ¶V� 6XVWDLQDEOH� 7UDQVSRUW�Strategic Goal, making fuel economy policy a priority for cooperation and implementation across the region.
This document provides a roadmap for the development and implementation of fuel economy policies for ASEAN Member States (AMS), aimed primarily at regulators in government agencies who are or who should be involved in fuel economy policy development. The roadmap is intended to serve as catalyser to engage all relevant stakeholders from government, industry and academia. It not only addresses experts but can also be used to inform the interested public about the issue of vehicle fuel economy.
This roadmap is meant to be used to advance fuel economy policies within the AMS, and also for AMS to venture together towards more coherent and eventually common policy DSSURDFKHV�� ,W� QHLWKHU� DLPV� DW� D� RQH�VL]H�¿WV�DOO� DSSURDFK�� QRU� GRHV� LW� SURYLGH� FRXQWU\�VSHFL¿F�SROLF\�SURSRVDOV��5DWKHU��LW�RIIHUV�D�SROLF\�WRROER[�WKDW�SUHVHQWV�IXHO�HFRQRP\�SROLF\�measures, different data and regulatory requirements, and the steps for introducing them.
A vision, set of goals and list of recommended actions is presented as a comprehensive set of recommendations for AMS to establish and implement successful fuel economy policies, aiming for a common approach across ASEAN where possible. Furthermore, a comprehensive annex is included, with detailed information on each topic of the roadmap, such as global trends, country case studies, fuel economy policies of AMS, and related issues like clean fuels, electric mobility, two-wheelers, freight vehicles, and more.
The vision, goals and policy recommendations in this roadmap are non-binding and recognise the right of ASEAN and each AMS to develop their own goals and policies. Nevertheless, the roadmap is meant to be a guideline for future regional and national initiatives in the region.


13
Executive summary
Current status in the ASEAN regionAutomotive fuel economy is part of the regional transport agenda of the Association of Southeast Asian Nations (ASEAN) through the Kuala Lumpur Transport Strategic Plan 2016-2025 (KLTSP). This roadmap implements the KLTSP’s Sustainable Transport Milestone 1.3.2, which is to ‘formulate a fuel economy roadmap for the transport sector in ASEAN including policy guidelines.’ Fuel economy is represented in this document as a reduction in fuel consumption per 100 km.
Motorisation in ASEAN is on a growth path, along with increasing incomes and car ownership. However, overall motorisation levels remain relatively low in many ASEAN Member States (AMSs). Passenger car travel is projected to double within the ASEAN region within the next ten years (IEA 2012a), and sales of passenger cars could rise above 3 million cars per year by 2025, from about 1.5 million in 2015 (OICA 2016).
However, the light-duty vehicles (LDVs) that are on the market in ASEAN are typically OHVV�HI¿FLHQW�WKDQ�HOVHZKHUH�LQ�WKH�ZRUOG��:KLOH�WKH�UHODWLYH�VPDOO�VL]H�DQG�ZHLJKW�RI�WKH�vehicles sold in the region would suggest low fuel consumption per 100 km, the average of vehicles sold in ASEAN is higher than, for example, in India, the European Union and Japan (although lower than Canada and the US).
The average LDV fuel consumption per 100 km, averaged across the sales of all vehicles in the market (i.e. sales-weighted average) was about 7.2 litres of gasoline equivalent (LGe) per 100km in 2015 across Thailand, Indonesia, Malaysia, the Philippines and Singapore (representing 95% of sales in the bloc), slightly higher than the world average of 7.0 LGe/100km. The average across the Organisation for Economic Co-operation and Development (OECD) is about 6.8 LGe/100km (GFEI 2017), indicating that in the long run, WKHUH�LV�DGHTXDWH�WHFKQRORJ\�WR�VLJQL¿FDQWO\�LPSURYH�WKH�HI¿FLHQF\�RI�YHKLFOHV�LQ�WKH�UHJLRQ�
There is a need for AMS and ASEAN to put commitments in place to reduce the emissions of greenhouse gas (GHG) and to enhance the technological and innovation capabilities of their automotive industries, by making policy initiatives to drive improvements. In a world in which most major economies have introduced fuel economy targets for their markets, D�SROLF\�SXVK�IRU�KLJKHU�HI¿FLHQF\�ZLOO�DOVR�VWUHQJWKHQ�H[SRUW�RSSRUWXQLWLHV�IRU�FDUV�PDGH�in ASEAN. Putting in place goals and policies is important not only to avoid AMS falling EHKLQG� IXUWKHU� LQ� WHUPV�RI� IXHO�HI¿FLHQW�FDUV��EXW�DOVR� WR�DYRLG� WKHP� ORVLQJ�D�FRPSHWLWLYH�advantage for cars made in ASEAN in the global marketplace. Harmonising these policies gradually among AMS is also important for market integration, as it will reduce the burden of regulatory compliance for automakers operating across ASEAN.

14
7KH�SRWHQWLDO� IRU� LQFUHDVLQJ�IXHO�HI¿FLHQF\� LV�JUHDW�DFURVV�DOO�$06��7KLV�SRWHQWLDO�FDQ�EH�tapped by curbing the trend towards bigger size, weight and performance of cars, and by HQVXULQJ� WKDW�VWDWH�RI�WKH�DUW� IXHO�HI¿FLHQF\� WHFKQRORJLHV�EHFRPH�PDLQVWUHDP��$PELWLRXV�policy frameworks, including fuel economy standards, labels and differentiated taxation by fuel economy, have proven to be successful around the world in catalysing such changes.
Some AMS are already taking action on fuel economy. Singapore, Thailand and Viet Nam have introduced mandatory fuel economy labelling schemes for new passenger light-duty vehicles (PLDVs). In Indonesia, such labels are voluntary and not yet standardised, while Brunei Darussalam, Malaysia and the Philippines plan to introduce fuel economy labels.
All AMS have vehicle registration taxes in place, either a one-off tax for new cars, an annual vehicle circulation tax, or both. In most cases, these taxes are related to vehicle attributes such as price or engine displacement. Singapore and Thailand are the only countries with IXHO�HFRQRP\�VSHFL¿F�WD[�VFKHPHV�IRU�FRQVXPHUV��6LQJDSRUH¶V�&DUERQ�(PLVVLRQV�%DVHG�Vehicle Scheme from 2013 assessed rebates or surcharges based on carbon emissions of vehicles. The scheme was replaced in 2018 by the Vehicular Emissions Scheme, which assesses a rebate or surcharge based on CO2 emissions and emissions of other air pollutants. In Thailand, the registration tax for new vehicles has been based on CO2 emissions since 2016. Indonesia and Malaysia both deploy incentives for their domestic car PDQXIDFWXULQJ�LQGXVWU\�WR�SURGXFH�PRUH�HI¿FLHQW�YHKLFOHV��EXW�RQO\�IRU�FHUWDLQ�VHJPHQWV�
,Q� WHUPV� RI� IXHO� HFRQRP\� VWDQGDUGV�� 7KDLODQG� LQWURGXFHG� YROXQWDU\�0LQLPXP� (I¿FLHQF\�3HUIRUPDQFH� 6WDQGDUGV� �0(36�� DQG� +LJK� (I¿FLHQF\� 3HUIRUPDQFH� 6WDQGDUGV� �+(36��in 2013. Also in Viet Nam, voluntary fuel consumption limits have been introduced for passenger cars in 2013. It is important to upgrade these standards over time in order to ensure their effectiveness.
Against this background, the roadmap establishes a vision as well as goals and accompanying recommended actions for ASEAN and its Member States up to 2025. While AMS retain the ULJKW�WR�PDNH�LQGLYLGXDO�FKRLFHV�LQ�GHYHORSLQJ�VSHFL¿F�SROLFLHV�DQG�PHDVXUHV�DQG�WKH�WLPLQJ�of their implementation, the roadmap charts the course and offers broad guiding principles on how to do so.
Vision and goals for the ASEAN fuel economy roadmapThe vision of this roadmap is to transform the ASEAN light-duty vehicle market into one RI�WKH�ZRUOG¶V�PRVW�IXHO�HI¿FLHQW�E\�������KHOSLQJ�WR�PHHW�UHJLRQDO�DQG�QDWLRQDO�JRDOV�IRU�VXVWDLQDEOH�WUDQVSRUW��HQHUJ\�HI¿FLHQF\�DQG�FOLPDWH�FKDQJH�PLWLJDWLRQ��ZKLOH�VXSSRUWLQJ�WKH�vision of the ASEAN Economic Community 2025, and ensuring the health and quality of life of people across the region.
This roadmap sets six aspirational goals for ASEAN to help in moving towards this vision. The headline goal is an aspirational target to reduce the average fuel consumption of new light-duty vehicles sold in ASEAN by 26% between 2015 and 2025, which leads to an improvement in average fuel economy to around 5.3 LGe/100km by 2025, from an estimated 7.2 LGe/100km in 2015.

15
Table 1: Summary of the goals and actions of the roadmap
Goal Actions to achieve goal
Goal 1: Average fuel consumption per 100 km of new light-duty vehicles sold in ASEAN is reduced by 26% between 2015 and 2025.
Action 1.1: Adopt an aspirational target to reduce average fuel consumption per 100 km of new light-duty vehicles sold in ASEAN by 26% between 2015 and 2025.
Goal 2: Common indicators and methodologies as well as baseline data for fuel economy DUH�GH¿QHG�
Action 2.1: Agree on common indicators and methodologies for measuring and analysing average new light-duty vehicle fuel economy.
Action 2.2 Develop fuel economy baseline data to ensure that $06V�KDYH�VXI¿FLHQW�LQIRUPDWLRQ�DQG�GDWD�WR�GHYHORS��HQDFW��and monitor fuel economy policies.
Goal 3: Regional cooperation, national action, and fuel econo-my policy leadership are estab-lished.
Action 3.1: Continue regional cooperation among relevant stakeholders through events related to fuel economy.
Action 3.2 Enhance collaboration of government agencies, research institutions, and automotive industry within and between AMSs.
Action 3.3 Identify appropriate lead government agencies within Member States.
Goal 4: Fuel economy label information is regionally aligned.
Action 4.1: Convene the agencies of AMS responsible for maintaining, implementing, or developing various fuel economy labels to take stock and explore alignment opportunities.
Action 4.2: Develop a common set of baseline information to be included in member states’ fuel economy labels.
Goal 5: Introduction or enhance-ment of fuel consumption- or CO2 HPLVVLRQ�EDVHG�¿VFDO�SROLFLHV��
$FWLRQ������,QWURGXFH�DQG�VWUHQJWKHQ�¿VFDO�SROLF\�PHDVXUHV�based on fuel economy or on CO2 emissions at the national level, where applicable, to incentivise consumers to purchase HI¿FLHQW�YHKLFOHV�
$FWLRQ�����([FKDQJH�OHVVRQV�OHDUQHG�RQ�¿VFDO�SROLF\�implementation.
Goal 6: Adoption of national fuel consumption standards for LDVs in all markets, striving towards a regional standard in the long term.
Action 6.1: Introduce and strengthen policy measures at national level that require manufacturers to meet stringent WDUJHWV�IRU�QHZ�YHKLFOH�ÀHHWV�EDVHG�RQ�IXHO�FRQVXPSWLRQ�RU�CO2.
Action 6.2 Develop an ASEAN wide light-duty vehicle fuel HFRQRP\�VWDQGDUG�WKDW�XQL¿HV�HIIRUWV�DFURVV�WKH�UHJLRQ�
:KLOH� $06� UHWDLQ� WKH� ULJKW� WR� PDNH� LQGLYLGXDO� FKRLFHV� LQ� GHYHORSLQJ� VSHFL¿F� SROLFLHV�and measures and the timing of their implementation, the roadmap charts the course and offers broad guiding principles on how to do so. The roadmap therefore provides a comprehensive suite of strategies and policies including labelling and public awareness,

16
PDQGDWRU\�VWDQGDUGV��DQG�¿VFDO�SROLFLHV�IRU�DFKLHYLQJ�EHWWHU�IXHO�HFRQRP\��DV�ZHOO�DV�DQ�annex describing related policies such as automotive emission standards, which may be taken into consideration while implementing the fuel economy roadmap.

17
1 Introduction
With increasing car ownership but overall still low motorisation levels in ASEAN, it is realistic to expect substantial further growth in motorisation. Within the next ten years, passenger car travel is projected to double within the ASEAN region (IEA 2012a). Sales of passenger cars are estimated to be well above 3 million cars per year by 2025, from about 1.5 million in 2015 (OICA 2016).
Stepping up fuel economy policy efforts is vital for making these growth trends compatible with climate change efforts, as well as with the drive for urban air quality and the need for UHVRXUFH�HI¿FLHQF\��)URP� WKH�SHUVSHFWLYH�RI�FRPSHWLWLYHQHVV�� IXHO�HFRQRP\�SROLFLHV�FDQ�help cars made in ASEAN exportable to markets that have strict standards in place already, and strengthen local innovation capability. To date, almost 90% of the global light-duty vehicle market is already subject to fuel economy regulation (IEA 2016).
)URP�D�WHFKQRORJ\�SHUVSHFWLYH��WKH�IXHO�HI¿FLHQF\�RI�/'9V�FDQ�EH�LQFUHDVHG�WZR�ZD\V��7KH�¿UVW�DSSURDFK�LV�WR�SURPRWH�VPDOOHU�� OLJKWHU�DQG�OHVV�SRZHUIXO�YHKLFOHV��6LQFH�WKH�HQHUJ\�use for maintaining a constant velocity of a vehicle is directly proportional to vehicle mass (through rolling resistance) and vehicle size (through frontal area and aerodynamic drag), reduction of both would directly lead to less energy use. However, in many AMS, consumers want larger and higher-performing vehicles. This highlights the importance of the second strategy, making technical improvements to use less energy while providing the desired size and performance. This can be achieved through more sophisticated engines and power trains as well as the development of more aerodynamic body work or tyres with less rolling resistance. See Annex Section 5.2.1 for more detail on LDV fuel-economy technology.
Globally, government regulation, incentives and standards have been the primary drivers of improved technology in passenger vehicles and of shifting consumer demand towards IXHO�HI¿FLHQW�PRGHOV��$6($1� DQG� LWV�0HPEHU� 6WDWHV� FDQ� EHQH¿W� JUHDWO\� E\� LQWURGXFLQJ�VLPLODU�SROLFLHV��HQKDQFH�WKHP�ZKHUH�WKH\�H[LVW�DOUHDG\��DQG�PD[LPLVH�WKH�EHQH¿WV�WKURXJK�regional collaboration. This section will set the regional policy context for this roadmap and delineate its scope.1
1.1 Regional policy context: KLTSP, fuel economy platform and this roadmap
Sustainable transport is a fundamental pillar of ASEAN’s regional transport agenda under the Kuala Lumpur Transport Strategic Plan 2016-2025 (KLTSP). The KLTSP goes beyond its predecessors by including a standalone chapter on sustainable transport. This chapter includes goals, actions and milestones as building blocks towards a policy framework for VXVWDLQDEOH�WUDQVSRUW�GHYHORSPHQW�LQ�WKH�UHJLRQ��$V�WKLV�URDGPDS�IRFXVVHV�RQ�IXHO�HI¿FLHQF\�and on regional cooperation, it serves the vision and goals of ASEAN transport ministers, as shown in Table 1.
1 $�GHWDLOHG�DVVHVVPHQW�RI�WKH�DSSURDFKHV�WR�IXHO�HI¿FLHQF\�UHJXODWLRQ�FDQ�EH�IRXQG�LQ�6HFWLRQ�������RI�WKH�$QQH[�

18
Table 2: Vision and goals of the KLTSP with regard to sustainable transport
Post-2015 vision for transport cooperation
Towards greater connectivity, efficiency, integration, safety and sustainability of ASEAN transport to strengthen ASEAN’s competitiveness and foster regional inclusive growth and development.
Sustainable Transport Strategic Goal
Formulate a regional policy framework to support sustainable transport, which includes low-carbon modes of transport, energy efficiency and user-friendly transport initiatives, integration of transport and land-use planning.
Sustainable Transport 6SHFL¿F�*RDO��
Intensify regional cooperation in the development of sustainable transport-related policies and strategies
Sustainable Transport 6SHFL¿F�*RDO��
Identify and implement the key measures on sustainable transport
Sustainable Transport 6SHFL¿F�*RDO��
Enhance human resource activities and institutions for sustainable transport system
The KLTSP covers the full range of sustainable transport approaches, with measures to ‘avoid transport activity’, to ‘shift to environment-friendly transport modes’, and to ‘improve the environmental performance of vehicles’. While decisive action is needed in all three areas to meet goals under the Paris Climate Agreement and the 2030 development agenda, this roadmap zooms in on the category of improve measures.
Given rapidly rising transport fuel consumption across most AMS, KLTSP sets the right direction by not only mandating this roadmap (see KLTSP goal 1.3.2) but also by intensifying knowledge exchange through a regional platform (see KLSTP goal 1.2.1).
Table 3: Actions and milestones of the KLTSP with regard to fuel economy
Sustainable Transport Action 1.3
Initiate and support the development and implementation of fuel economy policies and standards as well as policies towards cleaner fuels, and vehicles and vessels.
Sustainable Transport Milestone 1.3.1
Establish a platform to discuss matters related to fuel economy for the transport sector.
Sustainable Transport Milestone 1.3.2
Formulate a fuel economy roadmap for the transport sector in ASEAN, including policy guidelines.
Sustainable Transport Milestones 1.3.3
Support the development and adoption of nationally appropriate policies for cleaner fuels and vehicles.
The regional platform has met three times since November 2016 in conjunction with the Expert Group on Sustainable Land Transport (EGSLT) and brought together experts from government, academia, non-governmental and international organisations. There is increasing momentum at national level to advance fuel economy policies in the region, yet also diversity in the status, stringency and progress of these policies among AMS. Therefore, further regional exchange is important for learning from each other and for coordinating

19
policy approaches. In the context of national action, there has also been progress towards KLTSP milestone 1.3.3 as some AMS cooperate with GIZ and/or other organisations to advance their domestic fuel economy policies.
���� 6FRSH�DQG�GH¿QLWLRQV'H¿QLWLRQ�RI�OLJKW�GXW\�YHKLFOHVGenerally, the roadmap focusses on the category of LDVs. Heavy-duty vehicles (HDVs) are not in the scope due to their different characteristics in terms of technology and data, which necessitate different regulatory strategies. Annex Section 5.7.1 explains the challenges and opportunities for HDV fuel economy policy.
)RU� WKLV� URDGPDS�� /'9V� DUH� GH¿QHG� DV� WKH� VXP� RI� DOO� SDVVHQJHU� FDUV� �3&V�� DQG� OLJKW�FRPPHUFLDO�YHKLFOHV��/&9V���$QQH[�������DQG�������SURYLGHV�DQ�RYHUYLHZ�RI�GH¿QLWLRQV�DQG�H[DPSOHV�RI�3&V�DQG�/&9V�LQ�PDMRU�YHKLFOH�PDUNHWV��%DVHG�RQ�WKHVH�VSHFL¿FDWLRQV��WKH�YHKLFOH�FODVV�RI�/'9V�LV�GH¿QHG�DV�IROORZV�
%� PCs with a gross vehicle weight (GVW) of no more than 3,500 kg and no more than 10 seats (thus covering all kinds of cars, vans, multi-purpose vehicles (MPVs), sports utility vehicles (SUVs), jeeps, pick-up trucks and van-based minibuses).
%� LCVs for cargo transport with a GVW of no more than 3,500 kg.
%� Minibuses with no more than 16 seats and a GVW of no more than 3,500 kg.
%� Indigenous vehicles such as three-wheelers and jeepneys are not included in the VFRSH�RI�WKLV�SDSHU��/'9V�DUH�VSHFL¿FDOO\�GHVFULEHG�DV�KDYLQJ�IRXU�RU�PRUH�ZKHHOV��while jeepneys typically weigh more than 3,500 kg (GVW) and take more than 16 passengers.
TimeframeThis roadmap covers the timeframe until 2025. This year was chosen in order to align with the 10-year planning horizon of higher-level strategies such as the ASEAN 2025 Roadmap and the Kuala Lumpur Transport Strategic Plan (KLTSP).
Newly registered vehicles versus vehicle stockThe vehicle-related policies proposed in this document focus on newly sold or newly UHJLVWHUHG�DXWRPRELOHV��L�H��QHZ�YHKLFOHV��RU�XVHG�YHKLFOHV�WKDW�DUH�UHJLVWHUHG�IRU�WKH�¿UVW�time in an AMS). This is due to the rapid growth of the new LDV market as well as the PXOWLSOH�FKDOOHQJHV�UHODWHG�WR�WKH�DYDLODELOLW\�RI�GDWD�RQ�WKH�HQHUJ\�HI¿FLHQF\�RI�WKH�LQ�XVH�vehicle stock. The in-use stock contains many vehicles which 15 years are or older, and it LV�GLI¿FXOW�WR�¿QG�WKH�QHFHVVDU\�IXHO�FRQVXPSWLRQ�RU�&22 emission information. Only policies targeting the use�RI�WKHVH�YHKLFOHV�ZRXOG�DIIHFW�WKH�IXHO�HI¿FLHQF\�RI�WKH�YHKLFOH�VWRFN��H�J��fuel taxation or eco-driving campaigns).
Vehicle technologyThis roadmap focuses on the use of conventional, readily available and cost-effective vehicle technologies such as advanced internal combustion engines (ICE), including those using gasoline or diesel but also alternative fuels such as compressed natural gas [CNG]

20
RU� OLTXH¿HG�SHWUROHXP�JDV�>/3*@��RU�K\EULGLVHG�FDUV��7KHVH�SRZHUWUDLQV�DUH�H[SHFWHG�WR�dominate vehicle sales within the roadmap 2025 timeframe and offer great opportunities to effectively reduce energy use and emissions.
Vehicles with advanced power trains such as battery electric vehicles (BEVs) or plug-in hybrid electric vehicles (PHEVs) also play an increasingly important role for reducing transport energy consumption and emissions. Therefore, Section 5.7.2 of the roadmap looks into fuel economy policy design aspects for these types of vehicles.
Measures and units7KH�PHDVXUHPHQW�XQLW�XVHG�WR�TXDQWLI\�YHKLFOH�IXHO�HI¿FLHQF\�WKURXJKRXW�WKLV�SXEOLFDWLRQ�LV�in terms of litres of gasoline equivalent consumed per 100 kilometres (LGe/100km).2,3 This is the unit used in most countries in Africa, Asia, Canada and Australia. Similarly, the EU GHWHUPLQHV�IXHO�HI¿FLHQF\�LQ�WHUPV�RI�WKH�&22 emitted per kilometre travelled (gCO2/km), DVVXPLQJ�VSHFL¿F�HPLVVLRQ�IDFWRUV�IRU�HDFK�IXHO�W\SH��7KH�&22 emission conversion factors for different fuels are listed in Table 17 of Section 0 in the Annex. Many Latin American countries as well as India and Japan use kilometres travelled per litre of fuel used (km/l) as their measurement unit, which is basically the inverse unit of LGe/100km. Similarly, the United States measures fuel economy in miles per gallon. See Annex Section 5.6.5 for a GLVFXVVLRQ�RI�WKH�EHQH¿WV�RI�WKH�/*H����NP�XQLW�RI�IXHO�FRQVXPSWLRQ�IURP�D�UHJXODWRU\�DQG�consumer perspective.
Fuel consumption, CO2 emissions and air pollutants7KLV�URDGPDS�VSHFL¿FDOO\�UHIHUV�WR�SROLFLHV�IRU�PRUH�HI¿FLHQW�IXHO�FRQVXPSWLRQ�RI�LQGLYLGXDO�YHKLFOHV��/*H����NP���)XHO�FRQVXPSWLRQ�FDQ�EH�UHÀHFWHG�LQ�WHUPV�RI�&22 emissions through a conversion factor. While the emission of other air pollutants such as particulate matter (PM), oxides of nitrogen (NO and NO2, commonly together referred to as NOx), oxides of sulphur (SOx), un-burnt hydrocarbons (HC) and carbon monoxide (CO) are important, these other air pollutants are regulated using different types of regulation and with generally different technology solutions. Therefore this roadmap focuses on fuel consumption, expressed as CO2 emissions where relevant. For further background on the relationship between air pollution and fuel economy, see Section 5.5.7 in the Annex.
2 In order to account for the different energy densities of liquid fuels such as gasoline and diesel, all volumetric fuel consumption values are normalised to the energy content of gasoline, i.e. litres of gasoline equivalent (LGe, conversion factors see Table 17 in Section 5.7).
3 This unit of measure, in common parlance, is known simply as “fuel consumption”, and shall be referred to as such throughout the rest of this document.

21
2 Current status in the ASEAN region
Fuel economy policy is quickly evolving around the world. Today, over 80% of the global LDV market is in countries with fuel economy regulations in place. As these countries accelerate their efforts, ASEAN may risk falling behind technologically, remaining a market for lower-technology vehicles while losing opportunities to export vehicles in the competitive global market. Annex 5.1 provides an overview of policy developments around the world. This global overview demonstrates what is possible in terms of policy ambition and technical potential for fuel economy improvement, offering context for ASEAN.
2.1 Economic development and motorisationThe 10 countries of the ASEAN region are home to a total population of about 615 million people as of 2014 (IRENA & ACE 2016). The gross domestic product (GDP) of the region was about USD 2.4 billion in the same year. The region has enjoyed average economic growth of 5.2% per year over the last 23 years and is projected to continue at a comparable rate of 4.8% p.a. until the year 2025. With per capita incomes projected to rise from about USD 3,900 in 2014 to more than USD 5,600 by 2025, the road vehicle stock will face VLJQL¿FDQW�IXWXUH�JURZWK��
The AMS are very diverse in both their economic development and their motorisation status. In 2014, per capita income ranged from USD 1,000 in Cambodia to USD 59,400 in Singapore (Table 4). Incomes are expected to grow by another 12% to 70% from 2014 to 2025, with the regional spread in per capita incomes expected to remain wide.
Table 4: Vehicle ownership, saturation level and GDP per capita today and future projections
Source: 1) APERC; 2) IRENA & ACE 2016Note: 3) Vehicle ownership and saturation data in Viet Nam refers to cars only
:KHQ�HVWLPDWLQJ�VDWXUDWLRQ� OHYHOV�IRU�YHKLFOH�RZQHUVKLS��7DEOH�����PDQ\�FRXQWU\�VSHFL¿F�characteristics need to be considered. These include projections of GDP per capita, estimates regarding the future levels of urbanisation, the type of urban areas, and the country’s capacity to accommodate increased levels of individual motorisation, as well as the provision of mobility alternatives in the form of well-developed public transport systems. Clearly, Singapore has by far the lowest saturation level, while Malaysia is projected to take a European-like transport path.
Lao PDR
Viet Nam3

22
'LIIHUHQW�$06�ZLOO�VHH�GLIIHUHQW�SRWHQWLDO�IXWXUH�EHQH¿WV�DFFUXLQJ�IURP�VWULQJHQW�IXHO�HFRQRP\�policies according to their current and future motorisation rates. Most AMS are projected to see increased motorisation levels and thus increased fuel use as well as emissions of CO2 and pollutants, along with a surge in expenditures on fuel. Brunei Darussalam already has D�KLJK�YHKLFOH�RZQHUVKLS��DQG�FRXOG�WKHUHIRUH�DOVR�VLJQL¿FDQWO\�EHQH¿W�IURP�IXHO�HFRQRP\�SROLFLHV�DV�WKH�YHKLFOH�ÀHHW�LV�UHIUHVKHG�RYHU�WLPH��ZKLOH�6LQJDSRUH�FRXOG�EHQH¿W�IURP�OHVV�air pollution in its densely populated urban area.
2.2 LDV energy use and CO2 emissionsFinal energy use in the ASEAN region almost doubled between the year 2000 and 2013 �)LJXUH����OHIW���2LO�UHSUHVHQWHG�DERXW�����RI�¿QDO�HQHUJ\�XVH�LQ������DQG�PDLQWDLQHG�DQ�almost constant share of total energy use over time. The transport sector is one of the main drivers of energy use and its weight has increased in recent years. While in 1990 transport accounted for about 21% of ASEAN’s energy consumption, it grew to about 28% in 2013 (Figure 1, right).
Source: Ace 2015
)LJXUH����+LVWRULFDO�WRWDO�¿QDO�HQHUJ\�XVH�E\�IXHO�DQG�E\�VHFWRU�LQ������������DQG������LQ�WKH�$6($1�UHJLRQ
The 2016 Renewable Energy Outlook for ASEAN (IRENA & ACE 2016) estimates that about 400 Mt of CO2 were emitted by the transport sector in ASEAN in the year 2014 (equivalent to about 30% of total energy related CO2 emissions), and that transport CO2 emissions could grow by 35% until 2025 under business-as-usual conditions (Figure 2).
Source: IRENA & ACE 2016Figure 2: Energy-related CO2 emission external costs in the ASEAN region by sector in 2018 and 2025

23
2.3 The LDV market in the ASEAN region
The ASEAN region is both a sizeable vehicle consumer as well as vehicle producer. In 2015, about 2 million passenger cars were sold in the AMS, with Indonesia, Malaysia and Thailand as the largest markets (Figure 3). In addition, about 1.15 million commercial vehicles were sold in the region. At more than 3.1 million newly registered cars and commercial vehicles in 2015, the ASEAN market is the sixth-largest vehicle market in the world. These numbers underline the importance of cooperation within the ASEAN region: Counted in isolation, even Indonesia, the region’s largest vehicle market, would only rank 18th globally.
Comparing vehicle sales with production reveals that AMS are net vehicle exporters (Figure 3). This is particularly true for commercial vehicles, where production numbers have been about 40% to 50% higher than sales numbers, while in terms of motorcycles and scooters, almost all these vehicles produced in the region are also sold there.
Source: OICA 2016, AAF 2017)LJXUH����2YHUYLHZ�RI�YHKLFOH�VDOHV�DQG�SURGXFWLRQ�LQ�WKH�$6($1�UHJLRQ��([FOXGLQJ�WZR��DQG�WKUHH�ZKHHOHUV�
Since 2005, the ASEAN vehicle sales have grown by more than 50%. The production of passenger cars has even doubled since 2007. The increasing motorisation levels indicate a huge growth potential of the ASEAN vehicle market. This underlines the urgency of putting in place stringent fuel economy policies.
&�
+&&#&&&�
'#&&&#&&&�
'#+&&#&&&�
(#&&&#&&&�
(#+&&#&&&�
)#&&&#&&&�
(&&+� (&&,� (&&-� (&&.� (&&/� (&'&� (&''� (&'(� (&')� (&'*� (&'+�
�������
����� ���������
&�
+&&#&&&�
'#&&&#&&&�
'#+&&#&&&�
(#&&&#&&&�
(#+&&#&&&�
(&&+� (&&,� (&&-� (&&.� (&&/� (&'&� (&''� (&'(� (&')� (&'*� (&'+�
�������
�����������������
�������� ���� ��������������� ���������������� ����������� ����������!���� �������!������
����������������� ���������������� ��������������� ������ ������� ��� ����������
Sales Brunei
Darussalam
Sales Lao PDR

24
2.4 LDV fuel economy in the ASEAN region and the Member StatesIn order to understand the new LDV fuel economy trend, baseline data has been compiled and analysed for the region. Baseline data means information on sales-weighted average fuel consumption of newly registered LDVs for at least one historical year.4 This information is required to evaluate the status quo, to establish any fuel economy policy, and to evaluate its effectiveness.
Fuel consumption baselines for several AMS as well as for other countries are shown in )LJXUH����,W�LV�FOHDUO\�YLVLEOH�WKDW�/'9�IXHO�FRQVXPSWLRQ�YDULHV�VLJQL¿FDQWO\�DFURVV�FRXQWULHV�and regions. While new LDV fuel consumption was 7.8 LGe/100km in the United States in 2014, it was as low as 5.1 LGe/100km in Japan in 2013. Furthermore, there is a clear trend towards lower fuel consumption over time.
New LDV fuel consumption within AMS is relatively high when compared to the rest of the world. Average fuel consumption in 2015 was between 7.7 LGe/100km for the Philippines and 6.6 LGe/100km for Malaysia. The sales-weighted average new LDV fuel consumption for ASEAN as a whole is about 7.2 LGe/100km.5 It is thus higher than the world average of about 7.0LGe/100km. By means of comparison, the OECD average for new LDV fuel consumption of about 6.8LGe/100km for the year 2015 (GFEI 2017) indicates that there is considerable space for technological improvement in the rest of the world including ASEAN. The variation of average new LDV fuel consumption among the AMS is moderate, which indicates that the LDV markets in these countries are somewhat comparable to each other.
Source: ICCT 2015, GFEI 2016 and GFEI 20176
Figure 4: Fuel Economy Baselines Study conducted by GFEI in ASEAN and the World
4 See Box 1 for the baseline calculation methodology on page 235� 7KLV�DJJUHJDWH�¿JXUH�FDOFXODWHG�IRU�$6($1�LV�EDVHG�RQ�GDWD�IRU�,QGRQHVLD��0DOD\VLD��WKH�3KLOLSSLQHV��6LQJDSRUH�DQG�
7KDLODQG��7KHVH�¿YH�FRXQWULHV�DFFRXQW� IRU�����RI�/'9�VDOHV� LQ�$6($1��7KHUHIRUH�� WKH� IXHO�HFRQRP\�EDVHOLQH�GDWD�IURP�WKHVH�PDUNHWV�LV�VXI¿FLHQW�IRU�PDNLQJ�D�UREXVW�HVWLPDWH�RI�WKH�sales-weighted average fuel consumption of newly registered LDVs for ASEAN as a whole.
6 (XURSH��%UD]LO��&KLQD�DQG�6DXGL�$UDELD�DYHUDJHV�GR�QRW�LQFOXGH�OLJKW�WUXFNV��/7��LQ�WKHLU�DYHUDJH�LQ�WKLV�¿JXUH��)RU�(XURSH�DQG�&KLQD��OLJKW�WUXFNV�GLG�QRW�PDNH�XS�D�VLJQL¿FDQW�SDUW�RI�VDOHV��+RZHYHU��IRU�%UD]LO�DQG�6DXGL�$UDELD��WKH�¿JXUH�LQ�WKLV�chart may be lower if LTs are included.
�� �����) +�
� � � ��+ )�
���� ��* %�
����( &�
���� ��( +�
� � ���( $�
��������+ $��������� �����* +�
��������� ��) &�
�������� ��* &�
� � ��� ��) )�
������������* *��� �� ����* (�
��� ������* %�
( #�
( (�
) #�
) (�
* #�
* (�
+ #�
+ (�
, #�
, (�
$# #�
%##(� %##)� %##*� %##+� %##,� %#$#� %#$$� %#$%� %#$&� %#$'� %#$(� %#$)�
�� � �
����
����
����� �
�������
��
�� ������������ ������������������� ������� �� �������� �������

25
Based on data of the Global Fuel Economy Initiative (GFEI) for Indonesia, Malaysia, the 3KLOLSSLQHV�DQG�7KDLODQG�IRU�WKH�\HDU�������WKH�DYHUDJH�$6($1�QHZ�FDU�GLIIHUV�VLJQL¿FDQWO\�from the world average: It is about 30% less powerful (77 kW in ASEAN vs. 112 kW for the world average), engine displacement is about 10% lower (1.8 L in ASEAN vs. almost 2.0 L for the world average), the vehicles are on average 8% lighter (1,240 kg in ASEAN vs. almost 1,350 kg for the world average) and about 5% smaller (3.9 m² in ASEAN vs. almost 4.1 m² for the world average). See Figure 5 below.
Based on the relatively high fuel consumption of new LDVs in ASEAN compared to other regions of the world mentioned above, it is clear that there is a technology gap: Although ASEAN cars are on average less powerful, with smaller engines, lighter and smaller in size, they still consume more fuel. This technology gap results from the absence of stringent fuel economy policies.
New LDVs in Indonesia cost about USD 18,000 in 2015, compared with USD 26,000 on average, globally, and about USD 23,000 in non-OECD countries (GFEI 2016a). They were also somewhat less powerful, smaller and lighter than the ASEAN average (Figure 6). The VLJQL¿FDQWO\�ORZHU�SULFH�FRQ¿UPV�D�WHQGHQF\��9HKLFOHV�RIIHUHG�LQ�WKH�,QGRQHVLDQ�PDUNHW�DUH�VLJQL¿FDQWO\�FKHDSHU�FRPSDUHG�WR�WKH�JOREDO�DYHUDJH��DQG�HYHQ�FKHDSHU�WKDQ�WKRVH�FDUV�sold in non-OECD countries. Across ASEAN, where the average price of vehicles was USD 18,500 in 2015, trends are similar.
Note: Based on New LDV Data For Indonesia, Malaysia, the Philippines and Thailand for the year 2015Data source: GFEI 2017
Figure 5: New LDV characteristics in the ASEAN region compared to the world in 2015
In Thailand, new LDVs are relatively heavy and large (Figure 6). They show high displacement but rather low average power rating. In addition, new LDVs in Thailand are characterised by D�UDWKHU�KLJK�DYHUDJH�IXHO�FRQVXPSWLRQ�RI�DERXW�����/*H����NP��7KHVH�SDWWHUQV�UHÀHFW�WKH�fact that more than 30% of newly registered LDVs in Thailand are pick-up trucks (GIZ 2017). Although these are rather large and heavy, they are mainly propelled by diesel engines which have high engine displacement at lower power rating. It is important to acknowledge VSHFL¿F�VLWXDWLRQV�VXFK�DV�WKH�KLJK�VKDUH�RI�SLFN�XS�WUXFNV�LQ�7KDLODQG��+HUH��VWURQJ�IXHO�economy improvement is most likely not possible without a reduction in average vehicle size.

26
Source: GFEI 2017Figure 6: New LDV characteristics in Indonesia, Malaysia, the Philippines, Thailand and the ASEAN region in 2015
A comparison between the characteristics of new LDVs in Malaysia and the Philippines shows that they are relatively similar with respect to power, engine size and vehicle dimensions (Figure 6). However, average fuel consumption of new LDVs is very different in the two countries: While Malaysian cars consume on average on 6.6 LGe/100km, new cars in the Philippines consume around 17% more, with an average fuel consumption of more than 7.7 LGe/100km. This might be linked due to the fact that Malaysian per capita GDP is about three times higher than in the Philippines, allowing consumers to buy more expensive DQG�KHQFH�PRUH�PRGHUQ�DQG�PRUH�HI¿FLHQW�FDUV�
In summary, it can be noted that fuel economy improvement potential is great in all AMSs, but for varying reasons. While countries with higher per capita income and already high motorisation rates need to curb the trends towards increasing car size and car performance, those countries with lower per capita income need to make sure that state-of-the-art technology becomes mainstream. In some cases, for example in Thailand, legislation needs to ensure that the purchase of appropriate vehicles is incentivised, i.e. the share of pick-up trucks should represent the need to transport goods rather than being primarily used for SDVVHQJHU�WUDQVSRUW��7KH�IDFW�WKDW�WKH�VKDUH�RI�FUHZ�FDE�SLFN�XSV�ZLWK�IRXU�GRRUV�DQG�¿YH�passenger seats increased over time seems to indicate the opposite (GIZ 2017).
2.5 Overview of LDV fuel economy policies in the ASEAN regionThe current status of fuel economy policy development varies across the region. While VRPH�$06�ODFN�VSHFL¿F�PHDVXUHV��RWKHUV�VXFK�DV�6LQJDSRUH�KDYH�LQWURGXFHG�D�EXQGOH�RI�measures over the last years.
Singapore, Thailand and Viet Nam have mandatory labelling schemes for new PLDVs in place. Fuel economy labels are voluntary in Indonesia (Policy Overview Table 10 in the Section 5.3 of the Annex). Brunei Darussalam, Malaysia and the Philippines are planning to introduce fuel economy labels, while no such plans currently seem to exist in Cambodia, Lao PDR or Myanmar.

27
All AMS have vehicle registration taxes in place, either a one-off tax for new cars, an annual vehicle circulation tax, or both (Table 10 in the Annex Section 5.3). In most cases, these taxes are related to vehicle attributes such as price or engine displacement. Singapore DQG�7KDLODQG�DUH� WKH�RQO\�FRXQWULHV�ZLWK� IXHO�HFRQRP\�VSHFL¿F� WD[�VFKHPHV��6LQJDSRUH�introduced the Carbon Emission Based Vehicle Scheme (CEVS) in 2013 to tax vehicles based on their carbon emission, but in 2018 transitioned to a new mechanism, the Vehicular Emissions Scheme (VES), which in addition to assessing vehicles based on CO2 emissions, also assesses them based on hydrocarbon, carbon monoxide, nitrogen oxides and particulate matter emissions to calculate rebates and surcharges.7 In Thailand, the registration tax for new vehicles has been based on CO2 emissions since 2016. More detail on the Singapore VES as well as the Thai vehicle registration tax is provided in Table 10 of the Annex Section 5.3. Indonesia and Malaysia provide tax incentives for the domestic SURGXFWLRQ�RI�IXHO�HI¿FLHQW�FDUV�EXW�QRW�IRU�FRQVXPHUV��7KHVH�VFKHPHV�DUH�JHDUHG�SULPDULO\�towards industry development, rather than ]the objective of reducing fuel consumption.
No AMS has mandatory fuel economy, fuel consumption or CO2 emission standards in SODFH�\HW��7KDLODQG�KDV�LQWURGXFHG�YROXQWDU\�0LQLPXP�(I¿FLHQF\�3HUIRUPDQFH�6WDQGDUGV��0(36��DQG�+LJK�(I¿FLHQF\�3HUIRUPDQFH�6WDQGDUGV��+(36���$OVR�LQ�9LHW�1DP��YROXQWDU\�fuel consumption limits were introduced for two-wheelers and passenger cars in 2013. The standards for passenger cars in Thailand and Viet Nam differentiate classes of vehicles based on weight, as seen in the stepwise chart in Figure 7. Brunei Darussalam has indicated in its Nationally Determined Contribution to the Paris Climate Agreement that it wants to adopt the EU’s CO2 standards for LDVs.
A comparison of the voluntary standards in Thailand and Viet Nam to the mandatory standard in the European Union is shown in Figure 7. It is evident that both the Vietnamese fuel consumption standard as well as the Thai MEPS and HEPS are much less stringent than the EU CO2 emissions standard. In fact, the Vietnamese standards as well as the Thai MEPS allow fuel consumption to be about twice as high as the European limits for a certain weight interval. Such weak and voluntary standards apply limited pressure on car PDQXIDFWXUHUV�WR�LPSURYH�YHKLFOH�IXHO�HI¿FLHQF\�
Table 5 shows gasoline prices in AMSs and selected reference countries. The prices are divided into several categories. The category ‘high subsidies’ denotes countries with gasoline price below the world market price for crude oil and includes Brunei Darussalam. The category ‘subsidies’ is used for countries with gasoline price being below the price in the US, which is assumed to be at a cost covering retail price.
Clearly, fuel taxes show a broad variance among the AMS, with Brunei Darussalam and Malaysia on the very low end, and Singapore reaching EU price levels. Fuel taxes are a YHU\�HI¿FLHQW�PHDQV�RI�PRWLYDWLQJ�IXHO�HI¿FLHQF\�LPSURYHPHQW��&XWWLQJ�IXHO�VXEVLGLHV�FDQ�thus be a key starting point towards effective fuel economy policies.
7 More information about the Singapore VES can be found at https://www.lta.gov.sg/apps/news/page.aspx?c=2&id=37654ca8-ef14-4c1a-851d-06fc527f839f

28
Table 5: Gasoline Prices in AMSs and Reference Countries
Source: GIZ 2015
2.6 Gaps and BarriersGaps and barriers to development and implementation of fuel economy policy in ASEAN and AMS can be distinguished into several categories, including: a lack of knowledge and GDWD�RQ�WKH�FXUUHQW�QHZ�DQG�VHFRQG�KDQG�YHKLFOH�ÀHHWV�FXUUHQWO\�LQ�WKH�UHJLRQ��DQG�WKRVH�that are entering the region; challenges in identifying administrative responsibility for fuel economy; and, the inertia of consumers to change their behaviour.
6RXUFH��*,=�����D��$VDZXWPDQJNXO�������(($�����
Figure 7: Non-mandatory fuel consumption standards for passenger cars in Thailand and Viet Nam compared to the mandatory standard in the EU
Lao PDR
Viet Nam
ASEAN Member States

29
These key gaps and barriers are being addressed, but efforts will still need to be made in order to facilitate the eventual implementation of fuel economy policy across ASEAN. For example, baseline data for Brunei Darussalam, Cambodia, Lao PDR, Myanmar and Viet Nam are currently lacking. However, Myanmar and Viet Nam are working on their baselines with support by GFEI and by GIZ respectively. Similarly, administrative responsibilities DQG�DUUDQJHPHQWV�QHHG� WR�EH� LGHQWL¿HG�DQG�DVVLJQHG� LQ�PDQ\�$06��DQG��$06�QHHG� WR�GH¿QH�SROLFLHV�WKDW�UHFRJQLVH�WKH�WUHQGV�WRZDUGV�FRQVXPHUV�SXUFKDVLQJ�ODUJHU�DQG�KHDYLHU�YHKLFOHV�� PHDQLQJ� WKDW� JRYHUQPHQW� DFWLRQ� LV� UHTXLUHG� LQ� RUGHU� WR� LPSOHPHQW� HI¿FLHQF\�technology and manage fuel consumption in the passenger vehicle sector. These themes are explored in detail in the Annex to this document, Section 5.4.
6RPH�VROXWLRQV�WR�WKHVH�JDSV�DQG�EDUULHUV��VXFK�DV�FRVW�EHQH¿W�DQDO\VLV�FDQ�KHOS�$6($1�and AMS to develop more well-informed policies that match their circumstances and help them achieve better outcomes are also available. Tools and methodologies from globally-OHDGLQJ� LQVWLWXWLRQV�KDYH�EHHQ� LGHQWL¿HG�DQG�GHVFULEHG� IRU� UHOHYDQW�SROLF\�PDNHUV�RI� WKH�AMS to consider as they develop policy for their jurisdictions in Section 5.2.3 of the Annex.

30
3 Vision, goals and recommended actions towards 2025
3.1 2025 Vision$6($1� ODJV�EHKLQG� WKH� UHVW�RI� WKH�ZRUOG� LQ� WHUPV�RI�/'9� IXHO�HI¿FLHQF\�� ,Q�DGGLWLRQ��DOO�major LDV markets of the world except for ASEAN have set fuel consumption targets IRU� WKHLU� YHKLFOH�ÀHHWV� LQ������RU������ �VHH�GDVKHG� OLQHV� LQ�)LJXUH����� ,Q� WLPHV�RI� UDSLG�motorisation and a growing regional automotive industry, AMS have the opportunity to close the gap towards international best practices. With the right policies in place and reasonable OHYHOV�RI�DPELWLRQ��$06�FDQ�UHDS�WKH�PXOWLSOH�EHQH¿WV�RI�EHWWHU�IXHO�HFRQRP\��$JDLQVW�WKLV�background:
The vision of this roadmap is to transform the ASEAN light-duty vehicle market into one RI�WKH�ZRUOG¶V�PRVW�IXHO�HI¿FLHQW�E\�������KHOSLQJ�WR�PHHW�UHJLRQDO�DQG�QDWLRQDO�JRDOV�IRU�VXVWDLQDEOH�WUDQVSRUW��HQHUJ\�HI¿FLHQF\�DQG�FOLPDWH�FKDQJH�PLWLJDWLRQ��ZKLOH�VXSSRUWLQJ�WKH�vision of the ASEAN Economic Community 2025, and ensuring the health and quality of life of people across the region.
Source: ICCT 2015, GFEI 2016 and GFEI 2017
)LJXUH����(QDFWHG�DQG�3URSRVHG�/'9�)XHO�(FRQRP\�7DUJHWV�$URXQG�WKH�:RUOG�±�:LWK�8QL¿HG�&DQDGD�DQG�86�2025 targets representing passenger vehicles and light trucks
3.2 Aspirational goals towards 20257KH�DVSLUDWLRQDO�JRDOV�DQG�DFWLRQV�DUH�EDVHG�RQ�$6($1¶V�FLUFXPVWDQFHV��VSHFL¿FDOO\�ZLWK�reference to the data collected and analysed within Section 2. At the same time, they are founded on international experience and success stories to effectively develop and implement fuel economy policies.

31
Goal 1: Average fuel consumption per 100 km of new light-duty vehicles sold in ASEAN is reduced by 26% between 2015 and 2025.
6HWWLQJ�DQ�DVSLUDWLRQDO�QHZ�/'9�IXHO�HI¿FLHQF\�WDUJHW�IRU�WKH�HQWLUH�UHJLRQ�LV�DQ�LPSRUWDQW�step forward in the near term. It provides long-term planning direction for manufacturers and enables governments to monitor progress against the aspirational target. It serves to benchmark potential reductions in energy demand, GHG emissions, and fuel costs, and is thus an important component of regional economic and climate policy making.
The aspirational goal represents an average annual improvement of 3% and leads to a regional average fuel consumption of around 5.3 LGe/100km by 2025, from an estimated 7.2 LGe/100km in 2015. When compared to the goals of other jurisdictions, most have either more ambitious improvement rates (>4% per year), more stringent target values (<5 LGe/100km), or have target years earlier than 2025 (see Table 8 on page 38). In addition, the goals of most of the other countries or regions have been formalised in the form of mandatory fuel economy standards.8
Source: ICCT 2015, GFEI 2016 and GFEI 2017
)LJXUH����7KH�$6($1�/'9�IXHO�FRQVXPSWLRQ�JRDO�LQ�FRPSDULVRQ�WR�HQDFWHG�DQG�SURSRVHG�/'9�IXHO�HFRQRP\�±�1RWH��&DQDGD�DQG�86�WDUJHWV�DUH�XQL¿HG�IRU������DQG�UHSUHVHQW�SDVVHQJHU�FDUV�DQG�OLJKW�WUXFNV�WRJHWKHU�
Goal 2: Common indicators and methodologies as well as baseline data for fuel HFRQRP\�DUH�GH¿QHG�
Using common indicators and methodologies can make fuel economy efforts of AMSs comparable, reduce policy development costs, and allow for faster and less expensive testing of automotive fuel consumption. Furthermore, it may simplify customs procedures
8 The 2025 fuel consumption goal has been determined based on a process in which representatives of the ASEAN Expert *URXS� RQ�6XVWDLQDEOH� /DQG�7UDQVSRUW� �(*6/7�� VHOHFWHG� RQH� RXW� RI� ¿YH� GLIIHUHQW� JRDO� RSWLRQV�ZLWK� YDU\LQJ� OHYHOV� RI�VWULQJHQF\��7KH�¿YH�RSWLRQV�DUH�SUHVHQWHG�LQ�$QQH[�6HFWLRQ��������7KH�(*6/7�GHFLGHG�LQ�IDYRXU�RI�WKH�¿IWK�RSWLRQ�ZKLFK�is to double the fuel economy improvement from the 1.5% BAU improvement rate to 3% per year.

32
among countries and facilitate the development of Mutual Recognition Agreements. Last EXW�QRW� OHDVW�� KDUPRQLVHG� WHVW�SURFHGXUHV�DQG�HI¿FLHQF\�PHWULFV�PD\� UHGXFH�FRVWV�DQG�the compliance burden for manufacturers and build the foundation for regional policy approaches.
Goal 3: Regional cooperation, national action, and fuel economy policy leadership are established
The determination of responsible lead agencies in each AMS can create an institutional “home” for fuel economy and strengthen inter-institutional coordination. Continued and enhanced regional cooperation through knowledge exchange, research, and partnership among government, researchers, and industry is vital to build a strong basis of know-how, capacities and data in each AMS.
Goal 4: Fuel economy label information is regionally aligned
Making fuel economy information transparent to consumers plays an important part in QXGJLQJ�FRQVXPHUV�WRZDUGV�EX\LQJ�PRUH�HI¿FLHQW�YHKLFOHV��+DUPRQLVLQJ�D�EDVHOLQH�VHW�RI�information displayed on fuel economy labels, and agreeing on similar rating systems and benchmarks within the ASEAN region, facilitates manufacturers and importers to provide best available technology vehicles, and helps consumers to make more informed choices. Regional harmonisation can also help address barriers such as small markets and limited institutional capacity to develop labels. Furthermore, having regionally aligned fuel economy labels may enhance trade of LDVs between AMSs and support exports of LDVs by AMS beyond the bloc.
Goal 5: Introduction or enhancement of fuel economy- or CO2�HPLVVLRQ�EDVHG�¿VFDO�policies
$OWKRXJK�DOO�$06�KDYH�¿VFDO�SROLFLHV�LQ�SODFH�WR�JHQHUDWH�JRYHUQPHQW�UHYHQXHV�E\�WD[LQJ�vehicle purchase and use, only a few AMS effectively use vehicle and fuel taxes to control DQG�PDQDJH�WKH�HI¿FLHQF\�RU�WKH�HQYLURQPHQWDO�LPSDFW�RI�GRPHVWLF�/'9�ÀHHWV��With a clear focus on the emissions output or fuel consumption of the vehicle as an alternative taxation basis, the cleanest vehicle technology becomes more affordable to consumers and their market adoption accelerates. 7KH�LQWURGXFWLRQ�RU�HQKDQFHPHQW�RI�¿VFDO�PHDVXUHV��ZKLFK�DUH�LGHDOO\�technology-neutral and based on fuel economy or CO2 emissions, is thus a crucial medium-term goal to achieve the vision of this roadmap.
Goal 6: Adoption of national fuel economy standards for LDVs, striving towards a regional standard in the long term
7KH�FRPELQDWLRQ�RI�FRQVXPHU�LQIRUPDWLRQ��¿VFDO�IXHO�HFRQRP\�SROLFLHV�DQG�IXHO�HFRQRP\�standards has proven to be the most effective policy package in other countries. Therefore, AMS should either introduce standards or strengthen them where they exist already. This roadmap further suggests working towards establishing an ASEAN-wide fuel consumption or CO2�HPLVVLRQV�VWDQGDUG�WKDW�PDQGDWHV�IXHO�HI¿FLHQF\�SHUIRUPDQFH�OHYHOV�IRU�QHZ�/'9V�sold in the region.

33
3.3 Recommended actions to meet the goalsGoal 1: Average fuel consumption per 100 km of new light-duty vehicles sold in ASEAN is reduced by 26% between 2015 and 2025.
Action 1.1: Adopt an aspirational target to reduce average fuel consumption per 100 km of new light-duty vehicles sold in ASEAN by 26% between 2015 and 2025. The target should be adopted as part of this roadmap.
Goal 2: Common indicators and methodologies as well as baseline data for fuel economy are defined
Action 2.1: Agree on common indicators and methodologies for measuring and analysing average new light-duty vehicle fuel economy��6HFWLRQ�����LQFOXGHV�VSHFL¿F�suggestions for indicators and methodologies that should either be commonly used or that UHTXLUH�DOLJQPHQW��,W�LV�UHFRPPHQGHG�WR�WDNH�VWRFN�RI�WKH�FXUUHQW�SURFHGXUHV�DQG�GH¿QLWLRQV�in AMS, to agree on a baseline of common metrics to be used throughout the region and to works towards an agreement on fuel economy testing methodologies.
$FWLRQ�����'HYHORS�IXHO�HFRQRP\�EDVHOLQH�GDWD�WR�HQVXUH�WKDW�$06�KDYH�VXI¿FLHQW�information and data to develop, enact, and monitor fuel economy policies. AMS which have no baseline data yet need to start compiling and analysing the data needed to establish a baseline (see Box 1: Baseline setting methodology). AMS whose baseline data have been computed by an external party should consider validating and updating the data independently in order to strengthen domestic capacity and procedures. For tracking progress, the sales-weighted average new LDV fuel consumption data needs to be assessed on a regular basis.
Goal 3: Regional cooperation, national action, and fuel economy policy leadership are established
Action 3.1: Continue regional cooperation among relevant stakeholders through events related to fuel economy. Such events as Fuel Economy Platform Forums have proven to be an effective avenue for the development of this roadmap.
Action 3.2 Enhance collaboration of government agencies, research institutions, and automotive industry within and between AMS. Academic experts can help generate the knowledge, analysis, and expertise needed for fuel economy policy development. However, tackling knowledge gaps together requires good connections between researchers and policymakers. Researchers therefore need to be involved in the regional policy dialogues on fuel economy. Car manufacturers, associations, and importers must be involved in the process of developing stringent fuel economy policies, including engagement in both regional and national policy dialogues. This collaboration could help enhance the capacity of AMS including in the areas of type-approval procedures, testing capacity, in-use fuel HFRQRP\�YHUL¿FDWLRQ�RI�GXUDELOLW\��DQG�PXWXDO�UHFRJQLWLRQ�RI�WHVW�UHVXOWV�
Action 3.3 Identify appropriate lead government agencies within Member States. Since many ministries and authorities such as the Ministry of Finance, the Ministry of Energy, the Ministry of Economy and the Ministry of Transport are concerned with fuel economy-related legislation and regulation, a leading agency in each AMS needs to be assigned

34
in order to coordinate and guide the work across all stakeholders with other AMS. At the regional level, coordination is needed among the ASEAN sectoral bodies which are relevant for fuel economy issues, e.g. Transport (ASEAN Land Transport Working Group, ASEAN 6HQLRU�7UDQVSRUW�2I¿FLDOV�0HHWLQJ���(QHUJ\��$6($1�6HQLRU�2I¿FLDOV�0HHWLQJ�RQ�(QHUJ\���Standards (ASEAN Consultative Committee on Standards and Quality), Environment �$6($1�6HQLRU�2I¿FLDOV�RQ�(QYLURQPHQW���DPRQJ�RWKHUV�
Goal 4: Fuel economy label information is regionally aligned
Action 4.1: Convene the agencies of AMS responsible for maintaining, implementing, or developing various fuel economy labels to take stock and explore alignment opportunities.
Action 4.2: Develop a common set of baseline information to be included in AMSs’ fuel economy labels. As a guide for AMS, Chapter 7 introduces international best practices for labelling scheme designs.
Goal 5: Introduction or enhancement of fuel economy- or CO2 emission-based fiscal policies
$FWLRQ������,QWURGXFH�DQG�VWUHQJWKHQ�¿VFDO�SROLF\�PHDVXUHV�EDVHG�RQ�IXHO�HFRQRP\�or CO2 emissions at the national level, where applicable, in order to incentivise FRQVXPHUV�WR�SXUFKDVH�HI¿FLHQW�YHKLFOHV��Where such policies are not in place yet, the UHVSRQVLEOH�JRYHUQPHQW�DJHQFLHV�VKRXOG�DVVHVV�WKHLU�FRVWV�DQG�EHQH¿WV�DQG�WDNH�FRQFUHWH�steps to develop and introduce them. Where they are in place, government should regularly review their effectiveness, increase their stringency over time, and close loopholes that may H[LVW�IRU�FHUWDLQ�YHKLFOH�W\SHV��6HFWLRQ�����SURYLGHV�JXLGDQFH�RQ�WKH�GLIIHUHQW�NLQGV�RI�¿VFDO�measures.
$FWLRQ�����([FKDQJH�OHVVRQV�OHDUQHG�RQ�¿VFDO�SROLF\�LPSOHPHQWDWLRQ��As AMS develop and implement their respective policies, it is vital that they engage in regional dialogue on successes and issues encountered, allowing AMS to learn from each other.
Goal 6: Adoption of national fuel economy standards for LDVs, striving towards a regional standard in the long term
Action 6.1: Introduce and strengthen policy measures at national level that require PDQXIDFWXUHUV�DQG�LPSRUWHUV�WR�PHHW�VWULQJHQW�WDUJHWV�IRU�QHZ�YHKLFOH�ÀHHWV��EDVHG�on fuel consumption or CO2. Section 4.4 provides design considerations for the package of policy measure to introduce and implement fuel economy standards. The domestic VWDQGDUGV��LI�DSSOLFDEOH��VKRXOG�UHIHU�WR�WKH�IXHO�FRQVXPSWLRQ�OHYHO�VSHFL¿HG�LQ�*RDO����
$FWLRQ�����'HYHORS�DQ�$6($1�ZLGH�OLJKW�GXW\�YHKLFOH�IXHO�HFRQRP\�VWDQGDUG�WKDW�XQL¿HV�efforts across the region. Lessons can be drawn from ongoing regional efforts to achieve HQHUJ\�HI¿FLHQF\�RI�RWKHU�SURGXFWV�9
9� )RU�H[DPSOH��WKH�$6($1�6WDQGDUGV�+DUPRQL]DWLRQ�,QLWLDWLYH�IRU�(QHUJ\�(I¿FLHQF\�ZZZ�DVHDQHQHUJ\�RUJ�HQJDJHPHQWV�asean-eu/asean-shine/

35
Figure 10: Schematic overview of the roadmap vision, goals and actions
1: Average fuel consumption per 100 km of new light duty vehicles sold in ASEAN is improved by 26% between 2015 and 2025
2: Common indicators and
methodologies as well as baseline data for fuel economy are
defined
3: Regional cooperation, national
action, and fuel economy policy leadership are
established
4: Fuel economy label information is regionally aligned
5: Introduction or enhancement of
fiscal policies based on fuel economy or
CO2 emissions
6: Adoption of national fuel economy
standards for LDVs in all markets striving towards a regional
standard in the long term
2.1: Agree on common indicators and methodologies 2.2 Develop fuel economy baseline data
Transform the ASEAN light duty vehicle market into one of the world's most fuel efficient by 2025, helping to meet regional and national goals for sustainable transport, energy efficiency and climate change mitigation, while supporting the vision of the
ASEAN Economic Community 2025, and ensuring health and quality of life of people across the region
3.1: Continue regional cooperation among policymakers and experts 3.2 Enhance collaboration of government agencies, research institutions, and automotive industry 3.3 Leadership on the issue of fuel economy policies
4.1: Convene the agencies of AMS responsible for fuel economy labels 4.2: Develop a common set of baseline information
5.1 Introduce and strengthen fuel economy or CO2 emission-based fiscal policy 5.2 Exchange lessons learned on fiscal policy implementation
6.1: Introduce and strengthen policy measures at national level 6.2 Develop an ASEAN wide light duty vehicle fuel economy standard
Vis
ion
Goa
ls
����
���

36
4 Options for fuel economy policy development
7KH�IROORZLQJ�VHFWLRQ�SURYLGHV�D�UDQJH�RI�RSWLRQV�UHJDUGLQJ�¿VFDO��UHJXODWRU\�DQG�RWKHU�IXHO�economy policy measures. Each section focuses on one policy measure presented as a table. Each section also corresponds to a section of the Annex where the measures are GLVFXVVHG�LQ�GHWDLO��7KHUH�DUH�IXUWKHU�RSWLRQV�WKDW�DUH�QRW�GLUHFWO\�OLQNHG�WR�IXHO�HI¿FLHQF\�EXW�WKDW�KHOS�WKH�DGRSWLRQ�RI�DGYDQFHG�HI¿FLHQW�YHKLFOH�WHFKQRORJ\��VXFK�DV�LPSURYHG�IXHO�quality and emission reduction equipment. These options are not presented here but are discussed in the annex for interested readers.
Fuel economy policies can be categorised by their target group (Figure 10). Fiscal instruments such as vehicle and fuel taxation or direct subsidies (for example for very HI¿FLHQW�YHKLFOHV��PDLQO\�WDUJHW�WKH�FRQVXPHU�WR�SXOO�WHFKQRORJ\�LQQRYDWLRQ�LQWR�WKH�PDUNHW��+RZHYHU��¿VFDO�LQFHQWLYHV�FRXOG�DOVR�EH�JLYHQ�WR�PDQXIDFWXUHUV�WR�LQFHQWLYLVH�SURGXFWLRQ�RI�HI¿FLHQW�YHKLFOHV��$Q�H[DPSOH�LV�0DOD\VLD¶V�(QHUJ\�(I¿FLHQW�9HKLFOH�3URJUDP�
On the other side, regulatory measures such as fuel-economy standards as well as pollutant-emission and fuel-quality standards oblige manufacturers and importers to supply the required technology to the market. Last but not least, adequate consumer information (for example through fuel economy labelling schemes) is essential to ensuring that the FRQVXPHU� FDQ� DGHTXDWHO\� TXDQWLI\� WKH� YDOXH� RI� YHKLFOH� IXHO� HI¿FLHQF\� ZKHQ� PDNLQJ� D�purchase decision.
Figure 11: Overview of fuel economy policy measure categories

37
Fuel economy policy development should follow a set of best-practice guidelines to effectively lead to the intended results while minimising unintended side effects. Fuel economy policy measures should meet the following criteria:
1. Comprehensive – Fuel economy policies should be developed in a way that they apply to all LDVs and not only passenger cars. This ensures that manufacturers and consumers cannot circumvent the objective of improving fuel economy by offering and purchasing vehicle types that are not be affected by fuel economy policies. Such FDVHV�FDQ�HPHUJH�LI��IRU�H[DPSOH��SLFN�XS�WUXFNV�DUH�FODVVL¿HG�DV�OLJKW�FRPPHUFLDO�vehicles and excluded from fuel economy measures applied to passenger cars.
2. Long-term – Both manufacturers and consumers can much better anticipate the YDOXH�RI�YHKLFOH�IXHO�HI¿FLHQF\�LI�SROLFLHV�KDYH�D�ORQJHU�WHUP�WDUJHW�FRYHULQJ�DW�OHDVW�the following 10 to 15 years.
3. Periodically revised – All fuel economy policy schemes need to be subject to periodical revisions. They should be adjusted to technology and market developments to address rebound effects or unintended costs.
4. Technology-neutral – ,QVWHDG�RI�GHYHORSLQJ�YDULRXV� LQFHQWLYHV� WDUJHWLQJ�VSHFL¿F�vehicle technologies (for example hybrid cars), fuel economy policies should be based on common indicators, such as fuel consumption (LGe/100km) or CO2 emission (gCO2/km) that apply to all powertrain options in a similar way.
5. Continuous – When developing fuel economy-based tax schemes, continuous functional relationships between fuel economy and taxation should be preferred to the use of bins and step functions. This limits unintended market distortions and the LQFHQWLYH�IRU�PDQXIDFWXUHUV�WR�SOD\�RII�WKH�GH¿QLWLRQV�WR�PD[LPLVH�WKHLU�EHQH¿WV�IRU�minimal real-world changes.10
The strongest impact on improving LDV fuel economy improvement is by combining both consumer- and manufacturer-targeted fuel economy policies. This can be observed in most European countries, which are characterised by the presence of strong regulatory measurements, multiple fuel economy- or CO2 emissions-based vehicle taxation schemes, and comprehensive consumer information. A discussion on the importance of combined regulatory, taxation and consumer information strategies can be found in a policy and technical toolbox in Section 5.5 of the Annex.
���� 'H¿QLWLRQ�RI�,QGLFDWRUV�DQG�PHWKRGRORJLHVThis roadmap proposes the use of measurement units, indicators, conversion factors and methodologies outlined in Table 6. It therefore proposes to use fuel consumption and CO2 HPLVVLRQV�DV�PHDVXUHPHQW�XQLWV�WR�TXDQWLI\�WKH�HQHUJ\�HI¿FLHQF\�DQG�FDUERQ�LQWHQVLW\�RI�LDVs. Energy use should be expressed as litres of gasoline equivalent, instead of using the volumetric fuel demand in litres, in order to account for the different energy densities of various liquid and gaseous fuels.
10� 7D[LQJ�YHKLFOHV�DFFRUGLQJ�WR�IXHO�HFRQRP\�ELQV�ZKHUH�YHKLFOHV�DUH�JURXSHG�WR�VSHFL¿F�IXHO�FRQVXPSWLRQ�LQWHUYDOV��H�J��below 4LGe/ 100km, 4 to 8LGe/100km, 8 to 12 LGe/100km, above 12LGe/100km) creates incentive to manufacturers whose vehicles are close to a lower bound to perform very minor changes (e.g. changing for a somewhat lower resistance WLUH��LQ�RUGHU�WR�EHQH¿W�IURP�JUHDW�FKDQJHV�LQ�WD[DWLRQ�RQFH�WKH�YHKLFOH�LV�UHFODVVL¿HG�IURP�D�KLJKHU�LQWR�D�ORZHU�WD[�FODVV�

38
)XUWKHUPRUH��IXHO�HI¿FLHQF\�DQG�FDUERQ�LQWHQVLW\��PHDVXUHG�DV�VDOHV�ZHLJKWHG�DYHUDJH�RI�the tested new LDV fuel consumption as well as sales-weighted average of tested new LDV CO2�HPLVVLRQV��VKRXOG�EH�WKH�DJUHHG�LQGLFDWRUV�IRU�PRQLWRULQJ�WKH�HI¿FLHQF\�RI�WKH�QHZ�/'9�ÀHHW�LQ�D�FRXQWU\�RU�UHJLRQ�
Table 6: Suggested measures, indicators, conversion factors and methodologies for fuel economy policy development, enacting and monitoring
In addition, a set of standardised conversion factors to normalise the energy content of IXHOV�VXFK�DV�GLHVHO��FRPSUHVVHG�QDWXUDO�JDV� �&1*��� OLTXH¿HG�SHWUROHXP�JDV��/3*��EXW�also various biofuel blends (depending on different crops such as palm oil [for biodiesel] or sugar cane [for bioethanol]) need to be developed and used collectively within the ASEAN UHJLRQ��$�VLPLODU�VHW�RI�FRQYHUVLRQ�IDFWRUV�QHHGV�WR�EH�DJUHHG�IRU�IXHO�VSHFL¿F�FDUERQ�GLR[LGH�emissions.
Last but not least, there needs to be agreement on methodologies such as the test procedures used to determine vehicle fuel consumption as well as CO2 and air pollutant emissions. While most AMSs are currently using the New European Driving Cycle (NEDC), a timely shift to the recently developed World Light-Vehicle Test Cycle (WLTC, UNECE 2013) should be considered.
The outdated NEDC is suspected to be largely responsible for the increasing gap between tested and real-world on-road fuel consumption of new vehicles (ICCT 2015b). The much more diverse WLTC is aiming at substantially reducing this gap.
AMS should refrain from the development of their own test drive cycles. The introduction RI�FRXQWU\�VSHFL¿F�WHVW�SURWRFROV�SURIRXQGO\�XQGHUPLQHV�WKH�LGHD�RI�D�FROODERUDWLYH�$6($1�vehicle market, and unnecessarily increases costs for manufacturers and, by extension, for consumers.
Common indicators and methodologies are also a precondition for the implementation of mutual recognition agreements. This could allow one AMS to recognise the fuel consumption testing results performed in another AMS, rather than having to invest in (re-)testing.

39
Box 1: Fuel consumption baseline setting methodology
Any fuel economy policy requires the information on tested fuel consumption or CO2 emissions to be DYDLODEOH� IRU� HDFK�QHZO\� UHJLVWHUHG� YHKLFOH� LQ� WKH� FRXQWU\��:KLOH�PDQ\�RWKHU� FDU� VSHFL¿FDWLRQV� VXFK�DV�YHKLFOH�PDNH��PRGHO�� \HDU�RI� ¿UVW� UHJLVWUDWLRQ�� IXHO� W\SH��HQJLQH�SRZHU�DQG�GLVSODFHPHQW��DV�ZHOO�DV�YHKLFOH�ZHLJKW��DUH�FROOHFWHG�E\�DOO�QDWLRQDO�YHKLFOH�UHJLVWUDWLRQ�RI¿FHV��WKH�IXHO�FRQVXPSWLRQ�RU�&22 emission data is most often not available.
,Q�RUGHU�WR�HVWDEOLVK�WKH�QDWLRQDO�EDVHOLQHV��WKH�YHKLFOH�VSHFL¿F�IXHO�FRQVXPSWLRQ�RU�&22 data needs to be added to the registration data. Due to the diversity of the vehicle market, it is most often not possible WR�¿QG�IXHO�FRQVXPSWLRQ�GDWD�IRU�DOO�QHZO\�UHJLVWHUHG�YHKLFOHV��:LWKLQ�*)(,��WKH�VWDQGDUG�IRU�D�VXI¿FLHQWO\�accurate baseline is to have data available for at least 85% of all newly registered vehicles in one year.
Once fuel consumption data has been added to the national new vehicle registration data, the sales-weighted average fuel consumption can be calculated using the following equation:
Equation 1
With: FC = weighted average fuel consumptionRegi = number of newly registered vehicles of type iFCi = fuel consumption of vehicle of type i

40
4.2 Consumer information
Type of measure <� Use of on-vehicle labels and other technologies to clearly describe fuel economy and other fuel consumption and environmental infor-mation to the consumer.
Principle <� �$VVLVWV�WKH�FRQVXPHU�LQ�SXUFKDVLQJ�D�IXHO�HI¿FLHQW�YHKLFOH�RU�LQ�LPSURYLQJ�WKH�IXHO�HI¿FLHQF\�RI�DQ�LQ�XVH�YHKLFOH�
<� Uses laboratory test procedures or in-use monitoring to clearly in-dicate fuel consumption to the consumer in an easy-to-understand format.
<� Relates consumer behaviour to savings in fuel, CO2 emissions and fuel cost.
Rationale <� Consumers are given the ability to compare vehicles not just on look, feel, or technology but also according to fuel consumption and operating cost. Given this information, consumers may change their purchasing or operational behaviours.
Key Aspects <� A common methodology is used to measure fuel economy and is displayed in a standardised fashion, such as a label or a fuel econ-omy tracker.
<� Labels are able to offer a qualitative comparison to other similar ve-hicles so that consumers can understand the relative performance of the vehicle they are looking at.
<� Fuel-economy trackers allow consumers to observe the changing fuel economy of their vehicle and adjust behaviour as necessary.
Building Blocks <� A standardised methodology for testing fuel economy of vehicles included in a labelling scheme, and a database of vehicles to com-pare the labelled vehicle to.
<� A standardised method of indicating relative performance compared to other models of vehicles, or previous points in time.
<� A display format that can easily communicate information to con-sumers and convince them to change behaviour, including local language, easy-to-understand units and appropriate graphic design.
Case Studies1 <� Fuel economy labels in US, China, Singapore, Thailand, Viet Nam and other countries.
<� Fuel economy websites and trackers such as Little Bear (China), One Motoring (Singapore), Spritmonitor (Germany).
Impact Rating <� Medium
Complexity Rating <� Low
Detailed Annex <� Section 5.5.2
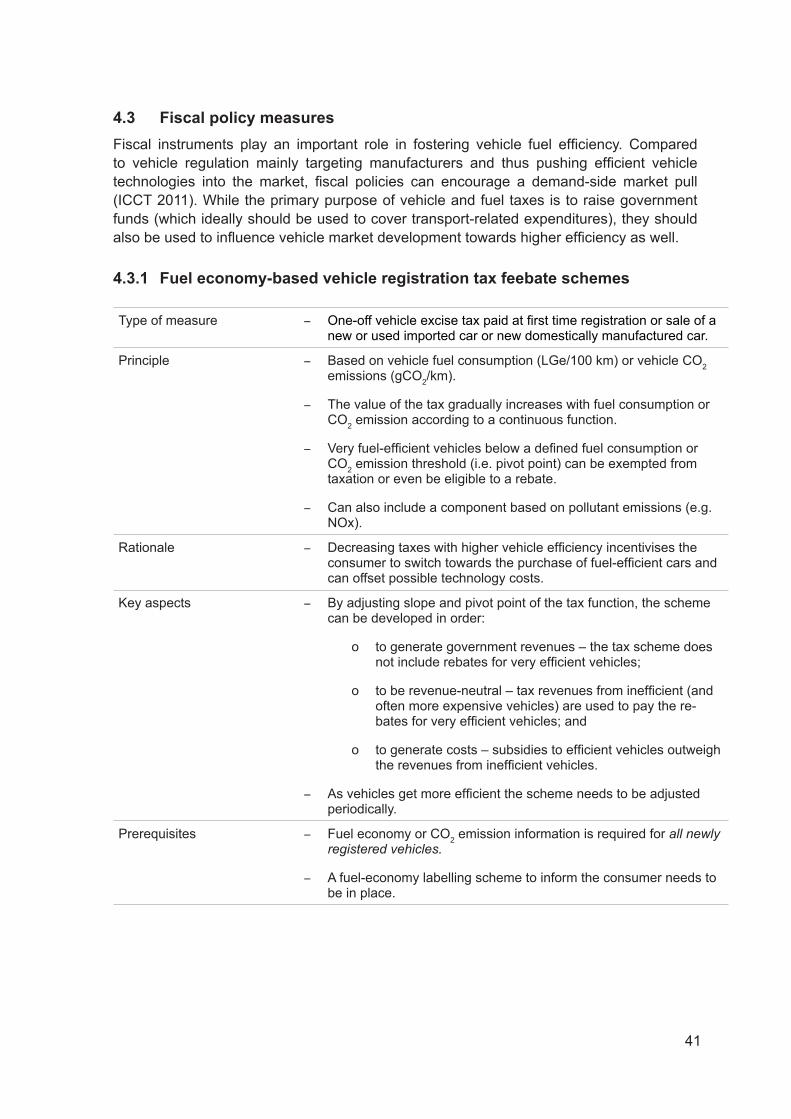
41
4.3 Fiscal policy measures)LVFDO� LQVWUXPHQWV� SOD\� DQ� LPSRUWDQW� UROH� LQ� IRVWHULQJ� YHKLFOH� IXHO� HI¿FLHQF\�� &RPSDUHG�WR� YHKLFOH� UHJXODWLRQ� PDLQO\� WDUJHWLQJ� PDQXIDFWXUHUV� DQG� WKXV� SXVKLQJ� HI¿FLHQW� YHKLFOH�WHFKQRORJLHV� LQWR� WKH� PDUNHW�� ¿VFDO� SROLFLHV� FDQ� HQFRXUDJH� D� GHPDQG�VLGH� PDUNHW� SXOO�(ICCT 2011). While the primary purpose of vehicle and fuel taxes is to raise government funds (which ideally should be used to cover transport-related expenditures), they should DOVR�EH�XVHG�WR�LQÀXHQFH�YHKLFOH�PDUNHW�GHYHORSPHQW�WRZDUGV�KLJKHU�HI¿FLHQF\�DV�ZHOO��
4.3.1 Fuel economy-based vehicle registration tax feebate schemes
Type of measure <� 2QH�RII�YHKLFOH�H[FLVH�WD[�SDLG�DW�¿UVW�WLPH�UHJLVWUDWLRQ�RU�VDOH�RI�D�new or used imported car or new domestically manufactured car.
Principle <� Based on vehicle fuel consumption (LGe/100 km) or vehicle CO2 emissions (gCO2/km).
<� The value of the tax gradually increases with fuel consumption or CO2 emission according to a continuous function.
<� 9HU\�IXHO�HI¿FLHQW�YHKLFOHV�EHORZ�D�GH¿QHG�IXHO�FRQVXPSWLRQ�RU�CO2 emission threshold (i.e. pivot point) can be exempted from taxation or even be eligible to a rebate.
<� Can also include a component based on pollutant emissions (e.g. NOx).
Rationale <� 'HFUHDVLQJ�WD[HV�ZLWK�KLJKHU�YHKLFOH�HI¿FLHQF\�LQFHQWLYLVHV�WKH�FRQVXPHU�WR�VZLWFK�WRZDUGV�WKH�SXUFKDVH�RI�IXHO�HI¿FLHQW�FDUV�DQG�can offset possible technology costs.
Key aspects <� By adjusting slope and pivot point of the tax function, the scheme can be developed in order:
o to generate government revenues – the tax scheme does QRW�LQFOXGH�UHEDWHV�IRU�YHU\�HI¿FLHQW�YHKLFOHV�
o WR�EH�UHYHQXH�QHXWUDO�±�WD[�UHYHQXHV�IURP�LQHI¿FLHQW��DQG�often more expensive vehicles) are used to pay the re-EDWHV�IRU�YHU\�HI¿FLHQW�YHKLFOHV��DQG�
o WR�JHQHUDWH�FRVWV�±�VXEVLGLHV�WR�HI¿FLHQW�YHKLFOHV�RXWZHLJK�WKH�UHYHQXHV�IURP�LQHI¿FLHQW�YHKLFOHV�
<� $V�YHKLFOHV�JHW�PRUH�HI¿FLHQW�WKH�VFKHPH�QHHGV�WR�EH�DGMXVWHG�periodically.
Prerequisites <� Fuel economy or CO2 emission information is required for all newly registered vehicles.
<� A fuel-economy labelling scheme to inform the consumer needs to be in place.

42
Case studies <� Carbon Emission-Based Vehicle Scheme (CEVS) and the new Ve-hicular Emissions Scheme (VES) in Singapore.
<� Bonus-malus system in France.
<� Vehicle registration tax in the Netherlands.
Impact rating <� High
Complexity rating <� Medium
Detailed annex <� Section 5.5.3
4.3.2 Fuel economy-based vehicle circulation tax
Type of measure <� Vehicle registration tax paid on an annual basis for all vehicles in WKH�ÀHHW
Principle <� Based on vehicle fuel consumption (LGe/100 km) or vehicle CO2 emissions (gCO2/km).
<� The value of the tax gradually increases with fuel consumption or CO2 emission according to a continuous function.
<� Can also include a component based on pollutant emissions (e.g. NOx).
Rationale <� 'HFUHDVLQJ�WD[HV�ZLWK�KLJKHU�YHKLFOH�HI¿FLHQF\�LQFHQWLYLVHV�WKH�FRQVXPHU�WR�VZLWFK�WRZDUGV�WKH�SXUFKDVH�RI�IXHO�HI¿FLHQW�FDUV�DQG�can offset possible technology costs.
Key aspects <� The starting point of the tax function, can be set in a way that ve-hicles below a fuel consumption (or CO2 emission) threshold are exempted from the annual circulation tax.
<� $V�YHKLFOHV�EHFRPH�PRUH�HI¿FLHQW�WKH�VFKHPH�QHHGV�WR�EH�DGMXVW-ed periodically.
Prerequisites <� Fuel economy or CO2 emission information is required for all vehi-FOHV�LQ�WKH�ÀHHW�
<� A fuel-economy labelling scheme to inform the consumer needs to be in place.
Case studies <� Annual vehicle registration tax in various European countries as well as China and Japan
Impact rating <� High
Complexity rating <� Medium
Detailed annex <� Section 5.5.4

43
4.3.3 Fuel taxation
Type of measure <� Excise tax paid on fuels at the station
Principle %DVHG�RQ�D�¿[HG�SHUFHQWDJH�VKDUH�RI�WKH�SHU�OLWUH�IXHO�SULFH�DW�WKH�station.
<� Can be differentiated by fuel type.
<� Alternative fuels such as CNG, LPG or low-carbon biofuels can be taxed at a reduced rate.
Rationale <� +LJKHU�IXHO�SULFHV�LQFHQWLYLVH�WKH�FXVWRPHUV�WR�EX\�PRUH�HI¿FLHQW�cars.
Key aspects <� $V�YHKLFOHV�JHW�PRUH�HI¿FLHQW�RYHU�WLPH�DQG�WKH�FUXGH�RLO�SULFH�LV�volatile, the fuel tax needs to be adjusted periodically to prevent a rebound effect.
Prerequisites <� A fuel-economy labelling scheme to inform the consumer needs to be in place.
Case studies <� Fuel taxation and new vehicle fuel economy in Turkey.
Impact rating <� High
Complexity rating <� Low
Detailed annex <� Section 5.5.5
4.4 Regulatory policy measures4.4.1 Fuel economy standardsType of measure <� Regulation which sets limits to vehicle fuel consumption or CO2
emissions for brand-new vehicles
Principle <� All new vehicles in the market need to comply with a fuel economy target, or alternatively a CO2 emission target.
<� The standard can either be set for each model or segment (Option 1), or as a corporate average fuel economy target (Option 2).
<� For Option 1 standards, all vehicles which do not meet the stan-dard are not allowed to be sold in the market
<� )RU�2SWLRQ����PDQXIDFWXUHU��RU�LPSRUWHU�VSHFL¿F�WDUJHWV�DUH�VHW�based on the sales-weighted average fuel economy of all vehicles sold by the manufacturer/importer within a certain time frame. In FDVHV�RI�QRQ�FRPSOLDQFH��¿QHV�DUH�LVVXHG�WR�WKH�PDQXIDFWXUHU�importer.
Rationale <� 7KH�VWDQGDUG�SXOOV�HI¿FLHQW�YHKLFOH�WHFKQRORJLHV�LQWR�WKH�PDUNHW�E\�setting targets for all actors involved.

44
Key aspects <� Corporate average fuel economy standards are largely preferable WR�PRGHO��RU�VHJPHQW�VSHFL¿F�IXHO�HFRQRP\�WDUJHWV�VLQFH�WKH\�SURYLGH�PRUH�ÀH[LELOLW\�WR�WKH�PDQXIDFWXUHUV�DQG�SUHYHQW�JDPLQJ�RI�WKH�YHKLFOH�GH¿QLWLRQV�
<� Fuel economy standards can incorporate further vehicle attributes such as vehicle weight or footprint to better account for varying market portfolios of different manufacturers.
<� Fuel economy standards need to be revised periodically to account for technology development.
Prerequisites <� Fuel economy or CO2 emission information is required for all brand-new vehicles entering the market, i.e. it needs to be part of the information provided by manufacturers for homologation2 of a new vehicle.
<� Corporate average fuel economy standards require close collabo-ration with manufacturers and/or importers during target setting as well as compliance.
<� The administrative framework to set the target, to check compli-ance and to enforce the targets needs to be in place.
Case studies <� Corporate average fuel economy standard of the United States (CAFE); EU LDV CO2�HPLVVLRQ�VWDQGDUGV��YHKLFOH�IXHO�HI¿FLHQF\�standards in China and India.
Impact Rating <� High
Complexity Rating <� High
Detailed Annex <� Section 5.5.6
4.4.2 Fuel quality regulationRequiring fuel quality to be in-line with the requirements of modern engine and exhaust treatment systems is necessary to achieve fuel economy improvement and air pollution reduction targets. For example, fuels with higher octane levels can reduce knock in engines and facilitate higher compression ratios for more a complete fuel combustion and thus a PRUH�HI¿FLHQW�XVH�RI�IXHO��7XUERFKDUJHG�HQJLQHV�DOVR�UHTXLUH�KLJKHU�RFWDQH�IXHO�WR�SURSHUO\�UHGXFH� IXHO� FRQVXPSWLRQ�� /RZ�VXOSKXU� IXHOV� HQVXUH� WKDW� HPLVVLRQ� FRQWURO� ¿OWHUV� GR� QRW�become clogged with ash, which would otherwise result in higher fuel consumption. ASEAN currently has a workstream under the Energy sector working on harmonising efforts around fuel quality across the region. Details about this policy strategy are noted in Annex 5.5.8.
4.5 Vehicle maintenance3URSHU�YHKLFOH�PDLQWHQDQFH�LV�NH\�WR�HQVXULQJ�WKH�FRQWLQXHG�HI¿FLHQF\�RI�FDUV�GXULQJ�XVH��9HKLFOH�PDLQWHQDQFH�FDQ�EH� LPSURYHG� WKURXJK� LQWHQVL¿HG� WHFKQLFDO�YHKLFOH�FRQWUROV��)RU�example, in the EU a vehicle inspection is obligatory for all cars older than four years, and then needs to be repeated every two years for all passenger cars that are not used for commercial purpose, while commercially-used passenger cars need to be inspected one \HDU�DIWHU�¿UVW�UHJLVWUDWLRQ�DQG�WKHQ�RQ�DQ�DQQXDO�EDVLV��'LUHFWLYH���������(8���

45
During the vehicle inspection, if a vehicle has an on-board diagnostic device (OBD), it can be quickly evaluated by computer for any problems with the engine or emission control V\VWHP�WKDW�PLJKW�GHFUHDVH�IXHO�HI¿FLHQF\��*DVROLQH�YHKLFOHV�FRPSO\LQJ�ZLWK�(XUR���DQG�diesel vehicles complying with Euro V standards are equipped with adequate OBD systems, thus reducing testing costs for the consumer. This may be one rationale for hastening the advance of emission control standards in vehicles.
In addition, vehicle inspections also inspect other parts of the car such as tyres, transmission and axles that impact rolling resistance and thus fuel economy.
4.6 In-use fuel economy measuresIn-use fuel economy measures mainly concern the way vehicles are driven, unlike the way WKH\�DUH�WHVWHG��7KH\�LQFOXGH�WUDLQLQJ�GULYHUV�WR�GULYH�PRUH�HI¿FLHQWO\�WKURXJK�HFR�GULYLQJ��DV�ZHOO�DV�WKH�XVH�RI�LQWHOOLJHQW�WUDQVSRUW�V\VWHPV�WR�LPSURYH�WUDI¿F�ÀRZ�
$Q�(8�VWXG\��(FRGULYHQ�������FRQFOXGHG� IURP�¿HOG�H[SHULPHQWV� LQ�VHYHQ�FRXQWULHV� WKDW�eco-driving trainings lead on average to a 15% to 20% reduction of fuel consumption, with 10% as long-term reduction. It is therefore a cheap and useful measure to complement fuel economy policies which mainly target the vehicle itself.
According to a later study (UC Riverside 2015), intelligent transport systems can be FDWHJRULVHG� LQWR� YHKLFOH� V\VWHPV�� WUDI¿F� PDQDJHPHQW� V\VWHPV� DQG� WUDYHO� LQIRUPDWLRQ�systems. Vehicle systems comprise all kind of driver assistance, including to keep front and rear distance or to change lanes. Adaptive cruise control systems will evolve into cooperative adaptive cruise control systems, where vehicles communicate with each other LQ�RUGHU�WR�LPSURYH�WUDI¿F�ÀRZ��(YHQWXDOO\��WKHVH�V\VWHPV�ZLOO�OHDG�WR�DXWRQRPRXVO\�GULYLQJ�cars, where input from the driver is reduced to a minimum.
7UDYHO� PDQDJHPHQW� V\VWHPV� LQFOXGH� WUDI¿F� PRQLWRULQJ�� WUDI¿F� LQFLGHQW� PDQDJHPHQW��corridor management and travel demand management, all of which rely on the increased FRPPXQLFDWLRQ�RI�GDWD�DQG�LWV�PRUH�UDSLG�SURFHVVLQJ�LQ�RUGHU�WR�LPSURYH�WUDI¿F�ÀRZ�DQG�reduce congestion. Travel information systems mainly comprise technologies to better route the driver such as geographical positions systems (GPS).
All of these technologies will lead to an increased level of automation of driving, which again ZLOO�OHDG�WR�LPSURYHG�WUDI¿F�ÀRZ��RSWLPLVHG�URXWHV�DQG�EHWWHU�DQWLFLSDWLRQ�RI�URDG�FRQGLWLRQV��$OWRJHWKHU��LQIRUPDWLRQ�WHFKQRORJ\�V\VWHPV�KDYH�D�ODUJH�SRWHQWLDO�WR�VLJQL¿FDQWO\�LPSURYH�YHKLFOH�HI¿FLHQF\�ERWK�LQ�XUEDQ�DQG�UXUDO�HQYLURQPHQWV�
/DVW�EXW�QRW�OHDVW��PHDVXUHV�WDUJHWLQJ�DW�LPSURYLQJ�DLU�TXDOLW\�RU�UHGXFLQJ�WUDI¿F�LQ�FLW\�FHQWUHV�such as low-emission zones, road pricing, congestion charging, and reduction of parking VSDFH� FDQ�EH�GHVLJQHG� LQ�D�ZD\� WR� VWLPXODWH� LPSURYHG� YHKLFOH�HI¿FLHQF\��)RU�H[DPSOH��some of these measures could include exemptions or additional rights in cases where fuel consumption or CO2�HPLVVLRQV�RI�VSHFL¿F�YHKLFOHV�DUH�EHORZ�DPELWLRXV�WKUHVKROGV��
Measuring in-use fuel consumption, e.g. through digital applications that crowd-source data from drivers, can also be a means to verify type-approved fuel consumption, allowing to compare lab test results with real-world performance.

46
5 Annex
5.1 Global context for fuel economy policy5.1.1 Transport energy use, emissions and climate change,Q�������PRUH�WKDQ�������PHJDWRQQHV�RI�RLO�HTXLYDOHQW��0WRH��RI�¿QDO�HQHUJ\�ZDV�FRQVXPHG�JOREDOO\��$OPRVW�����RI�WKH�¿QDO�HQHUJ\�XVH�ZDV�EDVHG�RQ�SHWUROHXP�RLO��DQG�DERXW�����RI�this oil was consumed by the transport sector (IEA 2016 KWES). In terms of greenhouse gas (GHG) emissions, transport accounts for about 26% of energy-related CO2 emissions worldwide (IEA 2015), and added up to more than 10 megatonnes of CO2 equivalent (Mt CO2e) in 2016 (Figure 12).
Figure 12: Global urban and non-urban transport CO2 emissionsSource: IEA 2016 Cars were the single largest category of emitter with a share of more than 34% of all transport emissions (including international shipping and aviation). Together with LCVs and minibuses, LDVs were responsible for more than 41% of all transport emissions globally in 2015.
In 2017, the Global Fuel Economy Initiative (GFEI) assessed the GHG emission reduction SRWHQWLDO� RI� SDVVHQJHU� OLJKW�GXW\� YHKLFOHV� �3/'9V�� LI� WKH� IXHO� HI¿FLHQF\� RI� QHZO\� VROG�passenger cars were to be improved to a global average of 4.4 LGe/100km by 2030 (from about 8.8 LGe/100km in 2005), and if the entire PLDV stock achieved a fuel consumption of 4 LGe/100km by 2050 (GFEI 2017). It turned out that this target, which was based on readily available, cost-effective technologies, would almost stabilise CO2 emissions from PLDVs at the 2015 level by 2050 (Figure 13).
At the same time, reduced fuel use greatly helps to curtail air pollution as well as leading WR�VLJQL¿FDQW�VDYLQJV�RI�IXHO�FRVW�H[SHQGLWXUHV��7KH�*)(,�TXDQWL¿HG�FXPXODWLYH�VDYLQJV�LQ�its scenario between 2015 and 2050 to be in the order of USD 8 trillion worldwide (GFEI 2016a).

47
Figure ��: Global passenger light-duty vehicle emission reduction potentialSource: GFEI 2016a
Box 2: The Global Fuel Economy Initiative
The Global Fuel Economy Initiative (GFEI) was launched at the 2009 Geneva Motor Show to form a body to assist governments and transport stakeholders to promote better fuel economy. Using the skills and expertise of the GFEI partners (the International Energy Agency (IEA), United Nations Environment Programme (UN Environment), the International Transport Forum of the OECD (ITF), the International Council on Clean Transportation (ICCT), the Institute for Transportation Studies at UC Davis, and the FIA Foundation), the initiative invested a lot of effort to bring WKH� LVVXH�RI�YHKLFOH� IXHO�HI¿FLHQF\�KLJK�XS�RQ� WKH� LQWHUQDWLRQDO�political agenda, and to support developing and emerging economies on the way to take stock of the current national sales-weighted new vehicle fuel consumption (i.e. the baseline fuel
consumption) and develop fuel economy policies such as a CO2 tax, feebate schemes, labelling, and standards.
The GFEI has set the target to reduce LDV fuel consumption of all vehicles in the stock by 50% from 8.8 LGe/100km in 2005 to 4.4 LGe/100km in 2050 (GFEI 2017). To reach this target, fuel consump-tion of all new LDVs needs to reach 4.4 LGe/100km by 2030.
5.1.2 Light-duty vehicle fuel economy standards around the world
Many countries have adopted ambitious fuel economy policies. While in 2005 only 60% of the global PLDV and only 4% of the heavy-duty vehicle (HDV) market were covered by fuel-economy or CO2-emission standards, by 2015 almost 90% of the PLDV and more than 40% of the HDV market was subject to such regulations (Figure 14). In markets where new vehicles are not covered by fuel economy policies, manufacturers are still able to sell less HI¿FLHQW�WHFKQRORJLHV��ZKLFK�HDUQ�KLJKHU�PDUJLQV��&RQVHTXHQWO\��LW�LV�LPSRUWDQW�WR�¿OO�JDSV�LQ�PDUNHWV�WR�SKDVH�RXW�ROG��LQHI¿FLHQW�WHFKQRORJ\�JOREDOO\�
The dominance of regulated LDV markets means countries that rely mostly on imported cars can introduce ambitious fuel economy policies and will obtain better new vehicles at competitive prices. Additionally, countries with domestic vehicle manufacturing industry can make their vehicles more competitive on the international market through the introduction of effective fuel economy policy measures.
Figure 15 GFEI target to double vehicle fuel economy by reducing new vehicle IXHO�FRQVXPSWLRQ�E\�����E\�����

48
Figure 14: Overview of the global status of light-duty and heavy-duty vehicle fuel economy policiesSource: IEA 2016
Table 7 shows fuel-economy and CO2�HPLVVLRQ� VWDQGDUGV� DV� ZHOO� DV� EDVHOLQH� ¿JXUHV�from around the world, exhibiting a variation in vehicle fuel consumption across markets. While US LDVs consumed almost 8 LGe/100km on average in 2014, LDVs in Europe only consumed about 5.5 LGe/100km in the same year. Nonetheless, the United States together with Canada are the only countries with fuel consumption targets set out to the year 2025. By that time, thanks to stringent standards in place, the US LDV fuel consumption will be almost 40% lower than in 2018.
Table 7: Enacted fuel consumption standards around the world
Table 7 also highlights the annual fuel consumption improvement rates inherent with the presented standards. All countries except Saudi Arabia have improvement rates close to or above 3% per year, with Korea opting for almost 8% annual reduction of fuel consumption of new PCs, and China envisaging a 6% improvement rate between 2015 and 2020. Linear extrapolations of the already enacted fuel economy and CO2 emission standards out to

49
2030 indicate that many of those countries are on track to meet the GFEI target of 4.4 LGe/100km by 2030.
Although the trend is undoubtedly positive, it should be noted that all targets are based on tested new vehicle fuel economy. Unfortunately, recent publications by the International Council on Clean Transportation (ICCT) have demonstrated the increasing gap between tested and real-world, on-road fuel consumption (ICCT 2015a). While 10 years ago, this difference accounted for about 10% to 15%, it is as high as 30% on average as of 2018, with some cars having a real-world fuel consumption 50% higher than the laboratory test. This increasing gap is in part a result of auto manufacturers optimising their vehicles to perform well on tests. In the worst cases, it was due to manufacturers illegally programming vehicles to perform well on tests. This underlines the constant need for fuel economy policy to be carefully designed and implemented in a strong and pragmatic fashion. For example, introducing in-use testing to fuel economy policy could be an innovative way to ensure manufacturers are developing vehicles that will reduce fuel consumption and CO2 emissions in the real world.
���� &RVWV��EHQH¿WV�DQG�LPSDFW�DVVHVVPHQW�RI�/'9�IXHO�HFRQRP\�SROLF\Generating recommendations for the ASEAN Fuel Economy Roadmap involves both economic and environmental considerations. This section analyses the various perspectives on developing the aspirational goals, focusing on why fuel economy policy is important to achieving broader positive environmental and economic outcomes, as well as how the VSHFL¿F�DVSLUDWLRQDO�JRDO�RI�WKLV�URDGPDS�FRXOG�EH�DFKLHYHG�
5.2.1 Introduction to LDV fuel economy technology
7KLV�VHFWLRQ�SURYLGHV�D�VKRUW�RYHUYLHZ�RI�WKH�PRVW�FRPPRQ�/'9�IXHO�HI¿FLHQF\�WHFKQRORJLHV��It combines information on fuel economy improvement potential with technology costs and resulting pay-back times.
As outlined earlier in the document, several options exist to reduce the sales-weighted average fuel consumption of new LDVs. The principle ones are: 1) the reduction of average vehicle size and weight through a market shift towards smaller vehicle segments; 2) the UHGXFWLRQ�RI�DYHUDJH�YHKLFOH�SHUIRUPDQFH��DQG����WKH�LQWURGXFWLRQ�RI�IXHO�HI¿FLHQW�YHKLFOH�technology.
7KH�PRVW� HI¿FLHQW� ZD\� WR� LPSURYH� IXHO� HFRQRP\�ZRXOG� EH� WKH� FRPELQDWLRQ� RI� DOO� WKUHH�options. Nonetheless, since consumers demand larger and better performing cars, the focus of this section will be on technology improvement.
A selection of the most common technological measures to improve the fuel economy of LDVs is provided in Table 8. These measures are divided into four categories of improvement: the engine itself; the vehicle drive-train; the weight and aerodynamic performance of the YHKLFOH��DQG�WKH�HI¿FLHQF\�RI�DX[LOLDU\�DJJUHJDWHV�
&RPELQDWLRQV�RI�YDULRXV�PHDVXUHV�FDQ�OHDG�WR�VLJQL¿FDQW�IXHO�HFRQRP\�LPSURYHPHQWV��EXW�QRW�DOO�PHDVXUHV�FDQ�EH�FRPELQHG��DQG�VRPH�RI�WKH�PHDVXUHV�FRPH�ZLWK�VLJQL¿FDQW�FRVWV��&RPSUHKHQVLYH�OLWHUDWXUH�RQ�WKH�DQDO\VLV�RI�FRVWV�DQG�IXHO�HI¿FLHQF\�EHQH¿WV�RI�WHFKQRORJ\�

50
packages for different vehicle classes exist. A detailed summary of technical reports by Ricardo or FEV Inc. are provided in the easy-to-digest overview titled Summary of the EU Cost Curve Development Methodology (ICCT 2012a).
An example of a simulation-based cost curve is provided in Figure 16, representing the CO2 emission reduction potential and respective costs for a segment-C gasoline car against a 2010 baseline car of the same size class for the European car market.11 Future additional costs are estimated for the years 2015, 2020 and 2025. This is due to technologies becoming cheaper as a function of deployment and time, in a process dubbed ‘technological learning’.
Table 8��9HKLFOH�WHFKQRORJLHV�IRU�IXHO�HI¿FLHQF\�LPSURYHPHQW�E\�FDWHJRU\
Source: based on ICCT 2012a; Ricardo 2012
The analysis shows that as of 2015 a 32% CO2 emission reduction down to 95gCO2/km (i.e. the EU 2021 PLDV emission standard) could be achieved at a cost of around EUR 1,750 per car and by applying measures such as start-stop technology in combination with strong engine downsizing to a displacement of 800ccm, based on a stoichiometric gasoline turbocharged direct injection engine. These costs could drop to about EUR 1,000 by the year 2025.
11 In this case, a 2010 Ford Focus 1.6L with no turbocharging and a manual six speed gear shift was used as the baseline vehicle. It has a tested fuel consumption of 6.4 LGe/100km (based on NEDC).

51
A 50% reduction to only 70gCO2/km (equivalent to 2.9 LGe/100km) is feasible at 2015 costs of about EUR 3,500, possibly dropping to EUR 2,250 by 2025. This very low fuel consumption can only be achieved through full hybridisation of the vehicle in combination ZLWK�VLJQL¿FDQW�ZHLJKW�UHGXFWLRQ�DQG�UHGXFHG�URDG�ORDG�GXH�WR�LPSURYHG�DHURG\QDPLFV�DQG�the use of low rolling resistance tyres.
Similar results are obtained for other vehicle segments. The report shows that on average a 30% CO2 emission reduction to 95 gCO2/km (~3.9 LGe/100km, from 5.3 LGe/100km for all PLDVs in 2012 in the EU) could be achieved for all new passenger cars at additional costs of around EUR 1,100 per vehicle by the year 2020 (dropping to EUR 1,000 in 2025). Similarly, the average CO2 emission of all new LCVs could drop by 30% to about 120 gCO2/km (~4.5 LGe/100km) by 2020 at additional per vehicle costs of approximately EUR 2,000 (dropping to EUR 1,800 by the year 2025).
Figure 15: CO2 reduction potential and additional direct manufacturing costs for a segment c petrol car for the years 2015, 2020 and 2025.Note: M5: manual 5 gear shift; SS: start-stop (idle-off) technology; SGTDI: Stoichiometric gasoline turbocharged direct injection; 8DCT: 8-speed dual clutch (automated) transmission; CEGR: cooled exhaust gas recirculation; RL: road load; AtkCPS: Atkinson cycle engine with cam phase shiftingSource: ICCT 2012a
The publication concluded that ‘the introduction of neither electric or hybrid vehicle WHFKQRORJ\�LV�UHTXLUHG�WR�PHHW�WKH�>(XURSHDQ�ÀHHW@�DYHUDJH�&22 target’ of 95 gCO2/km, i.e. 3.9 LGe/100km for the year 2021 (ICCT 2012a).
The much higher baseline fuel consumption of 7.2 LGe/100km (2015) in the ASEAN region compared to about 5.5 LGe/100km (2014) in the European Union might indicate that the additional per-vehicle cost to achieve a 30% fuel consumption reduction could actually be lower than in Europe. On the other hand, since, on average, LDVs are assumed to be much cheaper in ASEAN region compared to the EU, it is likely that per-vehicle costs to achieve the same fuel economy improvement are higher than in the EU. Nonetheless, assuming even twice the per-vehicle cost compared to Europe, a 30% fuel consumption reduction for PLDVs could be achieved at an additional cost of EUR 2,200 per car (EUR 4,000 for LCVs).

52
In any case, fuel economy improvement in the order of almost 50% can be achieved without WKH�LQWURGXFWLRQ�RI�FRVWO\�YHKLFOH�SRZHU�WUDLQ�FRQ¿JXUDWLRQV�VXFK�DV�K\EULGLVHG�RU�HOHFWULF�vehicles in the ASEAN region.12 Ambitious fuel economy targets in the ASEAN region can be achieved based on cost-effective vehicle technology already sold in large numbers elsewhere in the world. The fact that many AMSs do not have own vehicle manufacturing capacities and, taken in isolation, are of relatively small market size should not be a limiting IDFWRU�WR�EULQJLQJ�FRVW�HIIHFWLYH�DQG�HI¿FLHQW�YHKLFOHV�WR�WKH�PDUNHW�
������ (FRQRPLF�FRVWV�DQG�EHQH¿WV�RI�/'9�IXHO�HFRQRP\
%HWWHU�IXHO�HI¿FLHQF\�DW�VLPLODU�FDU�VL]H�LV�PRVW�RIWHQ�OLQNHG�WR�LQFUHDVHG�YHKLFOH�FRVWV��IRU�example through the use of better materials, longer development times, and the demand for additional and more complex vehicle subsystems (e.g. turbo chargers). However, numerous VWXGLHV� RQ� YDULRXV�ZRUOG� UHJLRQV� KDYH� VKRZQ� WKDW�PDQ\� YHKLFOH� HI¿FLHQF\� WHFKQRORJLHV�yield overall cost savings after taking into consideration the costs of fuel saved over the vehicle lifetime (Figure 16).
Figure 16: Comparison of technology costs and fuel savings of passenger carsSource: IEA 2012
Table 9��&RVW�HIIHFWLYHQHVV�RI�OLJKW�GXW\�YHKLFOH�HI¿FLHQF\�VWDQGDUGV�DURXQG�WKH�ZRUOG
Source: GFEI 2016a
12 Based on achieving 3.9 LGe/100km (i.e. the EU 2021 standard of 95 gCO2/km) down from 7.2 LGe/100km in the ASEAN today.

53
Payback periods based on fuel savings and average compliance vary between two and ¿YH�\HDUV��PDLQO\�GHSHQGLQJ�RQ�WKH�OHYHO�RI�DPELWLRQ�RI�WKH�IXHO�HFRQRP\�RU�&22-emission regulation.
In addition, fuel-economy policies can help improve the balance of trade for AMS, which are largely oil importing countries. In 2013, the region’s net import of oil was more than USD 100 billion (ACE 2015). Each dollar that ASEAN consumers spend on imported energy cannot be spent on other products or services, and could be redirected to create more DGGHG�YDOXH�IRU�WKH�UHJLRQ��$QQH[�6HFWLRQ�������TXDQWL¿HV�WKH�VDYLQJV�SRWHQWLDO�EDVHG�RQ�GLIIHUHQW�VFHQDULRV��,W�¿QGV�WKDW�LI�$6($1�PHHWV�WKH�DVSLUDWLRQDO�JRDO�RI�WKLV�URDGPDS��DERXW�USD 9 billion can be saved in the ASEAN region by 2025.
7R� VXPPDULVH�� SROLFLHV� WDUJHWLQJ� WKH� LQFUHDVHG� HI¿FLHQF\� RI� /'9V� FDQ� VDYH� VXEVWDQWLDO�amounts of money, at both household and national levels. Increasing vehicle fuel economy LV�WKXV�D�IXQGDPHQWDO�DSSURDFK�WR�FRPELQLQJ�HQHUJ\�HI¿FLHQF\�DQG�FOLPDWH�SROLF\�WDUJHWV�with national economic development, as well as efforts to reduce energy dependency and air pollution.
������ 0HWKRGRORJ\�DQG�WRROV�IRU�FRVW�EHQH¿W�DQDO\VLV�RI�IXHO�HFRQRP\�SROLF\�ZLWKLQ�AMSs
&RVW�EHQH¿W� DQDO\VLV� �&%$�� LV� DQ� LPSRUWDQW� WRRO� WR� DVVHVV� YDULRXV� IXHO�HFRQRP\� SROLF\�options. A simple CBA compares only a few monetary values over time: 1.) the value of fuel VDYLQJV�DQG�HPLVVLRQ�UHGXFWLRQV�RQ�WKH�EHQH¿WV�VLGH�YHUVXV�����WKH�DGGLWLRQDO�FRVW�IRU�PRUH�HI¿FLHQW�YHKLFOHV�RQ�WKH�FRVWV�VLGH��
%XW�HYHQ�LQ�LWV�VLPSOHVW�YDULDQW��WKH�&%$�UHTXLUHV�VXEVWDQWLDO�PRGHOOLQJ�ZRUN��2Q�WKH�EHQH¿WV�VLGH��WZR�HIIHFWV�QHHG�WR�EH�TXDQWL¿HG��HDFK�UHTXLULQJ�D�VSHFL¿F�WRRO��7KHVH�HIIHFWV�DUH�
1. the impact of fuel economy policies on future sales-weighted new LDV fuel consumption; and
2. the impact of improved new LDV fuel economy on the average fuel economy of the entire rolling LDV stock, energy use, emissions and fuel costs.
The impact of vehicle and fuel taxation schemes on future average fuel economy of newly registered LDVs can be estimated using the freely available Fuel Economy Policy Impact Tool (FEPIT) developed by the International Energy Agency (see Box 3, below).
In order to assess the energy savings, emission reductions and fuel cost savings stemming from the introduction of fuel economy policies, a simple transport model is needed, able to estimate future energy use, emissions and fuel costs based on projections of travel demand.
The previously estimated average annual new LDV fuel economy improvement rate can then be used as an input for the transport model. By comparing a business-as-usual scenario (BAU), which has no changes in vehicle and fuel taxation, with a scenario incorporating the tax reforms and the resulting changes in new vehicle fuel economy, the fuel, emission and cost reduction potential of the proposed changes in taxation can be estimated up until the targeted year.
On the costs side of the CBA, the additional average per-vehicle costs to achieve a certain fuel

54
economy improvement need to be estimated. As outlined in Section 5.2.1, comprehensive and expensive studies have been undertaken by Ricardo and FEV Inc. (Ricardo 2012, FEV 2012) for Europe. Similar studies can be found for the US. Although LDVs in the ASEAN are on average much cheaper than in Europe and North America, the results might be transferable to a certain extent. Given the available literature, even if large levels of XQFHUWDLQW\�DUH�DSSOLHG�WR�FRVW�¿JXUHV��VXFK�DV�WKRVH�QRWHG�LQ�)LJXUH������WHFKQRORJ\�FRVWV�as a function of fuel economy improvement can be obtained. As a result, the effort and H[SHQVH�RI�GHYHORSLQJ�YHKLFOH�WHFKQRORJ\�FRVW�FXUYHV�VSHFL¿FDOO\�IRU�WKH�$6($1�PDUNHW�might not be necessary for the purposes of developing fuel economy targets.
%R[����6SRWOLJKW�RQ�PRGHOOLQJ�WRROV
Fuel Economy Policies Implementation Tool (FEPIT)
FEPIT13 has been developed by the International Energy Agency and can be downloaded for free. This tool enables the estimation of future sales-weighted average fuel economy of new LDV sales. A key result of FEPIT consists of an annual fuel economy improvement rate of the entire new LDV market of a country between a historical base year and a set target year.
FEPIT estimates the effect of implementing one or more fuel economy policies based on their design as well as information regarding the historical sales-weighted average fuel economy of new LDVs as well as the current policy and market environment (such as the level of vehicle registration tax or the level of fuel duties). The estimates of the expected impacts are based on a set of elasticities linking the policy characteristics with changes in the output variables. In FEPIT, the current vehicle market needs WR�EH�FKDUDFWHULVHG�E\�GLYLGLQJ�LW�LQWR�¿YH�IXHO�HFRQRP\�ELQV�ZLWK�HTXDO�VWHS�ZLGWK��DQG�E\�VXEVHTXHQWO\�providing both the market share as well as the sales-weighted average. Once the status quo with respect to LDV market and vehicle taxation is described in FEPIT, the effect of various fuel economy policies on future average new LDV fuel economy can be tested. Such policies include the following:
1) a fuel economy standard2) a feebate scheme for a one-off registration tax for newly registered light-duty vehicles (LDVs)3) a feebate scheme for an annual registration tax of LDVs4) an adjusted fuel tax
For the purposed of this analysis, the effect of the proposed feebate scheme on future average sales-weighted new LDV fuel economy will be estimated.
Fuel Economy Standards Evaluation Tool (FESET)14
The New Vehicle Fuel Economy and CO2 Emission Standards Emissions Evaluation Guide has been developed by GIZ with support from the ICCT, together with a Microsoft Excel-based spreadsheet tool (FESET) to help in calculating the CO2 mitigation impacts of existing or planned fuel economy standards in a country or region. It provides guidance on the structure of mitigation effects, on determining the baseline and calculating emission reduction, and on monitoring, compliance and enforcement.
The ADB Transport Databank ModelThis model has been designed to simulate national transport scenarios, taking into account all modes (i.e. road, rail, water and air), and to project transport activity, energy use, emissions and costs for urban as well as non-urban transport. Transport activity is a function of socio-economic input data such as GDP and population projections, in order to
13 The model as well as a user guide and a methodology report are available at: https://www.iea.org/topics/transport/subtopics/globalfueleconomyinitiativegfei/fepit/
14 Tool guide https://www.changing-transport.org/wp-content/uploads/2017_FES_GHG_Evaluation_Guide.pdf Tool download: https://www.changing-transport.org/wp-content/uploads/Tool_FESET.xlsm

55
take into account increases in welfare and thus vehicle ownership. The model considers a great variety of vehicle types, powertrain technologies and fuels, and provides a default set of transport policy measures, which can be applied in order to build various sustainable transport scenarios.
&RXQWU\�VSHFL¿F�KLVWRULFDO�WUDQVSRUW�GDWD�VXFK�DV�YHKLFOH�VWRFNV�DQG�VDOHV��DQQXDO�PLOHDJHV�DQG�ORDG�IDFWRUV��DV�ZHOO�DV�VRFLR�HFRQRPLF�GDWD�VXFK�DV�SRSXODWLRQ�DQG�*'3��GH¿QH�WKH�baseline data. Parameters such as vehicle fuel economy, vehicle lifetime or historical average fuel economy improvement rates are fed into the Transport Baseline Model, which then calculates travel activity, modal structure, fuel use and emissions (alongside further outputs with regard to safety and workforce) for the business-as-usual scenario (BAU). :LWK�WKH�KHOS�RI�SUH�VHW�WUDQVSRUW�SROLF\�RSWLRQV�GH¿QHG�LQ�WKH�3ROLF\�,QSXWV�PRGXOH��WZR�alternative scenarios can be developed, calculated and compared to the BAU scenario.15
5.2.4 Impact assessment of the aspirational fuel economy goal
models can be utilised to predict the reduction of fuel consumption and CO2 emissions as WKH�RXWFRPH�IURP�D�SROLF\�RYHU�WLPH��7KLV�DQDO\VLV�¿UVW�GHVFULEHV�D�EHQFKPDUN�VFHQDULR�(BMS) and the fuel consumption as a result of the BMS into the future. Then, based on the DFWLRQV�LGHQWL¿HG�LQ�WKH�URDGPDS��WKH�LPSDFWV�RI�WKH�URDGPDS�FRPSDUHG�WR�WKH�%06�FDQ�EH�GHWHUPLQHG��,Q�KLV�ZD\��GHFLVLRQ�PDNHUV�FDQ�EHWWHU�XQGHUVWDQG�WKH�EHQH¿WV�RI� LPSURYLQJ�fuel economy compared to the likely predicted costs.
The scenarios are based on estimated population and GDP growth, where the BMS assumes vehicle ownership to increase from about 70 LDVs per thousand capita in 2015 (equivalent to about 44 million LDVs) to about 110 LDVs per thousand capita in 2025 (~75 million LDVs) and more than 315 LDVs per thousand capita in 2050 (~246 million LDVs).
In the benchmark scenario (BMS), average reduction in fuel consumption of new LDVs is estimated to maintain its historical rate of about 1% per year over the coming decades. Starting at 7.2 LGe/100km for new LDVs in 2015, average new LDV fuel consumption comes down to 6.6 LGe/100km by 2025, and 5.3 LGe/100km by 2050. Applying the targeted annual fuel economy improvement rate between now and 2025 of 3% as per the fuel economy policy scenario (FEPS)new LDV fuel consumption reaches 5.3 LGe/100km in 2025. After 2025, annual fuel economy improvement rate for ICE-powered LDVs is assumed to drop to 1%, since conventional technology is reaching its improvement limits, and sales-weighted average fuel consumption of new LDVs would fall to 3.3 LGe/100km by 205016.
15 http://transportdata.net/en/page/1116 Shares of new vehicle powertrain technologies are identical in both the BAU and ASEAN FEPS. By 2025, conventional
ICE cars still account for 95% of sales, the remaining 5% are hybridised vehicles. The share of diesel cars drops from about 37% in 2015 to about 25% in 2025. Even in the benchmark scenario it is assumed that by 2050, about 30% of newly sold cars are hybridised, and 5% each are battery electric and plug-in hybrid vehicles.
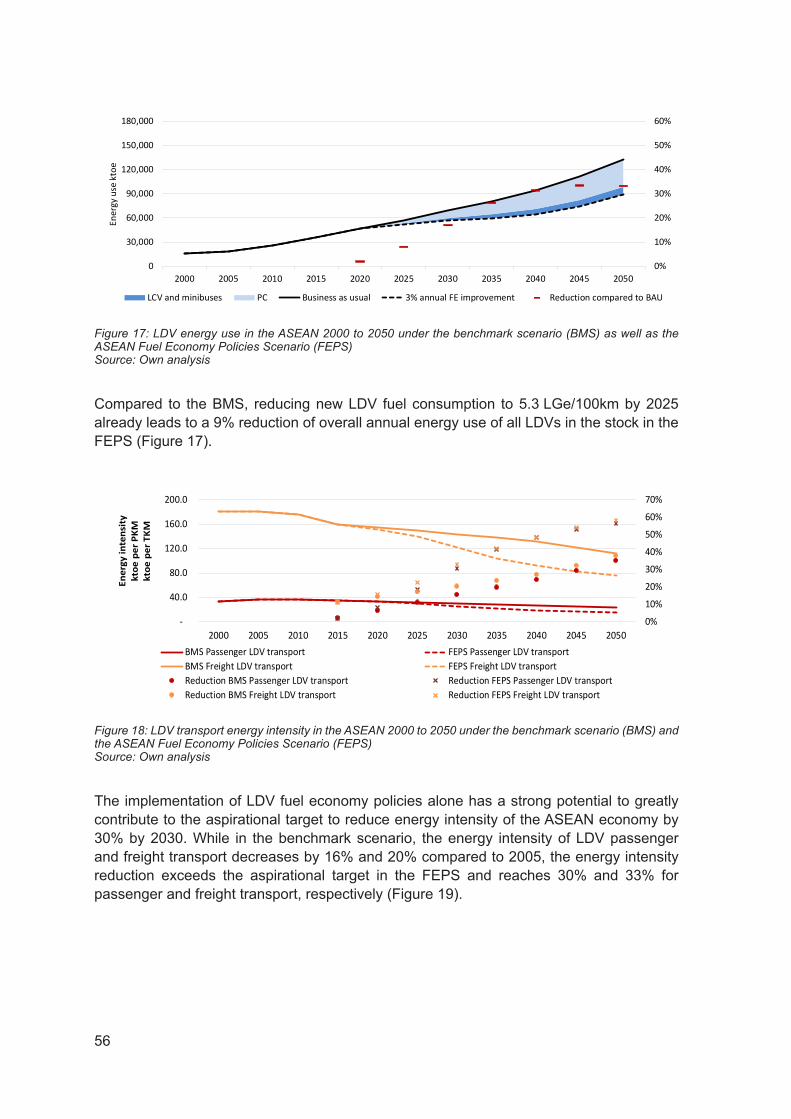
56
0%
10%
20%
30%
40%
50%
60%
0
30,000
60,000
90,000
120,000
150,000
180,000
2000 2005 2010 2015 2020 2025 2030 2035 2040 2045 2050
Ener
gy u
se k
toe
LCV and minibuses PC Business as usual 3% annual FE improvement Reduction compared to BAU
Figure 17: LDV energy use in the ASEAN 2000 to 2050 under the benchmark scenario (BMS) as well as the ASEAN Fuel Economy Policies Scenario (FEPS)Source: Own analysis
Compared to the BMS, reducing new LDV fuel consumption to 5.3 LGe/100km by 2025 already leads to a 9% reduction of overall annual energy use of all LDVs in the stock in the FEPS (Figure 17).
0%
10%
20%
30%
40%
50%
60%
70%
-
40.0
80.0
120.0
160.0
200.0
2000 2005 2010 2015 2020 2025 2030 2035 2040 2045 2050
En
erg
y i
nte
nsit
y
kto
e p
er P
KM
kto
e p
er T
KM
BMS Passenger LDV transport FEPS Passenger LDV transportBMS Freight LDV transport FEPS Freight LDV transportReduction BMS Passenger LDV transport Reduction FEPS Passenger LDV transportReduction BMS Freight LDV transport Reduction FEPS Freight LDV transport
Figure 18: LDV transport energy intensity in the ASEAN 2000 to 2050 under the benchmark scenario (BMS) and the ASEAN Fuel Economy Policies Scenario (FEPS)Source: Own analysis
The implementation of LDV fuel economy policies alone has a strong potential to greatly contribute to the aspirational target to reduce energy intensity of the ASEAN economy by 30% by 2030. While in the benchmark scenario, the energy intensity of LDV passenger and freight transport decreases by 16% and 20% compared to 2005, the energy intensity reduction exceeds the aspirational target in the FEPS and reaches 30% and 33% for passenger and freight transport, respectively (Figure 19).

57
0%
10%
20%
30%
40%
50%
60%
0
100
200
300
400
500
600
2000 2005 2010 2015 2020 2025 2030 2035 2040 2045 2050
Wel
l-to-
whe
el e
mis
sion
s M
t CO
2
LCV and minibuses PC Business as usual 3% annual FE improvement Reduction compared to BAU
Figure ��: LDV wheel-to-wheel CO2 emissions in the ASEAN 2000 to 2050 under the benchmark scenario (BMS) and the ASEAN Fuel Economy Policies Scenario (FEPS)Source: Own analysis
7KH�GHFUHDVHG�HQHUJ\�XVH�OHDGV�WR�VLJQL¿FDQWO\�UHGXFHG�ZHOO�WR�ZKHHO�&22 emissions in the LDV transport sector. As for energy use, annual CO2 emission reductions account for 9% by 2025, about 17% by 2030 and almost 35% by 2050 (Figure 20).
0%
2%
4%
6%
8%
10%
12%
14%
-
200.0
400.0
600.0
800.0
1,000.0
1,200.0
1,400.0
BMS FEPS BMS FEPS BMS FEPS BMS FEPS BMS FEPS BMS FEPS
2015 2020 2025 2030 2040 2050
WT
W C
O2
em
issio
ns M
tC
O2
Road Rail Water Air Total transport WTW CO2 emission reduction
Figure 20: Total transport well-to-wheel CO2 Emissions and LDV emission reductions in the ASEAN for selected years under the benchmark scenario (BMS) as well as the ASEAN Fuel Economy Policies Scenario (FEPS)Source: Own analysis
7KH�/'9� IXHO�HI¿FLHQF\� LPSURYHPHQWV�HQYLVDJHG� LQ� WKLV� URDGPDS�ZRXOG� UHVXOW� LQ�D� WRWDO�transport CO2 emissions reduction of 2% in 2025 compared to the BMS, and 6% by ������¿QDOO\� UHVXOWLQJ� LQ�D�����HPLVVLRQ� UHGXFWLRQ�E\� WKH�\HDU������ �)LJXUH������*LYHQ�this contribution to emission reductions, LDV fuel economy improvement is an important component when developing Nationally Determined Contributions (NDCs) and Nationally Appropriate Mitigation Actions (NAMAs) to mitigate climate change.

58
0
500
1000
1500
2000BM
S
FEPS
BMS
FEPS
BMS
FEPS
New vehicleexpenditures2018 to 2025
Fuel costs2018 to 2025
Total 2018 to2025
Bil
lio
n U
SD
PC LCV Minibuses
19 billion USD -28
billion USD
-9 billion USD
2018 to 20502018 to 20302018 to 2025
0
1000
2000
3000
4000
BMS
FEPS
BMS
FEPS
BMS
FEPS
New vehicleexpenditures2018 to 2030
Fuel costs2018 to 2030
Total 2018 to2030
Bil
lio
n U
SD
48 billion USD
-115 billion USD
-67 billion USD
0
2000
4000
6000
8000
BMS
FEPS
BMS
FEPS
BMS
FEPS
New vehicleexpenditures2018 to 2050
Fuel costs2018 to 2050
Total 2018to 2050
Bil
lio
n U
SD
149 billion USD
-638 billion USD
-489 billion USD
Figure 21: Cumulative costs of new LDV purchases and fuel use 2018 to 2025 and 2018 to 2040 in the ASEAN region under a business- as- usual (BAU) as well as the ASEAN FE RM ScenarioSource: Own analysis
Most importantly, the scenarios show that the implementation of stringent fuel economy policies to achieve the proposed fuel consumption target of 5.3 LGe/100km for new LDVs is economically feasible. When comparing cumulative additional costs resulting from the purchase of better vehicle technology with estimated cumulative fuel savings, it turns out WKDW� VLJQL¿FDQW�DPRXQWV�RI�PRQH\�FDQ�EH�VDYHG� LQ� WKH�VFHQDULR�ZKHUH� WKH�JRDOV�RI� WKH�roadmap are achieved. Already by the year 2025, about USD 9 billion can be saved in the ASEAN region. If stringent fuel economy policies are continued, cumulative savings could add up to USD 67 billion by 2030 and almost USD 500 billion by the year 2050 (Figure 21).

59
5.3 Existing fuel economy policies in ASEAN Member StatesTable 10: Overview of the status of fuel economy policies in the ASEAN region
Brunei Darussalam Cambodia
Fuel economy baseline Working on developing the baseline. No baseline calculations.
Fuel economy labelling and public information programmes
- No labelling scheme in place.
Fuel economy related tax instruments - 1R�¿VFDO�LQFHQWLYHV�LQ�SODFH�
Fuel economy standards Plans to introduce EU equivalent standards. No fuel economy standards in place.
Fuel taxation - -
Pollutant emissions standards - -
Fuel quality standard - Euro II-compatible.
Import of used vehicles - -

60
Indonesia Lao PDR
Fuel economy baseline Fuel economy baselines established for LDVs and 2-wheelers in 2012. Baseline calculations also available in GFEI WP15 (GFEI 2017).
No baseline calculations.
Fuel economy labelling and public information programmes
Voluntary labelling by manufacturers based on test data from type approval process.Eco-driving programmes and intensive public policy dialogues.
No labelling scheme in place.
Fuel economy related tax instruments
Low Cost Green Car Programme including zero luxury sales tax (LST) for 120ccm vehicles (diesel: 150ccm) with FE> 20km/litre or 128 gCO2/km. To be replaced by Low Carbon Emission Vehicles Program (2017), which foresees a 50% LST reduction for advanced technology vehicles (e.g. hybrid, alternative fuels) with fuel economy greater to 28 km/l and 5% LST reduction for 20-28 km/l.
Duty reduction for LDVs using clean energy e.g. electric vehicles.
Fuel economy standards Establishment of standards currently not under discussion. No fuel economy standards in place.
Fuel taxation - Gasoline: 15%Special gasoline: 20%Diesel: 5%
Pollutant emissions standards Euro 2 (LDVs) and Euro 4 since 2016.Expected to adopt Euro 4 standards for gasoline vehicles in 2017, diesel vehicles will follow.EURO III for 2-wheelers already in place.
Fuel quality is monitored by Ministry of Science and Tech- nology. Ministry of Natural Resources and Environment has recently approved the National Environmental Standards which mentions vehicle pollutant emission standards. Biofuel production has been initiated by the private sector, however,the government has set up policies to promote biofuel produc-tions and use, such as tax exemption, no import duty on pro- duction machinery etc. The government aims to reach a 10%.share of total transport energy consumption with biofuels
Fuel quality standard 2000 ppm sulphur diesel. -
Import of used vehicles - Stopped import of second-hand LDVs in 2012.

61
Malaysia Myanmar
Fuel economy baseline Baseline calculations available in GFEI WP15 (GFEI 2017). No baseline calculations available yet, but ongoing support through GFEI for establishing baseline.
Fuel economy labelling and public information programmes
Ongoing preparation to introduce fuel economy (FE) label, which requires validation of OEM information. UNECE-drive cycles are not considered suitable for Malaysian conditions. The idea is to ¿UVW�GHYHORS�QDWLRQDO�GULYH�F\FOHV��DQG�WKHQ�GHYHORS�DQ�HQHUJ\�HI¿FLHQF\�UDWLQJ�ODEHOOLQJ�VFKHPH�
No labelling scheme in place. The transport sector KDV�EHHQ�LQFOXGHG�LQ�WKH�HQHUJ\�HI¿FLHQF\�DFWLRQ�plan, which was launched early 2016 and is pending parliamentary approval. Available at: http://www.burmalibrary.org/docs22/2015-12-Myanmar_Energy_Master_Plan-spdf-red.pdf
Fuel economy related tax instruments
&XVWRPLVHG�LQFHQWLYHV�IRU�ORFDO�2(0V�WR�SURGXFH�HQHUJ\�HI¿FLHQW�YHKLFOHV�DV�GH¿QHG�LQ�WKH�1DWLRQDO�$XWRPRWLYH�3ROLF\�������which aims to develop Malaysia as the regional hub for energy-HI¿FLHQW�YHKLFOHV��((9V���((9V�DUH�GH¿QHG�E\�FRQVXPSWLRQ�OLPLWV�differentiated by kerb weight.$OO�PDQXIDFWXUHUV�QRZ�SURGXFH�((9V��WKXV�EHQH¿WWLQJ�IURP�ORZHU�duties. In 2015, 32.6% of the sold cars were EEVs. The target number of EEV sales is 1 million units by 2020.
A fee has to be paid for imported vehicles, which is waived for electric vehicles. The amount depends on the engine capacity. The fees for imported buses are lower than for private cars.
Fuel economy standards The National Automotive Policy 2014 report suggests fuel consumption standards as the basis to incentivise OEMs to produce EEVs.7KH�VSHFL¿FDWLRQ�IRU�IXHO�FRQVXPSWLRQ��/����NP��LV�EDVHG�RQ�international benchmarking. The unit gCO2/km is to be used once EURO IV is introduced nationwide. It should focus on LDVs, including passenger cars, light commercial vehicles and 2-wheelers.
-
Fuel taxation - -
Pollutant emissions standards - .Euro II standards are under discussion
Fuel quality standard In 2015, Euro V-compatible diesel has been introduced acrossMalaysia. Euro II-compatible diesel production remains permit-
ted. RON97/Euro 4-compatible gasoline is available nationwide. 521���JDVROLQH�LV�VWLOO�(XUR���FRPSDWLEOH��EXW�UH¿QHU\�XSJUDGHV.are ongoing
.Euro II-compatible fuel standards are under discussion
Import of used vehicles - Myanmar allows second-hand vehicles of no more than four years older than the current calendar year to be imported to the country, and only left-hand drive.

The Philippines Singapore
Fuel economy baseline Baseline calculations completed in 2013 for LDVs. Baseline calculations also available in GFEI WP15 (GFEI 2017).
176g/km before Carbon Emission-based Vehicle Scheme (CEVS) in 2012, 168g/km after CEVS (2013). The scheme covers passenger cars and taxis.
Fuel economy labelling and public information programmes
Roll-out of labelling scheme for passenger FDUV�LQ������DV�SDUW�RI�WKH�(QHUJ\�(I¿FLHQF\�Roadmap. Re-launch of fuel economy run initiative in 2016. Driver training programmes exist in the private sector.
Mandatory fuel economy labelling for passenger cars and light commercial vehicles ZDV�¿UVW�LPSOHPHQWHG�LQ�������7KHUH�LV�D�IXHO�FRVW�FDOFXODWRU�DYDLODEOH�DW�KWWSV���YUO�lta.gov.sg/lta/vrl/action/pubfunc?ID=FuelCostCalculator
Fuel economy related tax instruments The development of tax incentives is foreseen LQ�WKH�(QHUJ\�(I¿FLHQF\�5RDGPDS�
The CEVS was a feebate scheme to incentivise consumers to purchase cars ZLWK�ORZHU�FDUERQ�HPLVVLRQV��7KH�&(96�ZDV�¿UVW�LQWURGXFHG�LQ�-DQXDU\������and revised once in July 2015. The revision tightened the carbon emission bands to account for technology improvement. The CEVS was replaced in January �����ZLWK�D�QHZ�9HKLFXODU�(PLVVLRQV�6FKHPH��9(6���ZKLFK�DFFRXQWV�IRU�¿YH�major pollutants, including hydrocarbon, carbon monoxide, nitrogen oxides and particulate matter emissions, along with carbon dioxide (representing fuel FRQVXPSWLRQ��EHLQJ�MXVW�RQH�RI�WKH�¿YH��,Q�DGGLWLRQ�WR�EHLQJ�D�IHHEDWH�VFKHPH��it also includes an on-vehicle label describing these emissions and rebates or surcharges, and also provides this data to the public in an online database.
Fuel economy standards The development of a fuel-economy standard ZDV�SURSRVHG�LQ�WKH�'2(�(QHUJ\�(I¿FLHQF\�roadmap in 2015. Development of national technical regulation (MEPS) for automobile fuel consumption is tentatively planned for 2018. Covers LDVs only.
No fuel economy standards in place.
Fuel taxation - Gasoline: 15%Special gasoline: 20%Diesel: 5%
Pollutant emissions standards So far, Euro 2 is required for new LDVs. Euro IV was supposed to be introduced by 2016 depending on the fuel availability. Euro III is the.current standard in place for 2-wheelers
The CEVS was replaced in January 2018 with a new Vehicular Emissions Scheme �9(6���ZKLFK�DFFRXQWV�IRU�¿YH�PDMRU�SROOXWDQWV��ZLWK�FDUERQ�GLR[LGH�EHLQJ�MXVW�RQH.of them
Fuel quality standard The current sulphur limit for diesel is 500ppm. Euro II- and Euro IV-compatible fuels are supplied to the market. Since January 2017, Euro 4-compatible fuel standards will be in place for RON97 gasoline, from 2018 onwards Euro 4-compatible fuel will be the standard for.RON95 gasoline
Euro V-compatible standards for fuel quality, from September 2017 onwards Euro 6-compatible standards for petrol and from January 2018 Euro VI-compatible fuel standards for diesel too. The fuel quality standards are regulated by the national environment agency, and revised regularly (e.g. the sulphur content in diesel is measured regularly).
Import of used vehicles - -

63
Thailand Viet NamFuel economy baseline Fuel economy baselines for the years 2012 to 2015 in 2017
GIZ. Baseline calculations also available in GFEI WP15 (GFEI 2017).
No baseline calculations.
Fuel economy labelling and public information programmes
Fuel-economy and CO2 label mandatory for LDVs since January 2016 (Eco-Sticker).www.car.go.th website showing info on every car that has Eco-Sticker.
Voluntary from 1 January 2014 and mandatory from 1 January 2015. Only applied to private cars with 7 or fewer seats. From 1 January 2018 applicable to private cars with 9 or fewer seats. Online information for consumers available at:http://www.vr.org.vn/vaq/Tieuthu_Nlieu/List_Tieuthu_nlieu.asp
Fuel economy related tax instruments
Excise tax based on CO2 emissions since 2016. The Eco-Car programme phase II provides tax incentives to the car manufacturers such as cooperate income tax (CIT) exemptions for 6 years, reduction of import duty on imported parts, exemption of import duty on machinery. To qualify for the programme, fuel economy must be 23km/litre or more.
Only applied for private cars and LDVs with engine displacement less than 2.0 litres. Only applied for private cars with 9 seats or fewer.
Fuel economy standards Voluntary MEPS & HEPS (km/l) for diesel and gasoline vehicles have been drafted in 2013 by DEDE (Ministry of Energy) together with Thailand Automotive Institute, but remain under discussion (the measures were postponed to secure an additional review by domestic industry)Voluntary MEPS for motorcycles regulated by TISI. But no one adopted so farCovers light-duty vehicles and 2-wheelers.
A study on fuel consumption standards for LDVs and motorbikes was completed in 2013. The non-mandatory standard on limit of fuel consumption for passenger cars and 2-wheeled motorcycles and mopeds has been issued by the Ministry of Science and Technology in the form of fuel consumption limits (L/100km). TCVN 9854 2013: Limits on fuel consumption for new passenger cars. TCVN 7356: 2014: Limits on fuel consumption for new motorcycles.
Fuel taxation - -
Pollutant emissions standards LDVs need to comply with Euro IV standard since 2012. TheEco Car phase II programme raised the benchmark for clas-
VL¿FDWLRQ�WR�(XUR�9�HPLVVLRQ�VWDQGDUG��$SSOLFDWLRQ�RI�(XUR�9,.standard is considered by 2020
Type approval procedures require new vehicles to meet certain emission standards. All manufacturers and importers of new vehicles need to provide the necessary documents with pollutant emissions (included CO2) and fuel consumption of the vehicle type to Viet 1DP�5HJLVWHU�EHIRUH�W\SH�DSSURYDO�FHUWL¿FDWH�LV�LVVXHG��(XUR�,9�IRU�manufactured, assembled and imported passenger cars mandatory from 1 January 2017. Euro III for manufactured, assembled and imported motorcycles mandatory from 1 January 2017.
Fuel quality standard .50ppm sulphur diesel is available Gasoline: Sulphur Euro 2-compatible max 500mg/kg; Euro 4-compatible max 50 mg/kg; diesel: Sulphur Euro II-compatible max 500mg/kg; Euro IV-compatible max 50 mg/kg.Euro II and Euro IV fuel will be supplied in the market by 2017.
Import of used vehicles Besides an exception for importing one second-hand vehicle per person on a personal basis (already owned by the person), Thailand does not allow the import of second-hand vehicles.
Used cars can only be imported if they are not older than 5 years.
The Philippines Singapore
Fuel economy baseline Baseline calculations completed in 2013 for LDVs. Baseline calculations also available in GFEI WP15 (GFEI 2017).
176g/km before Carbon Emission-based Vehicle Scheme (CEVS) in 2012, 168g/km after CEVS (2013). The scheme covers passenger cars and taxis.
Fuel economy labelling and public information programmes
Roll-out of labelling scheme for passenger FDUV�LQ������DV�SDUW�RI�WKH�(QHUJ\�(I¿FLHQF\�Roadmap. Re-launch of fuel economy run initiative in 2016. Driver training programmes exist in the private sector.
Mandatory fuel economy labelling for passenger cars and light commercial vehicles ZDV�¿UVW�LPSOHPHQWHG�LQ�������7KHUH�LV�D�IXHO�FRVW�FDOFXODWRU�DYDLODEOH�DW�KWWSV���YUO�lta.gov.sg/lta/vrl/action/pubfunc?ID=FuelCostCalculator
Fuel economy related tax instruments The development of tax incentives is foreseen LQ�WKH�(QHUJ\�(I¿FLHQF\�5RDGPDS�
The CEVS was a feebate scheme to incentivise consumers to purchase cars ZLWK�ORZHU�FDUERQ�HPLVVLRQV��7KH�&(96�ZDV�¿UVW�LQWURGXFHG�LQ�-DQXDU\������and revised once in July 2015. The revision tightened the carbon emission bands to account for technology improvement. The CEVS was replaced in January �����ZLWK�D�QHZ�9HKLFXODU�(PLVVLRQV�6FKHPH��9(6���ZKLFK�DFFRXQWV�IRU�¿YH�major pollutants, including hydrocarbon, carbon monoxide, nitrogen oxides and particulate matter emissions, along with carbon dioxide (representing fuel FRQVXPSWLRQ��EHLQJ�MXVW�RQH�RI�WKH�¿YH��,Q�DGGLWLRQ�WR�EHLQJ�D�IHHEDWH�VFKHPH��it also includes an on-vehicle label describing these emissions and rebates or surcharges, and also provides this data to the public in an online database.
Fuel economy standards The development of a fuel-economy standard ZDV�SURSRVHG�LQ�WKH�'2(�(QHUJ\�(I¿FLHQF\�roadmap in 2015. Development of national technical regulation (MEPS) for automobile fuel consumption is tentatively planned for 2018. Covers LDVs only.
No fuel economy standards in place.
Fuel taxation - Gasoline: 15%Special gasoline: 20%Diesel: 5%
Pollutant emissions standards So far, Euro 2 is required for new LDVs. Euro IV was supposed to be introduced by 2016 depending on the fuel availability. Euro III is the.current standard in place for 2-wheelers
The CEVS was replaced in January 2018 with a new Vehicular Emissions Scheme �9(6���ZKLFK�DFFRXQWV�IRU�¿YH�PDMRU�SROOXWDQWV��ZLWK�FDUERQ�GLR[LGH�EHLQJ�MXVW�RQH.of them
Fuel quality standard The current sulphur limit for diesel is 500ppm. Euro II- and Euro IV-compatible fuels are supplied to the market. Since January 2017, Euro 4-compatible fuel standards will be in place for RON97 gasoline, from 2018 onwards Euro 4-compatible fuel will be the standard for.RON95 gasoline
Euro V-compatible standards for fuel quality, from September 2017 onwards Euro 6-compatible standards for petrol and from January 2018 Euro VI-compatible fuel standards for diesel too. The fuel quality standards are regulated by the national environment agency, and revised regularly (e.g. the sulphur content in diesel is measured regularly).
Import of used vehicles - -

64
5.4 Gaps and barriers to fuel-economy policy in ASEAN and AMS5.4.1 The lack of knowledge and data for developing fuel economy baselinesThe development of fuel economy baselines is essential. First, they create an understanding of the status quo of new vehicle fuel economy in a country. Second, they serve as a starting point for the development of fuel consumption targets. Last but not least, they are needed to monitor the progress of average new LDV fuel consumption over time.
Section 2.4 already discussed available fuel consumption baselines for Indonesia, Malaysia, the Philippines, Singapore and Thailand. However, fuel consumption baseline data are not yet available for Brunei Darussalam, Cambodia, Lao PDR, Myanmar and Viet Nam. However, Myanmar and Viet Nam are working on their baselines with support from GFEI and GIZ, respectively.
Although these countries account for less than 5% of the ASEAN LDV market (Figure 22) and do not impact the aggregated results of the region dramatically, it is important to determine the sales-weighted average new LDV fuel consumption within these markets as soon as possible. Establishing the fuel consumption baselines can also serve to build capacity among the relevant government agencies and is thus a substantial step towards the development and implementation of fuel economy policies.
Figure 22: Fuel economy baseline coverage of the ASEAN LDV market 2015Source: OICA 2016
5.4.2 The role of second-hand imported vehicles
The import of used vehicles can pose challenges to the introduction of fuel economy policies. )RU�YHKLFOHV�PDQXIDFWXUHG�SULRU�WR�������LW�FDQ�EH�YHU\�FKDOOHQJLQJ�WR�¿QG�IXHO�FRQVXPSWLRQ�data, since vehicle labelling programmes became mandatory only about that time in Japan. ,Q�RWKHU�FRXQWULHV�H[SRUWLQJ�VLJQL¿FDQW�QXPEHUV�RI�XVHG�YHKLFOHV�WR�$6($1��VXFK�DV�WKH�United Kingdom, fuel economy labelling did not become mandatory until 2005.
����������""�!)�
���������!!�$)�
������������ ��&)�
��������!%�#)�
���������!� )�
���������$)��������!)�
��������#�!)�
�����������")�
��� ��������")�
������#�&)�
� ������� � ����������� ������������������������

65
An overview on import regulations for used vehicles in the AMS is provided in Table 9.
Table 11: Import regulation for used vehicles in the ASEAN region
Import of used
vehicles Age restriction Emission standard
Cambodia Yes - -
Brunei Darussalam Yes
Private: 3 \HDUV�IURP�¿UVW�
registration
Commercial: 5 \HDUV�IRUP�¿UVW�
registration
-
Indonesia No - -Lao PDR Yes - -Malaysia Yes 5 years -Myanmar Yes 4 years -The Philippines No - -
Singapore Yes 3 years needs to comply with domestic standards
Thailand No - -Viet Nam Yes 5 years -
Source: UN Environment TBP
Used imported vehicles should comply with the air pollution regulation for newly registered FDUV��7KDW�ZD\��WKH�LPSRUWDWLRQ�RI�YHU\�ROG�FDUV�FDQ�EH�SUHYHQWHG�ZKLOH�ÀH[LELOLW\�LV�UHWDLQHG�to import vehicles that may be slightly older than those with current limits but have the same technical standards as new vehicles in the region.
,Q�DQ\�FDVH��LW�VKRXOG�EH�WKH�GXW\�RI�LPSRUWHUV�RI�XVHG�FDUV�WR�SURYLGH�FHUWL¿HG�YHKLFOH�IXHO�consumption or CO2-emission data based on the test cycle of the country of origin of the vehicle. Fuel consumption values based on other cycles (e.g. Japanese JC08 or US CAFE) can then be transformed into NEDC equivalents using conversion formulas published by ICCT (ICCT 2014).
To better understand the importance of used imported vehicles it is therefore necessary to investigate the share of used imported cars as a proportion of all newly registered vehicles.
5.4.3 Administrative barriers for fuel economy policy developmentDuring various fuel economy workshops carried out by GIZ, it turned out that fuel economy policy making is often a subject without a permanent institutional home base. In many cases, the issue of fuel economy policy falls under the responsibility of numerous government agencies, which are often organised under different ministries. A stakeholder diagram to illustrate the roles and responsibilities of government agencies related to vehicle fuel HI¿FLHQF\�LQ�7KDLODQG�LV�VKRZQ�LQ�)LJXUH����

66
Eleven different agencies are involved with the development of various fuel economy policies, which in this case are categorised as consumer information-related, regulatory or ¿VFDO��,Q�DGGLWLRQ��QRQH�RI�WKH�JRYHUQPHQW�DJHQFLHV�ZLWK�D�PDQGDWH�WR�SURSRVH�OHJLVODWLRQ�is situated at a cross-section of all policy areas.
Figure ����6WDNHKROGHU�GLDJUDP�WR�LGHQWLI\�UROHV�DQG�UHVSRQVLELOLWLHV�RI�YHKLFOH�IXHO�HI¿FLHQF\�UHODWHG�JRYHUQPHQW�agencies in ThailandSource GIZ 2017
It is thus important to appoint a lead agency to coordinate the development and implementation of fuel economy policies. Each of the other relevant institutions should also appoint a key contact person to deal with the topic.
In addition, some of the proposed fuel-economy policy measures require more administrative infrastructure than others. The introduction of fuel-economy standards based on corporate DYHUDJH� VDOHV�ZHLJKWHG� IXHO� FRQVXPSWLRQ� QHHGV� VLJQL¿FDQW� DGPLQLVWUDWLYH� FDSDFLW\��First of all, it requires a close collaboration between the government agency and the vehicle manufacturers and/or importers. Since fuel consumption targets are set for each manufacturer individually and are based on historical market portfolios (see Section 4.4), the target setting as well as monitoring and compliance checking process require WKH� SURWRFROHG� H[FKDQJH� DQG� YHUL¿FDWLRQ� SURFHVV� RI� GHWDLOHG� YHKLFOH� VDOHV� GDWD�� 6LQFH�enforcement action needs to be taken against cases of non-compliance, it also requires the set-up of the legislative framework as well as an agency to administrate such issues, i.e. to LVVXH�¿QHV��7KH�GHYHORSPHQW�RI�PDQXIDFWXUHU�VSHFL¿F�IXHO�FRQVXPSWLRQ�WDUJHWV�ZLOO�PRVW�OLNHO\�EH�D�OHQJWK\�QHJRWLDWLRQ�SURFHVV�WR�¿QG�FRQVHQVXV�DPRQJ�DOO�VWDNHKROGHUV�
$V�D�¿UVW�VWHS��WKH�GHYHORSPHQW�RI�VWDNHKROGHU�PDSV�VLPLODU�WR�WKH�RQH�VKRZQ�IRU�7KDLODQG�(Figure 24) are helpful for orientation.
5.4.4 Behavioural challenges
:KHQ�D�FRQVXPHU�EX\V�D�QHZ�FDU�� IXHO�HI¿FLHQF\�LV� MXVW�RQH�FKDUDFWHULVWLF�DPRQJ�PDQ\�that are considered in making a decision, and is often not the most important purchase criteria. In addition, many new car buyers have issues with anticipating longer-term savings. As summarised in a publication on feebate schemes by ICCT, “customers are loss averse DQG�WKH�PRUH�XQFHUWDLQ�WKH�EHQH¿WV�RI�D�SXUFKDVH�GHFLVLRQ��WKH�PRUH�FXVWRPHUV�ZLOO�UHMHFW�the purchase” (ICCT 2010). Future petroleum prices are highly uncertain, and so are future VDYLQJV�GXH�WR�WKH�SXUFKDVH�RI�PRUH�IXHO�HI¿FLHQW�YHKLFOHV��3URYLGLQJ�DQ�XS�IURQW�¿QDQFLDO�LQFHQWLYH� WR�EX\�DQ�HI¿FLHQW�YHKLFOH�VHHPV�WR�DGGUHVV� WKDW�VSHFL¿F�FRQVXPHU�EHKDYLRXU��Financial incentives in combination with a fuel economy label that clearly presents future fuel cost savings or savings on additional expenditures compared to the average car can HIIHFWLYHO\�FRQYLQFH�FRQVXPHUV�WR�EX\�D�PRUH�IXHO�HI¿FLHQW�YHKLFOH�

67
Apart from the above, behavioural changes are needed with respect to car size and utility. Over the past 10 years, large and medium-sized SUVs and pick-ups, especially the latter, have gained market share around the world. This trend is particularly pronounced in non-OECD countries (Figure 24) and needs to be reversed for ambitious fuel consumption targets to be achieved.
Source: GFEI 2017Figure 24: Vehicle size evolution across the world 2005-15
5.5 Policy and technical toolbox for comprehensive fuel economy policy5.5.1 International experience: strategies for fuel economy improvementBetween 2012 and 2015, the Netherlands, Cyprus and Bulgaria achieved the highest annual improvement rates of between 4% and 5% (Figure 25). Three of the four biggest European economies (France, Germany and Italy) achieved improvement rates of around 3%, and the entire EU27 reached 2.9% annual fuel economy improvement.
4.0
4.5
5.0
5.5
6.0
6.5
7.0
2012 2013 2014 2015
Lge
/100
km (b
ased
on
NED
C)
Average new LDV fuel economy
Netherlands Cyprus Bulgaria France Germany Italy United Kingdom EU 27
0.0%
1.0%
2.0%
3.0%
4.0%
5.0%
Annual improvement rate 2012 to 2015
Figure 25: Historical fuel economy improvement and annual fuel economy improvement rate for selected EU countries and the EU27Source: own calculations based on European Environment Agency (EEA) Data
It needs to be noted that these high improvement rates have been achieved despite the already good baseline fuel economy for passenger cars of 5.6 LGe/100km back in 2012 (compared to 7.2 LGe/100km in the ASEAN in 2015 for passenger cars and light trucks).

68
The countries with highest annual improvement rates are characterised either by a relatively high baseline fuel consumption (e.g. Bulgaria, Cyprus) or by very progressive fuel economy policies (e.g. the Netherlands).
Nonetheless, impressive fuel economy improvement can be achieved with the implementation RI�¿VFDO�IXHO�HFRQRP\�SROLF\�PHDVXUHV��VHH�FDVH�VWXG\�RQ�7XUNH\��6HFWLRQ���������%HWZHHQ�2005 and 2015, average fuel consumption of new LDVs improved by 3.9% per year, while at the same time, the size of cars of all segments slightly increased (GFEI 2017).
A clear relationship can be observed between the strong fuel economy policies and the level of sophistication of vehicle engine technology. The ratio of fuel consumption per unit power (LGe/100km per kW) can be used as an indicator of modernity of engine technology. New LDVs in almost all OECD countries achieve low per-kW fuel consumption at relatively high power ratings, while the opposite is true for many non-OECD markets. Among the presented countries, average new LDVs in Indonesia have the highest per-kW fuel consumption while average power rating is the second-lowest after India. This is a clear indication of the use of outdated technology – naturally aspirated engines with lower compression ratios.
Figure 26��6SHFL¿F�IXHO�FRQVXPSWLRQ�SHU�HQJLQH�SRZHU�DV�D�IXQFWLRQ�RI�HQJLQH�SRZHU�IRU�YDULRXV�/'9�PDUNHWVSource: GFEI 2017
5.5.2 Strategies for consumer awareness of fuel consumptionOn-vehicle labels and other technologies that clearly describe fuel economy and other fuel and environmental information to consumers are highly effective for allowing consumers to make decisions about which vehicle to purchase. In addition, labels are a key means for governments to centralise data with regards to fuel consumption of vehicles.
Although some ASEAN countries have already developed fuel economy labels (see Section 2.5), often important information is missing. Figure 27 shows the labels of Singapore, Thailand and Viet Nam. They all show fuel consumption in L/100km, but only Singapore’s label enables the consumer to understand whether the stated fuel economy is good or bad.

69
Singapore
Vietnam Thailand
Figure 27: Fuel economy labels of Singapore, Thailand and Viet Nam
In contrast, US fuel economy labels contain a complete set of information, as shown in Figure 28.
The data provided not only informs about fuel consumption and emissions but offers additional VSHFL¿FDWLRQV�VXFK�DV�DQQXDO�IXHO�FRVWV�RU�D�¿YH�\HDU�IXHO�FRVW�GLIIHUHQWLDO�FRPSDUHG�WR�WKH�average car. This information is very helpful to consumers as it allows them to directly compare short-term and long-term costs and savings of different cars under consideration.
Figure 28: The fuel economy label of the United StatesSource: Fueleconomy.gov 2017
Viet Nam
1 Power train and fuel2.+5. Fuel economy and fuel consumption3. Vehicle class and fuel consumption range4. Saved/additional fuel costs compared to the
average car6. Annual fuel costs7. Fuel consumption and greenhouse gas rating8. CO2 emissions9. Air pollutants rating10. Assumptions for fuel cost calculation11. Code to read with smart phone12. Link to government website and fuel cost
calculator

70
In addition to fuel economy labels, other consumer awareness tools are available, such as websites, fuel consumption trackers and fuel economy runs. Fuel economy websites are often provided by governments and provide information on fuel economy of all vehicles approved for sale in their jurisdictions. The US EPA website, www.fueleconomy.gov, provides comprehensive information on tested fuel economy of vehicles available in the US, as well as information on strategies for saving fuel, self-monitoring of fuel consumption, and information about advanced vehicles and technologies. The website of China’s Ministry of Industry and Information Technology (MIIT) on fuel consumption (www.chinaafc.miit.gov.cn) also provides a comprehensive list of the fuel economy ratings of vehicles approved for use in China. Yet these websites need not be operated by governments. Websites such as www.spritmonitor.de and Little Bear Fuel Consumption (www.xiaoxiongyouhao.com in Chinese) offer publicly collected data on thousands of vehicle models provided by users in real-world conditions.
Meanwhile, a number of products exist that can connect to a vehicle’s on-board diagnostics (OBD) computer to report fuel consumption in real time, and record it either for real-time display, or to display over time depending on different driving conditions and speeds, or to help diagnose problems with cars.
Finally, governments and car clubs can undertake fuel economy runs, bringing cars out to track or highway conditions to demonstrate real-world fuel economy and to raise awareness DERXW�YHKLFOH�HI¿FLHQF\��HFR�GULYLQJ�DQG�HI¿FLHQW�WHFKQRORJLHV�RI�YHKLFOHV��)XHO�HFRQRP\�runs have been undertaken in a number of AMS to bring awareness to this issue.
5.5.3 Feebate design and implementationFeebates can take the form of vehicle registration tax schemes, where the purchase of LQHI¿FLHQW�YHKLFOHV� LV�GLVFRXUDJHG� WKURXJK�KLJK� UHJLVWUDWLRQ� WD[HV��ZKLOH� WKH�SXUFKDVH�RI�PRUH�HI¿FLHQW� YHKLFOHV� LV� LQFHQWLYLVHG� WKURXJK� WKH� SD\PHQW� RI� UHEDWHV� WR� WKH� FRQVXPHU��Feebates need to be based on either vehicle fuel consumption or CO2 emission as the main indicator and can be set up to generate government revenues to be cost-neutral or to result in net costs.
The latter is illustrated in with decreasing fuel consumption. Whether a feebate scheme is revenue-generating, cost-neutral or cost-incurring depends on the pivot point. The strength RI�WKH�¿VFDO�LQFHQWLYH�WR�SXUFKDVH�HI¿FLHQW�YHKLFOHV�GHSHQGV�RQ�WKH�VORSH�RI�WKH�IXQFWLRQ��

71
Fe
eR
eb
ate
Mo
ne
ta
ry
un
it
Fuel consumption (in Lge/100km)
Variant 1: Shift pivot point
Variant 2: Change slope
Pivot point
Figure ��: Schematic illustration of a fuel consumption -based feebate scheme
If the pivot point is set lower than the current fuel consumption baseline (to the left of the historical sales-weighted average new LDV fuel consumption), the system will be revenue-generating, as the larger part of the new vehicle purchases will be located within the blue area along the feebate function. The inverse is true in the case where the pivot point is shifted to the right (Variant 1), above the current sales-weighted average fuel consumption. In this case more vehicles will be eligible for a rebate.
The slope of the feebate function is equally important. A steeper slope increases the incentive WR�EX\�PRUH�HI¿FLHQW�FDUV��9DULDQW����DQG�FDQ�UHVXOW�LQ�D�PRUH�UDSLG�UHVSRQVH�RI�FRQVXPHUV�VKLIWLQJ� WR�EX\� LQFUHDVLQJO\�HI¿FLHQW�FDUV�� WKXV�UHGXFLQJ� WKH�UHYHQXHV�DQG� LQFUHDVLQJ� WKH�costs to the government.
$�WKLUG�RSWLRQ�WR�HQVXUH�WKDW�WKH�V\VWHP�LV�UHYHQXH�JHQHUDWLQJ�LV�WR�FRPELQH�D�ÀDWWHU�VORSH�of the rebate function to the left of the pivot point with a steeper fee function to the right. 7KDW�ZD\��HYHQ�D�VLJQL¿FDQW�VKLIW�RI�WKH�SXUFKDVH�EHKDYLRXU�ZLOO�OHDG�WR�ORZHU�ORVVHV�WKDQ�LQ�a system without changing slopes.
In any case, feebate schemes need to be adjusted to the market development on a periodic EDVLV� WR� DFFRXQW� IRU� WKH� IDFW� WKDW� YHKLFOHV� DUH� EHFRPLQJ� PRUH� HI¿FLHQW� DQG� WR� SUHYHQW�making the system a victim of its own success. Most systems today are based on bi-annual DGMXVWPHQWV�� ,Q�D�ZHOO�GHVLJQHG�V\VWHP�� LW�ZRXOG�EH�VXI¿FLHQW� WR�JUDGXDOO\�VKLIW� WKH�SLYRW�point to the left over time.
A freely available feebate design tool can be downloaded from the ICCT website17. This ([FHO�EDVHG�VLPXODWLRQ�PRGHO�KHOSV�WR�GHVLJQ�D�FRXQWU\�VSHFL¿F�IHHEDWH�VFKHPH�EDVHG�RQ�historical LDV sales. Key parameters such as the pivot point as well as the slope and the form of the feebate function can be estimated based on input data such as recommended future government revenues. It also provides estimates regarding the effect of the feebate scheme on future sales-weighted average new LDV fuel consumption and CO2 emissions.
17 The tool can be downloaded from: http://www.theicct.org/feebate-simulation-tool

72
Since feebates are based on a continuous function that directly adds a price tag to fuel HI¿FLHQF\�LPSURYHPHQW��WKH\�SURPRWH�IXHO�FRQVXPSWLRQ�LPSURYHPHQW�EH\RQG�DQ\�GHWHUPLQHG�IXHO� FRQVXPSWLRQ� WDUJHW�� DQG� WKXV�GR�QRW� KDYH� WKH�SUREOHP�RI� GH¿QLQJ� UHDVRQDEOH� OHDG�times.
&RPSDUHG� WR� IXHO� HFRQRP\� VWDQGDUGV�� IHHEDWH� VFKHPHV� UHTXLUH� VLJQL¿FDQWO\� OHVV�administrative infrastructure. Most ASEAN countries already have a vehicle registration tax in place. These structures can be used to turn a registration tax based on price or engine displacement into a feebate scheme based on fuel consumption or CO2 emissions.
In addition, the need for data to characterise the LDV market is much less comprehensive than in the case of a corporate average fuel consumption standard. While a feebate scheme requires the existence of the fuel consumption baseline data as well as additional data such LDV market share by segment and price, (and potentially by power, weight and vehicle footprint), a standard requires the close interaction between the responsible government DJHQF\�DQG�WKH�UHVSHFWLYH�PDQXIDFWXUHUV�DQG�YHKLFOH�LPSRUWHUV�WR�VHW�PDQXIDFWXUHU�VSHFL¿F�WDUJHWV��FKHFN�IRU�FRPSOLDQFH��DQG�SRWHQWLDOO\�LVVXH�¿QHV�
Some argue that the principal aim of feebate schemes is to incentivise manufacturers to EULQJ�HI¿FLHQW�YHKLFOHV�WR�PDUNHW��UDWKHU�WKDQ�HQFRXUDJLQJ�WKH�FRQVXPHU�WR�EX\�WKHP��,&&7�2010). While this is true for larger vehicle markets with own manufacturing capacities, this is less the case in the AMSs. In the ASEAN region, a regional fuel-economy standard could be the means to convince manufacturers and importers to improve their offer. Complementarily, feebates would directly address the consumers. Collecting fees and offering rebates directly to the consumer seems to be the only way to quickly implement feebate schemes in the region, mainly building on the existing vehicle registration tax structures and using the administrative infrastructure.
The collection of the feebate needs to be under the responsibility of a ministry that has already been involved in vehicle taxation (e.g. in Thailand that would be the Department of Land Transport). The executive arm to enforce the collection of the feebates should EH�WKH�VDPH�RI¿FH�WKDW�LV�DOUHDG\�LQ�FKDUJH�RI�YHKLFOH�UHJLVWUDWLRQ��&RQVXPHUV�VKRXOG�EH�UHVSRQVLEOH� IRU� WKH�SURYLVLRQ�RI� FHUWL¿HG� IXHO� FRQVXPSWLRQ� LQIRUPDWLRQ�� LQ�DGGLWLRQ� WR� WKH�LQIRUPDWLRQ�WKDW�LV�DOUHDG\�UHTXLUHG�WR�UHJLVWHU�D�QHZ�FDU��VXFK�DV�ELOO�RI�ODGLQJ��FHUWL¿FDWH�RI�SD\PHQW��FHUWL¿FDWH�RI�FRQIRUPLW\��FOHDUDQFH�SDSHUV�IURP�WKH�QDWLRQDO�SROLFH��DSSURYHG�PRWRU� YHKLFOH� LQVSHFWLRQ� UHSRUW�� DQG� LQVXUDQFH� FHUWL¿FDWHV�� DV� UHTXLUHG� GHSHQGLQJ� RQ�national legislation).
The introduction of a mandatory fuel economy label for cars is highly conducive to the success of these policies, as it allows consumers to completely understand the rationale and decision-making basis for fees or rebates related to the feebate programme. Countries which allow for the import of used vehicles need to put the importers in charge of providing RI¿FLDO� IXHO�FRQVXPSWLRQ� RU� &22�HPLVVLRQ� GDWD� LQ� WKH� FRXQWU\� RI� RULJLQ¶V� FHUWL¿FDWH� RI�conformity.
Case studies
The most prominent feebate scheme, the consumer-oriented French bonus-malus system, was introduced in 2008. Since then, it has been revised almost every year. It is essentially a one-off vehicle registration tax, which can be positive, zero or negative, depending on the

73
car’s CO2 emissions. Its feebate function for the years 2016 and 2017 are shown in Figure 31. In the early days of the scheme, consumers were more enthusiastic than expected, UHVXOWLQJ� LQ� VLJQL¿FDQW� XQEXGJHWHG� FRVWV� WR� WKH� JRYHUQPHQW��:KLOH� SULRU� WR� WKH� IHHEDWH��average new vehicle CO2 emissions were reduced by 1 gCO2/km on average per year, annual reductions amounted to 9 gCO2/km and 7 gCO2/km for the years 2008 and 2009 (ADEME 2011).
In the ASEAN region, Singapore is the only country with a feebate scheme in place. In the IRUPHU�&(96�IHHEDWH�SURJUDPPH��IHHV�DQG�UHEDWHV�ZHUH�VLJQL¿FDQWO\�KLJKHU�FRPSDUHG�WR�the French system, especially at its extreme ends. Vehicles with emissions below 95 gCO2/km (~4.1 LGe/100km) were eligible for rebates of more than USD 20,000 (Figure 30). On the other side, vehicles emitting more than 230 gCO2/km (~9.9 LGe/100km) were charged more than USD 20,000. The programme was replaced in 2018 with a multi-pollutant feebate scheme called the Vehicular Emission Scheme. In the new VES, vehicles that ambitiously reduce all emissions will receive greater rebates, and those that produce more of all emissions will see higher fees, up to USD 20,000.18
y = 160x - 25,580
y = 54x - 6,163
y = 74x - 7,346
-30,000
-20,000
-10,000
-
10,000
20,000
30,000
0 50 100 150 200 250 300 350
US
D
gCO2/km
Singapore 2015 France 2016 France 2017
Linear (Singapore 2015) Linear (France 2016) Linear (France 2017)
Figure ��: Feebate schemes of France 2016 and 2017 and Singapore 2015. The Singaporean CEVS was replaced by a multi-pollutant Vehicular Emissions Scheme in 2018.Source: Caradisiac 2017, LTA 2017
Both the French and the Singapore schemes contain step functions. While these functions make the schemes easier to understand for consumers, the steps can create undesired side effects. They create some incentive to the manufacturers to game the rules, in cases where some of their models are only little above a threshold between tax classes. In such cases, fuel consumption can be reduced through measures such as slightly better tyres or changed engine management, resulting in much lower registration taxes in return for only VPDOO�UHDO�ZRUOG�FKDQJHV��7KXV��WKH�HQYLURQPHQWDO�EHQH¿W�LV�PDUJLQDO��DQG�WKH�V\VWHP�IDLOV�its purpose. This is particularly true for a system with large steps, e.g. in Singapore.
18 Land Transport Authority. December 2017. JOINT MEDIA RELEASE BY THE LAND TRANSPORT AUTHORITY (LTA) & NEA - NEW VEHICULAR EMISSIONS LABEL FROM 1 JANUARY 2018. https://www.lta.gov.sg/apps/news/page.aspx?c=2&id=37654ca8-ef14-4c1a-851d-06fc527f839f

74
Similarly, the steps can create market distortions in cases where comparable vehicles of GLIIHUHQW�PDQXIDFWXUHUV�ZLWK�FORVH�IXHO�FRQVXPSWLRQ�DUH�FODVVL¿HG�LQ�GLIIHUHQW�WD[�FOXVWHUV��,Q�WKLV�FDVH�WKH�VRPHZKDW�DUELWUDU\�GH¿QLWLRQ�RI�WKH�IXHO�FRQVXPSWLRQ�WKUHVKROG�FDQ�KDYH�VHYHUH�FRQVHTXHQFHV�IRU�WKH�PDQXIDFWXUHU�ZKRVH�FDU�LV�FODVVL¿HG�LQ�WKH�PRUH�H[SHQVLYH�tax bracket. Therefore, feebate schemes based on linear and continuous functions are highly preferable to schemes based on functions with discrete steps. This issue was partly addressed in the 2016/2017 revision of the French feebate scheme.
A more detailed discussion about the features of various feebate schemes can be found in Best Practices for Feebate Program Design and Implementation (ICCT 2010).
5.5.4 Circulation tax design and implementation
Type of measure <� Vehicle registration tax paid on an annual basis for DOO�YHKLFOHV�LQ�WKH�ÀHHW
Principle <� Based on vehicle fuel consumption (LGe/100 km) or vehicle CO2 emissions (gCO2/km)
<� The value of the tax gradually increases with fuel consumption or CO2 emission according to a contin-uous function
<� Can also include a component based on pollutant emissions (e.g. NOx)
Rationale <� 'HFUHDVLQJ�WD[HV�ZLWK�KLJKHU�YHKLFOH�HI¿FLHQF\�incentivise the consumer to switch towards the pur-FKDVH�RI�IXHO�HI¿FLHQW�FDUV�DQG�RIIVHW�HYHQWXDO�WHFK-nology costs
Key aspects <� The starting point of the tax function can be set in a way that vehicles below a fuel-consumption (or CO2-emission) threshold are exempted from the annual circulation tax
<� $V�YHKLFOHV�EHFRPH�PRUH�HI¿FLHQW�WKH�VFKHPH�needs to be adjusted periodically
Prerequisites <� Fuel-economy or CO2-emission information is re-quired for DOO�YHKLFOHV�LQ�WKH�ÀHHW
<� A fuel economy labelling scheme to inform the con-sumer needs to be in place
Case studies <� Annual vehicle registration tax in various European countries as well as China and Japan (see Table 12).
Impact rating <� High
Complexity rating <� Medium

75
Similar to a registration tax, the primary purpose of circulation tax is to create revenues for the government. When based on fuel consumption (or CO2 emissions), it can be used WR�FRQWURO�WKH�GHYHORSPHQW�RI�WKH�QHZ�/'9�IXHO�HI¿FLHQF\��6RPH�RI�WKH�$6($1�FRXQWULHV�already have schemes in place, where all LDVs in the stock needs to be registered on an annual basis. Based on fuel consumption or (CO2 emissions) these annual registration taxes (referred to as circulation tax in the following to better distinguish them from the one-time new LDV registration tax discussed in Section 4.3.1) provides an incentive to both choose D�IXHO�HI¿FLHQW�QHZ�FDU�DQG�DOVR�WR�UHSODFH�DQ�ROG�LQHI¿FLHQW�YHKLFOH�E\�D�PRUH�HI¿FLHQW�QHZ�or used car. Thus, in contrast to a feebate scheme, a fuel consumption-based circulation tax acts both on newly registered and already existing vehicle stock and is a complementary measure to a feebate scheme.
A circulation tax can be designed in a way that is equal to a one-off registration tax over D� VHOHFWHG� WLPH�KRUL]RQ� �H�J�� ¿YH� \HDUV���6LQFH� FLUFXODWLRQ� WD[HV� DIIHFW� QHZO\� UHJLVWHUHG�vehicles and vehicles in the stock, they can be combined with attributes to control pollutant emissions. For example, a circulation tax scheme can contain a component that depends on the Euro emission standard of the vehicle, progressively adding costs with decreasing standards. It can also contain a component for taxing NOx emissions, thus discouraging old diesel cars with no effective exhaust treatment. Such a NOx component has recently been introduced within a vehicle registration tax in Chile (Lopez 2014), where the registration tax is designed to mimic circulation over a particular time horizon.
Table 12: Overview of annual circulation tax schemes around the world
Source: ICCT 2014a
Similar to the feebate scheme, an annual circulation tax based on fuel economy or CO2 emission should build on existing administrative structures, and requires the respective YHKLFOH�VSHFL¿F�GDWD��6LQFH�WKH�FLUFXODWLRQ�WD[�DIIHFWV�WKH�YHKLFOH�VWRFN��WKH�GDWD�LV�UHTXLUHG�for cars with ages of 15 years and more. As manufacturers were not required to provide fuel consumption/CO2�HPLVVLRQ�GDWD�DW�WKDW�WLPH��WKHVH�GDWD�PLJKW�EH�KDUG�WR�¿QG�IRU�YHKLFOHV�above the age of 10 years. In this case, functions based on attributes such as engine displacement, power and fuel type will need to be developed to quantify circulation tax values.
Case studies
An overview of various annual circulation tax schemes is provided in Table 12. The tax schemes in Denmark, Germany, the Netherlands, Sweden and United Kingdom are based on either fuel consumption or CO2 emission, among other attributes such as engine
Country Annual circulation tax
Austria Circulation tax based on engine power. EVs are exempted.Denmark Annual circulation tax based on fuel consumption. BEVs weighing < 2000 kg are exempted. Germany Circulation tax based on engine displacement and CO2 emission. EVs are exempted for 10 years. Netherlands Circulation tax based on the vehicle weight, fuel type, and CO2 emission. BEVs and most PHEVs are exempted.Sweden Road tax based on CO2 emission. EVs are exempted. United Kingdom Excise duty from second year of purchase based on the CO2 emission and vehicle price. BEVs and some PHEVs are exempted.Norway Circulation tax about EUR 350. China Vehicle and vessels fee based on engine displacement and price. EVs are exempted. Japan Tonnage tax based on vehicle weight. EVs are exempted. Automobile tax based on engine displacement. EVs are exempted 50%.

76
displacement, fuel type, vehicle price and weight. It can be seen that in many of the schemes electric vehicles (EVs) and PHEVs are exempted from the circulation tax. This is an important observation: Although fuel economy policies mainly target conventional cars, the proper inclusion of advanced vehicle technologies is a crucial component for the longer-term transition towards these powertrains.
Figure 31 on the left shows average annual circulation tax values for new vehicles for either gasoline and diesel or all cars (“generic”). The amount of the circulation tax varies VLJQL¿FDQWO\��IURP�RQO\�(85����SHU�\HDU�LQ�*HUPDQ\�WR�PRUH�WKDQ�(85�����IRU�GLHVHO�FDUV�in Denmark. The right side of Figure 31 shows the average one-off registration for selected EU countries. Again, the spread is large, reaching from about EUR 200 in Belgium to more than EUR 5,000 for diesel cars in the Netherlands.
Figure ��: Annual average circulation and one-off registration tax for selected EU countriesSource: Adapted from Malina 2016
In fact, circulation taxes are about an order of magnitude smaller than registration taxes. This illustrates the complementary nature of circulation taxes: Even over a longer period of ¿YH�WR�VHYHQ�\HDUV��WKHVH�RQ�DYHUDJH�GR�QRW�UHDFK�WKH�OHYHO�RI�WKH�RQH�RII�UHJLVWUDWLRQ�WD[��Furthermore, since annual circulation taxes are future expenditures, which are not to be paid DW�WKH�PRPHQW�RI�SXUFKDVLQJ�UHJLVWHULQJ�D�QHZ�YHKLFOH�IRU�WKH�¿UVW�WLPH��PRVW�FRQVXPHUV�GR�not fully internalise them at the time of purchase.
5.5.5 Fuel tax design and implementation
Fuel taxes are the most effective way of pricing externalities related to motorised transport. 7KH\�DIIHFW�ERWK�WHFKQLFDO�DWWULEXWHV�RI�YHKLFOHV��H�J��IXHO�HI¿FLHQF\��DQG�DOVR�WKHLU�XVH��DQG�are therefore a powerful means to control rebound effects.
The overall target of fuel economy policies is to reduce fuel use, emissions and related costs. Improved vehicle fuel economy on its own might not necessarily lead to that target, as consumers might decide to increase annual driving as a result of lower per-kilometre costs. Therefore, pricing the use of vehicles is essential to reduce energy use and emissions.
Extensive literature exists on fuel price and income effects on vehicle travel and fuel use. A comprehensive review of fuel price elasticities is contained in a 2017 publication by Victoria Transport Policy Institute (VTPI 2017). According to Goodwin, Dargay and Hanly (Goodwin
*�
+**�
,**�
-**�
.**�
/**�
0**�
����
����
����
��'�
����
���
�����
���
#&�
���
#���
��
��
���
#���
�
�%��
���
���
���
����
���
�
�� �
������� �����������
*�
+***�
,***�
-***�
.***�
/***�
0***�
����
�#�
�
����
��
����
!��
�����
���
� $
���
��
�����
����
�� �
������� ���� ���������
���������
�������
��������

77
et al 2004), a long-term fuel price increase causes vehicle travel and fuel consumption to decline, with the reduction in fuel consumption about twice the decline in kilometres travelled. According to their review, this can be explained by the fact that the effect of purchasing VPDOOHU�RU�PRUH�HI¿FLHQW�FDUV�DV�ZHOO�DV�FKDQJLQJ�GULYLQJ�EHKDYLRXU�LV�DERXW�WZRIROG�WKDW�RI�the reduction in vehicle ownership and annual driving. Fuel taxes are thus a proven means to directly affect fuel economy of new cars.
Long-run elasticities of vehicle travel with respect to fuel prices are between -0.3 and -0.8, making fuel tax adjustments an effective instrument to limit rebound effects from increased vehicle fuel economy, even if, for various reasons, fuel taxes might not be the instrument of choice for stimulating vehicle fuel economy improvement.
Case study
Turkey is among the countries with the highest fuel prices in the world. In 2014, the average price of one litre of gasoline was USD 2.06, while one litre of diesel cost about USD 1.90.
The high fuel price in combination with a high vehicle registration tax and the proximity to the EU as a market for vehicle exports makes Turkey one of the countries with the most HI¿FLHQW�QHZ�/'9�ÀHHW��$OWKRXJK�WKH�WD[�VFKHPH�LV�QRW�RSWLPDO�EHFDXVH�RI�WKH�OLQNDJH�RI�registration tax with vehicle price, the system effectively contributes to improved LDV fuel economy over time. In 2015, average new LDV fuel consumption was about 5.2 LGe/100km (NEDC). Starting at 7.2 LGe/100km in 2005, fuel consumption fell by almost 30% by 2015, at an annual improvement rate of 3.3%.
Figure ��: Sales by CO2 emission class (left), and sales by powertrain type (right), and powertrain and sales-weighted average CO2 emissions and fuel consumption for Turkey, 2005 to 2015Source: GFEI 2017
The high vehicle taxation is illustrated in Figure 33 for a set of common car models among countries in Europe. Although similar models are cheaper in Turkey than in France, Germany or the Netherlands, the tax burden is higher. This is especially true for larger and more luxurious cars: A medium-size VW Passat has a tax burden of about 140% of its price, in the case of a Mercedes E class, taxes account for almost 200% of the vehicle price. Although YHKLFOH�WD[DWLRQ�LV�QRW�UHODWHG�WR�IXHO�HI¿FLHQF\��WKH�FRPELQDWLRQ�ZLWK�KLJK�IXHO�SULFHV�KDV�turned out to be effective.

78
Figure ��: Vehicle prices and taxation selected models in Turkey, Germany, France and the Netherlands.Source: ICCT 2016
5.5.6 Design and implementation of fuel economy standards
)XHO�HFRQRP\�VWDQGDUGV�DUH�D�YHU\�SRZHUIXO�PHDQV� WR�VWLPXODWH�YHKLFOH�HI¿FLHQF\��7KH�¿UVW�FRXQWU\� WR� UHJXODWH�YHKLFOH� IXHO�HFRQRP\�ZDV� WKH�86��ZKLFK� LQ������ LQWURGXFHG� WKH�¿UVW�&RUSRUDWH�$YHUDJH�)XHO�(FRQRP\��&$)(��VWDQGDUG��6LQFH�WKHQ��PDQ\�FRXQWULHV�DQG�regions have followed, and since 2015 almost 90% of the global vehicle market has been regulated in this respect.
&KLQD�ZDV�WKH�¿UVW�QRQ�2(&'�FRXQWU\�WR�LPSOHPHQW�D�IXHO�FRQVXPSWLRQ�VWDQGDUG��3KDVH�,�was introduced in 2005. At the time, each vehicle model had to comply individually with a minimum performance standard (MPS). Under Phase III, introduced in 2012, the regulation changed towards a corporate average fuel consumption standard. In this case, the production-weighted average fuel consumption of all vehicles produced by a manufacturer QHHGV� WR� FRPSO\� ZLWK� D� PDQXIDFWXUHU�VSHFL¿F� WDUJHW�� :KLOH� WKH� FRUSRUDWH� DYHUDJH� IXHO�consumption standards are tightened from phase to phase, individual vehicles, particularly IRU�GRPHVWLFDOO\�SURGXFHG�YHKLFOHV��QHHG�RQO\�IXO¿O�3KDVH�,,�ZHLJKW�EDVHG�OLPLWV��$V�RI�������with the implementation of New Energy Vehicle (NEV) quotas, companies also need to manufacture a certain proportion of electric or plug-in hybrid electric vehicles annually, or HOVH�SD\�D�¿QH�RU�SXUFKDVH�FUHGLWV�IURP�RWKHU�FRPSDQLHV�
)RU�GHYHORSLQJ�PDQXIDFWXUHU�VSHFL¿F�VWDQGDUGV��DGGLWLRQDO�DWWULEXWHV�VXFK�DV�YHKLFOH�VL]H�or vehicle weight need to be taken into consideration to account for the different sales portfolios among manufacturers. Therefore, fuel consumption or CO2 emission targets are set taking into account the sales-weighted average size or weight of all vehicles sold by a certain manufacturer in a certain year.
7KH�SURFHGXUH�WR�GHYHORS�D�WDUJHW�YDOXH�FXUYH�QHFHVVDU\�WR�VHW�XS�PDQXIDFWXUHU�VSHFL¿F�fuel consumption or CO2 emission standards has been summarised by ICCT (ICCT 2011a) and is illustrated in Figure 34.

79
Three main issues need to be investigated beforehand:
1. What is the current sales-weighted (or production-weighted) average new LDV fuel consumption or CO2 emission as a function of the vehicle utility parameter (i.e. size or weight)?
2. What is the targeted sales-weighted average fuel consumption or CO2 emission?
3. What is the average percentage reduction to shift from the current sales-weighted fuel consumption or CO2 emission to the future target value?
The purple line in Figure 35 denotes the present sales-weighted average CO2 emissions of all LDVs in the market as a function of a vehicle attribute such as size or weight (on the [�D[LV���,Q�WKH�¿UVW�VWHS��WKH�SXUSOH�OLQH�QHHGV�WR�EH�VKLIWHG�E\�DSSO\LQJ�WKH�VDPH�GHVLUHG�percentage CO2 emission reduction y to each point on the purple curve. This results in the blue 100% slope curve. A standard based on such a 100% slope curve would provide LQFHQWLYH�WR�PDQXIDFWXUHUV�WR�LQFUHDVH�DYHUDJH�VL]H�RU�ZHLJKW�RI�WKHLU�ÀHHW�LQ�RUGHU�WR�UHOD[�WKHLU�VSHFL¿F�&22 emission target. Therefore, the blue 100% slope curve needs to be tilted around the previously set overall CO2 emission or fuel consumption target (step 3). On the RWKHU�VLGH��D�ÀDW�WDUJHW��UHG�OLQH��ZRXOG�UHTXLUH�WKH�VDPH�&22 emission (or fuel consumption) target to be met by all manufacturers, regardless of the average size or weight of the vehicles they sell. A viable compromise between the request to diversify the CO2 emission targets among different manufacturers, and the risk that manufacturers are provided with an LQFHQWLYH�WR�JDPH�WKH�UXOHV�DQG�WR�LQFUHDVH�ZHLJKW�RU�VL]H�RI�WKH�YHKLFOH�ÀHHW�QHHGV�WR�EH�found. According to the summary provided by ICCT, previous studies indicate a 40% slope to be a good compromise to set up a weight-based target value curve.
Figure ����6FKHPDWLF�SURFHGXUH�RI�VHWWLQJ�D�PDQXIDFWXUHU�VSHFL¿F�DQG�DWWULEXWH��EDVHG�&2��HPLVVLRQ�VWDQGDUGSource ICCT 2011a
Many discussions have been around the question whether vehicle size or vehicle weight is the better attribute to set up fuel economy regulation. Light-weighting of vehicles is a promising PHDVXUH�WR�LPSURYH�YHKLFOH�IXHO�HI¿FLHQF\�ZKLOH�NHHSLQJ�WKH�VDPH�YHKLFOH�XWLOLW\��8QGHU�D�weight-based system, the reduction of average vehicle weight to reduce fuel consumption

80
and CO2 emissions would lead to a tightened fuel consumption or CO2 emission target (see Figure 36, left). In the case of a size-based system, the fuel consumption or CO2 emissions UHGXFWLRQ� GXH� WR� OLJKW�ZHLJKWLQJ� OHDGV� WR� ÀHHW� ZHOO� EHORZ� WKH� WDUJHW� OLQH�� ZKLFK� RQ� WKH�individual vehicle basis provides a strong incentive for light-weighting to the manufacturer.
Figure ��: Weight- versus size- based fuel consumption and CO2 emission standardSource ICCT 2011 EU emission
Case study
The European Union has implemented a standard specifying the sales-weighted average CO2 emission to reach 95 gCO2/km (~4.1 LGe/100km) for PLDVs by 2021 and 147 gCO2/km (~6.3 LGe/100km) for LCVs by the year 2020. It is a corporate average standard with PDQXIDFWXUHU�VSHFL¿F�HPLVVLRQ�WDUJHWV��ZKLFK�DUH�GHYHORSHG�WDNLQJ�LQWR�DFFRXQW�WKH�VDOHV�weighted average vehicle weight of the year prior to the target year. The resulting target curves for PLDVs and LCVs as a function of vehicle weight are shown in Figure 37.
,Q�DGGLWLRQ��IXUWKHU�UXOHV�KDYH�EHHQ�GHYHORSHG�IRU�WKH�FDOFXODWLRQ�RI�PDQXIDFWXUHU�VSHFL¿F�CO2 emission targets. Super credits can be allocated for low-emission vehicles emitting less than 50 gCO2/km. These vehicles are given a higher weight of up to three times the actual sales numbers when calculating the sales-weighted average emissions. E85 extra credits have been introduced to account for the lower emissions of vehicles which can use E85 biofuel blends (containing up to 85% of bioethanol in the petroleum fuel blend). Last but not least, manufacturers can apply for approval of eco-innovations at the European &RPPLVVLRQ��,I�D�PDQXIDFWXUHU�¿WV�LWV�ÀHHW�ZLWK�VXFK�DQ�HFR�LQQRYDWLRQ��ÀHHW�ZLGH�VDOHV�weighted average emissions can be reduced by up to 7 gCO2/km (EEA 2015).

81
Figure ��: CO2 emission target curves for PLDVs and LCVs in the European Union for the years 2017 to 2020 and post 2020Source: Own calculations based on EEA 2015
5.5.7 Air pollutant emission standards and fuel economy
It is important to distinguish between CO2 emissions and pollutant emissions (see Table 13). Air pollutants include particulate matter (PM), nitrogen oxides (NO and NO2, often referred to together as NOx), sulphur oxides (SOx), un-burnt hydrocarbons (HC) and carbon monoxide (CO). The two categories of emissions and their respective policies often cause confusion. Carbon dioxide, or CO2, is a greenhouse gas, but is not considered a toxic pollutant as such. Although CO2 emissions and pollutant emissions both result from burning fuels, their methods of control are very different, from technological and regulatory perspectives. CO2 emissions are reduced by lowering fuel consumption and adjusting energy sources, while air pollutants are reduced through the use of technologies such as catalytic converters and SDUWLFXODWH�¿OWHUV�� WKURXJK�UHGXFLQJ�VXOSKXU� LQ� IXHO��DQG�XVLQJ�XUHD�EDVHG�12[�UHGXFWLRQ�technologies. Hence, a large and powerful SUV can emit very small amounts of air pollutants DQG�EH�FRQVLGHUHG�FOHDQ�LQ�WKDW�VSHFL¿F�UHVSHFW��%XW�LW�FRXOG�UHPDLQ�DQ�LQHI¿FLHQW�YHKLFOH�that consumes a lot of fuel and emits a lot of CO2.
The implementation of stringent fuel economy policies, pollutant emission standards and fuel quality standards need to go hand-in-hand to ensure the following:
��� ,QFUHDVHG�YHKLFOH�HI¿FLHQF\�GRHV�QRW� OHDG� WR�JUHDWHU�DLU�SROOXWLRQ��7KLV�HVSHFLDOO\�important to avoid an increased rate of dieselisation (induced by fuel economy policies), which might occur as a response to fuel-economy pressures without LPSURYHG�HPLVVLRQ�VWDQGDUGV��2OGHU�(XUR�,,��,,,�DQG�,9�GLHVHO�FDUV�HPLW�VLJQL¿FDQWO\�more particulate matter (PM) than most recent Euro V and IV vehicles. This shift can also be avoided by banning diesel LDVs and ensuring adequate supplies of gasoline.
2. The required fuels are available on the market. Vehicles complying with tightened IXHO�HI¿FLHQF\�DQG�SROOXWDQW�HPLVVLRQ�VWDQGDUGV�QHHGV� WR�EH� IXHOOHG�ZLWK�VXLWDEOH�fuels. These need to have high octane ratings and low sulphur contents in order to
0
50
100
150
200
250
300
350
400
1000 1200 1400 1600 1800 2000 2200 2400 2600 2800 3000
Sa
les w
eig
hte
d a
ve
ra
ge
em
issio
ns
(gC
O2
/k
m)
Sales weighted average vehicle weight (kg)
PLDVs 2017 - to 2020 PLDVs post 2020 LCVs 2017 - to 2020 LCVs post 2020

82
ensure a controlled combustion process under high pressure and temperatures as well as to prevent the generation of soot.
Table 13: Overview of vehicle emissions
Pollutant Classification
Can be
filtered/captured on-
board a vehicle
Reduction method Regulation
Carbon dioxide (CO2) Greenhouse gas No
Reduced fuel consumption, reduced carbon content in the
fuel
CO2 emission standard (or indirectly through fuel consumption standard)
Particulate matter (PM) Air pollutant YesParticulate filters,
improved combustionEuro I-VI, US Tier 1 and 2 among others
Nitrogen oxides (NO and NO2, often referred to as NOx)
Air pollutant YesCatalytic converter,
exhaust gas recirculation (EGR)
Euro I-VI, US Tier 1 and 2 among others
Sulphur oxides (SOx) Air pollutant NoReduced sulphur content
in the fuelEuro I-VI, US Tier 1 and 2 among others
Un-burnt hydrocarbons (HC) Air pollutant YesCatalytic converter,
improved combustionEuro I-VI, US Tier 1 and 2 among others
Carbon monoxide (CO) Air pollutant Yes Catalytic converter Euro I-VI, US Tier 1 and 2 among others
The regulation of air pollutants often refers to the European Euro I to VI standards for diesel vehicles and Euro 1 to 6 standards for gasoline vehicles. These pollutant emissions standards should not be confused with carbon emission or fuel consumption standards. While the former is concerned with the reduction of air pollution, the latter is concerned with the reduction of GHG emissions and fuel consumption by vehicles.
The air pollutant emission standards for passenger vehicles do have some relationship to fuel consumption, but the connection has been demonstrated to be of less importance RYHU�WLPH�LQ�PDWXUH�PDUNHWV��1RQHWKHOHVV��FHUWDLQ�WHFKQRORJLHV�IRU�IXHO�HI¿FLHQF\��VXFK�DV�turbocharging in diesel engines, require higher-quality fuels in order to operate properly, and higher fuel quality standards are often driven by more stringent vehicle pollutant emission standards.
An overview of current pollutant emission standards for PLDVs in selected AMS is illustrated in Figure 38.
Fuels matching the Euro 4/IV standard are now available in Brunei Darussalam, Indonesia, Malaysia, the Philippines, Singapore and Viet Nam, and Euro 5/V in Singapore. Indonesia only provides Euro 4 gasoline, while diesel there has very high sulphur concentration. Cambodia, Lao PDR and Myanmar plan to adhere only to the standards of Euro 2/II or even Euro 1/I fuels until the beginning of the 2020s.
7KHVH� ORZ�TXDOLW\� IXHOV� LPSRVH� D� EDUULHU� WR� /'9� IXHO� HI¿FLHQF\� LPSURYHPHQW�� +RZHYHU��UDLVLQJ� WKH�PLQLPXP� VWDQGDUGV�ZRXOG� LQFUHDVH� SURGXFWLRQ� FRVWV�� 5H¿QHULHV� QHHG� WR� EH�UHWUR¿WWHG�WR�SURGXFH�IXHO�ZLWK�LQFUHDVHG�RFWDQH�UDWLQJ��QHFHVVDU\�IRU�IXHO�HI¿FLHQW�YHKLFOHV��while lowering the concentration of harmful components such as benzene in order to comply with those higher Euro standards.

83
Case study
Between the years 2000 and 2012 the share of diesel vehicles among new LDVs grew from 17% to more than 40% globally (ICCT 2012). At the same time, fuel consumption of new LDVs in India remained low, at around 6 LGe/100km, while vehicle size increased by about ����EHWZHHQ������DQG�������*)(,��������7KH�LQFUHDVHG�VKDUH�RI�HI¿FLHQW�GLHVHO�YHKLFOHV�certainly accounts for a large part of the stable and low average LDV fuel consumption.
Nonetheless, under the current pollutant emission regulation, diesel LDVs are allowed to emit about three times more NOx and about 10 times more particulate matter compared with gasoline cars. Both, NOx and particulate matter emissions are at the source of VHULRXV�GLVHDVHV��DQG�³FRUUHODWLRQV�EHWZHHQ�DPELHQW�¿QH�SDUWLFXODWH�PDWWHU��30�����DQG�cardiopulmonary mortality” (ICCT 2012) can be clearly detected. According to calculations performed by ICCT, almost 10,000 premature deaths could be provoked through the emissions of particulate matter by the year 2030, if pollutant emission standards are not tightened.
In this case study, although CO2 emissions may have decreased due to dieselisation, air SROOXWDQWV�LQFUHDVHG�GUDPDWLFDOO\�UHVXOWLQJ�LQ�D�GLI¿FXOW�FRVW�EHQH¿W�EDODQFH�
Figure ��: Overview of vehicle pollutant emission standards in selected AMSs and other global jurisdictionsSource: Clean Air Asia, 2015

84
5.5.8 Fuel quality regulation
Type of measure <� Regulation which sets fuel quality requirements for a num-ber of physical and chemical properties
Principle <� All fuels for sale in the market must meet the requirements
Rationale <� The standard pulls clean fuels into the market, which are a requirement for the implementation of pollutant and fu-el-economy standards
<� Standards for vehicle pollutant emission, fuel quality and fuel economy are tightly linked to ensure that the potential RI�HI¿FLHQW�YHKLFOH�WHFKQRORJLHV�LV�IXOO\�H[SORLWHG
Key aspects <� The EU fuel quality standards Euro I to VI are often used as D�EDVHOLQH�IRU�FRXQWU\�VSHFL¿F�IXHO�TXDOLW\�VWDQGDUG�GHYHORS-ment all over the world
<� Fuel quality standards needs to be tightened periodically to HQDEOH�PRUH�VWULQJHQW�HPLVVLRQ�DQG�HI¿FLHQF\�VWDQGDUGV
<� Fuel quality standards also regulate the blend shares and VSHFL¿FDWLRQV�RI�ELRIXHOV
Prerequisites <� The administrative framework needs to be in place to set the target, to check compliance by regularly testing fuels and to enforce the standards
Case studies <� Euro VI standard in the EU, EPA gasoline and diesel stan-dards the US, Bahrat IV in India, China IV/V
Impact rating <� High
Complexity rating <� High
Fuel quality standards regulate the physical properties as well as the chemical composition of fuels. They also contain regulation on composition and shares of biofuels, which are blended with gasoline and diesel in order to reduce their carbon footprint.

85
Table 14: Pros and cons of harmonisation of ASEAN fuel quality standards
Source: Adapted from Thitiratsakul 2016
(I¿FLHQW� YHKLFOHV� ZLWK� HQJLQHV� WKDW� KDYH� KLJKHU� FRPSUHVVLRQ� UDWLRV�� DUH� WXUERFKDUJHG��downsized or down-speeded all require high-quality fuels with high octane ratings. Meeting Euro standards with respect to the concentration of harmful components such as benzenes and achieving higher octane ratings at the same time requires substantial upgrading of H[LVWLQJ�UH¿QHULHV�
The Petroleum Institute of Thailand (PTIT) has compiled the pros and cons of harmonised fuel quality standards in the ASEAN region (Table 14). While advantages are evident, the ODUJHVW�EDUULHU�LV�WKH�LQYHVWPHQW�QHHGHG�WR�XSJUDGH�H[LVWLQJ�UH¿QHULHV�
The study Cleaning Up the On-Road Diesel Fleet (CCAC 2016) details the investment needs IRU�DYHUDJH�UH¿QHULHV� LQ�GHYHORSLQJ�HFRQRPLHV�WR�SURGXFH� ORZ�VXOSKXU�GLHVHO��$FFRUGLQJ�WR�WKH�SXEOLFDWLRQ��DGGLQJ��UHSODFLQJ�RU�UHWUR¿WWLQJ�H[LVWLQJ�GLVWLOODWH�K\GURWUHDWLQJ�FDSDFLW\�and ensuring increased hydrogen supply in order to reduce sulphur levels to 50ppm would require investment of around USD 4,000 per barrel per day of additional low sulphur diesel FDSDFLW\��$VVXPLQJ�W\SLFDO�UH¿QHULHV�LQ�WKH�UHJLRQ�WR�DFFRXQW�IRU��������EDUUHOV�SHU�GD\�RI�diesel production, investment amounts to about USD 200 million. The study published by CCAC estimates the total investment needs to produce 50ppm sulphur diesel in South-East Asia amount to USD 13 billion.
Case study
,Q�������,&&7�SXEOLVKHG�WKH�FDVH�VWXG\�5H¿QHULHV�LQ�9LHWQDP��,&&7�����D���ZKLFK�DQDO\VHV�LQ�GHWDLO�9LHW�1DP¶V�PHDVXUHV�WR�VLJQL¿FDQWO\�LPSURYH�IXHO�TXDOLW\�WKURXJK�WKH�LQWURGXFWLRQ�RI�ambitious fuel quality standards as well as to increase its independence from fuel imports.
Pros Cons
Flexible cross-border trade Higher fuel costsConfidence in fuel qualityReduced health riskReduced exhaust emissionsReduced emissions of GHGsBetter air quality
Higher economic valueInvestment needs to upgrade refineries
Increased freight transport efficiency
Higher production costs
Increased economy of scale in fuel trading
Increased secturity of supply with respect ot ASEAN strategic reserve
Other
ASEAN has no enforcement mechanism in place to convert harmonization efforts into national law
Consumer
Environment
Economy

86
According to the study, from 2009 gasoline and diesel fuels domestically produced at the FRXQWU\¶V�RQO\� UH¿QHU\�'XQJ�4XDW�ERWK�QHHGHG� WR�PHHW�(XUR� ,,� VWDQGDUG�ZLWK�D�VXOSKXU�limit of 500ppm. By 2016, fuels need to comply with Euro IV, with sulphur content limited to 50ppm. Since 2018, domestically produced gasoline and diesel need to comply with Euro V, which requires sulphur levels to be below 10ppm. This development goes hand-in-hand with the requirement for new vehicles in the country to meet Euro IV by 2017 and Euro V by 2022.
,Q�RUGHU�WR�EULQJ�WKH�UHTXLUHG�IXHO�TXDOLW\� WR�PDUNHW�� WKH�'XQJ�4XDW�UH¿QHU\�ZDV�WR�KDYH�been upgraded to produce Euro V fuels by 2016, and construction has started on several QHZ�UH¿QHULHV��DOWKRXJK�SURJUHVV�KDV�EHHQ�VORZ��ZLWK�FRPSOHWLRQ�DW�WKH�'XQJ�4XDW�UH¿QHU\�pushed to 2021. Altogether, according to the original plan, between 57 and 70 million tons of crude oil can be processed to Euro IV and V fuels when the initiative is complete, although the original timeline to complete construction by 2018 faces delays. In total, upgrading the H[LVWLQJ�DQG�FRQVWULFWLQJ�WKH�QHZ�UH¿QHU\�FDSDFLW\�LV�H[SHFWHG�WR�FRVW�EHWZHHQ�86'��� billion to USD 44 billion.
If the projects come online as planned, Viet Nam will become a high-quality fuel producer. Its success in this will depend in part on its ability to increase both fuel quality and production capacity at the same time. The ability to attract foreign capital also partly relies on the fact that a market for these fuels is guaranteed through the introduction of the respective Euro standards for cars as well as the regulation of the fuel market. By managing to obtain interest RI�0LGGOH�(DVW� FUXGH� RLO� SURGXFHUV� WR� LQYHVW� LQ�9LHW�1DP¶V� UH¿QHU\� VHFWRU�ZKLOH� FORVLQJ�contracts for longer term supply with own crude oil, the avenue towards the production of clean fuels ahead of time seems to be paved.
According to CCAC some key take-aways can be formulated:
%� National government takes the lead in setting an ambitious fuel quality standard, starting with major cities. This builds demand for low-sulphur fuels, sends a clear signal to producers.
%� 7KH�VWDWH�RZQHG�UH¿QHULHV�DUH� UHTXLUHG�E\� ODZ� WR�FRPSO\�ZLWK� WKH�QHZ�VWDQGDUG��SDUWQHULQJ�ZLWK�D�SULYDWH�UH¿QHU\�RSHUDWRU�WR�HQVXUH�WKH�GHDGOLQH�IRU�XSJUDGH�LV�PHW�
%� Funding for upgrades is often a combination of both public and private funds, made SUR¿WDEOH�E\�FRXSOLQJ�GHVXOIXULVDWLRQ�FDSDFLW\�ZLWK�LQYHVWPHQWV�WR�LQFUHDVH�FDSDFLW\�and yields.
(CCAC 2016)
5.6 Methodological considerations5.6.1 Options for determining the level of ASEAN’s aspirational LDV fuel consumption goal
'XULQJ� WKH� GUDIWLQJ� RI� WKLV� URDGPDS�� WKH� JRYHUQPHQW� RI¿FLDOV� UHSUHVHQWLQJ�$06� LQ� WKH�$6($1�(*6/7�FRQVLGHUHG�D�PHQX�RI�¿YH�SURSRVHG�RSWLRQV�IRU�WKH�DPELWLRQ�OHYHO�RI�WKH�goal. In brief, the options were:

87
1) Based on 2030 GFEI target
2) Based on arithmetic mean of existing LDV fuel economy improvement rates
3) Based on arithmetic mean of existing 2020 LDV fuel consumption targets
4) Based on a 40% fuel consumption reduction target by 2030
5) Based on a doubling of historical LDV fuel economy improvement rates
In addition, the EGSLT members had the possibility of proposing further alternative options but none did so. The Expert Group decided in favour of option 5. Further elaboration of each proposed option can be found below:
Option 1: Based on the 2030 new-vehicle fuel economy target by GFEI
Option 1 is based on the target set by the Global Fuel Economy Initiative (GFEI) to double LDV fuel economy of all vehicles in the stock by 2050 by reducing fuel consumption by 50% from 8.3 LGe/100km in 2005 to 4.2 LGe/100km by 2050 (GFEI 2017). To reach this target, fuel consumption of all new LDVs needs to reach 4.2 LGe/100km 20 years earlier, by 2030. This value is used to set the fuel economy target in Option 1.
Based on the estimated ASEAN-wide new LDV fuel consumption of 7.3 LGe/100km for the year 2015, an LDV fuel consumption target of 4.2 LGe/100km by 2030 implies an annual LDV fuel economy improvement rate of 3.7%. This would mean a 2025 fuel consumption target of 5.0 LGe/100km for the ASEAN region.
Such a 2025 target is above the arithmetic mean of all existing LDV fuel consumption targets for that year (~4.5 LGe/100km) in countries with regulation covering both PCs and LCVs. The implied annual fuel economy improvement rate of 3.7% is a little below the arithmetic mean for other regions.
Please note that for this exercise, linear extrapolations based on the annual improvement rates have been used to estimate fuel consumption targets beyond the time frames set in the respective regulation of the country or region (values in red). This methodology is valid for smaller differences with regard to the time frame (e.g. the EU 2021 target vs. an estimated 2025 target based on the 2014 to 2021 improvement rate), but provides only a rough estimate for time frames that stretch further beyond that of the regulations (e.g. in the case of Mexico and Brazil where the actual target years are 2016 and 2017, respectively).
Option 2: Based on the average LDV fuel economy improvement rate indicated by existing LDV fuel economy regulation around the world
Option 2 is based on the average annual fuel economy improvement rate of 4.1%, which is derived from existing LDV fuel economy regulations in other regions of the world. This improvement rate is then applied to the estimated ASEAN-wide base year fuel economy of 7.3 LGe/100km (2015). The calculation results in an ASEAN-wide LDV fuel consumption target of 4.8 LGe/100km for the year 2025.

88
Option 2 implies a total reduction of LDV fuel consumption of 34% between 2015 and 2025. By 2025, the ASEAN target of 4.8 LGe/100km would still be somewhat above the arithmetic mean of the existing LDV fuel consumption targets (4.5 LGe/100km). By 2030, the extrapolation of the ASEAN fuel consumption target (3.9 LGe/100km) would be below the target proposed by the GFEI (4.2LGe/100km).
Option 3: Based on the average of all LDV fuel consumption targets for the year 2020 around the world
Option 3 is based on the arithmetic mean of all existing absolute fuel consumption targets for LDVs around the world for the year 2020. Thus, the average fuel consumption of 5.6 LGe/100km is set as the target value for that year. In addition, the resulting fuel economy improvement rate of 5.2% per year from 2015 to 2020 (again based on the ASEAN-wide 2015 baseline fuel consumption of 7.3 LGe/100km) is used to determine the 2025 target, which then accounts for 4.3 LGe/100km.
The 2025 LDV fuel consumption target of 4.3 LGe/100km represents a 42% reduction compared to the year 2015 in the ASEAN region. By 2025, fuel consumption of new LDVs in the ASEAN region would be somewhat below the arithmetic mean of existing fuel economy regulation (4.5 LGe/100km). The annual average fuel economy improvement rate of 5.2% would be above the global average of 4.1% for all LDVs and 4.2% for PCs only. If linearly extrapolated out to 2030, the ASEAN-wide fuel consumption target would be 3.3 LGe/100km, indicating that in this case, the annual fuel economy improvement rate would need to be lowered after the year 2025.
Option 4: 40% reduction of LDV fuel consumption by 2025 compared to 2015
Option 4 suggests setting a 40% LDV fuel consumption reduction target by 2025 compared to the 2015 baseline fuel consumption of 7.3 LGe/100km in the ASEAN region. In this case, average new LDV fuel consumption would drop to 4.4 LGe/100km by 2025, which is about equal to the arithmetic mean of existing new LDV fuel consumption targets by that time (4.5 LGe/100km). Annual fuel economy improvement rate would reach 4.9%. With no further adjustment to the post-2025 LDV fuel economy improvement rate, new LDV fuel consumption would reach 3.4 LGe/100km by 2030.
Option 5: Based on doubling the historical global fuel economy improvement rate between 2005 and 2015
Between 2005 and 2015, the global average fuel economy improvement rate accounted for 1.5% per year (GFEI 2017).
Option 5 is based on doubling the historical fuel economy improvement rate to 3.0% and applying it to the ASEAN new LDV baseline fuel consumption of 7.3LGe/100km in 2015. This results in a 2025 ASEAN new LDV fuel consumption target of 5.4 LGe/100km for the year 2025.

89
,Q�WKLV�FDVH��HYHQ�E\�������$6($1�QHZ�/'9�IXHO�FRQVXPSWLRQ�LV�VWLOO�VLJQL¿FDQWO\�KLJKHU�compared to regions with LDV fuel economy regulation already in place (5.4LGe/100km vs. 4.5 LGe/100km, respectively). The 2025 fuel consumption target of the ASEAN will then be just 0.1 LGe/100km lower than the EU baseline LDV fuel consumption for the year 2015.
������ 'H¿QLWLRQ�RI�SDVVHQJHU�FDUV�DQG�OLJKW�FRPPHUFLDO�YHKLFOHV�LQ�PDMRU�PDUNHWV
Table 15��'H¿QLWLRQ�RI�SDVVHQJHU�FDUV�DQG�OLJKW�FRPPHUFLDO�YHKLFOHV�LQ�PDMRU�PDUNHWV
Source: IccT 2015c, own defInITIon
90
5.6.3 Examples of light-duty vehiclesTable 16: Examples of light-duty vehicles
���� �#���(
��� ��������"����
�� ����������
�� ��! ���
���� ��"���������� ����
����$ ���� �� �� # ��$�!
���� ��,+�'&������
�" ����� ����!
��� �" ������()&
����$ ���� �� ��"������� !
���� ��-�'&�����������,+'*������
��"���������
�����
����������
����� ��������
��������������������

91
5.6.4 Conversion factors
Table 17��)XHO�VSHFL¿F�FRQYHUVLRQ�IDFWRUV�WR�QRUPDOLVH�IXHO�FRQVXPSWLRQ�YDOXHV�WR�WKH�HQHUJ\�FRQWHQW�of gasoline
Fuel Base unit Multiplicator Target unit
Gasoline 1.00Diesel 1.08CNG (retrofit adjustment) 1.12LPG (retrofit adjustment) 1.15
L/100km Lge/100km
Table 18��)XHO�VSHFL¿F�&2��HPLVVLRQ�IDFWRUV
Fuel Base unit Multiplicator Target unit
Gasoline 23.2Diesel 24.8CNG 18.8LPG 21.1
Lge/100km gCO2/km
5.6.5 Fuel economy versus fuel consumptionBoth measures are widely used around the world. Nonetheless, the use of fuel consumption (L/100km) instead of fuel economy (km/L) is preferable from a regulatory point of view.
In the end, we are interested in quantifying the fuel savings while performing the same transport demand, i.e. travelling the same distance. The good thing with fuel consumption is that the incremental fuel savings to perform a certain transport demand stay the same ZLWK�LQFUHDVLQJ�YHKLFOH�HI¿FLHQF\��,Q�RWKHU�ZRUGV��WKH�GLIIHUHQFH�EHWZHHQ�D�IXHO�FRQVXPSWLRQ�of 15 L/100km and 14 L/100km versus the difference between 6 L/100km and 5 L/100km stays the same: Fuel savings account for 1 L when travelling a distance of 100km no matter if one compares vehicles with high or low fuel consumption.
In the case of fuel economy (measured in km/L), the difference in fuel consumption between a car running 10 km/L and a car running 11 km/L (10.0 L/100km vs 9.1 L/100km, respectively) equals 0.9 L/100km. The same difference between a car running 20 km/L and a car running 21 km/L (5.0 L/100km versus 4.8 L/100km) shrinks to fuel savings of only 0.2 L/100km.
,I�D� WD[�V\VWHP�WR� LQFHQWLYLVH�YHKLFOH� IXHO�HI¿FLHQF\�ZHUH�EDVHG�RQ� IXHO�HFRQRP\��NP�/��LQVWHDG� RI� IXHO� FRQVXPSWLRQ� �/����NP��� UHZDUGLQJ� LQFUHDVHG� IXHO� HI¿FLHQF\� WKURXJK�� IRU�example, reduced vehicle registration tax (i.e. -USD 500 per 1 km/L increased fuel economy), then the net value of saving 0.9 L/100km at low fuel economy levels would equal the same USD 500 as saving only 0.2 L/100km at higher fuel economy levels. Such a system would be likely to fail over time, since the same incentive would be paid for increasingly slim gains LQ�UHDO�IXHO�VDYLQJV��DV�YHKLFOH�HI¿FLHQF\�LPSURYHV�
Energy use by vehicles can also expressed in terms of CO2 emitted. CO2 emissions can EH�FDOFXODWHG� WKURXJK� WKH�XVH�RI� IXHO�VSHFL¿F�HPLVVLRQ� IDFWRUV� WKDW�DFFRXQW� IRU� WKH� WRWDO�CO2� HPLWWHG� ZKHQ� D� FHUWDLQ� YROXPH� RI� IXHO� LV� EXUQHG�� 7KHVH� ¿JXUHV� DUH� YDOXDEOH� IRU�climate change policy, and therefore some jurisdictions choose to use gCO2/km as the

92
unit of regulation. However, there are advantages in targeting fuel consumption instead. The concept is closer to consumers and more closely related to costs of vehicle operation. Furthermore, using energy consumption as a comparative measure can help compare the HI¿FLHQF\�RI�YHKLFOH�PRGHOV�ZLWK�GLIIHUHQW�SRZHU�WUDLQV�GLUHFWO\��LUUHVSHFWLYH�RI�ZKHWKHU�WKH\�are fuelled with gasoline, diesel, biofuels or electricity. Finally, measures to regulate fuel FRQVXPSWLRQ�VSHFL¿FDOO\�FDQ�LQFOXGH�PLQLPXP�SHUIRUPDQFH�VWDQGDUGV��FRUSRUDWH�DYHUDJH�IXHO�FRQVXPSWLRQ�VWDQGDUGV��¿VFDO�RU�WD[�LQFHQWLYHV�RU�GLVLQFHQWLYHV��DQG�SXEOLF�LQIRUPDWLRQ�such as vehicle labelling.
5.7 Widening the scope beyond LDV fuel economyImproving the fuel economy of conventional LDVs is an imperative step on the way to reduce energy use and emissions in line with mitigating climate change to a maximum temperature increase of 2 degrees Celsius above preindustrial levels by the end of this century. However, IXHO�HFRQRP\�PHDVXUHV�DORQH�DUH�LQ�QR�ZD\�VXI¿FLHQW�WR�UHDFK�WKLV�WDUJHW��7R�DFKLHYH�LW��the emissions from the transportation sector as a whole, including non-road modes such as air, rail and shipping, need to be cut substantially in the future, compared to a business-as-usual scenario. Therefore, the strategy of avoid-shift-improve (ASI) has been promoted by numerous stakeholders in the global transport and energy scene. Its main components are outlined in Figure 39.
%HORZ�� WKUHH�IXHO�HI¿FLHQF\�UHODWHG�EXLOGLQJ�EORFNV�RI�D� ORQJHU�WHUP�VXVWDLQDEOH� WUDQVSRUW�VWUDWHJ\�ZLOO�EH�EULHÀ\�GLVFXVVHG��KHDY\�GXW\�WUXFN�IXHO�HFRQRP\��HOHFWULF�PRELOLW\��DQG�WZR�wheelers.
5.7.1 Heavy-duty vehicle fuel economyAs of 2015, medium freight trucks (MFT, 3.5t < GVW < ~15t) and heavy freight trucks (HFT, GVW > ~15t) accounted for almost one quarter of total GHG emissions from transport, in spite
Figure ��: Overview of the avoid-shift-improve strategy to reduce energy use and emissions in the transport sector
Avoid Shift Improve
Avoid the need to travelShift travel to more efficient
modes
Improve the energy
efficiency of the
transportation technologies
� Integration of land use planning and transport
� Application of smart logistics
� Use of telecommunication technologies
� Shift of individual motorized passenger transport to public transport
� Shift of motorized transport to non-motorized transport
� Shift of freight transport to high efficiency/high load factor modes
� Use of intelligent transport demand management
� Improve the fuel efficiency of conventional technology
� Switch to new vehicle technology
� Shift to alternative and low carbon fuels

93
of the relatively low number of these vehicles compared to passenger cars. Furthermore, less than half of the global MFT and HFT market has been regulated with respect to fuel economy (Figure 41). Tractor-trailer combinations and rigid trucks are responsible for the largest part of the medium and heavy-duty vehicle stock and energy use. It is thus evident WKDW� LPSURYLQJ� WKH� IXHO� HI¿FLHQF\� RI� WUXFNV� KDV� D� JUHDW� SRWHQWLDO� WR� UHGXFH� HQHUJ\� XVH��emissions and fuel costs.
Figure ��: Annual GHG emissions and fuel consumption from tractor-trailers and rigid trucks worldwide by HI¿FLHQF\�VFHQDULR�����������Source: GFEI 2016b
,Q� ������ WKH� ,&&7� GHYHORSHG� D� VWXG\� IRU� *)(,� WLWOHG� ,QYHVWLJDWLQJ� WKH� )XHO� (I¿FLHQF\�Technology Potential of Heavy-Duty Trucks in Major Markets Around the World (GFEI ����E���7KH�DQDO\VLV�UHYHDOHG�WKDW�DFFHOHUDWHG�LPSURYHPHQW�RI�WKH�IXHO�HI¿FLHQF\�RI�PHGLXP�and heavy freight trucks has the potential to almost stabilise energy use and emissions at year-2015 levels on a global scale by the year 2035 (Figure 40).
Nonetheless, compared to LDV fuel economy policy making, it is more complicated to develop effective fuel economy measures for heavy road freight transport. The most LPSRUWDQW�UHDVRQ�IRU�WKLV�LV�WKH�VWURQJ�LPSDFW�RI�YHKLFOH�ORDG�DQG�WULS�SUR¿OHV�RQ�WUXFN�IXHO�economy. Conditions vary from long haul at relatively constant speeds on highways, to urban delivery with large portions of stop-and-go, to use of trucks at construction sites and RII�URDG��WR�QDPH�EXW�D�IHZ��$OUHDG\��WKH�DYDLODELOLW\�RI�QXPHURXV�FRQ¿JXUDWLRQV�RI�WUXFNV�EXLOW�RQ�WKH�VDPH�FKDVVLV��H�J��UHIULJHUDWRU�ER[�ZLWK�FRROLQJ�XQLW��FDUJR�ER[��ÀDWEHG�HWF���PDNHV�LV�LW�GLI¿FXOW�WR�HVWDEOLVK�UHIHUHQFH�IXHO�FRQVXPSWLRQ�RU�&22�HPLVVLRQ�¿JXUHV�EHFDXVH�it requires the laboratory testing of a large number of vehicles or the use of programmes combining laboratory test results and computer simulation software.

94
Figure 40��9HKLFOH�IXHO�FRQVXPSWLRQ��OHIW��DQG�ORDG�VSHFL¿F�IXHO�FRQVXPSWLRQ��ULJKW��RI�EDVHOLQH�WUDFWRU�WUDLOHUV�over the world heavy duty vehicle cycle (WHVC) at empty, half, and full loadSource: GFEI 2016b
The impact of loading on truck fuel consumption is shown in Figure 42. The consumption increase from an empty to a fully loaded tractor-trailer combination is about 80% to 90% in DOO�WKH�VKRZQ�UHJLRQV��(TXDOO\��)LJXUH����VKRZV�WKDW�ORDG�VSHFL¿F�IXHO�FRQVXPSWLRQ�JUHDWO\�drops with load: A fully loaded truck consumes about a third less the fuel per kg payload compared to a half-loaded truck. This comparison clearly shows not only the importance RI�LQFUHDVLQJ�WUXFN�IXHO�HI¿FLHQF\�EXW�DOVR�RI�LPSURYLQJ�ORJLVWLFV��(PSW\�UXQQLQJ��H�J��ZKHQ�UHWXUQLQJ� IURP�D� GHOLYHU\�� RU� KDOI�ORDGHG� WUXFNV� VLJQL¿FDQWO\� UHGXFH� WKH� HI¿FLHQF\� RI� WKH�heavy-duty road freight sector.
Table ��: Tractor-trailer baseline fuel consumption for various world markets
Driving Cycle
Payload
(kg)
Baseline fuel
consumption
(L/100km)
Baseline fuel
consumption
(Lge/100km)
Brazil WHCV 19,500 39.8 43.0China WHCV-China 25,000 41.6 44.9Europe VECTO Long-Haul 19,300 33.6 36.3India WHCV-India 27,230 54.8 59.2United States US Phase 2 Cycles 17,237 40.4 43.6
Source: GFEI 2016b
7KH�,&&7�KDV�TXDQWL¿HG�WKH�EDVHOLQH�IXHO�FRQVXPSWLRQ�RI�QHZ�WUDFWRU�WUDLOHU�FRPELQDWLRQV�EDVHG�RQ�WKH�FRXQWU\�VSHFL¿F�YHKLFOH�RIIHU�DV�ZHOO�DV�RSHUDWLQJ�FRQGLWLRQV��5HVXOWV�RI�WKDW�simulation are shown for Brazil, China, Europe, India and the United States in Table 19. These results indicate large variations among regions: While new tractor-trailers in Europe consume on average about 36 LGe/100km, trucks of the same category consume more than 59 LGe/100km in India. Truck fuel consumption in Brazil, China and the US is about 30% higher than in Europe. In the cases of India and China, the much higher fuel consumption FDQ�EH�SDUWO\�H[SODLQHG�E\�WKH�KLJKHU�SD\ORDG��6WLOO��PXFK�RI�WKH�IXHO�HI¿FLHQF\�JDS�LV�EDVHG�on technology differences.

95
Although no heavy-duty vehicle fuel economy regulation is yet implemented in Europe, high fuel prices have clearly incentivised manufacturers and hauling companies to opt for better technology. Since fuel costs constitute a major part of hauling costs, high fuel prices have a strong impact on the economics of hauling companies.
Policy support
$�SRZHUIXO� LQVWUXPHQW� IRU� LQFHQWLYLVLQJ� WUXFN�PDQXIDFWXUHUV� WR�RIIHU�PRUH�HI¿FLHQW� WUXFNV��and haulers to buy them, would be to completely cut fuel subsidies where still applied. Furthermore, fuel taxes on diesel would need to be increased to a level where fuel costs become a decisive factor in consumer decisions. This is generally when additional LQYHVWPHQW�LQWR�PRUH�HI¿FLHQW�YHKLFOHV�SD\V�IRU�LWVHOI�RYHU�RQH�\HDU�RQ�DYHUDJH��LQ�WKH�FDVH�of small hauling companies (IEA 2017a). Nonetheless, the lack of capital to renew truck ÀHHWV��HVSHFLDOO\� LQ� WKH�FDVH�RI�YHU\�VPDOO�KDXOHUV��QHHGV�WR�EH�WDNHQ� LQWR�DFFRXQW��7KLV�could be addressed by offering cheap and targeted credits to small hauling companies.
The introduction of fuel-consumption or CO2-emission standards for rigid trucks and tractor-trailer combinations is another strong measure to be considered in the ASEAN region. Prominent examples are the standards for tractor-trailer combinations in the US and the Chinese HDV standard covering tractor-trailers, straight trucks, dump trucks, coaches and city buses (ICCT 2015e). While the US standard is a corporate average standard based on engine testing and vehicle modelling, forming two separate parts during the approval procedure, the Chinese standard is a pass-fail system. All vehicles need to comply with a dedicated benchmark and cannot be approved for sale in the Chinese market in cases of non-compliance (ICCT 2015e).
Last but not least, consumer information and driver trainings are both important parts of effective HDV fuel economy improvement. So far, in the ASEAN region truck manufacturers are not obliged to disclose any fuel consumption or CO2 emission data. Starting to introduce IXHO�HFRQRP\� ODEHOV� IRU� WUDFWRUV�DQG� ORQJ�KDXO� ULJLG� WUXFNV�ZRXOG�EH�D�JRRG�¿UVW� VWHS� LQ�providing better information to the consumers. Furthermore, training drivers to drive in a PRUH� IXHO�HI¿FLHQW�PDQQHU� FDQ� EH� HDVLO\� DGGHG� WR� H[LVWLQJ� FRXUVHV� WR� REWDLQ� WKH� WUXFN�driving licence. This is especially true as a large share of trucks used and sold in AMS still have manual transmission.
5.7.2 Electric vehicles and shared mobility
According to IEA’s 2017 Global Electric Vehicle Outlook (EVI 2017), new EV registrations hit a sales record in 2016, accounting for more than 750,000 vehicles sold worldwide. With the global passenger car sales accounting for almost 70 million vehicles in the same year, the share of electric cars increased to a little more than 1%. China, by far the largest EV market, accounted for almost 40% of global EV sales.
By 2016 the global EV vehicle stock had reached about 2 million cars (Figure 43), with China and the US home to more than half of the global EV stock. So far, battery electric vehicles make up more than two-thirds of the global EV stock. The remaining third are plug-in hybrids which can both be plugged-in to charge a battery as well as use an on-board, petrol-fuelled engine to power the vehicle, which are mainly sold in Europe, Japan and the US.

96
Figure 41: Global electric vehicle stock by countrySource: IEA 2017Note: The electric car stock shown here is primarily estimated on the basis of cumulative sales since 2005. When DYDLODEOH��VWRFN�QXPEHUV�IURP�RI¿FLDO�QDWLRQDO�VWDWLVWLFV�KDYH�EHHQ�XVHG��SURYLGHG�WKH\�KDYH�JRRG�FRQVLVWHQF\�with expected trends in sales.
Although electric vehicle sales are strong, they still are mainly driven by policy support. According to IEA analysis (IEA 2017), ownership costs of BEVs and PHEVs were still VLJQL¿FDQWO\�KLJKHU�ZKHQ�FRPSDUHG�WR�FRQYHQWLRQDO�FDUV�LQ�������)LJXUH����VKRZV�SRZHUWUDLQ�(including the engine, transmission and energy storage) and fuel costs for conventional cars (ICE), battery electric vehicles (BEV) and plug-in hybrids (PHEV) for the US, China, Japan and Europe for the years 2015 and 2030. Fuel costs comprise cumulative costs for gasoline and/or electricity (including taxes) over a period of 3.5 years, as well as potential individual infrastructure costs for home charging, which are not covered in the fuel costs.
Figure 42: Powertrain and fuel costs for conventional cars, battery electric vehicles and plug-in hybrids for the \HDUV������DQG������IRU�WKH�86��&KLQD��-DSDQ�DQG�(XURSHSource: IEA 2017
The analysis shows that in 2015, BEVs are on average USD 3,000 to USD 6,000 more expensive than conventional vehicles based on total cost of ownership over a time of 3.5 years. By 2030, BEVs and PHEVs are fully competitive in Europe, mainly due to high fuel prices and smaller average vehicle size. In the rest of the world, the costs gap is also VLJQL¿FDQWO\�UHGXFHG�E\�WKDW�WLPH�

97
The IEA investigated an additional case in which annual kilometres driven are tripled in order to represent the driving patterns of taxis and shared cars. In this case, BEVs and PHEVs become competitive with conventional cars in all regions by 2030. This analysis underlines WKH�JUHDW� V\QHUJLHV�EHWZHHQ�VKDUHG�PRELOLW\�DQG�YHKLFOH�HOHFWUL¿FDWLRQ��7KH� ODWWHU� UHVXOW�can be of special interest in the context of densely populated urban areas in the ASEAN UHJLRQ��9HKLFOH�HOHFWUL¿FDWLRQ��WRJHWKHU�ZLWK�D�UHGXFHG�IXWXUH�FDU�RZQHUVKLS�UHVXOWLQJ�IURP�an increased use of car sharing, can reduce energy use, emissions and costs dramatically. 7KLV�LV�HVSHFLDOO\�WUXH�VLQFH�VKDUHG�PRELOLW\�KDV�WKH�SRWHQWLDO�WR�VLJQL¿FDQWO\�UHGXFH�XUEDQ�congestion.
Policy support
Fuel economy policies need to be set up to incentivise the sales of electric vehicles right from the beginning: As lined out in earlier sections, fuel-economy or CO2-emission taxation schemes are favourable for electric vehicles, but can be improved by exempting the registration of electric cars from taxation until the market volume has reached a certain level (EVs are exempted from registration taxes in China, Denmark, Germany, India (partly), Netherlands, Norway, Sweden and United Kingdom).
)HHEDWH�VFKHPHV�FDQ�EH�VHW�XS� LQ�D�ZD\� WKDW�YHU\�KLJK�HI¿FLHQF\�RU�YHU\� ORZ�HPLVVLRQ�vehicles are eligible for substantial rebates in the order of several thousand USD (e.g. feebate schemes in Singapore, France).
Average corporate fuel consumption or CO2 emission standards can be set up in a way that EVs are weighted several times their actual sales numbers through the use of multipliers (super credits) or through counting the electricity consumption as zero fuel consumption in order to incentivise manufacturers to bring EVs on the market (e.g. EU LDV CO2 emission standards, US CAFE). Jurisdictions such as China and California have brought Zero-Emission Vehicle standards into place that require automotive companies to produce or VHOO�D�FHUWDLQ�SHUFHQWDJH�RI�WKHLU�QHZ�YHKLFOH�ÀHHW�DV�HOHFWUL¿HG�YHKLFOHV��,W�VKRXOG�EH�QRWHG�that electric vehicles are not necessarily zero emission, but emissions occur at the source of electricity, rather than at the vehicle.
Apart from monetary incentives, soft measures such as preferential access to otherwise restricted zones (e.g. low-emission zones), priority parking, road toll exemptions, the right to use bus lanes etc. provide incentives to buy electric vehicles especially in urban areas.
As of 2018, direct subsidies (e.g. as part of a feebate scheme) or substantial tax exemptions (especially in countries with high vehicle registration taxes) at the time of purchasing an EV have the strongest impact on EV sales: Norway, the Netherlands and Sweden have EV sales share in the order of 3.4% (Sweden) to 6.4% (Norway) while providing monetary incentives in the range of USD 5,000 to USD 15,000 to EV buyers.
5.7.3 Two-wheelers
In ASEAN, two-wheelers are a major mode of transport. In fact, ASEAN has the highest number of two-wheelers per capita in the region. In 2015, almost 10 million motorised two-wheelers were newly registered in the ASEAN region, accounting for almost 20% of global motorcycle sales. Sales of motorcycles peaked in 2011 and have decreased by 15% since

98
then to 2015., . Around 94% of new motorcycles registered in the bloc have a displacement of 50 ccm to 350 ccm (IMMA 2015).
Prospects to fully electrify motorcycles and scooters with moderate engine displacement are high, and already today electric scooters are available at competitive costs, mainly on the Chinese market. In 2016, about 26 million electric two-wheelers were sold in China, with an on-road vehicle population of over 100 million (IEA 2017 EV). This roadmap calculates that increasing shares of electric two-wheelers together with strategies to decarbonise power generation can save more than 1 million tonnes of CO2 by year 2030 in ASEAN, and more than 300 million tonnes of CO2 by 2050, if by then two-wheelers are more than 80% electric and the carbon footprint of power generation is reduced by 70% compared to 2012 levels.
This roadmap therefore suggests providing strong incentives, such as registration tax reductions or tax holidays for manufacturers of two-wheelers.
Figure ��: Motorcycle Sales and Production in ASEAN and the WorldSource: AAF 2017, Marklines 2017
��
����������
"���������
�����������
���!� ���"� ���#� ����� ����� ����� ����� ����� �����
��� �����
�� ��������������
������������ ��������������
��
�����������
�����������
����������
�����
�� ���������� ���

99
6 References
AAF 2017 – ASEAN Automotive Federation Vehicle Sales and Production Statistics; http://www.asean-autofed.com/statistics.html
ACE 2015 – The 4th ASEAN Energy Outlook; ASEAN Centre for Energy 2015; Jakarta, IndonesiaADEME 2011 - Véhicules particuliers vendus en France- Evolution du marché, caractéristiques
environnementales et techniques, Données et Références; ADEME 2011, Valbonne, FranceAPERC 2016 - APEC Energy Demand and Supply Outlook – 6th� (GLWLRQ��$VLDQ� 3DFL¿F� (QHUJ\�
Research Centre, Institute of Energy Economics 2016, Tokyo, JapanAsawutmangkul 2013 – Thailand’s Fuel Economy Policy Development for Passenger Cars and
/LJKW�7UXFNV��3UHVHQWDWLRQ�DW���QG�0HHWLQJ�RI�WKH�$3(&�([SHUW�*URXS�RQ�(QHUJ\�(I¿FLHQF\��Conservation, November 11 2013
&DUDGLVLDF������±�%RQXV�0DOXVௗ��YRLFL�OH�QRXYHDX�EDUqPH�SRXU�������$FFHVVHG�-XQH�������http://www.caradisiac.com/bonus-malus-voici-le-nouveau-bareme-pour-2017-110593.htm
CCAC 2016 – Cleaning Up the Global On Road Diesel Fleet-A Global Strategy to Introduce Low-Sulfur Fuels and Cleaner Diesel Vehicles; Climate and Clean Air Coalition 2016, Paris, France
Colos 2005 – Characterization of Jeepney Vehicle in Metro Manila; Glynda R. Colos, Dr. Karl N.Vergel, Manuel Jose D. Camagay, University of the Philippines Diliman 2005, Manila, Philippines
EEA 2015 – Monitoring CO2 emissions from new passenger cars and vans in 2015; European Environment Agency Report No 27/2016; Luxembourg
(FRGULYHQ� ����� �� (&2'5,9(1� &DPSDLJQ� &DWDORJXH� IRU� (XURSHDQ� (FRGULYLQJ� � 7UDI¿F� 6DIHW\�Campaigns, Ecodriven 2008
GFEI 2014 – International comparison of light-duty vehicle fuel economy: Evolution over 8 years from 2005 to 2013”, GFEI Working paper 11, OECD/IEA 2014, Paris, France
FEV 2012 - Light-Duty Vehicle Technology Cost Analysis – European Vehicle Market (Phase 1); FEV Consulting Inc. 2012, Auburn Hills, Michigan, United States
Fueleconomy.gov 2017, Gasoline Vehicles: Learn More About the New Label, Accessed May 2017; https://www.fueleconomy.gov/feg/label/learn-more-gasoline-label.shtml
GFEI 2016 – Technology and policy drivers of the fuel economy of new light-duty vehicles: comparative analysis across selected automotive markets, GFEI Working paper 12, OECD/IEA 2016, Paris, France
GFEI 2016a – Fuel Economy State of the World 2016 - Time for global action, GFEI 2016, FIA Foundation, London, United Kingdom
*)(,�����E�±�(VWLPDWLQJ�WKH�)XHO�(I¿FLHQF\�7HFKQRORJ\�3RWHQWLDO�RI�+HDY\�'XW\�7UXFNV�LQ�0DMRU�Markets Around the World, GFEI 2016, FIA Foundation, London, United Kingdom
GFEI 2017 – International comparison of light-duty vehicle fuel economy - Ten years of fuel economy benchmarking; GFEI Working Paper 15, OECD/IEA 2017, Paris, France
GIZ 2015 – International fuel prices 2014; Deutsche Gesellschaft für Internationale Zusammenarbeit GIZ GmbH 2015, Eschborn, Germany
*,=�����D�7UDFNLQJ�6XVWDLQDEOH�7UDQVSRUW�LQ�9LHW�1DP��'DWD�DQG�3ROLF\�5HYLHZ�IRU�(QHUJ\�(I¿FLHQF\�and Climate Change 2015; Deutsche Gesellschaft für Internationale Zusammenarbeit GIZ GmbH 2015, Eschborn, Germany
*,=� ����� �� )XHO� (I¿FLHQF\�3ROLFLHV� LQ� WKH� /DQG�7UDQVSRUW� 6HFWRU� LQ�7KDLODQG� ��'DWD�� 3ROLF\� DQG�Analysis; Deutsche Gesellschaft für Internationale Zusammenarbeit GIZ GmbH 2017, Eschborn, Germany
*RRGZLQ�HW�DO��������(ODVWLFLWLHV�RI�URDG�WUDI¿F�DQG�IXHO�FRQVXPSWLRQ�ZLWK�UHVSHFW�WR�SULFH�DQG�LQFRPH��a review: Goodwin, P., Dargay. J. and Hanley, M., 2004. Transport Reviews, 24(3), 275-292
ICCT 2010 - Best Practices for Feebate Program Design and Implementation; http://www.theicct.org/best-practices-feebate-program-design-and-implementation
ICCT 2011 - A Review and Comparative Analysis of Fiscal Policies Associated with New Passenger Vehicle CO2 Emissions; KWWS���ZZZ�WKHLFFW�RUJ�UHYLHZ�DQG�FRPSDUDWLYH�DQDO\VLV�¿VFDO�SROLFLHV

100
ICCT 2011a – Evaluation of parameter-based vehicle emissions targets in the EU-How regulatory design can help meet the 2020 CO2 target; KWWS���ZZZ�WKHLFFW�RUJ�VLWHV�GHIDXOW�¿OHV/publications/ICCT_EUemissionstargets_jun2011.pdf
ICCT 2012 – The Harsh Calculus of Dieselization in India; Accessed July 2017, http://www.theicct.org/blogs/staff/harsh-calculus-dieselization-india
ICCT 2012a - Summary of the EU cost curve development methodology; http://www.theicct.org/sites/GHIDXOW�¿OHV�SXEOLFDWLRQV�,&&7B&RVW&XUYH6XPPDU\BZNS���������SGI
ICCT 2014 – Development of test cycle conversion factors among worldwide light-duty vehicle CO2 emission standards; www.theicct.org/VLWHV�GHIDXOW�¿OHV�SXEOLFDWLRQV�,&&7B/'9�WHVW�F\FOH�conversion-factors_sept2014.pdf
,&&7�����D�±�'ULYLQJ�(OHFWUL¿FDWLRQ�$�*OREDO�&RPSDULVRQ�RI�)LVFDO�,QFHQWLYH�3ROLF\�IRU�(OHFWULF�9HKLFOHV��http://www.theicct.org�VLWHV�GHIDXOW�¿OHV�SXEOLFDWLRQV�,&&7B(9�¿VFDO�LQFHQWLYHVB���������SGI
ICCT 2013 – Reducing CO 2 and fuel consumption from new cars: assessing the near-term technology potential in the EU, KWWS���ZZZ�WKHLFFW�RUJ�VLWHV�GHIDXOW�¿OHV�SXEOLFDWLRQV�,&&7BCostCurveSummary_wkp20121102.pdf
ICCT 2015 – Global passenger vehicle standards; Data tables August 2015 http://www.theicct.org/VLWHV�GHIDXOW�¿OHV/info-tools/pvstds/Global_PV_data_20150803.xlsx
ICCT 2015a – Vehicle Technology Costs: Estimates vs. Reality, www.theicct.org/blogs/staff/vehicle-technology-costs-estimates-vs-reality
,&&7�����E�±�)URP�/DERUDWRU\�WR�5RDG��$������8SGDWH�RI�2I¿FLDO�DQG�³5HDO�:RUOG´�)XHO�&RQVXPSWLRQ�and CO2 Values for Passenger Cars in Europe, www.theicct.org/laboratory-road-2015-update
ICCT 2015c – Methodological notes: global vehicle sales database, December 2015: http://ZZZ�WKHLFFW�RUJ�VLWHV�GHIDXOW�¿OHV�SXEOLFDWLRQV�:RUNLQJB3DSHUBGlobal_Vehicle_Sales_Database_2015-7.pdf
ICCT 2015d – Policies to Reduce Fuel Consumption, Air Pollution and Carbon Emissions from Vehicles in G20 Nations; http://www.theicct.org/policies-reduce-fuel-consumption-air-pollution-and-carbon-emissions-vehicles-g20-nations
ICCT 2015e – Literature Review: Real World Fuel Consumption of Heavy-Duty Vehicles in the United States, China and the European Union; KWWS���ZZZ�WKHLFFW�RUJ�VLWHV�GHIDXOW�¿OHV�SXEOLFDWLRQV�ICCT_HDV_FC_lit-review_20150209.pdf
ICCT 2016 – The power of vehicle taxation schemes; Accessed May 2017, http://www.theicct.org/blogs/staff/the-power-of-vehicle-taxation-schemes
,&&7� ����D� �� &DVH� VWXG\�� 5H¿QHULHV� LQ� 9LHW� 1DP�� http://www.WKHLFFW�RUJ�VLWHV�GHIDXOW�¿OHV�SXEOLFDWLRQV�&DVHB6WXG\B5H¿QHULHVB9LHW�Nam.pdf
,&&7������ ±� ,PSDFW� RI�:RUOG�&ODVV�9HKLFOH�(I¿FLHQF\� DQG�(PLVVLRQV�5HJXODWLRQ� LQ�6HOHFW�*���Countries; http://www.theicct�RUJ�LPSDFWV�RI�ZRUOG�FODVV�YHKLFOH�HI¿FLHQF\�DQG�HPLVVLRQV�regulations-in-G20-countries
IEA 2012 – Technology Roadmap: Fuel Economy of Road Vehicles; OECD/IEA 2012, International Energy Agency, Paris, France
IEA 2012a – Energy Technology Perspectives 2013- Pathways to a Clean Energy System; OECD/IEA 2012, International Energy Agency, Paris, France
IEA 2015 – Energy Technology Perspectives 2015- Mobilising Innovation to Accelerate Climate Action; OECD/IEA 2015, International Energy Agency, Paris, France
IEA 2016 – Energy Technology Perspectives 2016-Towards sustainable urban energy systems; OECD/IEA 2016, International Energy Agency, Paris, France
IEA 2017 – Global EV Outlook 2017-Two Million and Counting; OECD/IEA 2017, International Energy Agency, Paris, France
IEA 2017a – The Future of Trucks-Implications for energy and the environment; OECD/IEA 2017, International Energy Agency, Paris, France
IMMA 2015 – The Shared Road to Safety-A Global Approach for Safer Motorcycling; International Motorcycles Manufacturers Association 2015, Geneva, Switzerland
IRENA & ACE 2016 – Renewable Energy Outlook for ASEAN: a REmap Analysis. International Renewable Energy Agency (IRENA), Abu Dhabi and ASEAN Centre for Energy (ACE), Jakarta, Indonesia

101
KLTSP 2015 – Kuala Lumpur Transport Strategic Plan-ASEAN Transport Strategic Plan 2016-2025, The ASEAN Secretariat 2015, Jakarta, Indonesia
Lopez 2014 – Global Fuel Economy Initiative: Chile case study; Presentation by Gianni Lopez (Centro Mario Molina, Chile) at Sixth Latin American Regional Main Dialogue, 27-29 October, Washington, DC, United States
LTA 2017 – Revised Carbon Emission Based Vehicle Scheme (CEVS), Land Transport Authority of Singapore, Accessed June 2017, https://www.lta.gov.sg/apps/news/page.aspx?c=2&id=8aa03b88-409f-4852-b2df-09077e101468
Malina 2016 – The Environmental Impact of Vehicle Circulation Tax Reform in Germany, CAWM Discussion Paper No. 86 July 2016, University of Münster, Germany
Marklines 2017 – The Global Market for Motorcycles (Part 1): India Leads Global Production and Sales-A Summary of Markets in India, China, Indonesia, Thailand and other ASEAN Nations; https://www.marklines.com/en/report/rep1519_201607
OICA 2016 – World Motor Vehicle Production, http://www.oica.net/category/sales-statistics/Ricardo 2012 – Project Report Analysis of Greenhouse Gas Emission Reduction Potential of Light-
duty Vehicle Technologies in the European Union for 2020–2025; Ricardo Inc. 2012, Van Buren Township, Michigan, United States
Thitiratsakul 2016 – Harmonization of Fuel Quality Standards in ASEAN; Presentation, Petroleum Institute of Thailand 2013, Bangkok, Thailand, http://cleanairasia.org/wp-content/uploads/2016/03/6.-RuengsakThitiratsakul_Thailand_FEB23-PRESENTATION1.pdf
8&�5LYHUVLGH������±�,QWHOOLJHQW�7UDQVSRUWDWLRQ�6\VWHPV�IRU�,PSURYLQJ�7UDI¿F�(QHUJ\�(I¿FLHQF\�DQG�Reducing GHG Emissions from Roadways; Barth et al, University of California in Riverside 2015, Riverside, California, United States
UNECE 2013 - Development of a World-wide Worldwide harmonized Light-duty driving Test Cycle (WLTC), Technical Report, UN/ECE/WP.29/GRPE/WLTP-IG DHC subgroup, United Nations 2013, Geneva, Switzerland
VTPI 2017 - Understanding Transport Demands and Elasticities How Prices and Other Factors Affect Travel Behavior 27 February 2017; Todd Litman Victoria Transport Policy Institute 2017, Victoria, Canada
Footnotes�� $�UHYLHZ�DQG�HYDOXDWLRQ�WKH�YHKLFOH�IXHO�HI¿FLHQF\�ODEHOOLQJ�DQG�FRQVXPHU� LQIRUPDWLRQ�SURJUDPPHV�RI����FRXQWULHV� LV�
DYDLODEOH� DW� KWWSV���ZZZ�WKHLFFW�RUJ�SXEOLFDWLRQV�UHYLHZ�DQG�HYDOXDWLRQ�YHKLFOH�IXHO�HI¿FLHQF\�ODEHOLQJ�DQG�FRQVXPHU�LQIRUPDWLRQ��7KH�UHSRUW�DOVR�LGHQWL¿HV�LQWHUQDWLRQDO�EHVW�SUDFWLFH�
2 Homologation is the process of certifying vehicles or vehicle components to make sure they comply with national or regional environmental and security regulation. New car models need to be homologated to receive the permit for sale in a certain country or region.