ASE TUDIES OF A METHOD FOR PREDICTING PEECH … · World Industries. ... Each case study is...
47
Designing Acoustically Successful Workplaces: C ASE STUDIES OF A METHOD FOR PREDICTING SPEECH PRIVACY IN THE CONTEMPORARY WORKPLACE SUMMARY REPORT , J ANUARY 2003 CHARLES M. SALTER ASSOCIATES I NC. CHARLES SALTER, KEVIN POWELL, DURAND BEGAULT , ROBERT ALVARADO CENTER FOR THE BUILT ENVIRONMENT
Transcript of ASE TUDIES OF A METHOD FOR PREDICTING PEECH … · World Industries. ... Each case study is...

Designing Acoustically Successful Workplaces:
CASE STUDIES OF A METHOD FOR PREDICTINGSPEECH PRIVACY IN THE CONTEMPORARY WORKPLACE
SUMMARY REPORT, JANUARY 2003
CHARLES M. SALTER ASSOCIATES INC.CHARLES SALTER, KEVIN POWELL,
DURAND BEGAULT, ROBERT ALVARADO
CENTER FOR THE BUILT ENVIRONMENT

ACKNOWLEDGMENTS
This study grew out of data analyzed from a post-occupancy survey. The insights of Charlie Huizenga and Steve Murray of CBE, and Tamara Dinsmore and Randy Howder of SOM, spurred this effort. The research proposal was developed jointly with Ken Roy of Armstrong World Industries. Many colleagues at Charles M. Salter Associates suggested changes that clarified both the method and text, particularly Jeff Clukey, Jack Freytag, Harold Goldberg, Tony Nash, Michael Toy, Pamela Vold and Brenda Yee. CBE Partner representatives Kevin Kampschroer (US General Services Administration), Ken Roy (Armstrong World Industries), and David Wyon (Technical University of Denmark, formerly with Johnson Controls) offered editorial suggestions that were instrumental in finalizing the text. David Lehrer (CBE) worked tirelessly with us through many revisions, and is responsible for the report’s graphic clarity. CBE Director Ed Arens’ insight, rigor, and tireless guidance were instrumental through the entire project.
The Center for the Built Environment (CBE) was established in May 1997 at the University of California, Berkeley, to provide timely unbiased information on promising new building technologies and design strategies. The Center's work is supported by the National Science Foundation and CBE's Industry Partners, a consortium of corporations and organizations committed to improving the design and operation of commercial buildings.
CBE’s Industry Partners include:
Armstrong World Industries
Arup
California Department Of General Services
California Energy Commission
EHDD Architects
HOK
Keen Engineering
NBBJ
Pacific Gas & Electric Co.
Skidmore Owings And Merrill, LLP
Tate Access Floors, Inc.
Taylor Engineering Team: Taylor Engineering, The Electrical Enterprise, Southland Industries, Swinerton Builders
Trane
U.S. Department Of Energy (DOE)
U.S. General Services Administration (GSA)
United Technologies Corporation
Webcor Team: Webcor Builders, Critchfield Mechanical, Rosendin Electric, C&B Consulting Engineers
York International Corporation
© Center for the Built Environment (CBE) A National Science Foundation Industry/University Cooperative Research Center
390 Wurster Hall #1839, Berkeley, CA 94720-1839 tel: 510.642.4950 fax: 510.643.5571
[email protected] www.cbe.berkeley.edu

TABLE OF CONTENTS
1.0 Introduction 1
2.0 Method 2
3.0 Open Plan Case Study Results 6
4.0 Private Office Case Study Results 14
5.0 Conference Room Case Study Results 22
6.0 Conclusions 30
Appendix 1: Detailed Method for Speech Privacy Predictor 31
Appendix 2 Construction Details for Acoustical Privacy 38
Appendix 3. Survey Methods and Results 39
Appendix 4: Testing Protocol 41
References 42


DESIGNING ACOUSTICALLY SUCCESSFUL WORKPLACES:
Case Studies of a Method for Predicting Speech Privacy in the Contemporary Workplace
1.0 INTRODUCTION
In surveys of office environments that measure occupants’ satisfaction with their workspace, the intrusion of unwanted sound—noise—vies with temperature as the leading source of dissatisfaction (Harris, 1978, 1991, Sundstrom, 1994, Brill, 2001). Recent research by the Center for the Built Environment supports this finding, with more than 40% of employees responding to CBE’s occupant satisfaction survey reporting that workplace acoustics make it harder for them to do their job (CBE, 2001). Moreover, an elevated level of workplace noise has been shown to increase stress, decrease motivation and is associated with risk factors for musculoskeletal disorder (Evans, 2000).
To improve this situation, architects, interior designers, and facilities management professionals need to be able to translate a proposed design into a specific prediction of acoustical satisfaction with the resulting workspace. Over the past 40 years, acoustical consultants have in fact developed such a method. In the late 1950’s, engineers at Bolt, Beranek & Newman recognized that a majority of acoustical complaints in offices were related to speech privacy—overhearing unwanted conversations or feeling that one is overheard. Building on research at Bell Labs that correlated a listener’s ability to understand words with the ratio between the loudness of a person’s voice and the loudness of the background noise, these engineers demonstrated that a listener’s inability to understand words in a workplace setting is part of this same continuum of signal to noise. They then showed that that a series of objective measurements can establish this ratio and accurately predict an occupant’s satisfaction with their speech privacy (Cavanaugh 1962). Over the past forty years, this method for predicting speech privacy satisfaction with has been simplified (Young, 1965), adapted for use in open plan environments (Pirn, 1971) and consolidated into worksheet formats for both open and closed office environments (Egan, 1972). Versions of this calculation procedure have been published in leading texts on acoustical design, including ones by Cavanaugh (1999), Egan (1988), and Salter (1998).
Acoustical consultants have found these speech privacy calculations useful for analyzing design documents, evaluating full-scale prototypes and identifying problems in fully occupied and functioning buildings. These calculation procedures have not, however, been disseminated widely in the architectural and interior design community. Reasons may include unfamiliar measurement units and concepts, the specialized testing equipment required for prototype and in situ evaluations, a lack of formal testing validated and illustrated in the context of today’s offices, and cost and aesthetics-driven decision making which does not identify the risks of unacceptable acoustics.

2 CBE REPORT: PREDICTING SPEECH PRIVACY IN THE CONTEMPORARY WORKPLACE
This paper presents an updated, simple, easy-to-use version of a predictive methodology, the Speech Privacy Predictor (SPP). SPP is intended to help those designing, furnishing or retrofitting open plan and private offices. To illustrate the application of the SPP method, nine case studies are described below. These case studies document acoustical conditions in an office building where the Center for the Built Environment had previously conducted an occupant survey. In layout and utilization, this building is representative of a typical modern office—large open plan areas, ubiquitous telephones with built-in speakerphones, distributed common areas, and widespread use of computers. It is also typical of the acoustical shortcomings of modern offices: CBE’s occupant satisfaction survey had detected significant occupant dissatisfaction with speech privacy.
Each case study is designed to demonstrate how the SPP calculation is performed. The case studies evaluate the reliability of the SPP method, by comparing predicted results with measurements of actual acoustic conditions as well as the subjective level of acoustic dissatisfaction reported by those who had taken the CBE Survey.
Results of these comparisons show broad agreement between the predictive tool, measured acoustic conditions, and surveyed employee dissatisfaction. The SPP method therefore appears to be a viable tool for designing to achieve good acoustical environments. This finding is especially noteworthy because while poor speech privacy has been shown to reduce worker motivation, interfere with concentration and compromise the security of meetings and confidential discussions, retrofitting office spaces with poor acoustic performance is often an expensive and disruptive solution.
2.0 METHOD
2.1 Building Selection To illustrate the application of the SPP method, and evaluate its effectiveness as a design tool, a series of case studies were conducted in a building where the Center for the Built Environment had conducted a Post Occupancy Evaluation Survey.1 This Class-A office building was constructed in 1980 for its current owner, and contains 650,000 gross square feet of office space. The building’s layout is typical of the modern office: 15% of gross space is used for enclosed private offices and conference rooms, with the remainder used for open plan workstations, common areas, lobbies, circulation, and a variety of other operations. Office equipment is also characteristic of the modern workplace: ubiquitous telephones with built-in speakerphones, computers on nearly every desktop, broad distribution of laser printers, and centrally located areas for photocopying.
While nearly two-thirds of the 687 respondents reported overall satisfaction with their workspace, and nearly three-quarters of respondents expressed overall satisfaction with the building, CBE’s survey had detected significant dissatisfaction with acoustical conditions.2 In contrast to pluralities reporting that lighting, air quality, temperature, 1 This survey was administered in January 2001, and asked occupants to rank their satisfaction with a number of attributes of their building. Questions ranged from building-wide attributes, such as the perceived quality of the grounds, lobby and cleanliness, to specific conditions in the occupant’s work area, such as lighting, office equipment and thermal comfort. The survey’s protocol requires that specific information about the building, including its owner, location and identifiable physical attributes be kept confidential. An overview of the survey’s structure, how the survey was produced and implemented, as well as key acoustical findings is reproduced in Appendix 3. 2 Of the nine major categories surveyed, only acoustical conditions got more votes of dissatisfaction than satisfaction
CBE REPORT: PREDICTING SPEECH PRIVACY IN THE CONTEMPORARY WORKPLACE 3
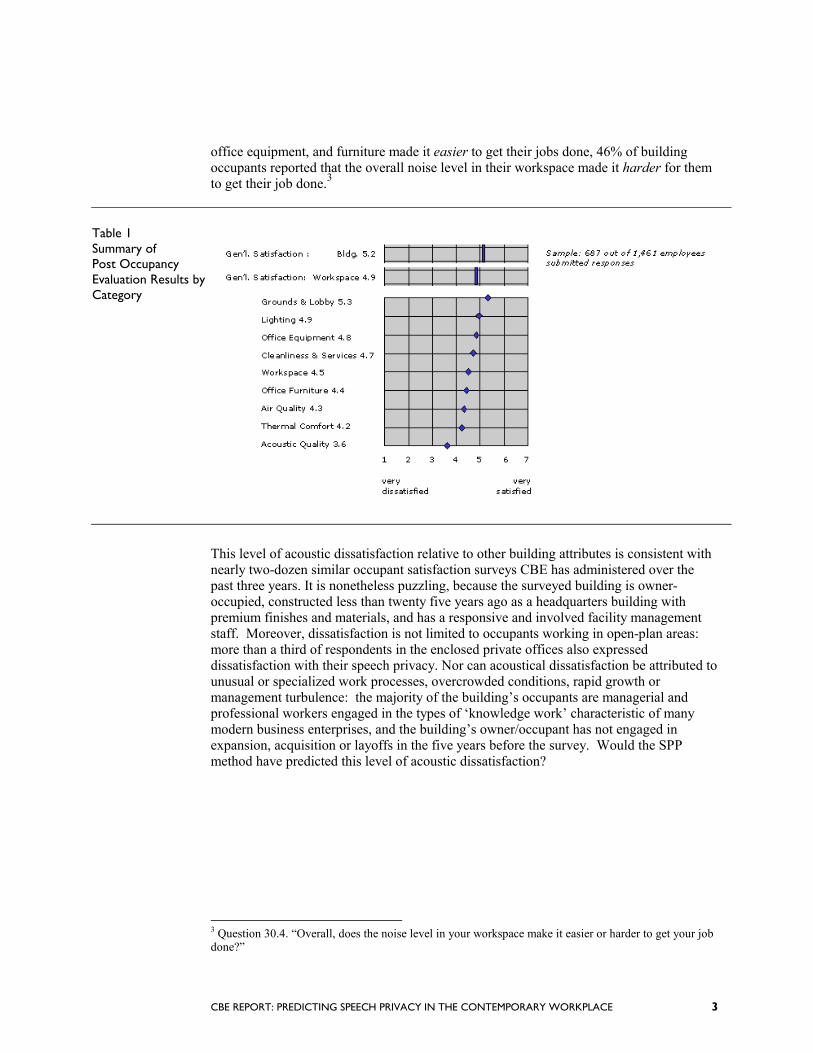
office equipment, and furniture made it easier to get their jobs done, 46% of building occupants reported that the overall noise level in their workspace made it harder for them to get their job done.3
Table 1 Summary of Post Occupancy Evaluation Results by Category
This level of acoustic dissatisfaction relative to other building attributes is consistent with nearly two-dozen similar occupant satisfaction surveys CBE has administered over the past three years. It is nonetheless puzzling, because the surveyed building is owner-occupied, constructed less than twenty five years ago as a headquarters building with premium finishes and materials, and has a responsive and involved facility management staff. Moreover, dissatisfaction is not limited to occupants working in open-plan areas: more than a third of respondents in the enclosed private offices also expressed dissatisfaction with their speech privacy. Nor can acoustical dissatisfaction be attributed to unusual or specialized work processes, overcrowded conditions, rapid growth or management turbulence: the majority of the building’s occupants are managerial and professional workers engaged in the types of ‘knowledge work’ characteristic of many modern business enterprises, and the building’s owner/occupant has not engaged in expansion, acquisition or layoffs in the five years before the survey. Would the SPP method have predicted this level of acoustic dissatisfaction?
3 Question 30.4. “Overall, does the noise level in your workspace make it easier or harder to get your job done?”

4 CBE REPORT: PREDICTING SPEECH PRIVACY IN THE CONTEMPORARY WORKPLACE
2.2 Selection of Case Study Locations CBE’s research protocol allowed us to filter data by floor and office type (enclosed/open plan). We then worked with the building’s facility manager to identify floors that had a representative range of acoustic and work conditions, and responses that tracked with the overall building.4 OPEN PLAN CASE STUDIES.
The facility manager noted that the physical layout of workstations in the case study floor were representative of those distributed throughout the facility, consisting of standard 8 foot by 10-foot cubicles, enclosed by Herman Miller Action Office I, a 62-inch high acoustical partitions.5 The ceiling finishes were also representative of those found throughout the building, consisting of 2-x 2-foot mineral-fiber ceiling tiles6 with a noise reduction coefficient (NRC) of 0.557 and a ceiling attenuation class (CAC) of approximately 35.8 Floors were finished with standard carpet tiles. PRIVATE (ENCLOSED) OFFICE CASE STUDIES.
Although the facility manager reported that, building-wide, private offices varied more in size than did open-plan workstations, the private offices we studied were standardized at 10 feet wide by 15 feet deep, and were located in the building core. These offices were constructed of uninsulated steel stud partitions faced with one layer of gypsum board on each side. A solid core wood door and a five-foot expanse of floor to ceiling glazing were part of the corridor-facing wall. Partitions terminated at the underside of the suspended acoustic tile ceiling. Ceiling and floor finishes were identical to open plan areas. CONFERENCE ROOM CASE STUDIES
Narrative comments revealed frequent complaints of sound transfer between private offices and conference rooms, and between the conference rooms themselves. We conducted case studies in three representative conditions: between a large conference room and a private office, between a small conference room and a private office and between a small conference room and a large conference room. Like private offices, conference rooms were located in the building core, and shared the same modular geometry (large conference rooms were 15 feet by 20 feet, small conference rooms 10 feet by 15 feet). Construction assemblies and finishes for conference rooms were nearly 4 Survey results for the selected case study locations showed a level of speech privacy dissatisfaction that was within 10% of the building-wide average response for open plan areas and within 2% of the building-wide average response for the private offices. 5 The building occupant has adopted a new standard of 8’ x 8’ cubes, but at the time of the survey, only limited areas had been redesigned. 6 A portion of the private offices we studied received a higher performing ceiling as part of a 1998 redesign. This ceiling did not produce a noticeable effect in survey data. The open plan case studies were conducted on a floor with a ceiling height of 13 feet while other floors had a 9-foot ceiling height. Again, we were not able to detect significance in survey data. 7 NRC measures the average percentage of noise a material absorbs at four frequencies across the audible spectrum. This key measure of absorption of general office noise is expressed as a single value percentage. 8 CAC rates a structure's efficiency as a barrier to airborne sound at 16 speech frequencies. It is an especially significant measure in providing acoustic privacy between adjacent work areas, where sound can penetrate plenum spaces and carry to other spaces. CAC is stated as a minimum value; CAC minimum 25 is acceptable in open plan offices, while a rating of minimum 35 or 40 is preferred for closed offices. (Reference: ASTM E 1264)

CBE REPORT: PREDICTING SPEECH PRIVACY IN THE CONTEMPORARY WORKPLACE 5
identical to those found in private offices, including the same acoustic tile ceilings, carpeted floors and walls of gypsum board on steel studs, with the corridor facing wall including a solid core door, and an expanse of floor to ceiling glass. No sound absorbing panels were installed on any walls.
2.3 Application of the SPP Method To establish the ratio of intruding speech to the ambient background noise the SPP method considers a pair of adjacent spaces, the source space, where conversation is occurring, and the receive space, where speech privacy is being measured. The calculation procedure simply involves subtracting isolation factors from source factors, in order to produce a single number rating called sound excess for the receive space. Speech-privacy satisfaction can then be plotted as a function of the single number sound excess rating, as illustrated in Figure 2.
To illustrate the SPP method’s application and evaluate whether it would have predicted the unsatisfactory conditions detected by the CBE survey in both open and enclosed office settings, a SPP predictive calculation procedure was performed for each case study location9. These calculations drew on the following information: workstation layout, room surface treatments and materials, partition heights and construction, voice levels, room sizes, and background noise. To test the reliability of the assumed values for the variables involved in these calculations, a series of acoustical measurements and field observations of occupant behavior were also made in each case study location. Predicted and measured results were described in terms of the level of satisfaction predicted by the SPP method, and congruence of these ratings with the CBE survey’s overall finding of occupant satisfaction with speech privacy was evaluated. Table 2 provides an overview of the research design. The worksheets and detailed description of the SPP method’s variables and calculation method are summarized in Appendix 1.
Table 2: Overview of Research Design
PREDICTED VALUES (FROM DESIGN DOCUMENTS)
MEASURED VALUES (FROM FIELD OBSERVATION
& MEASUREMENT)
SOURCE FACTORS A. Sum Source Factors (value) (value)
ISOLATION FACTORS B. Sum Isolation Factors (value) (value)
SOUND EXCESS Source Factors minus Isolation Factors (A-B)
(value) (value)
Predicted Level of Acceptability (value) (value)
9 Testing protocol is described in Appendix 4.

6 CBE REPORT: PREDICTING SPEECH PRIVACY IN THE CONTEMPORARY WORKPLACE
Figure 2: Levels of Speech Privacy Acceptability, per Cavanaugh
SOUND EXCESS LEVEL OF DISSATISFACTION
+3 Mild
+7 Moderate
+12 Strong
>+20 Extreme
3.0 OPEN PLAN CASE STUDY RESULTS
Three open plan case studies are described below. Overall, we found that the level of dissatisfaction predicted by the SPP method correlated with the dissatisfaction with speech privacy expressed in the CBE survey and with measurements of actual acoustical conditions. There was, however, more spread between predicted and measured SPP values than in case studies of private offices and conference rooms. We attribute this spread largely to the greater range of conditions that the SPP procedure must account for in an open plan environment. In this case, better than predicted noise reduction between workstations was achieved by a combination of a partition product that performs better than expected, a greater than usual number of absorptive surfaces, and a noisy HVAC system in one of the three measured locations.

CBE REPORT: PREDICTING SPEECH PRIVACY IN THE CONTEMPORARY WORKPLACE 7
Had these case study locations originally been evaluated with the SPP method, a level of background noise too low for normal speech privacy given the dense spacing of cubicles would have been predicted. Although it may seem counter-intuitive, the most effective way to improve speech privacy in this condition is to introduce background noise in a controlled manner. This is commonly referred to as sound masking, and is typically achieved by placing loudspeakers in the ceiling plenum. These loudspeakers produce evenly distributed noise similar to the
sound of air coming out of an air register. Based on this finding, a sound masking system has been installed in this area as a retrofit, and is currently being tuned and adjusted. Initial response has been positive.
Two additional design issues would have been identified as likely to contribute to a speech privacy problem. First, a lack of appropriately designed and distributed meeting and conference spaces leads occupants to hold impromptu meetings in their cubicles, even though occupants are aware that this will disturb their neighbors. The second design issue that would have been identified is that grid-like layouts of cubicles create an extensive network of circulation ‘streets’ where casual conversation is likely to occur and disturb other occupants. Both of these behaviors were, in fact, observed as contributing significantly to the speech privacy complaints in the space.
FINDING 1: In open plan settings with underfloor air distribution or traditional variable air volume overhead ventilation systems (HVAC), the background sound level will be too low to achieve “normal” speech privacy. In these environments the background sound can be augmented with sound masking system. Adequate absorptive surfaces such as acoustical ceiling and partitions and a carpeted floor will also be required.
FINDING 2: In open plan offices, there should be a distribution of enclosed ‘teaming’ and conference spaces, located proximate to the work area, with good visual access to and effective acoustical separation from the open plan work area to accommodate both formal and informal group conversation.
FINDING 3: In open plan settings a ‘boulevard’ and ‘cul-de-sac’ layout should be used to ensure that impromptu casual conversation occurs away from workstations.

8 CBE REPORT: PREDICTING SPEECH PRIVACY IN THE CONTEMPORARY WORKPLACE
3.1 Case Study 1: Open Plan Workstation to Workstation
In this case study, we observed work-related conversation occurring between two co-workers in a cubicle adjacent to the evaluation space. Even though a nearby HVAC supply air diffuser was mis-adjusted, creating additional background noise and improving the signal-to-noise ratio in this workspace, the occupant commented, “I am disturbed by conversations in adjacent cubes, it makes it difficult to concentrate”.
Plan:
Case Study 1
Although the employees in the adjacent cubicle were maintaining a respectfully quiet conversational voice, it is difficult to accommodate any meeting activity in an open plan workstation. Even if there were a sound masking system, this level of conversational activity given this cubicle spacing would produce “moderate dissatisfaction.”
Narrative comments in the CBE survey offer additional insight into this condition:
We currently don't have a conference room; therefore, meetings are held next to my cubicle. I can usually ignore that noise, but it is extremely difficult and disconcerting to know that the people in these meetings hear my phone calls.
It is very hard to concentrate when people are talking, having meetings, in surrounding cubes.
The other group next to us is very chatty and loud. They are not programmers/developers so they may not need the same amount of quiet I do to complete my job.
The biggest illusion of cubicle dwelling is the illusion of privacy. People sometimes forget that just because they cannot be seen does not mean that they cannot be heard.

CBE REPORT: PREDICTING SPEECH PRIVACY IN THE CONTEMPORARY WORKPLACE 9
Case Study 1 SOURCE FACTORS PREDICTED OBSERVED
A. Voice Source Level (dBA)
Low Voice 54 Conversational 60
B. Speech Privacy Criterion
Normal 9 Normal 9
Sum Source Factors 63 69
ISOLATION FACTORS PREDICTED OBSERVED
C. Distance: Source to receiver (from table)
6 feet 5 N/A
D. Barrier Noise Reduction (from table)
Source to barrier: 3’ Receiver to barrier: 3’
Break in line-of-sight: 1’
8 N/A
C+D Noise Reduction (measured in situ)
13 Measured 17
E. Background Noise (dBA, receiving cubicle)
Typical: Open Plan(without sound
masking system)
40 Measured(Under HVAC
return)
42
Sum Isolation Factors 53 59
SOUND EXCESS PREDICTED OBSERVED
Source factors minus isolation factors
+10 +10
Predicted level of acceptability
Strong dissatisfaction Strong Dissatisfaction
.

10 CBE REPORT: PREDICTING SPEECH PRIVACY IN THE CONTEMPORARY WORKPLACE
3.2 Case Study 2: Workstation to Workstation In this case study, we observed no unusual activities. The occupant of this cubicle and others nearby spoke in low speech levels into their telephones. This voice level is characteristic of the type of speech behavior that is most successfully accommodated in an open plan environment. The very low level of background noise created unsatisfactory speech privacy conditions. The occupant commented, “I can hear others talking but I tune it out. No one can use a speakerphone because it would bother other people”. SPP calculation would suggest that the introduction of 8 bBA of additional background noise through a well-tuned sound-masking system would create acceptable acoustical conditions for this partition system and cubicle layout, assuming the workgroup would consistently maintain the low voice level we observed.
Plan: Case Study 2
Narrative comments in the POE survey offer additional insight into this condition:
Some talking could be classified as productive (one can learn a lot just by overhearing relevant conversations).
I wear hearing protectors (like the jack-hammer guys) when I really want complete concentration. It's amazing how noisy the area can be - not the decibel level, but a number of surrounding cubicles with conversations going on.
No private work conversations can ever be held in my work area because of the lack of privacy.

CBE REPORT: PREDICTING SPEECH PRIVACY IN THE CONTEMPORARY WORKPLACE 11
Case Study 2 SOURCE FACTORS PREDICTED OBSERVED
A. Voice Source Level (dBA)
Low Voice 54 Low Voice 54
B. Speech Privacy Criterion
Normal 9 Normal 9
Sum Source Factors 63 63
ISOLATION FACTORS PREDICTED OBSERVED
C. Distance: Source to receiver (from table)
6 feet 5 N/A
D. Barrier Noise Reduction (from table)
Source to barrier: 3’ Receiver to barrier: 3’
Break in line-of-sight: 1’
8 N/A
C+D Noise Reduction (measured in situ)
13 Measured 17
E. Background Noise (dBA, receiving cubicle)
Typical: Open Plan(without sound
masking system)
40 Measured 37
Sum Isolation Factors 53 54
SOUND EXCESS PREDICTED OBSERVED
Source factors minus isolation factors
+10 +9
Predicted level of acceptability
Moderate-strong dissatisfaction Moderate-strong dissatisfaction

12 CBE REPORT: PREDICTING SPEECH PRIVACY IN THE CONTEMPORARY WORKPLACE
3.3 Case Study 3: Corridor Talkers to Workstation In this case study, we observed an informal conversation occurring between two co-workers from a different work unit taking place in the adjoining corridor. While conversation was occurring, a nearby employee was engaged in technical work requiring analytic concentration. Although the corridor conversation was not loud, it was not possible to accommodate the type of casual, informal conversation that often occurs in circulation spaces (and which is typically one of the desired outcomes of the less formal open space environment) adjacent to a workstation where an occupant’s job required concentration. The occupant commented: “People talk in the corridor near my workstation, it can be distracting.”
Plan: Case Study 3
In this case, the introduction of increased background noise would improve but not remedy the situation. A change in occupancy to a person not requiring speech privacy would be recommended for this area. If redesign could be considered, segregating ‘boulevards’ of office-wide circulation from ‘cul de sacs’ offering workstation access to employees in a given workgroup would be recommended
Three narrative comments in the POE survey offer insight into this finding:
Corridors aren't just around the elevator, etc. but throughout the work area and people stop and talk everywhere. The sound just carries through open space.
The floor plan is arranged so all the traffic goes past the open side of the cubicles. Better design would come up with an alternative route.
I sit near a row of offices. The managers have lots of people in and out of their offices, as they should, but the way the offices are set up, they reflect sound out into the open office. It's very distracting.

CBE REPORT: PREDICTING SPEECH PRIVACY IN THE CONTEMPORARY WORKPLACE 13
Case Study 3 SOURCE FACTORS PREDICTED OBSERVED
A. Voice Source Level (dBA)
Conversational 60 Conversational 60
B. Speech Privacy Criterion
Normal 9 Normal 9
Sum Source Factors 69 69
ISOLATION FACTORS PREDICTED OBSERVED
C. Distance: Source to receiver (from table)
12’ 10 N/A
D. Barrier Noise Reduction (from table)
Source to barrier: 6’ Receiver to barrier: 6’
Slight break in line-of-sight’
5 N/A
C+D Noise Reduction (measured in situ)
15 Measured 12
E. Background Noise (dBA, receiving cubicle)
Typical: Open Plan(without sound
masking system)
40 Measured(under HVAC return)
42
Sum Isolation Factors 55 54
SOUND EXCESS PREDICTED OBSERVED
Source factors minus isolation factors
+14 +15
Predicted level of acceptability
Strong dissatisfaction Strong dissatisfaction

14 CBE REPORT: PREDICTING SPEECH PRIVACY IN THE CONTEMPORARY WORKPLACE
4.0 PRIVATE OFFICE CASE STUDY RESULTS
Three case studies of private offices are described below. Here, too, we found that occupant dissatisfaction predicted by the SPP method correlated broadly with the overall speech privacy dissatisfaction detected in the CBE survey. Moreover, predicted values calculated from design document data corresponded well with values derived from measurement.
Had the design originally been evaluated with the SPP method, a series of options could have been iteratively explored. This process would have begun by identifying employees requiring “confidential” speech privacy and those requiring “normal” speech privacy. Construction assemblies that could achieve the required levels of speech privacy would have then have been recommended. These assemblies would likely have included acoustically upgraded wall construction, and details minimizing the sound transfer between offices where the wall terminates at the underside of a continuous, suspended ceiling. Additional acoustic details to minimize sound leaks at wall penetrations and floor/ceiling connections, as well as methods to minimize the ‘cross talk’ that occurs from unlined ducts running between offices would also have been recommended.
CBE REPORT: PREDICTING SPEECH PRIVACY IN THE CONTEMPORARY WORKPLACE 15
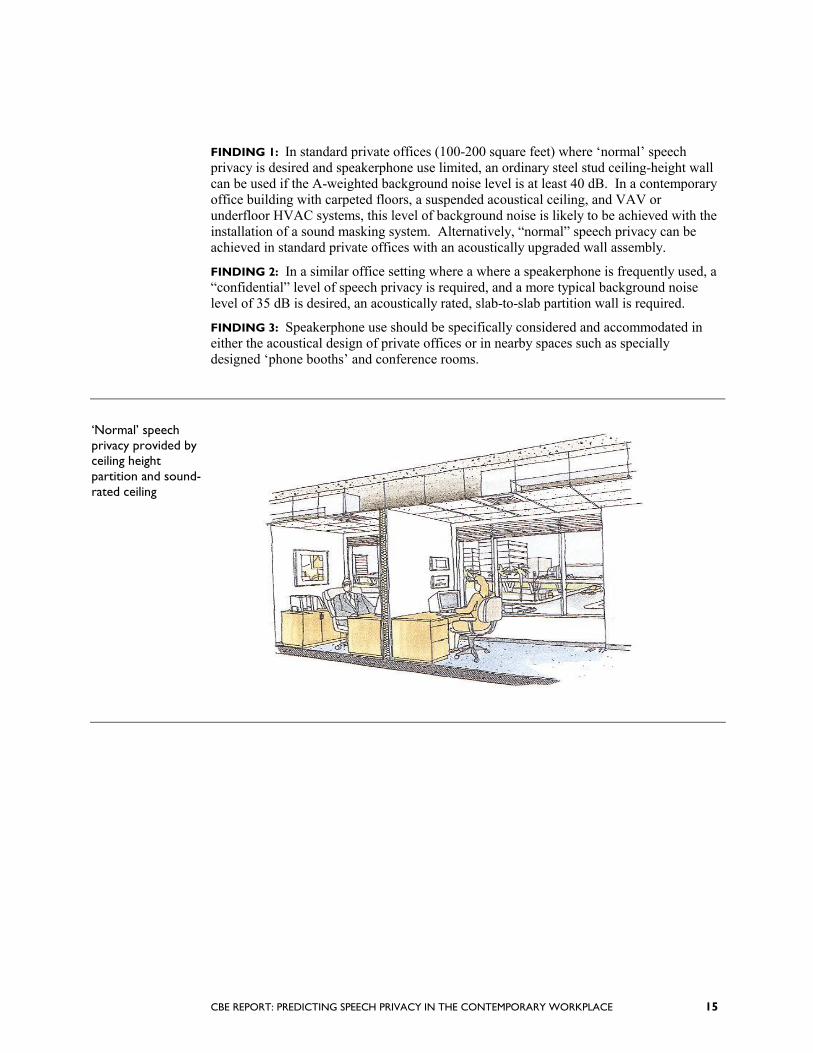
FINDING 1: In standard private offices (100-200 square feet) where ‘normal’ speech privacy is desired and speakerphone use limited, an ordinary steel stud ceiling-height wall can be used if the A-weighted background noise level is at least 40 dB. In a contemporary office building with carpeted floors, a suspended acoustical ceiling, and VAV or underfloor HVAC systems, this level of background noise is likely to be achieved with the installation of a sound masking system. Alternatively, “normal” speech privacy can be achieved in standard private offices with an acoustically upgraded wall assembly.
FINDING 2: In a similar office setting where a where a speakerphone is frequently used, a “confidential” level of speech privacy is required, and a more typical background noise level of 35 dB is desired, an acoustically rated, slab-to-slab partition wall is required.
FINDING 3: Speakerphone use should be specifically considered and accommodated in either the acoustical design of private offices or in nearby spaces such as specially designed ‘phone booths’ and conference rooms.
‘Normal’ speech privacy provided by ceiling height partition and sound-rated ceiling

16 CBE REPORT: PREDICTING SPEECH PRIVACY IN THE CONTEMPORARY WORKPLACE
4.1 Case Study 4: Private Office to Private Office In this case study, we observed speakerphone use in the office adjacent to the evaluation space. The occupant using the speakerphone later told us, “walls are thin. I know my voice carries, and I am concerned that my neighbors can hear me”. A well-known psycho-acoustic feedback mechanism describes the tendency of people to raise their voice when they experience difficulty comprehending the person(s) they are speaking to.10 In an office setting, this frequently occurs when people use speakerphones.11 In the past, private offices have typically been designed to provide normal to confidential speech privacy for informal conversation between two or three people. This voice level is lower than that typically used by speakerphone users. Because speakerphones have become increasingly widespread in office settings in recent years, an organizational decision should be made regarding their appropriate use. One possibility is to restrict speakerphone use to conference rooms and/or specially designed rooms, sometimes referred to as ‘phone booths’. Alternatively, speakerphone use within an office can be accommodated by using an acoustically rated construction that will provide the required level of speech privacy for this voice level.
Plan: Case Study 4
The following narrative comments in the CBE survey offer additional insight into this finding:
[I am dissatisfied with the noise level because] several folks use their speakerphones rather than using a conference room.
10 It is well known that the presence of noise produces an increase in vocal levels. People's systematic speech modifications during noise are an automatic normalization response called the "Lombard effect". During noise, people increase their volume and reduce theirs peaking rate and change both their pitch and articulation, especially for vowels. Lombard (1911), Junqua (1993). 11 Among the causes of poor comprehension: the lack of spatial imaging associated with a monaural source, the overall lack of fidelity in the telephone speaker, and in the case of conference calls, typically poor audibility of some parties to the conversation.

CBE REPORT: PREDICTING SPEECH PRIVACY IN THE CONTEMPORARY WORKPLACE 17
Case Study 4 SOURCE FACTORS PREDICTED OBSERVED
A. Voice Source Level (dBA)
Raised 66 Raised 66
B. Speech Privacy Criterion Confidential 15 Confidential 15
C. Effect of Source Room (from table)
150 sq. ft. 6 150 sq. ft. 6
Sum Source Factors 87 87
ISOLATION FACTORS PREDICTED OBSERVED
D. Partition Rating (STC or NIC)
3 5/8” steel stud 5/8” drywall each
side, slab to ceiling
39 Measured
39
E. Effect of Receive Room (from table)
2
NA
F. Background Noise (dBA, receiving room)
Typ.: Private Office 35 Measured 33
Sum Isolation Factors 76 72
SOUND EXCESS PREDICTED OBSERVED
Source factors minus isolation factors
+11 +15
Predicted level of acceptability
Strong dissatisfaction Strong dissatisfaction

18 CBE REPORT: PREDICTING SPEECH PRIVACY IN THE CONTEMPORARY WORKPLACE
4.2 Case Study 5: Private Office to Private Office In this case-study, we observed no unusual activity in the adjacent office or open plan area. The occupant of the evaluation space complained, “I have quiet neighbors, but I can hear talking from the offices on both sides of me. It’s not that I can hear what they are saying, but that I can hear that people are talking, and it’s distracting”. The level of speech privacy desired by this occupant, inaudibility, is not ordinarily provided in private offices.
Plan:
Case Study 5
It should also be noted that a private office achieves its rated speech privacy only with its door closed. With its door open, speech privacy will be only marginally better than in the surrounding circulation space/office areas. Exacerbating the potential for disturbance by conversation from surrounding areas, private offices are typically designed to have a level of background noise approximately 10dBA below open plan areas. For these reasons, private offices have traditionally been buffered by an administrative space, or placed within a workgroup where overheard conversation is viewed as a benefit of an ‘open door policy’.
The following narrative comments in the CBE survey offer additional insight into this finding:
The area is noisy and it is sometimes difficult to concentrate unless I close my door. Closing my door contradicts my open door policy.
I can hear conversations in the surrounding offices sometimes. It is annoying.

CBE REPORT: PREDICTING SPEECH PRIVACY IN THE CONTEMPORARY WORKPLACE 19
Case Study 5 SOURCE FACTORS PREDICTED OBSERVED
A. Voice Source Level (dBA)
Conversational 60 Conversational 60
B. Speech Privacy Criterion (constant)
Confidential 15 Confidential 15
C. Effect of Source Room (from table)
150 sq. ft. 6 150 sq. ft. 6
Sum Source Factors 81 81
ISOLATION FACTORS PREDICTED OBSERVED
D. Partition Rating (STC or NIC)
3 5/8” steel stud 5/8” drywall each
side, slab to ceiling
39 Measured
37
E. Effect of Receive Room (from table)
0
NA
F. Background Noise (dBA, receiving room)
Typ.: Private Office 35 Measured 38
Sum Isolation Factors 74 75
SOUND EXCESS PREDICTED OBSERVED
Source factors minus isolation factors
+7 +6
Predicted level of acceptability
Moderate dissatisfaction Moderate dissatisfaction

20 CBE REPORT: PREDICTING SPEECH PRIVACY IN THE CONTEMPORARY WORKPLACE
4.3 Case Study 6: Private Office to Private Office As in Case Study 5, we observed no unusual activity in the adjacent offices or open plan areas. In contrast to Case Study 5, however, the occupant of this evaluation space appeared substantially less sensitive to the intrusion of speech. The occupant expressed concern, however, that sound was traveling through the HVAC vent: “I’m generally satisfied. But sometimes I can hear conversation in adjacent offices. Sound seems to travel through vents”
Plan:
Case Study 6
All case-study private offices and conference rooms were constructed with walls that extend only to the underside of a continuous suspended ceiling. Although this wall assembly is less expensive than extending the walls from slab-to-slab, the common ceiling plenum becomes a ‘flanking path’, a way for sound to transfer into the adjacent space by moving around the intervening partition. Other common flanking paths include electrical outlet boxes in the common partition, recessed lighting fixtures in the ceiling, connections at the intersection of one partition with another or with a window mullion, and through shared, unlined ventilation ductwork. In all six case studies of private offices and conference rooms, we found sound leaks at the connection between the ceiling and the partition wall, and cross talk at HVAC supply and return air grills
The following narrative comment in the CBE survey offers additional insight into this finding:
Voices magnify and sound louder in my office than they do outside my office.

CBE REPORT: PREDICTING SPEECH PRIVACY IN THE CONTEMPORARY WORKPLACE 21
Case Study 6 SOURCE FACTORS PREDICTED OBSERVED
A. Voice Source Level (dBA)
Conversational 60 Conversational 60
B. Speech Privacy Criterion (constant)
Confidential 15 Confidential 15
C. Effect of Source Room (from table)
150 sq. ft. 6 150 sq. ft. 6
Sum Source Factors 81 81
ISOLATION FACTORS PREDICTED OBSERVED
D. Partition Rating (STC or NIC)
3 5/8” steel stud 5/8” drywall each
side, slab to ceiling
39 Measured
38
E. Effect of Receive Room (from table)
0
NA
F. Background Noise (dBA, receiving room)
Typ.: Private Office 35 Measured 36
Sum Isolation Factors 76 74
SOUND EXCESS PREDICTED OBSERVED
Source factors minus isolation factors
+7 +7
Predicted level of acceptability
Moderate dissatisfaction Moderate dissatisfaction

22 CBE REPORT: PREDICTING SPEECH PRIVACY IN THE CONTEMPORARY WORKPLACE
5.0 CONFERENCE ROOM CASE STUDY RESULTS
In the CBE survey respondents identified the intrusion of conference room noise into adjacent meeting spaces and private offices as a significant problem. In the three conference room case studies described below, the source of this problem is clear: as part of the office space’s modular design, conference rooms are fashioned from the same wall assemblies and floor and ceiling finishes as private offices. Conference rooms, of course, typically accommodate activities where a louder voice level is used than occurs in a private office. Therefore, a wall assembly that is adequate for a private office is not likely to work well for a conference space.
Had these conference room designs been evaluated with the SPP method at the design stage, acoustically improved wall constructions would have been recommended. An adequate acoustical design would also include details for minimizing sound leaks and the ‘cross talk’ between conference rooms and adjacent spaces connected by unlined ducts and shared ceiling plenums. Sound absorbing wall treatments and upgraded ceilings would likely have also been recommended to minimize reverberation and the build-up of sound within these rooms.
CBE REPORT: PREDICTING SPEECH PRIVACY IN THE CONTEMPORARY WORKPLACE 23
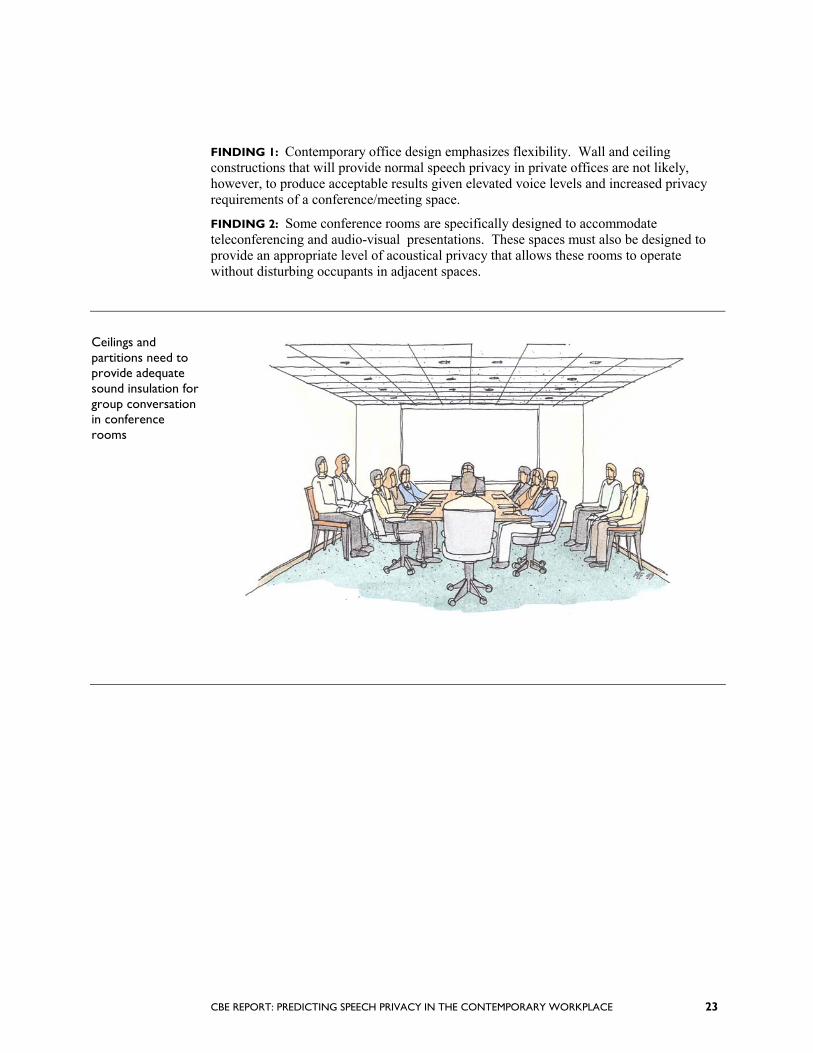
FINDING 1: Contemporary office design emphasizes flexibility. Wall and ceiling constructions that will provide normal speech privacy in private offices are not likely, however, to produce acceptable results given elevated voice levels and increased privacy requirements of a conference/meeting space.
FINDING 2: Some conference rooms are specifically designed to accommodate teleconferencing and audio-visual presentations. These spaces must also be designed to provide an appropriate level of acoustical privacy that allows these rooms to operate without disturbing occupants in adjacent spaces.
Ceilings and partitions need to provide adequate sound insulation for group conversation in conference rooms

24 CBE REPORT: PREDICTING SPEECH PRIVACY IN THE CONTEMPORARY WORKPLACE
5.1 Case Study 7: Large Conference Room to Private Office In this case study, we investigated the level of privacy between a large conference room and the occupant in an adjacent office. Although we did not observe the conference room in use, the presence of audio-visual equipment in this room suggests that the room supports presentations to an assembled group. When speaking to a group, a presenter typically uses a “raised” to “loud” voice level. The room itself lacked absorptive materials on its walls, contributing to a reverberant sound field (sound reflected by the room’s surfaces rather than being absorbed by them). Testing showed that the acoustical performance of the wall assemblies were the same as for private offices.
Plan:
Case Study 7
The following narrative comments in the CBE survey offer additional insight into this finding:
I often hear noise coming from other conference rooms.
Some conference rooms that have shared walls with offices carry sounds from these offices where you can hear every conversation in the office and vice versa.
There is no sound proofing between my office and the conference room. Thus, I can hear conversations, loud laughter, and meeting proceedings. All of this sometimes drives me from my office.

CBE REPORT: PREDICTING SPEECH PRIVACY IN THE CONTEMPORARY WORKPLACE 25
Case Study 7 SOURCE FACTORS PREDICTED OBSERVED
A. Voice Source Level Loud(Presentations)
72 Loud(Presentations)12
72
B. Speech Privacy Criterion Confidential 15 Confidential 15
C. Effect of Source Room 300 sq. ft. 2 300 sq. ft. 2
Sum Source Factors 89 89
ISOLATION FACTORS PREDICTED OBSERVED
D. Partition: STC or NIC
3 5/8” steel stud 5/8” drywall each
side, slab to ceiling
39 Measured
39
E. Effect of Receive Room (from table)
5
NA
F. Background Noise (dBA, receiving room)
Typ.: Private Office 35 Measured 38
Sum Isolation Factors 79 77
SOUND EXCESS PREDICTED OBSERVED
Source factors minus isolation factors
+10 +12
Predicted level of acceptability
Strong dissatisfaction Strong dissatisfaction
12 No conference was taking place, this value was predicted

26 CBE REPORT: PREDICTING SPEECH PRIVACY IN THE CONTEMPORARY WORKPLACE
5.2 Case Study 8: Small Conference Room to Private Office In this case study, we investigated the level of privacy between a small conference room and the occupant in an adjacent office. Although we did not observe the conference room in use, we would predict that the room’s smaller size would encourage the use of a lower voice level than in the larger conference room. Voice levels are still greater than those typically used in a private office, however. Moreover, the room’s lack of absorptive materials and use of standard ceiling height wall construction contribute to a level of acoustical impact even greater than in the larger conference room, where a louder voice would typically be in use. An occupant in an adjacent office confirmed this behavior: “[I] can hear conversations from adjacent offices and from the conference room behind me. The conference room is worse.”
Plan: Case Study 8

CBE REPORT: PREDICTING SPEECH PRIVACY IN THE CONTEMPORARY WORKPLACE 27
Case Study 8 SOURCE FACTORS PREDICTED OBSERVED
A. Voice Source Level Raised 66 Raised13 66
B. Speech Privacy Criterion Confidential 15 Confidential 15
C. Effect of Source Room 150 sq. ft. 6 150 sq. ft. 6
Sum Source Factors 87 87
ISOLATION FACTORS PREDICTED OBSERVED
D. Partition: STC or NIC
3 5/8” steel stud 5/8” drywall each
side, slab to ceiling
39 Measured3 ½” steel stud
5/8” drywall each side
39
E. Effect of Receive Room (from table)
2 NA
F. Background Noise (dBA, receiving room)
Typical: Private Office
35 Measured 37
Sum Isolation Factors 76 76
SOUND EXCESS PREDICTED OBSERVED
Source factors minus isolation factors
+11 +11
Predicted level of acceptability
Strong dissatisfaction Strong dissatisfaction
13 No conference was taking place, this value was predicted.
28 CBE REPORT: PREDICTING SPEECH PRIVACY IN THE CONTEMPORARY WORKPLACE
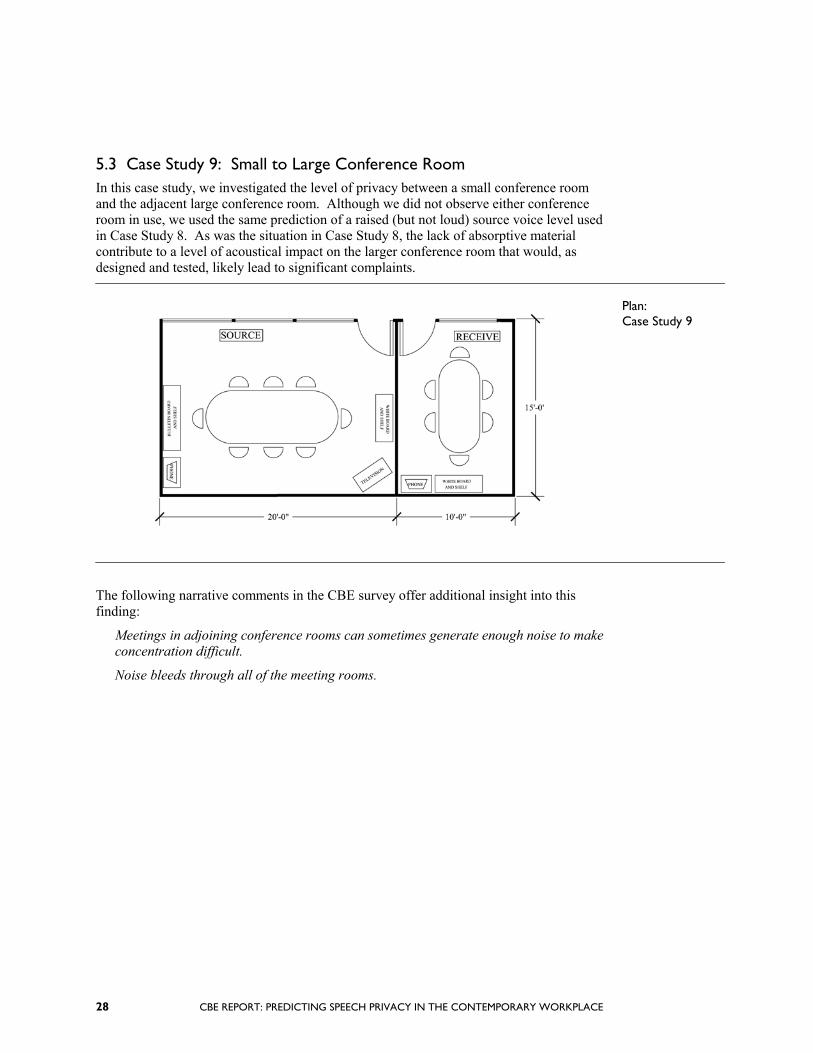
5.3 Case Study 9: Small to Large Conference Room In this case study, we investigated the level of privacy between a small conference room and the adjacent large conference room. Although we did not observe either conference room in use, we used the same prediction of a raised (but not loud) source voice level used in Case Study 8. As was the situation in Case Study 8, the lack of absorptive material contribute to a level of acoustical impact on the larger conference room that would, as designed and tested, likely lead to significant complaints.
Plan: Case Study 9
The following narrative comments in the CBE survey offer additional insight into this finding:
Meetings in adjoining conference rooms can sometimes generate enough noise to make concentration difficult.
Noise bleeds through all of the meeting rooms.

CBE REPORT: PREDICTING SPEECH PRIVACY IN THE CONTEMPORARY WORKPLACE 29
Case Study 9 SOURCE FACTORS PREDICTED OBSERVED
A. Voice Source Level Raised 66 Raised14 66
B. Speech Privacy Criterion Confidential 15 Confidential 15
C. Effect of Source Room 150 sq. ft. 6 150 sq. ft. 6
Sum Source Factors 87 87
ISOLATION FACTORS PREDICTED OBSERVED
D. Partition: STC or NIC
3 5/8” steel stud 5/8” drywall each
side, slab to ceiling
39 3 5/8” steel stud 5/8”
drywall each side, slab to ceiling
39
E. Effect of Receive Room (from table)
3 NA
F. Background Noise (dBA, receiving room)
Typ.: Conference Room
32 Measured 31
Sum Isolation Factors 74 70
SOUND EXCESS PREDICTED OBSERVED
Source factors minus isolation factors
+13 +17
Predicted level of acceptability
Strong dissatisfaction Extreme dissatisfaction
14 No conference was taking place, this value was predicted.
30 CBE REPORT: PREDICTING SPEECH PRIVACY IN THE CONTEMPORARY WORKPLACE
6.0 CONCLUSIONS
Believing in the benefit of an open and collaborative work environment, an ever-greater number of managers, professionals and executives are abandoning private offices and adopting open plan areas with specialized office spaces to accommodate the casual conversations, informal meetings and even speakerphone use that once occurred in private offices. The poor performance of these open plan environments in occupant satisfaction surveys appears to primarily result from their inability to provide the level of speech privacy employees feel necessary for them to concentrate and be productive. The high level of acoustical dissatisfaction identified in these surveys may also be working to negate some of the presumed good will and free exchange of ideas associated with open-plan spaces.15 At the same time, a litigious environment and emphasis on the protection of intellectual property mean that speech privacy is more important than ever before. Clearly, there is a need for a reliable tool enabling building design and management professionals to evaluate whether a given office design will provide a satisfactory level of acoustical satisfaction.
Based on the nine case studies described above, the SPP method appears to offer an effective framework for anticipating speech privacy problems and crafting solutions for proposed spaces. In each case study, the level of acceptability for speech privacy predicted by the method was broadly congruent with the level of acoustic dissatisfaction reported by occupants of these spaces during our in-person interviews and with the aggregated response of occupants in case studies recorded by the CBE’s post-occupancy evaluation survey.
Use of the SPP method during the design process also promise significant cost benefits, because acoustical upgrades are inexpensive when incorporated into the original design, but are substantially more expensive when performed as part of an acoustical retrofit. At the design stage, for example, the wall separating the private offices we studied could have been upgraded to provide an acceptable level of speech privacy simply by adding a 3-inch glass fiber blanket ($0.60 per square foot), a layer of gypsum board ($1.20 per square foot), and selecting a ceiling with a higher transmission loss rating ($1.00 per square foot). Retrofitting these offices now, however, would involve completely rebuilding the wall ($15 per square foot), as well as replacing the ceiling ($3.50 per square foot), nearly ten-times the cost of the original upgrade. (See appendix 2.)
When used in open plan areas, the SPP method showed greater variability in its predicted results. Research is underway to establish the range of this variability, and to compare results obtained with the SPP method to those obtained with ASTM’s widely accepted standard method for evaluating (but not predicting) speech privacy in open plan offices.16 An important next step in disseminating the SPP method will be to develop a companion design guide of best practices in acoustically successful office design, which will augment the SPP method’s application among designers.
15 An extensive discussion of this phenomenon is offered in Brill (2001). 16 ASTM Method E 1130-90 (1994)

CBE REPORT: PREDICTING SPEECH PRIVACY IN THE CONTEMPORARY WORKPLACE 31
APPENDIX 1 DETAILED METHOD FOR USING THE SPEECH PRIVACY PREDICTOR (SPP)
Introduction The Speech Privacy Predictor (SPP) is based on research by Cavanaugh, Farrell, Hirtle and Watters (Cavanaugh 1962). Cavanaugh found that the ratio of intruding speech to the ambient background noise in the office was the best predictor of satisfaction with speech privacy17. Cavanaugh’s rating scheme considers five variables needed to determine the signal-to-noise ratio for a pair of adjacent office spaces. These variables are (1) how loud the voices of people using a space typically are, (2) the level of privacy required in the adjacent room, (3) the background noise occurring in the adjacent room (4) the effect of the size, furnishings and finishes of the adjoining rooms in absorbing sound and (5) the ability of the intervening partition to block sound. Cavanaugh’s calculation procedure combines these variables into a single number rating for sound excess18. Cavanaugh has demonstrated a good statistical fit between the ratings of sound excess and levels of reported satisfaction.
Over the past 40 years, Cavanaugh’s method of predicting an occupant’s acoustic satisfaction based on the ratio of intruding speech to the ambient background noise has proved exceptionally durable. The Cavanaugh method underlies all leading approaches to quantifying office acoustics in North America, including those established by the American Society for Testing and Materials (ASTM, 1994) and the U.S. General Services Administration (GSA, 1975). As modified by Robert W. Young (1965), who simplified the measurement protocol, and by Rein Pirn (1971), who adapted the method for use in open plan offices, the Cavanaugh method forms the basis for the recommended method of evaluating office acoustics in three leading texts on acoustical design Egan (1988), Salter et.al. (1998) and Cavanaugh (1999). SPP draws upon the calculation procedure published in Egan (1988), Salter et.al. (1998) and Cavanaugh (1999).
Calculation Procedure The SPP method calculates sound excess to predict the level of speech privacy acceptability of an office space. Drawing on simple design and space programming data, values representing ‘source’ and ‘isolation’ factors are each summed. Isolation factors are then subtracted from the source factors. Each of these variables are described in detail below, and the calculation procedure summarized in the worksheets shown in Figures A1 and A2. Note that the source space is the location where the occupant is speaking, and where the confidentiality of conversation will be evaluated. The receive space conversely is the location where the speech in the source space is intruding and can potentially be
17 This phenomenon is familiar to anyone who has dined in a crowded, noisy restaurant. Although the people at the adjacent table may be engaged in animated conversation less than four feet away, it is common not to be able to understand a word that they are saying. In fact, a space crowded with people talking is a very private environment, because even when using a raised voice, only the closest, most attentive listener can understand the speaker’s words over the background ‘din’ of conversation. 18 The authors based their work on the ‘Articulation Index’ (French and Steinberg 1947; American National Standards Institute 1969) The Articulation Index relates physical measures of sound to predicted levels of speech intelligibility. Intelligibility refers to the degree to which speech can be clearly understood, and that words and sentences can be correctly identified.

32 CBE REPORT: PREDICTING SPEECH PRIVACY IN THE CONTEMPORARY WORKPLACE
overheard or will be distracting. Note also that the calculation procedure is somewhat different for open plan and enclosed office spaces.
Calculation of Source Factors Source factors include two variables that are shaped by occupant behavior and expectations: speech privacy criteria and source voice level. In certain cases, overheard conversations may aid team processes. In others, the ability to understand even partial sentences may inhibit the ability to discuss sensitive work and personnel issues. 1. VOICE SOURCE LEVEL
Based on programming data, estimate the typical voice level associated with the loudest likely behavior of employees in the workgroup occupying the space. Typical voice levels are summarized in Table 1.
VOICE SOURCE LEVEL
TYPICAL ACTIVITY CRITERIA (dBA)
Low Telephone conversation using a low voice level 54
Conversational Casual conversation between two people in an office setting
60
Raised Conversation of three or more people in a meeting 66
Loud Talking into a speakerphone, delivering a presentation
72
Table 1: Source Voice Levels
2. SPEECH PRIVACY CRITERIA
Acoustical engineers refer to three standard levels of speech privacy, which are summarized in Table 2. Based on programming data, determine which level of privacy is appropriate for the workgroup occupying the space.
LEVEL OF SPEECH PRIVACY
DESCRIPTION CRITERIA (dBA)
Confidential Speech from adjacent space is audible but not intelligible—the listener is aware that a conversation is occurring, but is not able to understand individual words
15
Normal Speech from adjacent space is audible and partially intelligible—the listener has the ability to comprehend an occasional word but never full sentences
9
Marginal Speech from adjacent space is largely understandable 3
Table 2: Speech Privacy Criteria
CBE REPORT: PREDICTING SPEECH PRIVACY IN THE CONTEMPORARY WORKPLACE 33
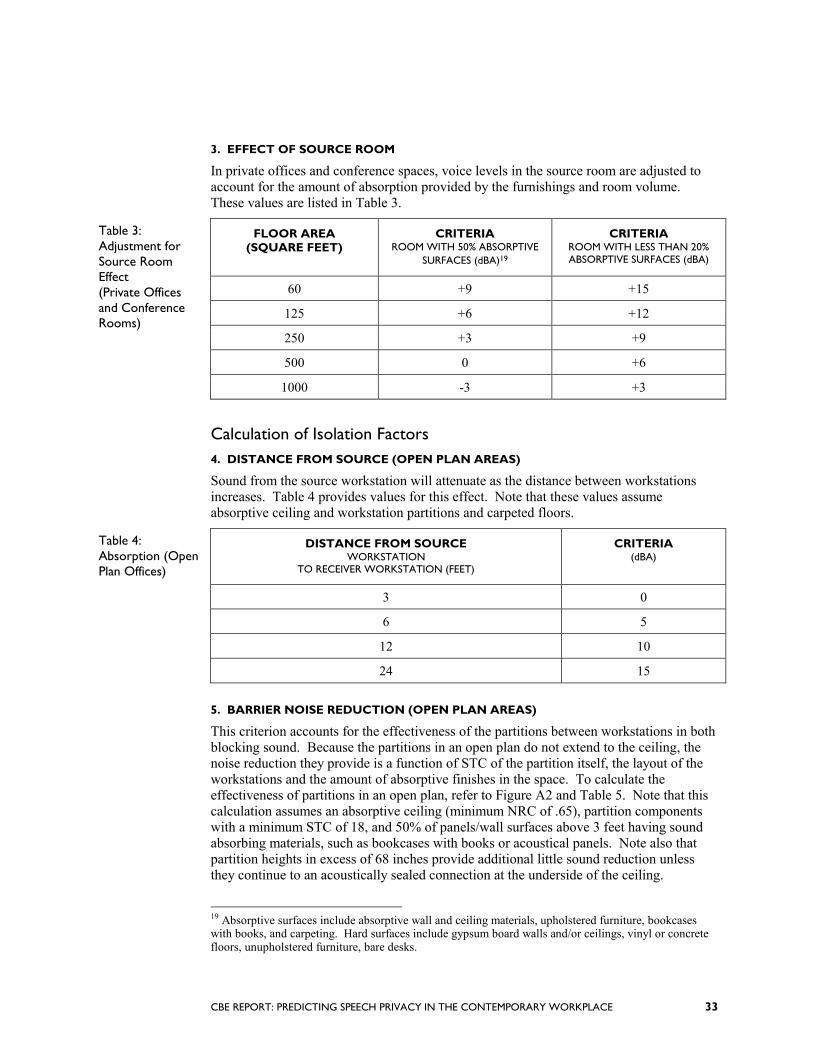
3. EFFECT OF SOURCE ROOM
In private offices and conference spaces, voice levels in the source room are adjusted to account for the amount of absorption provided by the furnishings and room volume. These values are listed in Table 3.
FLOOR AREA (SQUARE FEET)
CRITERIA ROOM WITH 50% ABSORPTIVE
SURFACES (dBA)19
CRITERIA ROOM WITH LESS THAN 20% ABSORPTIVE SURFACES (dBA)
60 +9 +15
125 +6 +12
250 +3 +9
500 0 +6
Table 3: Adjustment for Source Room Effect (Private Offices and Conference Rooms)
1000 -3 +3
Calculation of Isolation Factors 4. DISTANCE FROM SOURCE (OPEN PLAN AREAS)
Sound from the source workstation will attenuate as the distance between workstations increases. Table 4 provides values for this effect. Note that these values assume absorptive ceiling and workstation partitions and carpeted floors.
DISTANCE FROM SOURCE WORKSTATION
TO RECEIVER WORKSTATION (FEET)
CRITERIA (dBA)
3 0
6 5
12 10
Table 4: Absorption (Open Plan Offices)
24 15
5. BARRIER NOISE REDUCTION (OPEN PLAN AREAS)
This criterion accounts for the effectiveness of the partitions between workstations in both blocking sound. Because the partitions in an open plan do not extend to the ceiling, the noise reduction they provide is a function of STC of the partition itself, the layout of the workstations and the amount of absorptive finishes in the space. To calculate the effectiveness of partitions in an open plan, refer to Figure A2 and Table 5. Note that this calculation assumes an absorptive ceiling (minimum NRC of .65), partition components with a minimum STC of 18, and 50% of panels/wall surfaces above 3 feet having sound absorbing materials, such as bookcases with books or acoustical panels. Note also that partition heights in excess of 68 inches provide additional little sound reduction unless they continue to an acoustically sealed connection at the underside of the ceiling.
19 Absorptive surfaces include absorptive wall and ceiling materials, upholstered furniture, bookcases with books, and carpeting. Hard surfaces include gypsum board walls and/or ceilings, vinyl or concrete floors, unupholstered furniture, bare desks.

34 CBE REPORT: PREDICTING SPEECH PRIVACY IN THE CONTEMPORARY WORKPLACE
Table 5: Barrier Noise Reduction (Open Plan)
CRITERIA: BARRIER HEIGHT/DISTANCE SOURCE TO BARRIER
DISTANCE: RECEIVER TO
BARRIER SLIGHT BREAK IN LINE
OF SIGHT DISTANCE: SOURCE
TO BARRIER
1-FOOT BREAK IN LINE OF SIGHT
DISTANCE: SOURCE TO BARRIER
2-FOOT BREAK IN LINE OF SIGHT
DISTANCE: SOURCE TO BARRIER
3 FOOT BREAK IN LINE OF SIGHT
DISTANCE: SOURCE TO BARRIER
3 ft. 6 ft. 12 ft. 3 ft. 6 ft. 12 ft. 3 ft. 6 ft. 12 ft. 3 ft. 6 ft. 12 ft.
3-feet 5 5 5 8 7 7 11 10 9 13 12 12
6-feet 5 5 5 7 7 6 10 9 8 12 11 10
12-feet 5 5 5 7 6 6 9 8 8 12 10 9 6. PARTITION CONSTRUCTION (PRIVATE OFFICES AND CONFERENCE ROOMS)
This criterion accounts for the acoustic performance of the walls separating the source and receive spaces. This value is measured in terms of the Sound Transmission Class (STC) rating of the partition.20 Table 6 lists STC values for standard partition types. Note that these values assume full height (slab to slab) construction, and the use of acoustical sealant at all penetrations and wall connections. Wall performance will be less if there are even small gaps at floor/ceiling connections, corners, doors frames, outlet boxes, or if the wall terminates at the underside of an un-insulated suspended ceiling.
WALL TYPE CRITERIA (STC)
3 5/8” metal studs, 24” o.c., 1 layer 5/8” gypsum board each side 39
Same as above, with 3” glass fiber in cavity 44
Same as above, with 3” glass fiber in cavity and 2 layers 5/8” gypsum board one side
50
Double row of 3 5/8” metal studs on separate plates, 24” o.c., 1 inch between plates, 1 layer 5/8” gypsum board each side, 3 ½” glass fiber both sides
59
Same as above, 2 layers 5/8” gypsum board each side 63
Table 6: STC Values of Typical Wall Types
20 Transmission loss is typically measured in 16 one-third-octave bands and can be expressed through a single-number rating scheme called Sound Transmission Class or STC. Higher STC values represent better noise reduction
CBE REPORT: PREDICTING SPEECH PRIVACY IN THE CONTEMPORARY WORKPLACE 35
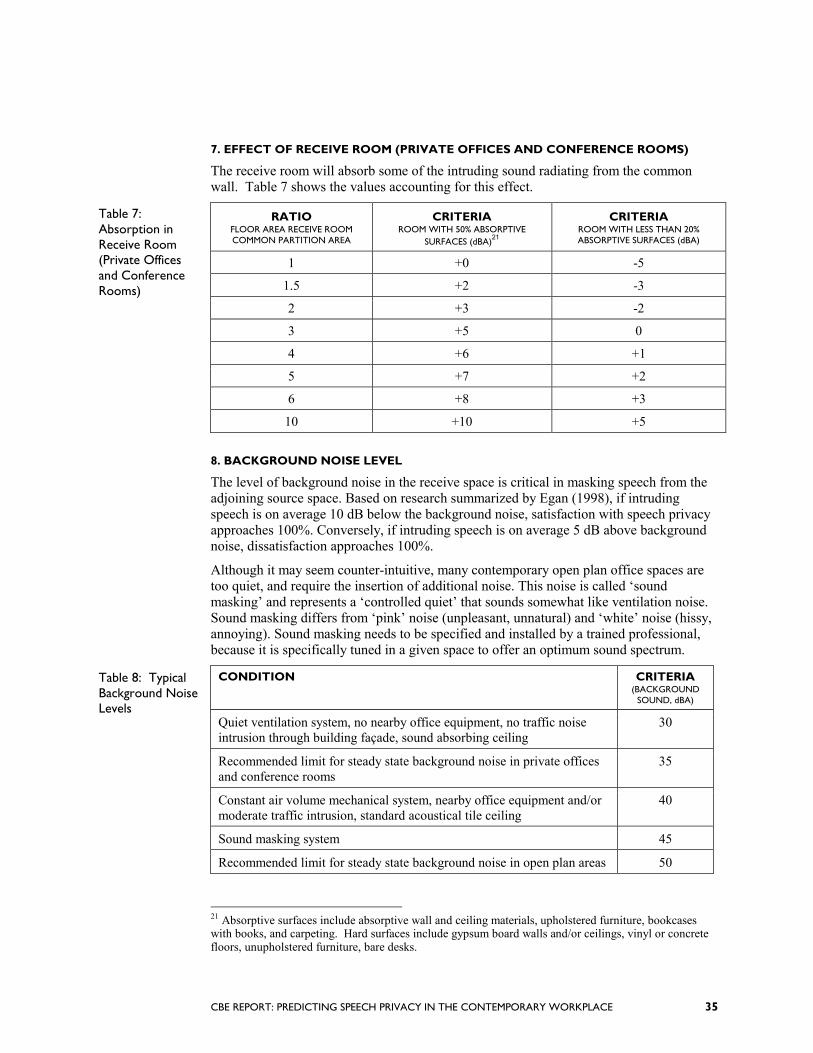
7. EFFECT OF RECEIVE ROOM (PRIVATE OFFICES AND CONFERENCE ROOMS)
The receive room will absorb some of the intruding sound radiating from the common wall. Table 7 shows the values accounting for this effect.
RATIO FLOOR AREA RECEIVE ROOM COMMON PARTITION AREA
CRITERIA ROOM WITH 50% ABSORPTIVE
SURFACES (dBA)21
CRITERIA ROOM WITH LESS THAN 20% ABSORPTIVE SURFACES (dBA)
1 +0 -5
1.5 +2 -3
2 +3 -2
3 +5 0
4 +6 +1
5 +7 +2
6 +8 +3
Table 7: Absorption in Receive Room (Private Offices and Conference Rooms)
10 +10 +5
8. BACKGROUND NOISE LEVEL
The level of background noise in the receive space is critical in masking speech from the adjoining source space. Based on research summarized by Egan (1998), if intruding speech is on average 10 dB below the background noise, satisfaction with speech privacy approaches 100%. Conversely, if intruding speech is on average 5 dB above background noise, dissatisfaction approaches 100%.
Although it may seem counter-intuitive, many contemporary open plan office spaces are too quiet, and require the insertion of additional noise. This noise is called ‘sound masking’ and represents a ‘controlled quiet’ that sounds somewhat like ventilation noise. Sound masking differs from ‘pink’ noise (unpleasant, unnatural) and ‘white’ noise (hissy, annoying). Sound masking needs to be specified and installed by a trained professional, because it is specifically tuned in a given space to offer an optimum sound spectrum.
CONDITION CRITERIA (BACKGROUND
SOUND, dBA)
Quiet ventilation system, no nearby office equipment, no traffic noise intrusion through building façade, sound absorbing ceiling
30
Recommended limit for steady state background noise in private offices and conference rooms
35
Constant air volume mechanical system, nearby office equipment and/or moderate traffic intrusion, standard acoustical tile ceiling
40
Sound masking system 45
Table 8: Typical Background Noise Levels
Recommended limit for steady state background noise in open plan areas 50
21 Absorptive surfaces include absorptive wall and ceiling materials, upholstered furniture, bookcases with books, and carpeting. Hard surfaces include gypsum board walls and/or ceilings, vinyl or concrete floors, unupholstered furniture, bare desks.

36 CBE REPORT: PREDICTING SPEECH PRIVACY IN THE CONTEMPORARY WORKPLACE
FIGURE A1: SPEECH PRIVACY ANALYSIS PROCEDURE FOR OPEN PLAN OFFICES
Adapted from Cavanaugh (1962), Young (1965), Pirn (1971) and Egan (1972).
SOURCE FACTORS
A. Voice Source Level Value from Table 1 A
B. Speech Privacy Criterion Value from Table 2 B
Sum Source Factors A+B
ISOLATION FACTORS
C. Distance from Source Value from Table 4 C
D. Barrier Noise Reduction Value from Table 5 D
E. Background Noise Value from Table 8 E
Sum Isolation Factors C+D+E
SOUND EXCESS
Sum Source Factors – Sum Isolation Factors
(A+B) – (C+D+E)
Predicted Level of Acceptability Value from Figure 2, pg. 6

CBE REPORT: PREDICTING SPEECH PRIVACY IN THE CONTEMPORARY WORKPLACE 37
FIGURE A2: SPEECH PRIVACY WORKSHEET FOR ENCLOSED OFFICES
Adapted from Cavanaugh (1962), Young (1965), and Egan (1972).
SOURCE FACTORS
A. Voice Source Level Value from Table 1 A
B. Speech Privacy Criterion Value from Table 2 B
C. Effect of Source Room Value from Table 3 C
Sum Source Factors A+B+C
ISOLATION FACTORS
D. Partition STC or NIC Value from Table 6 C
E. Effect of Receive Room Table from Table 7 E
F. Background Noise (Receive Room)
Value from Table 8 F
Sum Isolation Factors D+E+F
SOUND EXCESS
Sum Source Factors minus Sum Isolation Factors
(A+B+C) – (D+E+F)
Predicted Level of Acceptability Value from Figure 2, pg. 6

38 CBE REPORT: PREDICTING SPEECH PRIVACY IN THE CONTEMPORARY WORKPLACE
APPENDIX 2: CONSTRUCTION DETAILS FOR ACOUSTICAL PRIVACY
Typical “as built” partition for private offices
Recommended acoustical design for private offices with ‘normal’ speech privacy

CBE REPORT: PREDICTING SPEECH PRIVACY IN THE CONTEMPORARY WORKPLACE 39
APPENDIX 3: SURVEY METHODS AND RESULTS
This report presents the results from a Post Occupancy Evaluation of a high rise commercial office building in San Francisco, CA. The assessment took place in the form of a web-based survey that was administered between November 27, 2000 and December 5th, 2000. Participation in the survey was voluntary and anonymous. Responses were collected via the Internet and recorded to a database hosted at a third party vendor. The project was sponsored jointly by CBE and the building’s owner.
Employees received an e-mail inviting them to take the survey. An additional 51 employees without an e-mail address were sent a hard copy letter inviting them to take the survey at a series of computers at the set up for that purpose. Respondents were advised that the purpose of the survey was to elicit quantitative information on how successful their building was in meeting its design goals, and that this information would be used by the building’s owners, managers, consultant team, maintenance personnel and CBE research staff to develop scenarios for an improved building.
A total of 687 employees logged on to the survey, an overall response rate of 47%. The resulting report contained only aggregated, anonymous results. Any information disclosing what an individual employee said has been removed.
The survey covered twelve general areas of the work environment in a commercial office building. Respondents were asked to evaluate their "satisfaction" with aspects of these general areas. The survey employed a mix of yes/no questions and 7-point satisfaction scales that range from "very satisfied" to "very dissatisfied". In most cases, respondents who indicated "dissatisfaction" (the lowest two points on the scale) with a particular aspect were branched to a follow up screen probing them for more information about the nature of their dissatisfaction. Respondents who indicated higher satisfaction moved directly to the next survey topic. Where applicable, respondents were also asked to assess the impact of these general areas of the work environment on their effectiveness in getting their job done.
Screen capture from on-line survey
In order to analyze the data, responses to each satisfaction question have been counted in three bins: "Dissatisfied", the bottom three points on the 7-point scale; "Neutral", the middle point on the scale; and "Satisfied" the top three points on the standard scale. Importance questions have been evaluated in a similar way with three bins: "Low Importance", "Neutral", and "High Importance". For each question the data are displayed as the percentage of total respondents who responded to the question in each of the three bins. In this way the responses to various questions can be ranked and compared against one another. Each page of the survey also included space for respondents to make comments, including a "general comments" section at the end of the survey.

40 CBE REPORT: PREDICTING SPEECH PRIVACY IN THE CONTEMPORARY WORKPLACE
Results for Acoustics Questions Selected survey results are illustrated in the table below.
Survey Question: How satisfied are you with the noise level in your office? (noise generated by things other than your own work)
Survey Question: How satisfied are you with your sound privacy? (ability to have conversations without your neighbors overhearing and vice versa)?
Building Systems The building’s mechanical system is typical of the majority of Class-A office space constructed during the past 30 years. Structurally, the building has a steel frame with metal deck/lightweight concrete floors. Perimeter glazing is fixed. HVAC is a variable air volume (VAV) system supplied from diffusers surrounding light fixtures. Return air is ducted. Ceilings are 2’ x 2’ acoustical tile suspended 2-6”’ below the floor deck above. 2 x 4 ceiling fixtures with specular parabolic lenses supply direct overhead lighting. Most open plan areas are laid out adjacent to the perimeter, with private offices, conference rooms, circulation and service spaces in the core. Windows have horizontal blinds.

CBE REPORT: PREDICTING SPEECH PRIVACY IN THE CONTEMPORARY WORKPLACE 41
APPENDIX 4: TESTING PROTOCOL
Measurements were conducted on the Monday, February 12 and Tuesday February 13,
2001. The facility manager characterized occupancy as typical; we observed approximately 80% of workstations and private offices occupied.
In each case study location, occupant behavior was observed to note the location and levels of typical speech activity. A scale drawing of the workstation, office or conference room layout was then made, recording the typical locations of occupants in the source and evaluation spaces and the position of office screens, desks, doors, glazing, telephones, computers, chairs and other acoustically relevant furnishings and finishes. The height and acoustical attributes of the office screens and the ceiling were identified, along with a description of the floor, overhead lighting and ventilation. Digital photographs documented the juxtaposition of workstations and the adjoining environment. When possible, with full understanding of the confidentiality of their response, occupants were interviewed about their expectations for and satisfaction with their speech privacy.
Field measurement of background noise and transmission loss of partitions was then performed. Using a calibrated tape recording system, the typical background noise level was measured at each receiver location. Background sound level was defined in terms of the minimum A-weighted background sound pressure level (Lmin). Lmin represents the lowest background level, independent of single-event sounds such as telephone ringing, that can unintentionally inflate a predicted level of the effectiveness of background noise. The microphone during the recording was slowly moved in an approximately 1-foot-diameter circle about 4 feet above the floor. Measurements included a time period of approximately 4 seconds at each of four positions set at 90 degree intervals in the circle.
In open plan areas, noise reduction from the source to the receiver location was measured as follows. A calibrated loudspeaker generating pink noise was located at height and location observed as most typical of the person(s) talking at the source location. The sound level of the loudspeaker was then measured three feet in front of it and at location observed as most typical of the person(s) sitting at the receive location. The sound level of the loudspeaker was at least 10 dB more than the ambient at the receiver location. Measurements were made following the same procedure as described for the ambient measurement. In private offices and conference rooms, noise reduction was measured as follows: 1-minute space average sound level measurements were conducted in the source and then in the receive room. In the receive room, the reverberation time was measured at five locations.
Acoustical instrumentation used to conduct these tests consisted of the following: the sound source was an ADS 2002 loudspeaker meeting the frequency response and sound level variation requirements set forth in ASTM E1179 for acoustical testing in open-plan offices. Measurements were recorded with a 1/2-inch diameter condenser microphone fitted to a B&K 2230 sound level meter outputting a calibrated signal to a Sony TC-D5M cassette recorder.
42 CBE REPORT: PREDICTING SPEECH PRIVACY IN THE CONTEMPORARY WORKPLACE
REFERENCES
American National Standards Institute (1969). “American National Standard S3.5-1969: Methods for the Calculation of the Articulation Index”, New York: American National Standards Institute ASTM (1994). Method E 1130-90. . “Standard Test Method for Objective Measurement of Speech Privacy in Open Offices Using Articulation Index”, Annual Book of ASTM Standards 2001 Volume 4.06 Boggs, D.H. , and J.R. Simon (1968). “Differential effect of noise on tasks of varying complexity”. Journal of Applied Psychology 52:148-153. Brill, M., S. Margulis, et al. (1984). Using Office Design to Increase Productivity. Buffalo, N.Y.: Workplace Design & Productivity. Brill, M., S. Weidemann and the BOSTI Associates (2001).Disproving Widespread Myths About Workplace Design. Kimball International, Jasper, IN Cavanaugh, W.J., W.R. Farrell, P.W. Hirtle, and B.G. Watters, Bolt Beranek & Newman (1962). "Speech Privacy in Buildings," Journal of the Acoustical Society of America, vol. 34, pp. 475-492 Cavanaugh, W. J. and J. A. Wilkes (1999). Architectural Acoustics. Principles and Practice. New York, NY, Wiley. Center for the Built Environment/Skidmore Owings and Merrill, (2001). “Post Occupancy Evaluation Survey”. (web only resource). Berkeley, California: University of California. DeMarco T., and T. Lister (1987) Peopleware: Productive Projects and Teams. New York: Dorset House Publishing. Egan, M. D. (1972). Concepts in Architectural Acoustics. New York, NY, McGraw Hill. Egan, M. D. (1988). Architectural Acoustics. New York, NY, McGraw Hill. Evans, G. W. and D. Johnson (2000). Stress and Open-Office Noise. Journal of Applied Psychology, Vol. 85, No. 5, 779-783 French, N. R. and J. C. Steinberg (1947). “Factors governing the intelligibility of speech sounds.” Journal of the Acoustical Society of America 19(1): 90-119. Harris, L. (1978). The Steelcase National Study of Office Environments: Do They Work? Grand Rapids, MI , Steelcase, Inc. Harris, L. (1991). The Office Environment Index 1991: Summary of Worldwide Findings. New York: Louis Harris and Associates Junqua, J.-C. (1993). “The Lombard reflex and its role on human listeners and automatic speech recognizers.” J. Acou. Soc. America 93(1): 510-524. Karacek, R., and T. Theorell. (1990). Healthy Work: Stress, Productivity and the Reconstruction of Working Life. New York: Basic Books. Lombard, E. (1911) “Le signe de l’elevation de la voix..” Ann. Maladies Oreille Larynx 37, 101--119 Pirn, Rein. (1971). Acoustical Variables in Open Planning," Journal of the Acoustical Society of America vol. 49 (5), part 1, pp. 1339-1345 Salter, C. M. et. al. (1998). Acoustics. Architecture, Engineering, The Environment. San Francisco, William Stout Publishers

CBE REPORT: PREDICTING SPEECH PRIVACY IN THE CONTEMPORARY WORKPLACE 43
Sundstrom, E., J.P. Town, R.W. Rice, D.P. Osborn and M. Brill (1994). “Office noise, satisfaction, and performance”. Environment and Behavior 26(2): 195-222. U.S. General Services Administration/Geiger & Hamme. (1975). Public Building Service Standard Method of Test Method for the Sufficient Verification of Speech Privacy Potential (SPP) Based on Objective Measurements. Washington, D..C PBS (PCD): PBS-C.2 Young, Robert W (1965). “Re-Vision of the Speech-Privacy Calculation,”. Journal of the Acoustical Society of America, vol. 38 (4), pp. 524-530