ASCOTT RESIDENCE TRUST 2016 FULL YEAR...
27
ASCOTT RESIDENCE TRUST 2016 FULL YEAR UNAUDITED FINANCIAL STATEMENTS ANNOUNCEMENT TABLE OF CONTENTS Item No. Description Page No. Summary of Group Results 1 Introduction 2 1(a)(i) Consolidated Statement of Total Return and Reconciliation Statement 3 – 4 1(a)(ii) Explanatory Notes to Consolidated Statement of Total Return 4 – 6 1(b)(i) Statement of Financial Position 7 1(b)(ii) Explanatory Notes to Statement of Financial Position 7 – 9 1(c) Consolidated Statement of Cash Flows 10 – 11 1(d)(i) Statement of Movements in Unitholders’ Funds 12 – 14 1(d)(ii) Details of Any Change in the Units 14 2 & 3 Audit Statement 15 4 & 5 Changes in Accounting Policies 15 6 Earnings Per Unit (“EPU”) and Distribution Per Unit (“DPU”) 15 – 16 7 Net Asset Value (“NAV”) Per Unit / Net Tangible Assets (“NTA”) Per Unit 16 8 Group Performance Review 17 – 23 9 Variance from Forecast 23 10 Outlook and Prospects 23 11 & 12 Distributions 24 13 General mandate for Interested Person Transactions 24 14 Confirmation pursuant to Rule 720(1) of the Listing Manual 24 15 & 16 Segment Revenue and Results 25 17 Breakdown of Revenue and Total Return 25 18 Breakdown of Total Distributions 25 19 Confirmation pursuant to Rule 704(13) of the Listing Manual 26
-
Upload
nguyenngoc -
Category
Documents
-
view
215 -
download
0
Transcript of ASCOTT RESIDENCE TRUST 2016 FULL YEAR...
ASCOTT RESIDENCE TRUST
2016 FULL YEAR UNAUDITED FINANCIAL STATEMENTS ANNOUNCEMENT
TABLE OF CONTENTS
Item No. Description Page No.
Summary of Group Results 1
Introduction 2
1(a)(i) Consolidated Statement of Total Return and Reconciliation Statement 3 – 4
1(a)(ii) Explanatory Notes to Consolidated Statement of Total Return 4 – 6
1(b)(i) Statement of Financial Position 7
1(b)(ii) Explanatory Notes to Statement of Financial Position 7 – 9
1(c) Consolidated Statement of Cash Flows 10 – 11
1(d)(i) Statement of Movements in Unitholders’ Funds 12 – 14
1(d)(ii) Details of Any Change in the Units 14
2 & 3 Audit Statement 15
4 & 5 Changes in Accounting Policies 15
6 Earnings Per Unit (“EPU”) and Distribution Per Unit (“DPU”) 15 – 16
7 Net Asset Value (“NAV”) Per Unit / Net Tangible Assets (“NTA”) Per Unit 16
8 Group Performance Review 17 – 23
9 Variance from Forecast 23
10 Outlook and Prospects 23
11 & 12 Distributions 24
13 General mandate for Interested Person Transactions 24
14 Confirmation pursuant to Rule 720(1) of the Listing Manual 24
15 & 16 Segment Revenue and Results 25
17 Breakdown of Revenue and Total Return 25
18 Breakdown of Total Distributions 25
19 Confirmation pursuant to Rule 704(13) of the Listing Manual 26
Pg 1 of 26
ASCOTT RESIDENCE TRUST 2016 FULL YEAR UNAUDITED FINANCIAL STATEMENTS ANNOUNCEMENT _________________________________________________________________________________________ Summary of Group Results
4Q
2016
S$’000
4Q 2015
S$’000
Better / (Worse)
%
YTD Dec 2016
S$’000
YTD Dec 2015
S$’000
Better / (Worse)
%
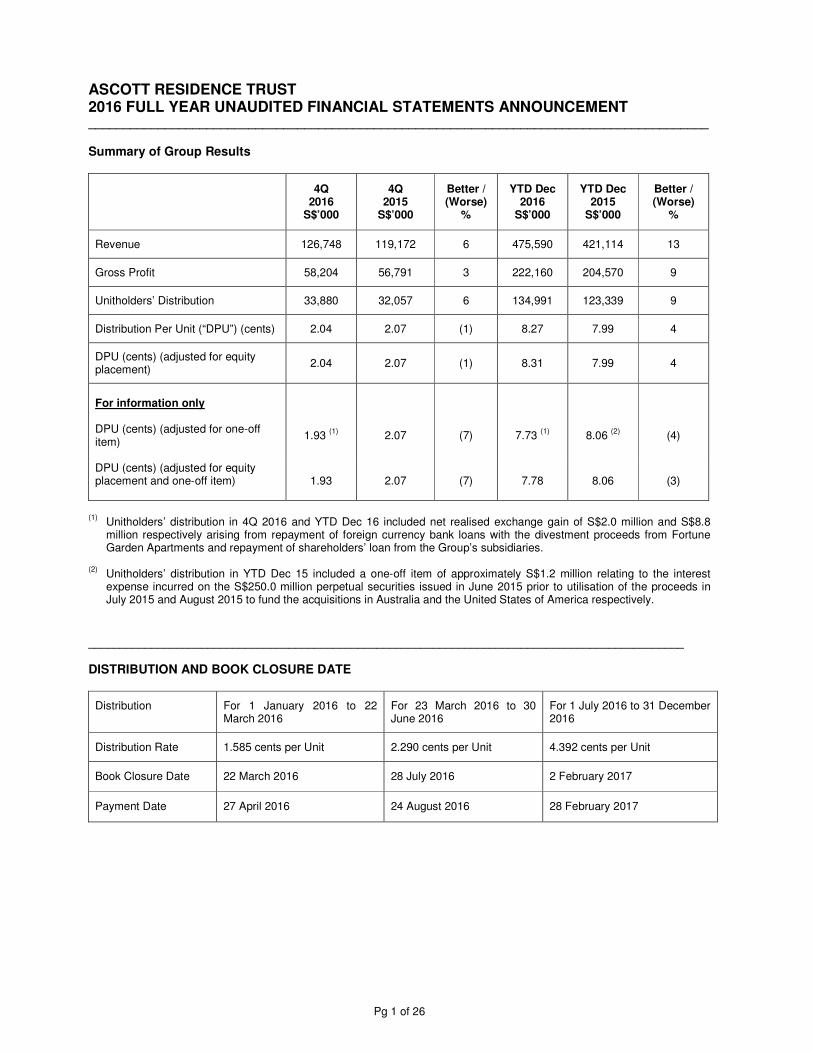
Revenue 126,748 119,172 6 475,590 421,114 13
Gross Profit 58,204 56,791 3 222,160 204,570 9
Unitholders’ Distribution 33,880 32,057 6 134,991 123,339 9
Distribution Per Unit (“DPU”) (cents) 2.04 2.07 (1) 8.27 7.99 4
DPU (cents) (adjusted for equity placement)
2.04 2.07 (1) 8.31 7.99 4
For information only DPU (cents) (adjusted for one-off item)
1.93 (1)
2.07
(7)
7.73 (1)
8.06 (2)
(4)
DPU (cents) (adjusted for equity placement and one-off item)
1.93 2.07 (7) 7.78 8.06 (3)
(1)
Unitholders’ distribution in 4Q 2016 and YTD Dec 16 included net realised exchange gain of S$2.0 million and S$8.8 million respectively arising from repayment of foreign currency bank loans with the divestment proceeds from Fortune Garden Apartments and repayment of shareholders’ loan from the Group’s subsidiaries.
(2) Unitholders’ distribution in YTD Dec 15 included a one-off item of approximately S$1.2 million relating to the interest
expense incurred on the S$250.0 million perpetual securities issued in June 2015 prior to utilisation of the proceeds in July 2015 and August 2015 to fund the acquisitions in Australia and the United States of America respectively.
_______________________________________________________________________________________________
DISTRIBUTION AND BOOK CLOSURE DATE
Distribution For 1 January 2016 to 22 March 2016
For 23 March 2016 to 30 June 2016
For 1 July 2016 to 31 December 2016
Distribution Rate 1.585 cents per Unit 2.290 cents per Unit 4.392 cents per Unit
Book Closure Date 22 March 2016 28 July 2016 2 February 2017
Payment Date 27 April 2016 24 August 2016 28 February 2017

Pg 2 of 26
ASCOTT RESIDENCE TRUST 2016 FULL YEAR UNAUDITED FINANCIAL STATEMENTS ANNOUNCEMENT
INTRODUCTION Ascott Residence Trust (“Ascott Reit”) was established under a trust deed dated 19 January 2006 entered into between Ascott Residence Trust Management Limited (as manager of Ascott Reit) (the “Manager”) and DBS Trustee Limited (as trustee of Ascott Reit) (the “Trustee”). Ascott Reit’s objective is to invest primarily in real estate and real estate related assets which are income-producing and which are used, or predominantly used as serviced residences, rental housing properties and other hospitality assets. It has a portfolio of serviced residences and rental housing properties across Asia Pacific, Europe and United States of America. Ascott Reit’s investment policy covers any country in the world. Ascott Reit was directly held by The Ascott Limited up to and including 30 March 2006. On 31 March 2006, Ascott Reit was listed on the Singapore Exchange Securities Trading Limited with an initial portfolio of 12 properties with 2,068 apartment units in seven cities across five countries (Singapore, China, Indonesia, the Philippines and Vietnam). In 2010, Ascott Reit enhanced the geographical diversification of its portfolio by acquiring 26 properties in Europe. In 2012, Ascott Reit acquired four properties in Kyoto, Singapore, Guangzhou and Germany. Ascott Reit also completed the divestment of Somerset Grand Cairnhill Singapore and simultaneously signed the put and call option agreement to acquire the New Cairnhill Serviced Residence when completed, which is expected to be in 4Q 2017. In 2013, Ascott Reit acquired three properties in China and a portfolio of 11 rental housing properties in Japan. On 23 December 2013, Ascott Reit entered into the sale and purchase agreement to acquire the New Cairnhill Serviced Residence following the satisfaction of the conditions under the New Cairnhill Serviced Residence put and call option agreement. In 2014, Ascott Reit acquired nine properties in four countries (Australia, China, Japan and Malaysia). This marked our maiden presence in five new cities: Dalian, Wuhan and Xi’an in China, Kuala Lumpur in Malaysia and Greater Sydney in Australia. Ascott Reit completed the acquisition of Citadines on Bourke Melbourne, a portfolio of four rental housing properties in Osaka, Japan and the remaining 40% interest in Citadines Shinjuku Tokyo and Citadines Karasuma-Gojo Kyoto on 31 July 2015. On 19 August 2015, Ascott Reit completed the acquisition of Element New York Times Square West, an extended-stay hotel property in New York, the United States of America (“US”). The six properties acquired in 2015 are collectively termed as the “2015 Acquisitions”. On 30 September 2015, Ascott Reit completed the divestment of six rental housing properties in the cities of Kyoto, Saga and Sendai in Japan. Ascott Reit completed the divestment of Salcedo Residences in the Philippines on 2 November 2015. On 23 March 2016, 94,787,000 new units were issued on SGX-ST in relation to the equity placement exercise. The gross proceeds from the equity placement exercise of S$100.0 million were used to fund the acquisition of Sheraton Tribeca New York Hotel in New York, United States of America as announced on 14 March 2016. The acquisition was completed on 29 April 2016 (the “2016 Acquisition”). S$90.5 million of the proceeds were used to pay the purchase consideration of the acquisition of Sheraton Tribeca New York Hotel and S$1.0 million of the proceeds were used to pay for the fees and expenses in connection with the equity placement. Such uses are in accordance with the use of proceeds as disclosed in Ascott Reit’s announcement dated 14 March 2016 in relation to the equity placement. The balance of the excess proceeds of S$8.5 million has been used to repay borrowings from a revolving credit facility. As at 31 December 2016, Ascott Reit’s portfolio comprises 90 properties with 11,627 apartment units in 38 cities across 14 countries. Ascott Reit makes distributions to unitholders on a semi-annual basis, with the amount calculated as at 30 June and 31 December each year for the six-month period ending on each of the said dates. Distributions are paid in Singapore dollar. Since its listing, Ascott Reit has paid 100% of its distributable income.

Pg 3 of 26
1(a)(i) Consolidated Statement of Total Return
GROUP
Better / (Worse)
GROUP
Better / (Worse)
4Q 2016
4Q 2015
YTD Dec 2016
YTD Dec 2015
Note S$’000 S$’000 % S$’000 S$’000 %
Revenue A.1 126,748 119,172 6 475,590 421,114 13
Direct expenses A.2 (68,544) (62,381) (10) (253,430) (216,544) (17)
Gross Profit A.1 58,204 56,791 3 222,160 204,570 9
Finance income 371 385 (4) 1,799 1,603 12
Other operating income A.3 469 126 272 865 438 97
Finance costs (12,693) (13,567) 6 (50,045) (49,856) –
Manager’s management fees (5,751) (5,609) (3) (22,178) (19,820) (12)
Trustee’s fee (120) (119) (1) (476) (436) (9)
Professional fees A.4 (786) (680) (16) (2,739) (2,249) (22)
Audit fees (611) (573) (7) (2,486) (2,365) (5)
Foreign exchange gain / (loss) A.5 1,907 (5,209) 137 4,068 (4,977) 182
Other operating expenses (378) (402) 6 (1,213) (1,014) (20)
Share of results of associate
(net of tax) 3 – n.m. (6) 7 (186) Net income before changes in
fair value of financial derivatives, serviced residence properties and assets held for sale 40,615 31,143 30 149,749 125,901 19
Net change in fair value of
financial derivatives A.6 977 (110) 988 322 (675) 148
Net change in fair value of
serviced residence properties and assets held for sale A.7 (8,254) 52,665 (116) 29,987 84,318 (64)
Profit from divestment A.8 – 6,337 n.m. – 9,924 n.m.
Assets written off A.9 (510) (3,594) 86 (543) (3,717) 85
Total return for the period /
year before tax 32,828 86,441 (62) 179,515 215,751 (17)
Income tax expense A.10 (2,520) (16,583) 85 (31,751) (36,761) 14
Total return for the period /
year after tax 30,308 69,858 (57) 147,764 178,990 (17)
Attributable to: Unitholders / perpetual
securities holders 29,747 68,051 143,312 165,183
Non-controlling interests 561 1,807 4,452 13,807 Total return for the period / year 30,308 69,858 (57) 147,764 178,990 (17)

Pg 4 of 26
RECONCILIATION OF TOTAL RETURN FOR THE PERIOD ATTRIBUTABLE TO UNITHOLDERS TO TOTAL UNITHOLDERS’ DISTRIBUTION
GROUP
Better / (Worse)
GROUP
Better / (Worse)
4Q 2016
4Q 2015
YTD Dec 2016
YTD Dec 2015
Note S$’000 S$’000 % S$’000 S$’000 % Total return for the period / year
attributable to Unitholders / perpetual securities holders 29,747 68,051 143,312 165,183
Net effect of non-tax deductible /
chargeable items and other adjustments A.11 8,973 (31,155) 10,932 (28,414)
Total amount distributable for
the period / year 38,720 36,896 5 154,244 136,769 13
Amount distributable:
- Unitholders 33,880 32,057 134,991 123,339
- Perpetual securities holders 4,840 4,839 19,253 13,430
38,720 36,896 5 154,244 136,769 13
Comprises:
- from operations 22,008 25,856 27,461 33,040 - from unitholders’
contributions 11,872 6,201 107,530 90,299
33,880 32,057 6 134,991 123,339 9
1(a)(ii) Explanatory Notes to Consolidated Statement of Total Return A.1 Revenue and Gross profit
Revenue for 4Q 2016 of S$126.7 million comprised S$16.8 million (13% of total revenue) from serviced residences on Master Leases, S$17.3 million (14%) from serviced residences on management contracts with minimum guaranteed income and S$92.6 million (73%) from serviced residences on management contracts. Revenue for 4Q 2016 increased by S$7.5 million or 6% as compared to 4Q 2015. This was mainly contributed by the additional revenue of S$11.9 million from the 2016 Acquisition, partially offset by the decrease in revenue of S$4.4 million from the existing properties, mainly in China and United Kingdom (arising from depreciation of GBP against SGD). The Group achieved a revenue per available unit (“REVPAU”) of S$148 for 4Q 2016, an increase of 2% as compared to 4Q 2015 due to higher average daily rate from Sheraton Tribcea New York Hotel as compared to the existing properties. On a same store basis, excluding the 2016 Acquisition, REVPAU for 4Q 2016 decreased by 6% as compared to 4Q 2015 due to weaker performance from China and United Kingdom (arising from depreciation of GBP against SGD).
Gross profit for 4Q 2016 of S$58.2 million comprised S$15.2 million (26% of total gross profit) from serviced residences on Master Leases, S$7.3 million (13%) from serviced residences on management contracts with minimum guaranteed income and S$35.7 million (61%) from serviced residences on management contracts. As compared to 4Q 2015, gross profit increased by S$1.4 million or 3%. On a same store basis, gross profit decreased by S$2.4 million or 4%. Please refer to Para 8(a) for a more detailed analysis.

Pg 5 of 26
A.2 Direct expenses include the following items:
GROUP
Better / (Worse)
GROUP
Better / (Worse)
4Q 2016
4Q 2015
YTD Dec 2016
YTD Dec 2015
S$’000 S$’000 % S$’000 S$’000 %
Depreciation and amortisation* (3,668) (3,737) 2 (12,941) (16,634) 22
Staff costs* (15,339) (13,955) (10) (57,635) (47,737) (21)
* Depreciation expense was lower in YTD Dec 2016 due to certain assets being fully depreciated. The increase in staff costs for 4Q 2016 mainly arose due to the 2016 Acquisition. For YTD Dec 2016, staff costs increased due to the 2015 Acquisitions and 2016 Acquisition.
A.3 Other operating income
Other operating income was higher in 4Q 2016 mainly due to reversal of long outstanding security deposits.
A.4 Professional fees
Professional fees was higher in 4Q 2016 as there was reversal of prior year’s accrued expenses no longer required in 4Q 2015, which resulted in lower professional fees.
A.5 Foreign exchange gain
The foreign exchange gain recognised in 4Q 2016 was mainly due to unrealised exchange gain on USD denominated shareholder’s loans and AUD denominated shareholders’ loans extended to the Group’s subsidiaries as a result of the appreciation of USD and AUD against SGD as at balance sheet date respectively. This was partially offset by unrealised exchange loss on USD bank loans in the China subsidiaries’ books, as a result of the appreciation of USD against RMB, and unrealised exchange loss on USD shareholders’ loan in the Philippines subsidiary’s books, as a result of the appreciation of USD against PHP.
A.6 Net change in fair value of financial derivatives
This mainly relates to the fair value change of foreign currency forward contracts.
A.7 Net change in fair value of serviced residence properties and assets held for sale
This relates to the deficit on revaluation of serviced residence properties and assets held for sale recognised in 4Q 2016. The deficit resulted mainly from lower valuation of the Group’s serviced residences in United Kingdom and The United States of America (due to higher property tax), partially offset by higher valuation from properties in Japan, Germany and Spain (due to better operating performance). The valuations for the serviced residence properties (except for Fortune Garden Apartments) were carried out on 31 December 2016. Please refer to paragraph 8(c) for more details.
A.8 Profit from divestment
In 4Q 2015, this relates to the profit from divestment of the Salcedo Residences in Philippines.
A.9 Assets written off
In 4Q 2016, this mainly relates to the disposal of assets arising from the reconfiguration and refurbishment of Somerset Ho Chi Minh City, Somerset Grand Hanoi and Ascott Makati.

Pg 6 of 26
A.10 Income tax expense Taxation for 4Q 2016 was lower by S$14.1 million as compared to the corresponding period last year. This was mainly due to the reversal of deferred tax liability previously provided on the serviced residence properties due to the fair value deficit recognised in 4Q 2016.
A.11 Net effect of non-tax deductible / (chargeable) items and other adjustments include the following:
GROUP
Better / (Worse)
GROUP
Better / (Worse)
4Q 2016
4Q 2015
YTD Dec 2016
YTD Dec 2015
S$’000 S$’000 % S$’000 S$’000 %
Depreciation and amortisation 3,668 3,737 2 12,941 16,634 22
Manager’s management fee
payable / paid partially in units 4,095 4,099 – 15,892 14,768 (8)
Trustee’s fees* 15 18 17 59 58 (2)
Unrealised foreign exchange
(gain) / loss (1,743) 6,447 127 4,844 10,671 55
Net change in fair value of
financial derivatives (Note A.6) (977) 110 988 (322) 675 148
Net change in fair value of
serviced residence properties and assets held for sale (Note A.7) 8,254 (52,665) (116) (29,987) (84,318) (64)
Profit from divestment (Note
A.8) – (6,337) n.m. – (9,924) n.m.
Operating lease expense
recognised on a straight-line basis 1,071 – n.m. 3,208 – n.m.
Assets written off (Note A.9) 510 3,594 86 543 3,717 85
Deferred tax expense (5,120) 8,255 162 4,597 12,636 64
Effect of non-controlling
interests arising from the above (891) 395 326 (1,076) 6,620 116
* This relates to the Singapore properties only and is not tax deductible.

Pg 7 of 26
1(b)(i) Statement of Financial Position
GROUP REIT
31/12/16 31/12/15 31/12/16 31/12/15
Note S$’000 S$’000 S$’000 S$’000
Non-Current Assets
Plant and equipment 51,808 52,506 3,998 4,909
Serviced residence properties B.1 4,504,416 4,289,711 553,002 563,091
Interest in subsidiaries – – 333,396 347,535
Interest in associate 3,505 3,479 3,990 3,958
Deposits B.2 – 20,250 – 20,250
Financial derivatives B.3 7,125 – 3,709 –
Deferred tax assets 5,891 3,983 – –
4,572,745 4,369,929 898,095 939,743
Current Assets
Inventories 201 296 – –
Trade and other receivables B.4 68,712 49,707 2,293,713 2,270,111
Assets held for sale B.5 6,549 84,207 – –
Cash and cash equivalents B.6 143,074 220,467 5,778 38,150
218,536 354,677 2,299,491 2,308,261
Total Assets 4,791,281 4,724,606 3,197,586 3,248,004
Non-Current Liabilities
Interest bearing liabilities B.8 (1,715,659) (1,556,773) (260,323) (279,064)
Financial derivatives B.3 (17,745) (10,313) (13,935) (7,098)
Deferred tax liabilities B.7 (94,078) (88,851) – –
(1,827,482) (1,655,937) (274,258) (286,162)
Current Liabilities
Trade and other payables (132,991) (136,453) (930,747) (747,997)
Interest bearing liabilities B.8 (146,973) (258,404) (35,513) (201,079)
Financial derivatives B.3 (104) (1,222) (104) (1,145)
Provision for taxation (1,468) (4,014) – –
(281,536) (400,093) (966,364) (950,221)
Total Liabilities (2,109,018) (2,056,030) (1,240,622) (1,236,383)
Net Assets 2,682,263 2,668,576 1,956,964 2,011,621
Represented by:
Unitholders’ funds 1(d)(i) 2,200,625 2,189,714 1,559,837 1,614,527
Perpetual securities holders 1(d)(i) 397,127 397,094 397,127 397,094
Non-controlling interests 1(d)(i) 84,511 81,768 – –
Total Equity 2,682,263 2,668,576 1,956,964 2,011,621
1(b)(ii) Explanatory Notes to Statement of Financial Position
B.1 Serviced residence properties
The increase in the Group’s serviced residence properties as at 31 December 2016 was mainly due to the acquisition of Sheraton Tribeca New York Hotel during the year and increase in valuation during the year. These increases were partially offset by foreign currency translation differences arising from translating the Group’s serviced residence properties as result of the weakening of foreign currencies, particularly GBP and RMB against SGD.

Pg 8 of 26
B.2 Deposits The non-current deposits balance as at 31 December 2015 solely relates to the 5% deposit paid for Ascott Orchard Singapore. As at 31 December 2016, the non-current asset has been reclassified to trade and receivables under “Current Assets” as the the acquisition of Ascott Orchard Singapore is expected to be completed by 2017.
B.3 Financial derivatives
The financial derivatives relate to the fair value of interest rate swaps, entered into to hedge interest rate risk, and fair value of cross currency swaps.
B.4 Trade and other receivables The increase in trade and other receivables as at 31 December 2016 was mainly due to the reclassification of the deposit paid for Ascott Orchard Singapore from Non-Current Assets. Plesae refer to paragraph B.2 above.
B.5 Assets held for sale
The decrease in the assets held for sale as at 31 December 2016 was mainly due to the sale of strata units in Fortune Garden Apartments during the period. As at 31 December 2016, there are five remaining strata units, all of which sale and purchase agreements have been signed but titles have not been transferred.
B.6 Cash and cash equivalents
The decrease in the Group’s cash and cash equivalents as at 31 December 2016 was mainly due to acquisition of Sheraton Tribeca New York Hotel, distribution paid to unitholders and perpetual securities holders and interest payments, partially offset by cash generated from operations, proceeds from issue of new units and net proceeds from borrowings.
B.7 Deferred tax liabilities
The increase in the Group’s deferred tax liabilities as at 31 December 2016 was mainly due to the deferred tax liability provided on the fair value surplus recognised for serviced residence properties during the period.
B.8 Interest bearing liabilities
GROUP REIT
31/12/16 31/12/15 31/12/16 31/12/15
S$’000 S$’000 S$’000 S$’000 Amount repayable in one year or less or on demand
- Secured 111,609 257,123 – 199,754
- Unsecured 35,647 1,551 35,647 1,551
Less: Unamortised transaction costs (283) (270) (134) (226)
146,973 258,404 35,513 201,079
Amount repayable after one year
- Secured 925,112 823,077 236,395 177,917
- Unsecured 804,613 746,227 27,590 104,304
Less: Unamortised transaction costs (14,066) (12,531) (3,662) (3,157)
1,715,659 1,556,773 260,323 279,064
Total 1,862,632 1,815,177 295,836 480,143

Pg 9 of 26
Details of collateral The borrowings of the Group are generally secured by: - Mortgage on subsidiaries’ serviced residences and the assignment of the rights, titles and interests with
respect to the serviced residences - Assignment of rental proceeds from the serviced residences and insurance policies relating to the
serviced residences - Pledge of shares of some subsidiaries - Corporate guarantee from the Reit Capital management
Through proactive capital management strategy, the Group’s gearing lowered from 41.0% as at 30 September 2016 to 39.8% as at 31 December 2016. This was well below the 45 percent gearing limit allowable under the property funds appendix issued by the Monetary Authority of Singapore. The average cost of debts was 2.4 percent per annum, with an interest cover of 4.3 times. S$1,547.3 million or 82% of the Group’s borrowings are on fixed interest rates with S$39.2 million due for refinancing in the next 12 months.
Out of the Group’s total borrowings, 8 percent falls due in 2017, 12 percent falls due in 2018, 7 percent falls due in 2019, 15 percent falls due in 2020 and the balance falls due after 2020.
The Manager adopts a proactive capital management strategy and has commenced discussions to refinance the loan facilities due in 2017, ahead of their maturity dates.

Pg 10 of 26
1(c) Consolidated Statement of Cash Flows
GROUP GROUP
4Q 2016
4Q 2015
YTD Dec 2016
YTD Dec 2015
S$’000 S$’000 S$’000 S$’000
Operating Activities
Total return for the period / year before tax 32,828 86,441 179,515 215,751
Adjustments for:
Depreciation and amortisation 3,668 3,737 12,941 16,634
(Gain) / loss on disposal of plant and equipment (78) 100 (86) 81
Assets written off 510 3,594 543 3,717
Operating lease expense recognised on a straight-line basis 1,071 – 3,208 –
Finance costs 12,693 13,567 50,045 49,856
Finance income (371) (385) (1,799) (1,603)
Provision for doubtful debts addition 166 – 283 22
Manager’s management fees payable / paid partially in units 4,095 4,099 15,892 14,768
Unrealised foreign exchange (gain) / loss (1,743) 6,447 4,844 10,671
Net change in fair value of financial derivatives (977) 110 (322) 675
Net change in fair value of serviced residence properties and assets held for sale 8,254 (52,665) (29,987) (84,318)
Profit from divestment – (6,337) – (9,924)
Share of results of associate (3) – 6 (7)
Operating profit before working capital changes 60,113 58,708 235,083 216,323
Changes in working capital 24,707 (9,906) (12,447) (14,772)
Cash generated from operations 84,820 48,802 222,636 201,551
Income tax paid (5,305) (4,200) (22,510) (24,058)
Cash flows from operating activities 79,515 44,602 200,126 177,493
Investing Activities
Acquisition of plant and equipment (4,648) (1,229) (16,694) (11,546) Acquisition of serviced residence properties, net of cash
acquired – (2,779) (214,046) (418,835)
Proceeds from divestment of serviced residence properties – 8,421 – 58,137
Capital expenditure on serviced residence properties (21,687) (12,319) (40,670) (35,235)
Proceeds on disposal of assets held for sale 15,677 5,134 74,512 9,054
Interest received 371 385 1,799 1,603
Proceeds from sale of plant and equipment 120 23 291 154
Cash flows used in investing activities (10,167) (2,364) (194,808) (396,668)
Balance carried forward 69,348 42,238 5,318 (219,175)

Pg 11 of 26
1(c) Consolidated Statement of Cash Flows
GROUP GROUP
4Q 2016
4Q 2015
YTD Dec 2016
YTD Dec 2015
Balance brought forward 69,348 42,238 5,318 (219,175)
Financing Activities
Distribution to Unitholders – – (126,458) (124,711) Distribution to perpetual securities holders (9,627) (9,626) (19,253) (13,366)
Dividend paid to non-controlling interests (1,939) (110) (4,345) (3,382)
Interest paid (15,653) (18,477) (49,272) (48,628)
Payments for acquisition of ownership interests in subsidiaries with no change in control
– (1,536) – (31,552)
Payment of finance lease (746) (702) (2,954) (2,799)
Proceeds from bank borrowings 83,497 154,442 689,283 450,702
Proceeds from issue of medium term notes – 200,000 120,000 280,672
Proceeds from issue of perpetual securities – – – 250,000
Proceeds from issue of new units – – 100,000 –
Payment of issue expenses on issue of new units – – (922) –
Payment of transaction costs on issue of perpetual securities – – (17) (2,774)
Repayment of medium term notes – (150,000) – (150,000)
Repayment of bank borrowings (153,076) (205,727) (790,301) (360,735)
Cash flows (used in) / from financing activities (97,544) (31,736) (84,239) 243,427
(Decrease) / increase in cash and cash equivalents (28,196) 10,502 (78,921) 24,252
Cash and cash equivalents at beginning of the period / year
174,743 210,981 220,467 192,556
Effect of exchange rate changes on balances held in foreign currencies
(3,473) (1,016) 1,528 3,659
Cash and cash equivalents at end of the period / year 143,074 220,467 143,074 220,467

Pg 12 of 26
1(d)(i) Statement of Movements in Unitholders’ Funds
GROUP GROUP
4Q 2016
4Q 2015
YTD Dec 2016
YTD Dec 2015
Note S$’000 S$’000 S$’000 S$’000
Unitholders’ Contribution
Balance as at beginning of period / year 1,447,019 1,421,662 1,428,452 1,476,104
New units issued / to be issued (1)
- equity placement on 23 March 2016 – – 100,000 –
- payment of manager’s management fees in units 4,095 3,887 19,863 14,265
- payment of manager’s acquisition fees in units – 2,903 – 2,903
Issue expense 513 – (922) –
Distribution to Unitholders – – (95,766) (64,820)
Balance as at end of period / year 1,451,627 1,428,452 1,451,627 1,428,452
Operations
Balance as at beginning of period / year 873,582 735,817 805,254 707,167 Total return for the period / year attributable to
Unitholders / perpetual securities holders 29,747 68,051 143,312 165,183
Total return attributable to perpetual securities holders (4,840) (4,839) (19,253) (13,430)
Change in ownership interests in subsidiaries with no change in control (357) 6,225 (540) 6,225
Transfer between reserves – – 51 –
Distribution to Unitholders – – (30,692) (59,891)
Balance as at end of period / year 898,132 805,254 898,132 805,254
Foreign Currency Translation Reserve
Balance as at beginning of period / year (159,676) (13,714) (36,260) (64,084)
Change in ownership interests in subsidiaries with no change in control – (7,215) – (7,215)
Exchange differences arising from translation of foreign operations and foreign currency loans forming part of net investment in foreign operations 6,266 (15,331) (117,150) 35,039
Balance as at end of period / year (153,410) (36,260) (153,410) (36,260)
Capital Reserve
Balance as at beginning of period / year 1,957 2,008 2,008 2,008
Transfer between reserves – – (51) –
Balance as at end of period / year 1,957 2,008 1,957 2,008
Hedging Reserve
Balance as at beginning of period / year (13,821) (13,716) (9,740) (15,117) Effective portion of change in fair values of
cash flow hedges 16,140 3,976 12,059 5,377
Balance as at end of period / year 2,319 (9,740) 2,319 (9,740)
Unitholders’ Funds 1(b)(i) 2,200,625 2,189,714 2,200,625 2,189,714
(1)
These include the units to be issued as partial satisfaction of the portion of the management fees (comprising base fee and performance fee). With effect from 1 January 2016, to be compliant with Monetary Authority of Singapore’s new regulations, the REIT Manager’s performance management fee will only be paid once a year, after the end of the financial year.

Pg 13 of 26
1(d)(i) Statement of Movements in Unitholders’ Funds
GROUP GROUP
4Q 2016
4Q 2015
YTD Dec 2016
YTD Dec 2015
Note S$’000 S$’000 S$’000 S$’000
Perpetual Securities
Balance as at beginning of period / year 401,914 401,749 397,094 149,351
Issue of perpetual securities – – – 250,000
Issue expenses – 132 33 (2,321)
Total return attributable to perpetual securities holders 4,840 4,839 19,253 13,430
Distribution to perpetual securities holders (9,627) (9,626) (19,253) (13,366)
Balance as at end of period / year 1(b)(i) 397,127 397,094 397,127 397,094
Non-controlling Interests
Balance as at beginning of period / year 80,776 79,729 81,768 97,807
Total return for the period / year 561 1,807 4,452 13,807
Dividend paid to non-controlling interests (1,939) (110) (4,345) (3,382)
Change in ownership interests in subsidiaries with no change in control 357 1,053 540
(30,330)
Exchange differences arising from translation of foreign operations and foreign currency loans forming part of net investment in foreign operations 4,756 (711) 2,096 3,700
Effective portion of change in fair values of cash flow hedges – – – 166
Balance as at end of period / year 1(b)(i) 84,511 81,768 84,511 81,768
Equity 1(b)(i) 2,682,263 2,668,576 2,682,263 2,668,576

Pg 14 of 26
1(d)(i) Statement of Movements in Unitholders’ Funds
REIT REIT
4Q 2016
4Q 2015
YTD Dec 2016
YTD Dec 2015
Note S$’000 S$’000 S$’000 S$’000
Unitholders’ Contribution
Balance as at beginning of period / year 1,447,019 1,421,662 1,428,452 1,476,104
New units issued / to be issued (1)
- equity placement on 23 March 2016 – – 100,000 –
- payment of manager’s management fees in units 4,095 3,887 19,863 14,265
- payment of manager’s acquisition fees in units – 2,903 – 2,903
Issue expenses 513 – (922) –
Distribution to Unitholders – – (95,766) (64,820)
Balance as at end of period / year 1,451,627 1,428,452 1,451,627 1,428,452
Operations
Balance as at beginning of period / year 67,219 181,982 192,507 214,631 Total return for the period / year attributable to
Unitholders / perpetual securities holders 49,715 15,364 (30,468) 51,197
Total return attributable to perpetual securities holders (4,840) (4,839) (19,253) (13,430)
Distribution to Unitholders – – (30,692) (59,891)
Balance as at end of period / year 112,094 192,507 112,094 192,507
Hedging Reserve
Balance as at beginning of period / year (4,846) (7,865) (6,432) (11,582) Effective portion of change in fair values of
cash flow hedges 962 1,433 2,548 5,150
Balance as at end of period / year (3,884) (6,432) (3,884) (6,432)
Unitholders’ Funds 1(b)(i) 1,559,837 1,614,527 1,559,837 1,614,527
Perpetual Securities
Balance as at beginning of period / year 401,914 401,749 397,094 149,351
Issue of perpetual securities – – – 250,000
Issue expenses – 132 33 (2,321)
Total return attributable to perpetual securities holders 4,840 4,839 19,253 13,430
Distribution to perpetual securities holders (9,627) (9,626) (19,253) (13,366)
Balance as at end of period / year 1(b)(i) 397,127 397,094 397,127 397,094
Equity 1(b)(i) 1,956,964 2,011,621 1,956,964 2,011,621
(1) Refer to footnote on page 12.
1(d)(ii) Details of any change in the units
REIT
4Q 2016
4Q 2015
YTD Dec 2016
YTD Dec 2015
’000 ’000 ’000 ’000
Balance as at beginning of period / year 1,651,335 1,543,154 1,548,736 1,535,023
Issue of new units:
- equity placement on 23 March 2016 – – 94,787 –
- partial payment of manager’s management fees in units 2,136 3,203 9,948 11,334
- payment of manager’s acquisition fee – 2,379 – 2,379
Balance as at end of period / year 1,653,471 1,548,736 1,653,471 1,548,736

Pg 15 of 26
2. Whether the figures have been audited, or reviewed and in accordance with which auditing standard or practice
The figures have not been audited or reviewed by our auditors. 3. Where the figures have been audited or reviewed, the auditors’ report (including any qualifications or
emphasis of matter) Not applicable. 4. Whether the same accounting policies and methods of computation as in the most recently audited annual
financial statements have been applied Except as disclosed in paragraph 5 below, the Group has applied the same accounting policies and methods of
computation in the preparation of the financial statements for the current reporting period compared with the audited financial statements for the year ended 31 December 2015.
5. If there are any changes in the accounting policies and methods of computation required by an accounting
standard, what has changed, as well as the reasons for the change The Group adopted a number of new standards, amendments to standards and interpretations that are effective for
annual periods beginning on or after 1 January 2016. The adoption of new standards, amendments to standards and interpretations did not result in any significant impact on the financial statements of the Group.
6. Earnings per unit (“EPU”) and distribution per unit (“DPU”) for the financial period
In computing the EPU, the weighted average number of units for the period is used for the computation.
GROUP
4Q 2016
4Q 2015
YTD Dec 2016
YTD Dec 2015
S$’000 S$’000 S$’000 S$’000
Total return for the period / year attributable to Unitholders /
perpetual securities holders 29,747 68,051 143,312 165,183
Less: Total return for the period attributable to perpetual securities holders (4,840) (4,839) (19,253) (13,430)
Total return for the period / year attributable to Unitholders 24,907 63,212 124,059 151,753
Earnings per Unit (EPU) 4Q
2016 4Q
2015 YTD Dec
2016 YTD Dec
2015
Number of units on issue at end of period (‘000) 1,653,471 1,548,736 1,653,471 1,548,736
Weighted average number of units for the period (‘000)
– Basic 1,652,867 1,547,251 1,628,226 1,541,410
– Diluted (1)
1,660,958 1,547,251 1,639,722 1,541,410
EPU (cents) (based on the weighted average number of units for the period)
– Basic (2)
1.51 4.09 7.62 9.85
– Diluted 1.50 4.09 7.57 9.85

Pg 16 of 26
Note 1: Prior to 1 January 2016, the Manager’s management fees (comprising base fees and performance fees) are issued within 60 days from the end of the quarter. With effect from 1 January 2016, due to a new requirement of the Monetary Authority of Singapore, the units in connection with the performance fees will be issued once a year, after the end of the financial year. Note 2: The computation of EPU included the net change in fair value of serviced residence properties and assets held for sale, net of tax and non-controlling interests. Excluding these effects, the EPU for 4Q 2016 and 4Q 2015 would be 1.76 cents and 1.27 cents respectively, and the EPU for YTD Dec 2016 and YTD Dec 2015 would be 6.14 cents and 5.73 cents respectively.
In computing the DPU, the number of units as at the end of each period is used for the computation.
Distribution per Unit (DPU) 4Q
2016 4Q
2015 YTD Dec
2016 YTD Dec
2015
Number of units on issue at end of period (‘000) 1,653,471 1,548,736 1,653,471 1,548,736
DPU (cents) 2.04 2.07 8.27 7.99
7. Net asset value (“NAV”) Per Unit / Net Tangible Assets (“NTA”) Per Unit
GROUP REIT
31/12/16 31/12/15 31/12/16 31/12/15
NAV / NTA per unit (S$) 1.33* 1.41 0.94 1.04
* The decrease in NAV / NTA per unit as at 31 December 2016 was mainly due to translation differences (mainly arising from depreciation of GBP and RMB against SGD) and the equity placement.
Pg 17 of 26
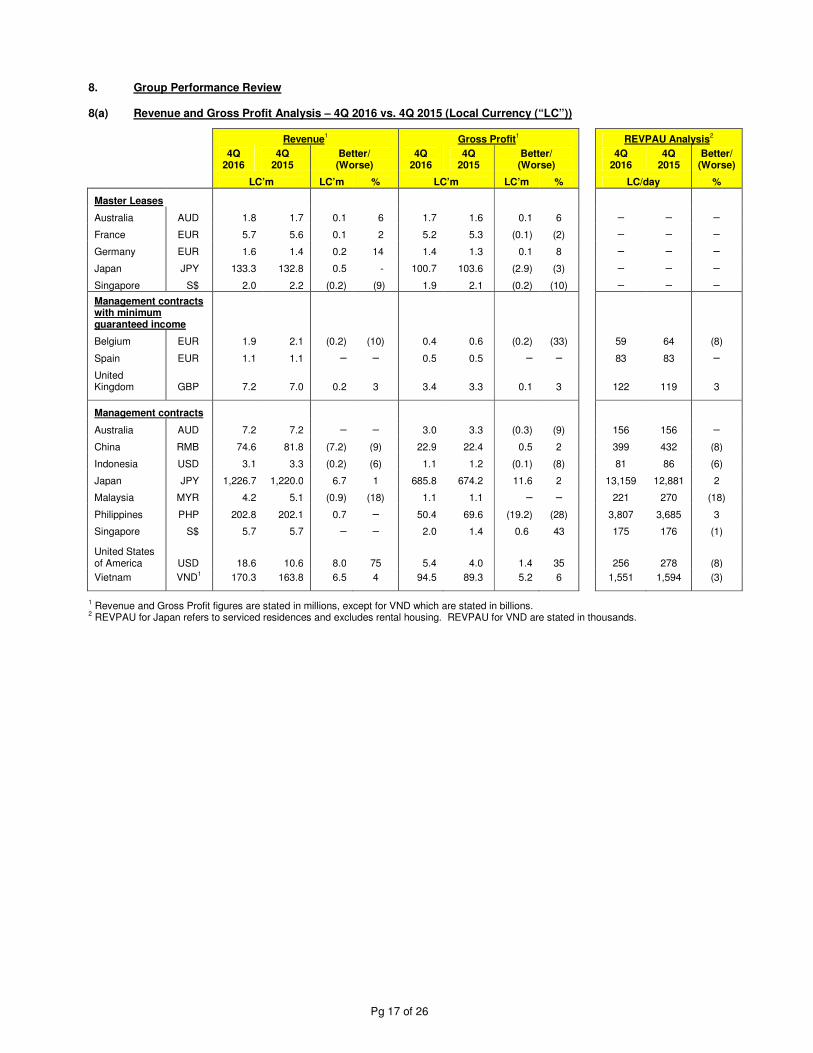
8. Group Performance Review 8(a) Revenue and Gross Profit Analysis – 4Q 2016 vs. 4Q 2015 (Local Currency (“LC”))
Revenue1 Gross Profit
1 REVPAU Analysis
2
4Q 2016
4Q 2015
Better/ (Worse)
4Q 2016
4Q 2015
Better/ (Worse)
4Q 2016
4Q 2015
Better/ (Worse)
LC’m LC’m % LC’m LC’m % LC/day %
Master Leases
Australia AUD 1.8 1.7 0.1 6 1.7 1.6 0.1 6 – – –
France EUR 5.7 5.6 0.1 2 5.2 5.3 (0.1) (2) – – –
Germany EUR 1.6 1.4 0.2 14 1.4 1.3 0.1 8 – – –
Japan JPY 133.3 132.8 0.5 - 100.7 103.6 (2.9) (3) – – –
Singapore S$ 2.0 2.2 (0.2) (9) 1.9 2.1 (0.2) (10) – – –
Management contracts with minimum guaranteed income
Belgium EUR 1.9 2.1 (0.2) (10) 0.4 0.6 (0.2) (33) 59 64 (8)
Spain EUR 1.1 1.1 – – 0.5 0.5 – – 83 83 –
United Kingdom GBP 7.2 7.0 0.2 3 3.4 3.3 0.1 3 122 119 3
Management contracts
Australia AUD 7.2 7.2 – – 3.0 3.3 (0.3) (9) 156 156 –
China RMB 74.6 81.8 (7.2) (9) 22.9 22.4 0.5 2 399 432 (8)
Indonesia USD 3.1 3.3 (0.2) (6) 1.1 1.2 (0.1) (8) 81 86 (6)
Japan JPY 1,226.7 1,220.0 6.7 1 685.8 674.2 11.6 2 13,159 12,881 2
Malaysia MYR 4.2 5.1 (0.9) (18) 1.1 1.1 – – 221 270 (18)
Philippines PHP 202.8 202.1 0.7 – 50.4 69.6 (19.2) (28) 3,807 3,685 3
Singapore S$ 5.7 5.7 – – 2.0 1.4 0.6 43 175 176 (1)
United States of America USD 18.6 10.6 8.0 75 5.4 4.0 1.4 35 256 278 (8)
Vietnam VND1 170.3 163.8 6.5 4 94.5 89.3 5.2 6 1,551 1,594 (3)
1 Revenue and Gross Profit figures are stated in millions, except for VND which are stated in billions. 2 REVPAU for Japan refers to serviced residences and excludes rental housing. REVPAU for VND are stated in thousands.
Pg 18 of 26
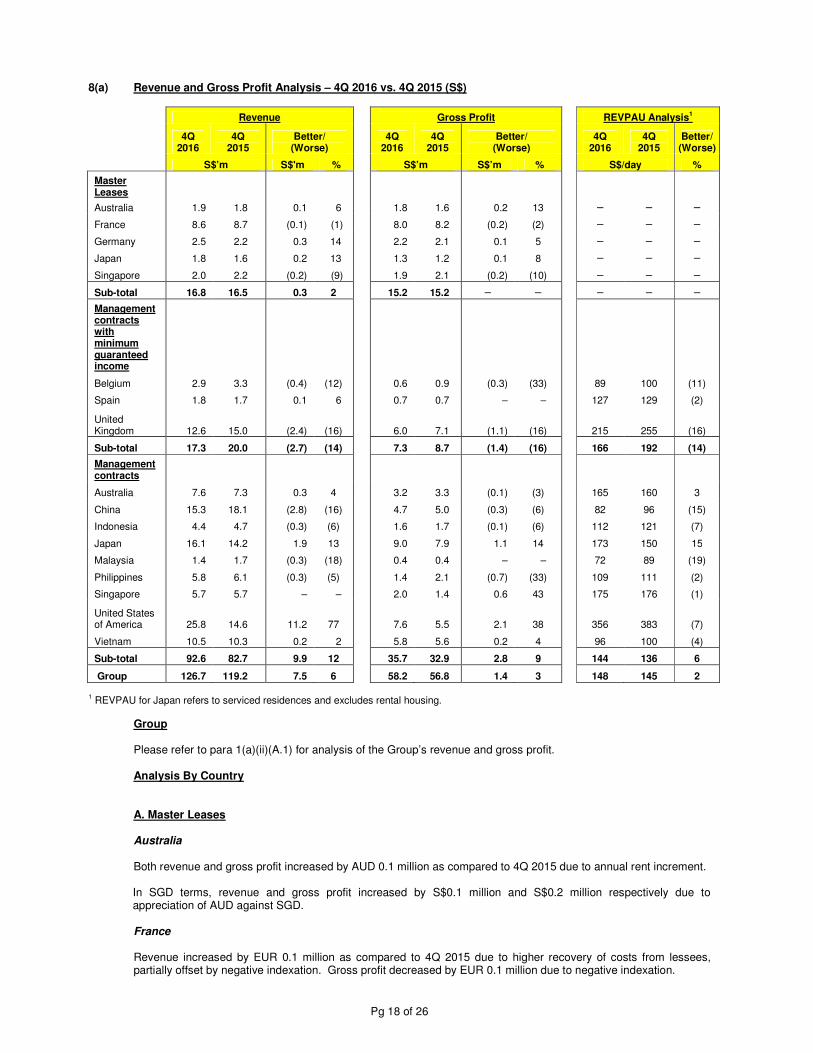
8(a) Revenue and Gross Profit Analysis – 4Q 2016 vs. 4Q 2015 (S$)
Revenue Gross Profit REVPAU Analysis1
4Q
2016 4Q
2015 Better/
(Worse) 4Q
2016 4Q
2015 Better/
(Worse) 4Q
2016 4Q
2015 Better/ (Worse)
S$’m S$'m % S$’m S$’m % S$/day %
Master Leases
Australia 1.9 1.8 0.1 6 1.8 1.6 0.2 13 – – –
France 8.6 8.7 (0.1) (1) 8.0 8.2 (0.2) (2) – – –
Germany 2.5 2.2 0.3 14 2.2 2.1 0.1 5 – – –
Japan 1.8 1.6 0.2 13 1.3 1.2 0.1 8 – – –
Singapore 2.0 2.2 (0.2) (9) 1.9 2.1 (0.2) (10) – – –
Sub-total 16.8 16.5 0.3 2 15.2 15.2 – – – – –
Management contracts with minimum guaranteed income
Belgium 2.9 3.3 (0.4) (12) 0.6 0.9 (0.3) (33) 89 100 (11)
Spain 1.8 1.7 0.1 6 0.7 0.7 – – 127 129 (2)
United Kingdom 12.6 15.0 (2.4) (16) 6.0 7.1 (1.1) (16) 215 255 (16)
Sub-total 17.3 20.0 (2.7) (14) 7.3 8.7 (1.4) (16) 166 192 (14)
Management contracts
Australia 7.6 7.3 0.3 4 3.2 3.3 (0.1) (3) 165 160 3
China 15.3 18.1 (2.8) (16) 4.7 5.0 (0.3) (6) 82 96 (15)
Indonesia 4.4 4.7 (0.3) (6) 1.6 1.7 (0.1) (6) 112 121 (7)
Japan 16.1 14.2 1.9 13 9.0 7.9 1.1 14 173 150 15
Malaysia 1.4 1.7 (0.3) (18) 0.4 0.4 – – 72 89 (19)
Philippines 5.8 6.1 (0.3) (5) 1.4 2.1 (0.7) (33) 109 111 (2)
Singapore 5.7 5.7 – – 2.0 1.4 0.6 43 175 176 (1)
United States of America 25.8 14.6 11.2 77 7.6 5.5 2.1 38 356 383 (7)
Vietnam 10.5 10.3 0.2 2 5.8 5.6 0.2 4 96 100 (4)
Sub-total 92.6 82.7 9.9 12 35.7 32.9 2.8 9 144 136 6
Group 126.7 119.2 7.5 6 58.2 56.8 1.4 3 148 145 2
1 REVPAU for Japan refers to serviced residences and excludes rental housing.
Group Please refer to para 1(a)(ii)(A.1) for analysis of the Group’s revenue and gross profit. Analysis By Country A. Master Leases Australia Both revenue and gross profit increased by AUD 0.1 million as compared to 4Q 2015 due to annual rent increment. In SGD terms, revenue and gross profit increased by S$0.1 million and S$0.2 million respectively due to appreciation of AUD against SGD. France Revenue increased by EUR 0.1 million as compared to 4Q 2015 due to higher recovery of costs from lessees, partially offset by negative indexation. Gross profit decreased by EUR 0.1 million due to negative indexation.

Pg 19 of 26
In SGD terms, revenue and gross profit decreased by S$0.1 million or 1% and S$0.2 million or 2% respectively due to depreciation of EUR against SGD. Germany Revenue increased by EUR 0.2 million or 14% as compared to 4Q 2015 due to higher variable rent recognised by Madison Hamburg. Gross profit increased by EUR 0.1 million or 8% as compared to 4Q 2015 due to higher revenue. In SGD terms, revenue increased by S$0.3 million or 14% and gross profit increased by S$0.1 million or 5%. Japan Revenue increased by JPY 0.5 million as compared to 4Q 2015. Gross profit decreased by JPY 2.9 million or 3% due to higher repair and maintenance expense. In SGD terms, revenue and gross profit increased by S$0.2 million or 13% and S$0.1 million or 8% respectively due to appreciation of JPY against SGD. Singapore Revenue decreased by S$0.2 million or 9% as compared to 4Q 2015 due to weaker corporate demand. Gross profit decreased by S$0.2 million or 10% due to lower revenue. B. Management contracts with minimum guaranteed income Belgium Revenue decreased by EUR 0.2 million or 10% in 4Q 2016 as compared to 4Q 2015 due to weaker demand post terror attacks in March 2016. REVPAU decreased by 8% from EUR 64 in 4Q 2015 to EUR 59 in 4Q 2016. Gross profit decreased by EUR 0.2 million or 33% due to lower revenue. In SGD terms, revenue decreased by S$0.4 million or 12% due to weaker underlying performance and depreciation of EUR against SGD. Gross profit, in SGD terms, decreased by S$0.3 million or 33% as compared to 4Q 2015. Spain Revenue and gross profit for 4Q 2016 remained at the same level as 4Q 2015. In SGD terms, revenue increased by S$0.1 million or 6% and gross profit remained at the same level as 4Q 2015. United Kingdom Revenue increased by GBP 0.2 million or 3% as compared to 4Q 2015 due to stronger corporate demand. REVPAU increased by 3% from GBP 119 in 4Q 2015 to GBP 122 in 4Q 2016. Gross profit increased by GBP 0.1 million or 3% due to higher revenue. In SGD terms, revenue and gross profit decreased by S$2.4 million or 16% and S$1.1 million or 16% respectively due to depreciation of GBP against SGD. C. Management contracts Australia Revenue remained at the same level as 4Q 2015. Gross profit decreased by AUD 0.3 million or 9% due to higher staff costs and operation and maintenance expense. In SGD terms, revenue increased by S$0.3 million or 4% due to appreciation of AUD against SGD. Gross profit, in SGD terms, decreased by S$0.1 million or 3% due to higher operating expenses, mitigated by appreciation of AUD against SGD. China Revenue decreased by RMB 7.2 million or 9% as compared to 4Q 2015 mainly due to weaker demand from project groups in the regional cities. REVPAU decreased by 8% from RMB 432 in 4Q 2015 to RMB 399 in 4Q 2016.

Pg 20 of 26
Gross profit increased by RMB 0.5 million or 2% due to lower business tax and operating expenses (arising from lower occupancy). In SGD terms, revenue decreased by S$2.8 million or 16% due to weaker underlying performance and depreciation of RMB against SGD. Gross profit, in SGD terms, decreased by S$0.3 million or 6%. Indonesia Revenue decreased by USD 0.2 million or 6% as compared to 4Q 2015 due to weaker demand from corporate accounts. REVPAU decreased by 6% from USD 86 in 4Q 2015 to USD 81 in 4Q 2016. Gross profit decreased by USD 0.1 million or 8% due to lower revenue. In SGD terms, revenue decreased by S$0.3 million or 6% as compared to 4Q 2015 due to weaker underlying performance and depreciation of USD against SGD. Gross profit, in SGD terms, decreased by S$0.1 million or 6%. Japan Revenue increased by JPY 6.7 million or 1% as compared to 4Q 2015 due to stronger demand from the leisure sectors. REVPAU increased from JPY 12,881 in 4Q 2015 to JPY 13,159 in 4Q 2016. Gross profit increased by JPY 11.6 million or 2% as compared to 4Q 2015 due to higher revenue and lower utility expense. In SGD terms, revenue and gross profit increased by S$1.9 million or 13% and S$1.1 million or 14% respectively due to stronger underlying performance and appreciation of JPY against SGD. Malaysia
Revenue decreased by MYR 0.9 million or 18% as compared to 4Q 2015 due to weaker demand from banking industries. REVPAU decreased by 18% from MYR 270 in 4Q 2015 to MYR 221 in 4Q 2016. Gross profit remained at the same level as 4Q 2015 due to lower revenue, offset by lower depreciation expense. In SGD terms, revenue decreased by S$0.3 million or 18% due to weaker underlying performance and depreciation of MYR against SGD. Gross profit, in SGD terms, remained at the same level as 4Q 2015. The Philippines
Revenue increased by PHP 0.7 million as compared to 4Q 2015 due to renovation of Ascott Makati in 4Q 2015. REVPAU increased by 3% from PHP 3,685 in 4Q 2015 to PHP 3,807 in 4Q 2016. Gross profit decreased by PHP 19.2 million or 28% due to higher depreciation expense (arising from the renovation of Ascott Makati) and higher operating expense. In SGD terms, revenue and gross profit decreased by S$0.3 million or 5% and S$0.7 million or 33% respectively due to depreciation of PHP against SGD. Singapore
Revenue remained at the same level as 4Q 2015. REVPAU decreased by 1% from S$176 in 4Q 2015 to S$175 in 4Q 2016.
Gross profit increased by S$0.6 million or 43% due to lower non-refundable GST being recognised in 4Q 2016. The United States of America Revenue and gross profit increased by USD 8.0 million or 75% and USD 1.4 million or 35% respectively as compared to 4Q 2015. The increase was due to the acquisition of Sheraton Tribeca New York Hotel on 29 April 2016. REVPAU decreased by 8% due to lower average daily rate achieved and lower REVPAU from Sheraton Tribeca New York Hotel. Excluding the contribution from Sheraton Tribcea New York Hotel, revenue decreased by USD 0.6 million and gross profit decreased by USD 1.3 million as compared to 4Q 2015. REVPAU decreased by 5% from USD 278 in 4Q 2015 to USD 263 in 4Q 2016. This was mainly due to lower average daily rate achieved as a result of keen competition. In SGD terms, revenue and gross profit increased by S$11.2 million or 77% and S$2.1 million or 38% respectively, Vietnam
Revenue increased by VND 6.5 billion or 4% in 4Q 2016 as compared to 4Q 2015. The increase was mainly due to higher commercial rent, partially offset by ongoing renovation at Somerset Ho Chi Minh City (which is expected to be completed by January 2017). REVPAU decreased by 3% from VND 1,594,000 in 4Q 2015 to VND 1,551,000 in 4Q 2016. Gross profit increased by VND 5.2 billion or 6% due to higher revenue and lower depreciation expense.

Pg 21 of 26
In SGD terms, both revenue and gross profit increased by S$0.2 million due to stronger underlying performance, partially offset by depreciation of VND against SGD.
8(b) Revenue and Gross Profit Analysis – YTD Dec 2016 vs. YTD Dec 2015 (Local Currency (“LC”))
Revenue1 Gross Profit
1 REVPAU Analysis
2
YTD Dec 2016
YTD Dec 2015
Better/
(Worse)
YTD Dec 2016
YTD Dec 2015
Better/
(Worse)
YTD Dec 2016
YTD Dec 2015
Better/
(Worse)
LC’m LC’m % LC’m LC’m % LC/day %
Master Leases
Australia AUD 7.2 6.8 0.4 6 6.8 6.4 0.4 6 – – –
France EUR 22.9 23.0 (0.1) – 21.1 21.2 (0.1) – – – –
Germany EUR 6.0 5.8 0.2 3 5.5 5.0 0.5 10 – – –
Japan JPY 533.2 695.6 (162.4) (23) 412.9 550.3 (137.4) (25) – – –
Singapore S$ 8.0 9.3 (1.3) (14) 7.3 7.9 (0.6) (8) – – –
Management contracts with minimum guaranteed income
Belgium EUR 6.5 8.4 (1.9) (23) 1.4 2.2 (0.8) (36) 50 65 (23)
Spain EUR 4.9 4.8 0.1 2 2.3 2.2 0.1 5 95 92 3
United Kingdom GBP 26.7 27.4 (0.7) (3) 12.6 12.7 (0.1) (1) 114 117 (3)
Management contracts
Australia AUD 27.5 14.6 12.9 88 11.4 6.2 5.2 84 149 151 (1)
China RMB 302.1 319.0 (16.9) (5) 90.7 85.5 5.2 6 402 423 (5)
Indonesia USD 12.4 12.8 (0.4) (3) 4.9 4.7 0.2 4 81 85 (5)
Japan JPY 4,764.6 4,462.1 302.5 7 2,665.4 2,471.1 194.3 8 12,466 12,035 4
Malaysia MYR 18.7 19.3 (0.6) (3) 6.1 4.8 1.3 27 247 254 (3)
Philippines PHP 733.4 931.6 (198.2) (21) 207.3 314.1 (106.8) (34) 3,632 3,959 (8)
Singapore S$ 25.2 25.9 (0.7) (3) 10.4 10.2 0.2 2 195 201 (3) United States of America USD 57.9 15.7 42.2 n.m. 15.5 5.9 9.6 n.m. 236 279 (15)
Vietnam VND1 642.1 633.0 9.1 1 353.8 339.4 14.4 4 1,489 1,539 (3) 1 Revenue and Gross Profit figures are stated in millions, except for VND which are stated in billions. 2 REVPAU for Japan refers to serviced residences and excludes rental housing. REVPAU for VND are stated in thousands.

Pg 22 of 26
8(b) Revenue and Gross Profit Analysis – YTD Dec 2016 vs. YTD Dec 2015 (S$)
Revenue Gross Profit REVPAU Analysis1
YTD Dec 2016
YTD Dec 2015
Better/ (Worse)
YTD Dec 2016
YTD Dec 2015
Better/ (Worse)
YTD Dec 2016
YTD Dec 2015
Better/ (Worse)
S$’m S$'m % S$’m S$’m % S$/day %
Master Leases
Australia 7.3 7.1 0.2 3 7.0 6.7 0.3 5 – – –
France 35.0 35.1 (0.1) – 32.2 32.4 (0.2) (1) – – –
Germany 9.2 9.0 0.2 2 8.4 7.7 0.7 9 – – –
Japan 6.7 7.9 (1.2) (15) 5.2 6.2 (1.0) (16) – – –
Singapore 8.0 9.3 (1.3) (14) 7.3 7.9 (0.6) (8) – – –
Sub-total 66.2 68.4 (2.2) (3) 60.1 60.9 (0.8) (1) – – –
Management contracts with minimum guaranteed income
Belgium 10.0 12.7 (2.7) (21) 2.1 3.4 (1.3) (38) 77 99 (22)
Spain 7.6 7.3 0.3 4 3.4 3.3 0.1 3 146 141 4
United Kingdom 50.5 57.4 (6.9) (12) 23.7 26.7 (3.0) (11) 216 246 (12)
Sub-total 68.1 77.4 (9.3) (12) 29.2 33.4 (4.2) (13) 164 188 (13)
Management contracts
Australia 28.2 15.0 13.2 88 11.7 6.3 5.4 86 153 156 (2)
China 63.0 69.9 (6.9) (10) 18.9 18.7 0.2 1 84 93 (10)
Indonesia 17.2 17.6 (0.4) (2) 6.8 6.4 0.4 6 111 116 (4)
Japan 60.3 50.5 9.8 19 33.7 28.0 5.7 20 158 136 16
Malaysia 6.3 6.8 (0.5) (7) 2.0 1.7 0.3 18 83 91 (9)
Philippines 21.4 28.1 (6.7) (24) 6.0 9.5 (3.5) (37) 106 120 (12)
Singapore 25.2 25.9 (0.7) (3) 10.4 10.2 0.2 2 195 201 (3)
United States of America 79.9 21.6 58.3 n.m. 21.4 8.1 13.3 n.m. 326 383 (15)
Vietnam 39.8 39.9 (0.1) – 22.0 21.4 0.6 3 92 97 (5)
Sub-total 341.3 275.3 66.0 24 132.9 110.3 22.6 21 136 122 12
Group 475.6 421.1 54.5 13 222.2 204.6 17.6 9 140 133 5
1 REVPAU for Japan refers to serviced residences and excludes rental housing.
For the year ended 31 December 2016 (“YTD Dec 2016”), revenue increased by S$54.5 million or 13% as compared to the corresponding period last year (“YTD Dec 2015”). The increase in revenue was mainly due to additional contribution of S$75.9 million from the 2015 Acquisitions and 2016 Acquisition. The increase was partially offset by decrease in revenue of S$2.5 million from the divestment of six rental housing properties in 3Q 2015 and decrease in revenue of S$18.9 million from the existing properties. On a same store basis, YTD Dec 2016 revenue decreased by S$18.9 million mainly due to lower revenue from United Kingdom (due to depreciation of GBP against SGD), China (due to weaker demand from project groups in the regional cities) and Philippines (arising from ongoing renovation). REVPAU increased from S$133 in YTD Dec 2015 to S$140 in YTD Dec 2016. On a same store basis, excluding the 2015 Acquisitions and 2016 Acquisition, REVPAU decreased by 7%. In line with the increase in revenue, gross profit for YTD Dec 2016 increased by S$17.6 million or 9% as compared to YTD Dec 2015. On a same store basis, gross profit decreased by S$2.7 million mainly due to lower revenue, partially offset by lower operation and maintenance expense, depreciation expense and other direct expenses.

Pg 23 of 26
(c) Change in value of serviced residence properties and assets held for sale
The change in value of serviced residence properties will affect the net asset value but has no impact on the unitholders’ distribution. Any increase or decrease in value is credited or charged to the Statement of Total Return as net appreciation or depreciation on revaluation of serviced residence properties.
As at 31 December 2016, independent full valuations for the Group’s portfolio were carried out by CBRE (except for Somerset Ampang Kuala Lumpur). In determining the fair value of the Group’s portfolio, the discounted cash flow approach was used. The valuation method used is consistent with that used for the 30 June 2016 valuation. The independent full valuation for Somerset Ampang Kuala Lumpur as at 31 December 2016 was valued by Raine & Horne International Zaki + Partners Sdn. Bhd. (as consultant to CBRE). The valuation of the remaining units held in Fortune Garden Apartments (formerly known as Somerset Grand Fortune Garden Property Beijing) was based on the selling prices stated in the executed sale and purchase agreements. The Group’s portfolio (including assets held for sale) was revalued at S$4,511.0 million, resulting in a deficit of S$8.3 million which was recognised in the Consolidated Statement of Total Return in 4Q 2016. The deficit resulted mainly from lower valuation of the Group’s serviced residences in United Kingdom andThe United States of America, partially offset by higher valuation from properties in Japan, Germany and Spain. The net impact on the Consolidated Statement of Total Return was S$4.2 million (net of tax and non-controlling interests).
9. Variance from forecast The Group has not disclosed any forecast to the market. 10. Commentary of the significant trends and the competitive conditions of the industry in which the Group
operates and any known factors or events that may affect the Group in the next reporting period and the next 12 months
In 2016, Ascott REIT completed the acquisition of our second property in New York, Sheraton Tribeca New York Hotel, less than a year from its first foray into the United States of America. Including Ascott Orchard Singapore which has started operations in December 2016, and on track for delivery in 2017, Ascott REIT’s total assets would have reached S$5.2 billion. The Group remains on the look out for accretive opportunities in the key gateway cities of Australia, Japan, Europe and United States of America. The final phase of refurbishment at Somerset Xu Hui Shanghai and the phased refurbishments at Somerset Ho Chi Minh City and Ascott Makati have been completed in 2016. We expect to complete the refurbishment at Citadines Barbican London, Somerset Millennium Makati and Somerset Ho Chi Minh City in 2017. The Group will continue to refurbish Ascott REIT’s properties to enhance guest experience and maximise returns to Unitholders. To date, all of the units in Fortune Gardens Apartments have been sold. Part of the proceeds from the divestment that has been remitted back to Singapore was deployed to repay foreign currency bank loans, resulting in a net realised exchange gain of S$8.8 million for FY 2016. The remaining proceeds from the sale is expected to be remitted back to Singapore in due course. As part of its strategy to optimise returns to Unitholders, Ascott REIT will continue to review its portfolio to identify opportunities to unlock the underlying value of properties with limited growth potential and re-deploy proceeds into higher yielding properties. In December 2016, the US Federal Reserve raised its target for short-term interest rates by 25 basis points, with further interest rate hikes anticipated in 2017. On the capital management front, Ascott REIT continues to maintain a strong balance sheet, with more than 80% of its total borrowings on fixed interest rates to hedge against the rising interest rate. Ascott REIT’s effective interest rate remained stable at 2.4%. The Group has started on the refinancing of the loans that are coming due in FY 2017. Ascott Reit will continue to actively monitor its interest rate and exchange rate exposure and remain vigilant to changes in the macro and credit environment that may impact its financing plans. Going forward, global economic recovery is likely to remain slow-paced. Notwithstanding, Ascott REIT will continue to focus on creating stable income and returns to Unitholders through its diversified portfolio and extended-stay business model, together with the master leases and management contracts with minimum guaranteed income.
Pg 24 of 26
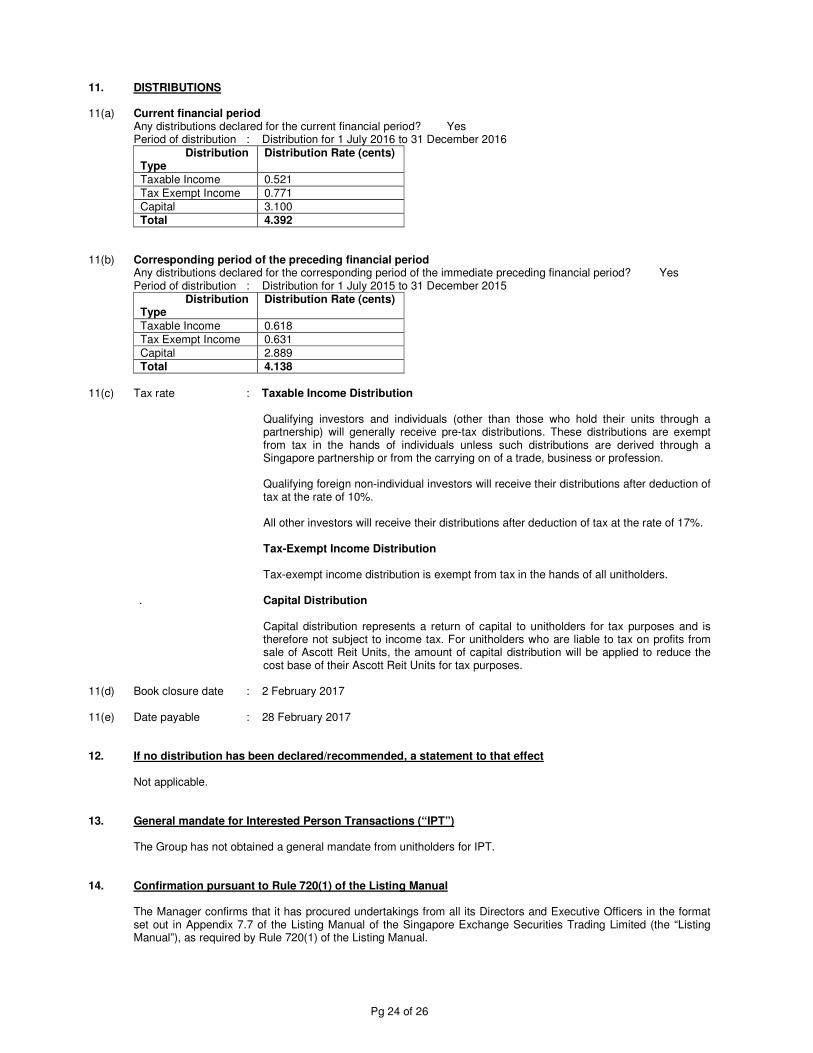
11. DISTRIBUTIONS 11(a) Current financial period Any distributions declared for the current financial period? Yes Period of distribution : Distribution for 1 July 2016 to 31 December 2016
Distribution Type
Distribution Rate (cents)
Taxable Income 0.521 Tax Exempt Income 0.771 Capital 3.100 Total 4.392
11(b) Corresponding period of the preceding financial period Any distributions declared for the corresponding period of the immediate preceding financial period? Yes Period of distribution : Distribution for 1 July 2015 to 31 December 2015
Distribution Type
Distribution Rate (cents)
Taxable Income 0.618 Tax Exempt Income 0.631 Capital 2.889 Total 4.138
11(c) Tax rate : Taxable Income Distribution
Qualifying investors and individuals (other than those who hold their units through a
partnership) will generally receive pre-tax distributions. These distributions are exempt from tax in the hands of individuals unless such distributions are derived through a Singapore partnership or from the carrying on of a trade, business or profession.
Qualifying foreign non-individual investors will receive their distributions after deduction of
tax at the rate of 10%. All other investors will receive their distributions after deduction of tax at the rate of 17%. Tax-Exempt Income Distribution Tax-exempt income distribution is exempt from tax in the hands of all unitholders. . Capital Distribution Capital distribution represents a return of capital to unitholders for tax purposes and is
therefore not subject to income tax. For unitholders who are liable to tax on profits from sale of Ascott Reit Units, the amount of capital distribution will be applied to reduce the cost base of their Ascott Reit Units for tax purposes.
11(d) Book closure date : 2 February 2017 11(e) Date payable : 28 February 2017 12. If no distribution has been declared/recommended, a statement to that effect Not applicable. 13. General mandate for Interested Person Transactions (“IPT”) The Group has not obtained a general mandate from unitholders for IPT.
14. Confirmation pursuant to Rule 720(1) of the Listing Manual
The Manager confirms that it has procured undertakings from all its Directors and Executive Officers in the format set out in Appendix 7.7 of the Listing Manual of the Singapore Exchange Securities Trading Limited (the “Listing Manual”), as required by Rule 720(1) of the Listing Manual.

Pg 25 of 26
15. Segment Revenue and Results
Revenue Gross Profit
YTD Dec 2016 YTD Dec 2015 YTD Dec 2016 YTD Dec 2015
S$’000 S$’000 S$’000 S$’000
Singapore 33,130 35,191 17,738 18,052
Australia 35,492 22,110 18,638 13,026
Belgium 10,033 12,759 2,079 3,359
China 63,018 69,892 18,903 18,740
France 35,013 35,041 32,210 32,411
Germany 9,230 9,029 8,409 7,697
Indonesia 17,233 17,587 6,772 6,384
Japan 66,971 58,435 38,912 34,233
Malaysia 6,256 6,852 2,044 1,746
Philippines 21,367 28,125 6,038 9,484
Spain 7,627 7,294 3,426 3,344
United Kingdom 50,486 57,371 23,711 26,658
United States of America 79,932 21,542 21,340 8,052
Vietnam 39,802 39,886 21,940 21,384
Group 475,590 421,114 222,160 204,570 16. In the review of performance, the factors leading to any material changes in contributions to turnover and
earnings by the business or geographical segments Please refer to paragraph 8 on the review. 17. Breakdown of Revenue and Total Return
YTD Dec
2016 YTD Dec
2015 Better/ (Worse)
S$’000 S$’000 %
(a) Revenue reported for first half year 224,896 188,698 19
(b) Total return after taxation reported for first half year 83,918 62,183 35
(c) Revenue reported for second half year 250,694 232,416 8
(d) Total return after taxation reported for second half year 63,846 116,807 (45)
18. Breakdown of Total Distributions
YTD Dec
2016 YTD Dec
2015 S$’000 S$’000
1 January 2015 to 30 June 2015 - paid – 59,273 1 July 2015 to 31 December 2015 - paid – 64,066 1 January 2016 to 30 June 2016 - paid 62,364 – 1 July 2016 to 31 December 2016 - to be paid 72,627 –

Pg 26 of 26
19. Confirmation pursuant to Rule 704(13) of the Listing Manual
Pursuant to Rule 704(13) of the Listing Manual of the Singapore Exchange Securities Trading Limited, Ascott Residence Trust Management Limited (the “Company”), being the manager of Ascott Reit, confirms that there is no person occupying a managerial position in the Company or in any of its or Ascott Reit’s principal subsidiaries who is a relative of a director, chief executive officer, substantial shareholder of the Company or substantial unitholder of Ascott Reit.
This release may contain forward-looking statements that involve risks and uncertainties. Actual future performance, outcomes and results may differ materially from those expressed in forward-looking statements as a result of a number of risks, uncertainties and assumptions. Representative examples of these factors include (without limitation) general industry and economic conditions, interest rate trends, cost of capital and capital availability, competition from other companies, shifts in customer demands, customers and partners, changes in operating expenses, including employee wages, benefits and training, governmental and public policy changes and the continued availability of financing in the amounts and the terms necessary to support future business. You are cautioned not to place undue reliance on these forward looking statements, which are based on current view of management on future events.
BY ORDER OF THE BOARD Ascott Residence Trust Management Limited (Company registration no. 200516209Z) As Manager of Ascott Residence Trust Karen Chan Company Secretary 24 January 2017