ASCENTIAL PLC A REPORT OF THE YEAR 2015ASCENTIAL PLC — A REPORT OF THE YEAR 2015 Ascential is an...
76
ASCENTIAL PLC A REPORT OF THE YEAR 2015
Transcript of ASCENTIAL PLC A REPORT OF THE YEAR 2015ASCENTIAL PLC — A REPORT OF THE YEAR 2015 Ascential is an...

Ascential plcThe Prow1 Wilder WalkLondon W1B 5APascential.com
ASC
EN
TIA
L PLC
— A
RE
PO
RT
OF
TH
E Y
EA
R 2
01
5
ASCENTIAL PLCA REPORT OF THE YEAR 2015

ASCENTIAL PLC — A REPORT OF THE YEAR 2015
Ascential is an international business to business media company with a focused portfolio of essential, market-leading products that connect and inform business professionals in more than 150 countries.
We employ more than 1,500 people and our Group’s headquarters are in London. We have offices in 14 countries, and our main operational locations are in the UK, US and UAE.
We serve customers in 150 countries through market-leading Exhibitions, Festivals and Information Services. 23 of Ascential’s 32 product lines are number one in their respective markets.
Our products are organised under two reportable segments based on operational expertise: Exhibitions & Festivals and Information Services.
In the Exhibitions & Festivals segment, we organise large scale exhibitions, congresses and festivals where customers come together to form business relationships and transact. Key products in this segment are Cannes Lions, Spring and Autumn Fair and Money20/20.
In Information Services, we provide high quality, industry-specific business intelligence, and forecasting via digital subscription products. In some product lines, customers can also purchase print subscriptions, attend conferences and award ceremonies, and promote their services. Key products in this segment are WGSN and Groundsure.
WELCOME
Strategic report01 Highlights02 Company overview03 Top five products04 History05 Key strengths06 Chairman’s statement10 Chief Executive’s review12 Strategy summary14 Financial review20 Risk management24 Segmental review Exhibitions & Festivals Information Services30 People review31 Sustainability
Governance34 Board of Directors
Financial statements37 Statement of Directors’ responsibilities38 Report of KPMG LLP to the Directors of
Ascential Holdings Limited39 Consolidated profit and loss statement
and other comprehensive income40 Consolidated statement of
financial position41 Consolidated statement of changes
in equity42 Consolidated statement of cash flows43 Notes to the non-statutory
financial statements

01ASCENTIAL PLC — A REPORT OF THE YEAR 2015
STRATEGIC REPORT | GOVERNANCE | FINANCIAL STATEMENTS
2015 was another strong year for Ascential and we grew both revenues and profits driven by our focus on our top products, customer retention and increasing customer volumes.
HIGHLIGHTS
Retail Week Prospect Retail Week Prospect is an intelligence tool providing accurate, up-to-date insight into retailers and their decision-makers. Prospect allows unique access to the people and technology strategies of the UK’s most innovative retailers, enabling users to pinpoint the best opportunities and to initiate earlier and more valuable client conversations.
Lions Innovation Data and technology are redefining creativity, and the Lions Innovation Festival explores exactly what these changes mean today and in the future. The Innovation Lions awards honour innovative, brand-aligned ideas and business solutions. Standalone technological solutions including tools, models, platforms and other forms of adtech are also recognised.
CWIEME Istanbul Launched in 2015, CWIEME Istanbul is a unique platform dedicated to the coil winding, electric motor and transformer manufacturing industries in the region. Exhibitors from 18 countries showcased latest products and technologies and the majority of 2015 exhibitors are already booked for the 2016 event.
China Textile Information Center JV WGSN has worked with CTIC since 2011 and in 2015 announced a new partnership to better serve and increase the number of WGSN customers in this pivotal market. In addition, the new partnership will co-develop a new colour product for customers around the world.
New launches
Financial highlights
2015£m
2014£m
Growth –Reported
Growth – Organic
Revenue 319.1 312.7 2.1% 6.1%
Exhibitions & Festivals 150.4 138.8 8.4% 13.1%
Information Services 168.7 173.9 (3.0%) 0.5%
Adjusted EBITDA 90.9 85.3 6.6% 14.0%
Group Margin 28.5% 27.3%
Exhibitions & Festivals 56.9 55.3 2.8% 10.5%
Margin 37.8% 39.9%
Information Services 42.8 38.9 10.0% 15.4%
Margin 25.4% 22.4%
Free cash flow 79.9 68.3
Free cash flow conversion 88% 80%
Net debt (383.7) (408.3)
Leverage 4.2x 4.8x

02 ASCENTIAL PLC — A REPORT OF THE YEAR 2015
COMPANY OVERVIEW
We put our customers first and by listening and focusing on them we aim to create new products that fulfil their needs and the needs of their organisation and industry.
By offering world class content and connections we help businesses to be the best informed and best connected. Business professionals rely on us every day for our knowledge and access.
We help drive their success, which drives our own growth, and we create value for them and for our own business.
Exhibitions• Spring and • Autumn Fair• Bett • Pure• CWIEME• RWM• Glee• BVE• Naidex• UKTI
Congresses • Money20/20• World Retail
Congress
Festivals • Cannes Lions • Lions Regionals
Exhibitions & Festivals
47%Group revenue
57% Group EBITDA
£150.4m revenues
Subscription• WGSN• Planet Retail• Glenigan• DeHavilland
Subscription-led • Health Service
Journal• Retail Week
• MEED• Nursing Times• Drapers• Construction
News• NCE• Architects’
Journal• Architecture
portfolio
• LGC• MRW• Retail Jeweller• Ground
Engineering • HVN/RAC
Transactional • Groundsure
Information Services
53%Group revenue
43%Group EBITDA
£168.7m revenues
03
STRATEGIC REPORT | GOVERNANCE | FINANCIAL STATEMENTS
ASCENTIAL PLC — A REPORT OF THE YEAR 2015
TOP FIVE PRODUCTS
Customer value retention increased in 2015, through a combination of product enhancements and extensions, as well as account management and customer service improvements.
How Ascential helps its customers The largest and most recognised festival for creativity in the branded communications industry. Delegates attend to experience the best creativity in branded communications, learn from workshops and presentations, network, and celebrate success. Advertising agencies and creatives enter their work to win Lions awards, which are a benchmark of creativity.
How Ascential helps its customers Money20/20 is the leading US congress in the payments innovation sector, focusing on the evolution of payments and financial services through mobile, retail, marketing services data and technology. The event is held in Las Vegas every October and helps the payments industry connect and conduct business. Money20/20 Europe will launch in Copenhagen in April 2016.
How Ascential helps its customers WGSN is a leading provider of market intelligence and trend forecasts to the fashion industry and to businesses in other design-led industries. WGSN helps fashion brands and retailers design, buy and price ‘on trend’. WGSN offers a range of services and products to inspire, validate and benchmark design and commercial decisions.
How Ascential helps its customers Spring Fair is the UK’s largest trade exhibition and Autumn Fair is the UK’s second largest serving suppliers to the retail industry. Each cover key buying sectors including gifts, homewares, jewellery and greeting products. Both attract UK and international buyers, from independent and major multiple retailers to e-commerce specialists and department stores.
Cannes Lions
Money20/20
Groundsure
WGSN
Spring and Autumn Fair
How Ascential helps its customers Groundsure works to help solicitors, homebuyers, businesses, consultants, surveyors and lenders make more informed property-transaction decisions. It provides precise, up-to-date, digitally delivered environmental reports through access to its comprehensive contemporary and historic environmental and land-use datasets.
94%Customer value retention
94%Customer value retention
92%Customer value retention
93%Customer value retention
Page 25 for more info Page 25 for more info
Page 25 for more info Page 27 for more info
Page 27 for more info

04 ASCENTIAL PLC — A REPORT OF THE YEAR 2015
Following a fundamental review in 2011, led by new CEO Duncan Painter, we have realigned and optimised our portfolio of leading products and renewed focus was put into those products that could deliver long-term organic growth, particularly internationally. At the same time, we further professionalised our operations, re-established customers at the heart of our business and created world-class sales and marketing teams by investing in people and training, and systems.
In 2012, the Group was restructured into agile operating companies with embedded expertise and new senior management teams, each empowered to make fast decisions that are right for their customers and respective businesses.
A £37m transformation programme enabled us to invest in strong product and content creation, overhaul our technology and introduce new systems, including world class sales and marketing platforms. Once completed, the business had a platform from which to grow in key territories around the world.
Since 2012, we have made six bolt-on acquisitions to either help us enter new industry sectors or geographies or provide us with new product capabilities to enhance our offering to our customers: CWIEME (2012), Educar (2013), Stylesight (2013), Mindset (2013), Money20/20 (2014) and RetailNet Group (2015). Additionally, we disposed of the following non-core assets: CAP Motor Research (2012), AME Info (2013), Infrastructure Journal (2013) and Media Business Insight (2015).
In December 2015, we rebranded the Group as Ascential, signalling both the end to the turnaround phase and a clear future strategy and purpose.
On 12 February 2016, Ascential plc listed on the main market of the London Stock Exchange. This marked a return to the market almost eight years to the month since delisting in 2008.
Looking ahead, the Group aims to be the leading provider of exhibitions, festivals and digital information services, providing access to its products and services both online and offline wherever and whenever our customers want.
In 2008, Ascential (then Emap) was acquired by funds advised by Apax Partners and Guardian Media Group following the sale of its consumer media and radio assets to Bauer Media. The Company was delisted from the London Stock Exchange on 20 March 2008.
HISTORY
TIMELINE2008
Acquired by funds advised by Apax Partners/Guardian
Media Group
2012Transform
programme – £37m invested
2014Group revenues pass £300m for
the first time
2015Rebranded to
Ascential
2016IPO on LSE
2011Duncan Painter
appointed as CEO
05
STRATEGIC REPORT | GOVERNANCE | FINANCIAL STATEMENTS
ASCENTIAL PLC — A REPORT OF THE YEAR 2015
Focused portfolio of market-leading products
23 of our 32 products occupy number one positions in their markets. These generated 84% of revenues and 93% of Adjusted EBITDA in 2015.
Self-reinforcing business models
Network effects in our leading products enable products to benefit from their market-leading positions by driving the best propositions, leading to more customers and enabling us to sub-segment and extend their propositions, thereby further enhancing the products’ market-leading positions.
At the heart of customer needs
A key pillar of our operations is a ‘customer first’ strategy. This puts customer needs at the heart of Group strategy with constant research and analytics to ensure product development meets or exceeds their expectations.
Disciplined operational approach and portfolio management
Relentless focus on sales and ‘retention first’ approach to customers underpins our growth. Significant investment has been put into sales training and customer management. The Group focuses on key growth products, with active management of its portfolio.
Strong track record of growth
On a constant currency basis, excluding the impact of acquisitions and disposals, Group revenues grew in 2013, 2014 and 2015 by 7%, 7% and 6% respectively.
Clear organic growth strategy
The Group has multiple levers for growth underpinned by its ‘retention first’ approach and through increasing the number of customers that buy our products and by seeking to upsell and cross-sell new products that we develop to our customer base. The Group has increased customer numbers in the Exhibitions & Festivals segment from 14,500 in 2012 to 17,500 in 2015, and across its subscription products from 8,500 in 2012 to 9,200 in 2015.
Strong margins and good cash generation
Through careful cost control and concentration of our cost base towards key products in each segment, the Group’s Adjusted EBITDA margin has grown from 27.3% in 2014 to 28.5% in 2015. Our negative working capital profile, combined with modest capital expenditure requirements result in a high conversion of adjusted EBITDA to cash. In 2015, free cash flow conversion was 88%.
KEY STRENGTHS

06 ASCENTIAL PLC — A REPORT OF THE YEAR 2015
CHAIRMAN’S STATEMENT
Following my appointment as Chairman in January 2016 and our IPO in February 2016, I am very pleased to present my first report.
Group performanceThe 2015 financial year was another successful one for Ascential, with revenue growing 6% on an Organic basis, Adjusted EBITDA up 14% to £90.9m, margins expanding from 27.3% to 28.5% and free cash flow conversion at 88%, up from 80% in 2014. We are a retention-centric company and our priority is to grow the number of customers who choose to do business with us. The continued growth in customer numbers and the improved retention rates across the board are testament to these priorities.
Strategic progressDuring the year we continued to actively manage our portfolio of products. Several new products were launched driven by customer demand and feedback, including Lions Innovation, and other product lines were extended to new geographies. We made one small acquisition in June 2015 when we welcomed RetailNet Group (“RNG”) to the Group. RNG is a US-based provider of retail analytics and executive education and is a great complement to our Planet Retail business.
We also sold the Media Business Insight business in January 2015. We wish the business and its staff well under their new ownership.
Our admission to the London Stock Exchange on 12 February 2016 was a major milestone for the Company. The primary net proceeds raised from the IPO were used to reduce our net external debt to a level more appropriate for a publicly listed company. Time dedicated to our successful IPO, whilst also maintaining a relentless focus on delivering strong financial and operational results for 2015, is a real testament to the strength and depth of Ascential’s management team.
07
STRATEGIC REPORT | GOVERNANCE | FINANCIAL STATEMENTS
ASCENTIAL PLC — A REPORT OF THE YEAR 2015
Our BoardOur Board is committed to the highest standards of corporate governance. The IPO presented an ideal opportunity to formally re-assess the skills and talents required for our Board as we embark on the next stage of our development as a public company.
Firstly, I am delighted that my predecessor Tom Hall (Apax), and David Pemsel (Guardian Media Group (“GMG”)), have each agreed to remain on the Board as Non-Executive Directors. We are grateful that we will continue to benefit from their experience and constructive engagement. I would also like to thank former Board members Frank Ehmer of Apax and Alan Hudson of GMG for their contribution over the past years of private company ownership.
The Company welcomed three independent Non-Executive Directors in January 2016 – Paul Harrison (who chairs the Audit Committee), Judy Vezmar (who chairs the Remuneration Committee) and Gillian Kent. I am confident that their broad range of both executive and non-executive experience will prove invaluable and am delighted that we have been able to attract such talented candidates.
In addition to the Executive Directors, Duncan Painter, Chief Executive, and Mandy Gradden, Chief Financial Officer, we currently have six Non-Executive Directors. Excluding me, three are considered independent under the UK Corporate Governance Code. We expect to make one more independent Non-Executive Director appointment in May. Assuming our expectations are realised, we will then be fully compliant with the Code.
DividendAscential plc was incorporated in January 2016 and, as indicated at the time of the IPO, expects to pay its first dividend in respect of the 2016 financial results with one-third paid in November 2016 and two-thirds paid in May 2017.
OutlookThe new financial year has started well. Since the year end, Spring Fair, Bett UK and Pure Spring have taken place and performed in line with our expectations. Preparations for Money20/20 Europe in April also continue to progress well. While still early in 2016, we are encouraged by the current level of forward bookings and are confident of another good year of growth for the Group.
On behalf of the Board, I would like to take this opportunity to thank all the employees and customers of Ascential for what has been a very successful year.
Scott ForbesChairman14 March 2016

08 ASCENTIAL PLC — A REPORT OF THE YEAR 2015
FOCUSED PORTFOLIO OF MARKET LEADING PRODUCTS
Top five products in 2015 generated
53%of Group revenue and
64%of Group Adjusted EBITDA
09
STRATEGIC REPORT | GOVERNANCE | FINANCIAL STATEMENTS
ASCENTIAL PLC — A REPORT OF THE YEAR 2015
Top ten products in 2015 generated
68%of Group revenue and
81%of Group Adjusted EBITDA

10 ASCENTIAL PLC — A REPORT OF THE YEAR 2015
I am delighted to present the Group’s results for 2015. The year was a strong one and culminated in the successful IPO of the Group shortly after the year end.
Track record of growth, high margins and good cash generationWe delivered a strong operating performance in 2015 with a 6% Organic growth in revenue to £319.1m and a 14% Organic growth in Adjusted EBITDA to £90.9m, with an expansion in margin from 27.3% in 2014 to 28.5% in 2015. We continued to generate good cash flow with free cash flow of £79.9m (2014: £68.3m) representing free cash conversion of 88% (2014: 80%).
Focused portfolio of market-leading productsWe operate a focused portfolio of just 32 product lines, 23 of which hold the number one position in their respective markets. We believe that our focus of management time on market-leading products is a key driver of our growth. We also focus most of our resources and time on our top products. All five of 2014’s top products performed well in 2015 but Groundsure grew faster than our leading education technology event, Bett, and entered the top five product list in 2015. The top products in 2015 were:
• In Information Services: WGSN and Groundsure
• In Exhibitions & Festivals: Cannes Lions, Spring and Autumn Fair and Money20/20.
Our top five products represented 53% of the Group’s 2015 revenue (2014: 49%) and 64% of its Adjusted EBITDA (2014: 58%). Further details on the performance of each of the top products are given in the segmental analysis on pages 24–27.
CHIEF EXECUTIVE’S REVIEW
11
STRATEGIC REPORT | GOVERNANCE | FINANCIAL STATEMENTS
ASCENTIAL PLC — A REPORT OF THE YEAR 2015
Clear organic growth strategyWe have continued to deploy multiple initiatives for growth across our products with a clear aim of increasing both volumes of customers1 (up 3% in 2015) and average revenue per customer (up 5% in 2015).
The growth initiatives we deployed in 2015 included the launch of new digital products (such as Retail Week Prospect), the embedding of auto-renewal across our subscriptions customers, geo-cloning of exhibitions (such as CWIEME Istanbul) and show extensions (such as Lions Innovation). These are each described in more detail on pages 1 and 26.
Diversified and recurring revenue streamsRevenue by typeThe Group benefits from diverse revenue streams the majority of which have recurring characteristics. The most significant change over the last year has been an increase in events as a proportion of Group revenue, to 55% (2014: 53%), despite considerable currency headwinds for our largest event, Cannes Lions. Print advertising, by contrast, has reduced to just 4% (2014: 6%) of Group revenue.
Revenue by geographyContinuing the theme of prior years, our share of revenue from overseas markets increased again in 2015 and now just 48% of revenues come from customers based in the UK (2014: 52%). The performance of Money20/20, WGSN and Cannes Lions has increased the revenues from the Americas to 21%, with Asia Pacific, Middle East and Africa, and other Europe contributing 9%, 6% and 15% respectively.
1 Customer volumes and average revenue per customer are measured for Exhibitions & Festivals and the subscription products within Information Services.
Disciplined operational approachThe foundation of our growth is, and will continue to be, our focus on customer retention – there is no better way to judge the quality of our products than to measure how many customers choose to renew their contracts with us each year, and we spend considerable time reviewing those customers who do churn. Retention rates have grown considerably across our top products and this key measure is also supplemented through the year by Net Promoter Scores and product usage statistics, both of which are growing well across the board.
We continued to adjust and optimise our portfolio of products. During 2015 we acquired RetailNet Group, a forecasting and analytics business in the retail space for a consideration of £5.1m (net of cash acquired). This acquisition strengthens our Planet Retail offering by adding dedicated US coverage, expansion of the combined products to provide further forecasting capabilities and new US clients. We also disposed of Media Business Insight (consisting of Screen International, Broadcast, shots and BRAD) to funds advised by Mobeus Equity Partners.
OutlookThe new financial year has started well. Since the year end, Spring Fair, Bett UK and Pure Spring have taken place and performed in line with our expectations. Preparations for Money20/20 Europe in April also continue to progress well. While still early in 2016, we are encouraged by the current level of forward bookings and are confident of another good year of growth for the Group.
Strategic priorities for 2016Our strategy and priorities for 2016 are unchanged. Our growth plans will continue to be focused on customer retention and our top five product expansion plans.
We are 100% focused on enabling further success for our customers so that we may continue ours. We will continue to find new ways to satisfy, retain and grow our customers through investment in product features and extensions, new product development, and initiatives such as auto-renewal, onsite rebooking and location-based pricing. We are excited about the opportunities for 2016.
Duncan PainterChief Executive Officer14 March 2016

12 ASCENTIAL PLC — A REPORT OF THE YEAR 2015
We will continue to focus on our key products, creating more essential events and information services for our customers, thereby further expanding the number of companies that do business with us.
STRATEGY SUMMARY
We intend to extend the market-leading positions of the Group’s products and deepen our coverage of customer needs through targeted product development.
Progress• Launch of WGSN Lifestyle and Interiors• Launch of Retail Week Prospect• Launch of new award categories at
Cannes Lions• Launch of Lions Health (2014) and
Lions Innovation (2015)• Launch of Nursing Times Learning• Upcoming launches to expand current
portfolio include an improved WGSN Instock (March 2016) and Money20/20 Europe (April 2016)
Extend product coverage
We will seek customer growth by increasing product penetration in our current markets, selling existing products to new customer types, extend sales and marketing of our products into new geographies and adjacent markets, and exploring new channels to market. We intend to increase average revenue per customer, by upselling products to our existing customers, cross-selling under-penetrated products into existing customer bases, and selectively optimising pricing and developing new products.
Progress• On a constant currency basis, excluding
the impact of acquisitions and disposals, Group revenues grew in 2013, 2014 and 2015 by 7%, 7% and 6% respectively
• Selectively optimised pricing in Exhibitions & Festivals helped drive growth by aligning prices with customer value and return on investment
• New delegate propositions, including VIP packages, and new forms of sponsorship at Cannes Lions were introduced
• WGSN announced a JV with CTIC and entered into additional reseller agreements
Drive organic growth
To ensure our customers are connected and informed, we seek, where appropriate, to reinforce our digital products with face to face offerings, and vice versa.
Our belief is that by building products and developing channels that deliver our content and expertise across both platforms, we will stay at the heart of customers’ needs and in turn ensure Ascential is a successful business for the long term.
13
STRATEGIC REPORT | GOVERNANCE | FINANCIAL STATEMENTS
ASCENTIAL PLC — A REPORT OF THE YEAR 2015
We aim to further increase customer retention by improving customer service and our product offerings.
In Exhibitions & Festivals, we will continue to improve and deepen our content offerings. We will also use new technologies to improve service and streamline re-booking.
In Information Services, we will constantly strengthen our products in response to customer feedback, and improve customer service and renewal approaches.
Progress• Introduced tablets and e-contracts to
facilitate onsite re-booking at events• Developed churn prediction model to
refine customer service and renewal approaches in WGSN
• Drove re-book and, at specified exhibitions, even ‘pre-book re-book’
• Rolled out evergreen subscription contracts
We will continue to make selective acquisitions in high growth areas, and on occasion divest non-core assets. The Group will evaluate bolt-on opportunities from time to time against specific acquisition criteria including the target’s suitability for international expansion and ability to add value to our existing customers.
ProgressAcquisitions:• CWIEME (2012)• Educar (2013)• Mindset (2013)• Stylesight (2013)• Money20/20 (2014)• RetailNet Group (2015)
Selective acquisitions
Increase retention
We intend to improve our profitability and increase the Group’s Adjusted EBITDA margin through a focus on operational excellence and on organically growing our top products.
Progress• Adjusted EBITDA margins increased
from 25.4% in 2013 to 28.5% in 2015• We strengthened our cost controls and
carefully allocated our cost base towards the highest potential products
• We put in place well-invested sales, marketing and finance systems over the last few years
Improve margins

14 ASCENTIAL PLC — A REPORT OF THE YEAR 2015
OverviewThese results for 2015 are for Ascential Holdings Limited, head of the Group acquired by Ascential plc prior its listing on the London Stock Exchange in February 2016. In early February 2016, the Group underwent a pre-IPO reorganisation as part of which Ascential plc was incorporated and acquired the Group.
The results for the year are set out in the consolidated profit and loss statement and show revenue of £319.1m (2014: £312.7m) and Adjusted EBITDA of £90.9m (2014: £85.3m) with the Group delivering Organic growth in revenues of 6% and in Adjusted EBITDA of 14%. The Group also delivered strong cash flow in 2015 with free cash flow of £79.9m (2014: £68.3m), a conversion of 88% (2014: 80%). A summary of the operational performance of the Group is given in the following table.
In 2015, the Group continued to deliver Organic revenue growth, improved margins and strong cash conversion.
FINANCIAL REVIEW
10.5%Adjusted EBITDA Organic growth Exhibition & Festivals
15.4%Adjusted EBITDA Organic growth Information Services
15
STRATEGIC REPORT | GOVERNANCE | FINANCIAL STATEMENTS
ASCENTIAL PLC — A REPORT OF THE YEAR 2015
(£’million)Exhibitions &
FestivalsInformation
ServicesCentral
costsTotal
Group
2015Revenue 150.4 168.7 — 319.1Adjusted EBITDA 56.9 42.8 (8.8) 90.9 Adjusted EBITDA margin 37.8% 25.4% 28.5%Depreciation and amortisation of tangible fixed assets and software intangibles (2.2) (7.1) (8.2) (17.5)
Adjusted operating profit 54.7 35.7 (17.0) 73.4
2014Revenue 138.8 173.9 — 312.7Adjusted EBITDA 55.3 38.9 (8.9) 85.3 Adjusted EBITDA margin 39.9% 22.4% 27.3%Depreciation and amortisation of tangible fixed assets and software intangibles (1.9) (6.8) (9.4) (18.1)
Adjusted operating profit 53.4 32.1 (18.3) 67.2
IFRS and adjusted performance measuresThe table below provides a reconciliation between Adjusted and IFRS profit and loss measures. The Group uses adjusted figures as additional performance measures to assist readers of the accounts in understanding the underlying performance of the Group.
Adjusted operating profit excludes the amortisation of acquired intangibles, impairment, exceptional items and share-based payments. Adjusted Profit before tax excludes these items, together with any gains or losses on disposal of businesses, and one-off items within net finance costs. The Adjusted taxation charge excludes the tax effect of the above items. Adjusted EBITDA is Adjusted operating profit before expensing depreciation. The commentary on Cash Flow sets out how Adjusted operating profit and the adjusted measure of cash generation Free Cash Flow reconcile to IFRS reported Net Cash Flow.
2015 2014
(£’ million)Adjusted
results Adjustments IFRS resultsAdjusted
results Adjustments IFRS results
Revenue 319.1 – 319.1 312.7 – 312.7Costs (228.2) – (228.2) (227.4) – (227.4)
Adjusted EBITDA 90.9 – 90.9 85.3 – 85.3Depreciation, amortisation and impairment (17.5) (29.5) (47.0) (18.1) (26.6) (44.7)Exceptional items – (11.0) (11.0) – (18.0) (18.0)Share-based payments – (0.5) (0.5) – – –
Operating profit 73.4 (41.0) 32.4 67.2 (44.6) 22.6Gain on disposal – 4.8 4.8 – – –Net finance costs (24.5) (4.3) (28.8) (28.0) – (28.0)
Profit/(loss) before tax 48.9 (40.5) 8.4 39.2 (44.6) (5.4)Taxation (6.7) 14.4 7.7 12.1 13.1 25.2
Profit after tax 42.2 (26.1) 16.1 51.3 (31.5) 19.8
In order to provide a clear picture of our underlying performance, the Group also provides the following measure of Organic revenue growth which excludes the impact of acquisitions and disposals and movements in foreign exchange rates.

16 ASCENTIAL PLC — A REPORT OF THE YEAR 2015
Year-on-year Organic revenue growth2015 2014
Exhibitions & Festivals +13.1% +9.0%Information Services + 0.5% +5.4%
Group +6.1% +7.0%
RevenueReported revenues in 2015 grew to £319.1m (2014: £312.7m), an increase of £6.4m. However, direct comparability was affected by the disposal of the MBI business in January 2015 (contributing £0.7m of revenue in 2015 and £11.1m in 2014), the acquisition of RetailNet Group in June 2015 (contributing £1.8m of revenue in 2015) and by movements in exchange rates between the two years (amounting to the £2.9m adverse impact as mentioned below).
Adjusted EBITDAAdjusted EBITDA (which excludes exceptional items and share-based payments) increased to £90.9m (2014: £85.3m) an increase of £5.6m on a reported basis and an expansion in Adjusted EBITDA margin of 1.2 percentage points to 28.5%.
The £5.6m growth in Adjusted EBITDA was impacted by the disposal of MBI (£2.6m reduction), the acquisition of RNG (£0.4m addition) and foreign currency translation (£3.3m adverse). Group Organic growth of £11.1m includes £5.4m from Exhibitions & Festivals and £5.6m from Information Services. On an Organic basis, Group Adjusted EBITDA grew at 14.0%, with Exhibitions & Festivals growing at 10.5% and Information Services growing at 15.4%.
Foreign currency translation impactThe Group’s reported performance is sensitive to movements in both the euro and US dollar against pounds sterling.
In 2015 the Group received approximately 20% (2014: 21%) of its revenue, incurred 9% (2014: 10%) of its costs and generated 49% (2014: 50%) of its Adjusted EBITDA in euros. Each 1% movement in the euro to pounds sterling exchange rate has a circa £0.6m (2014: £0.6m) impact on revenue and a circa £0.4m (2014: £0.4m) impact on Adjusted EBITDA.
In 2015 the Group received approximately 20% (2014: 19%) of its revenue, incurred 17% (2014: 16%) of its costs and generated 30% (2014: 26%) of its Adjusted EBITDA in US dollars. Each 1% movement in the US dollar to pounds sterling exchange rate has a circa £0.7m (2014: £0.6m) impact on revenue and a circa £0.3m (2014: £0.2m) impact on Adjusted EBITDA.
The weighted average and closing exchange rates for euros and US dollars were as follows:
Weighted average rate Closing rate
2015 2014 2015 2014
Euro 1.40 1.22 1.36 1.28US dollar 1.53 1.64 1.48 1.56
When comparing 2014 and 2015, changes in currency exchange rates had an adverse impact of £2.9m (0.9%) on Group revenue and £3.3m (3.7%) adverse impact on Group Adjusted EBITDA. On a segmental basis, the impact of changes in foreign currency exchange rates was as follows:
• Exhibitions & Festivals: £5.7m (3.8%) adverse impact on revenue and £3.8m (6.8%) adverse impact on Adjusted EBITDA.• Information Services: £2.8m (1.6%) favourable impact on revenue and £0.4m (0.9%) favourable impact on Adjusted EBITDA.
FINANCIAL REVIEW CONTINUED
17
STRATEGIC REPORT | GOVERNANCE | FINANCIAL STATEMENTS
ASCENTIAL PLC — A REPORT OF THE YEAR 2015
Amortisation and impairmentAmortisation of intangible assets acquired through business combinations was £29.5m in 2015 (2014: £25.8m) with the increase of £3.7m primarily due to a full year’s amortisation charge in respect of Money20/20 acquired in August 2014. The Group undertakes a periodic review of the carrying value of its intangible assets and as a result of this review there was no impairment recognised in the year relating to intangible assets acquired through business combinations (2014: £nil) or to software or tangible fixed assets (2014: £0.8m).
Share-based paymentsThe Group had established a Long Term Incentive Plan (“LTIP”) to provide certain senior management with equity participation in the future prospects and performance of the Group. Shares were acquired at market value by participants and therefore no share-based payments charge was incurred. However, for legal and administrative reasons certain participants outside the UK and the US received their LTIP in cash-settled phantom awards giving rise to a share-based payments charge of £0.5m.
Exceptional itemsThe following table sets out the exceptional items incurred by the Group that have been excluded from the Adjusted EBITDA. The Group considers that separately identifying such items improves comparability of the financial results.
(£ million) 2015 2014
Acquisition-related contingent employment costs 5.5 1.8Expenses related to acquisition and disposal activities 0.9 2.8Acquisition integration costs 0.9 7.3IPO expenditure 1.7 –Business restructuring 1.7 0.3Professional fees on capital restructuring 0.3 3.6Financing and restructuring – 1.2Other exceptional items – 1.0
Total exceptional items 11.0 18.0
The acquisition-related contingent employment costs relate to the acquisition of Money20/20 in August 2014. Under the sale and purchase agreement, an element of the deferred consideration is contingent on both (i) the results of the business in 2015-17 and (ii) the continued employment of certain of the vendors. In accordance with IFRS, this element of the deferred consideration is treated as an expense recognised over the service lives of those vendors. In 2015 this expense amounted to £5.5m for the full 12 months (2014: £1.8m for a four month period) and further expense of £3.0m and £1.4m is expected in 2016 and 2017 respectively.
Exceptional costs relating to the IPO of £1.7m were incurred in 2015, with the remainder of the IPO-related cost of approximately £15m expected to be incurred in 2016 either as further exceptional items or as an offset against the share premium account.
Exceptional costs of £1.7m were also incurred in 2015 as a result of the creation of the Plexus operating company from the combination of EMAP, MEED, 4C Group and Planet Retail. The Group incurred exceptional costs related to acquisition and disposal activity of £0.9m (2014: £2.8m) in 2015, with a further charge of £0.9m (2014: £7.3m) related to post-acquisition integration costs. These principally relate to the acquisition of RetailNet Group.

18 ASCENTIAL PLC — A REPORT OF THE YEAR 2015
Net finance costsThe Group’s net finance expense for the year was £28.8m (2014: £28.0m).
The net interest expense on the Group’s net borrowings was £28.2m (2014: £32.6m) with the reduction driven by the reduced rate of interest payable following the Group’s April 2015 refinancing. However, the refinancing also resulted in £4.3m (2014: £nil) of break fees and write-off of loan arrangement fees in addition to the regular amortisation of such fees of £2.4m (2014: £3.0m). Other finance charges, which includes the fair value unwind of deferred consideration, were £2.3m (2014: £1.2m), driven by the addition of Money20/20 in August 2014. Fair value gains on derivative financial instruments were £4.2m (2014: £5.9m), mainly on instruments that do not form part of the Group’s financing structure following the IPO. Finally, net foreign exchange gains on cash and borrowings recognised in the income statement were £4.2m (2014: £2.9m).
TaxationThe Group’s reported tax charge for 2015 amounted to a credit of £7.7m (2014: £25.2m credit) being a current tax charge of £5.0m (2014: £6.2m) and a deferred tax credit of £12.7m (2014: £31.4m). The large deferred tax credit mainly relates to the recognition of the tax value of losses incurred by the Group in previous years in both the UK and the US.
The Group’s Adjusted tax charge (after adjusting for the tax effect of adjusting items such as the amortisation of acquired intangibles) amounted to a charge of £6.7m (an effective tax rate on Adjusted profit before tax of 14%).
Cash flowThe Group’s cash flow statement and net debt position can be summarised as follows:
(£ million) 2015 2014
Adjusted operating profit 73.4 67.2Depreciation and amortisation of tangible fixed assets and software intangibles 17.5 18.1
Adjusted EBITDA 90.9 85.3Working capital movements 1.1 (4.5)
Operating cash flow 92.0 80.8Capital expenditure (10.9) (11.3)Tax paid (1.2) (1.2)
Free cash flow 79.9 68.3% Free cash flow conversion 88% 80%Exceptional costs paid (11.9) (14.8)Acquisition consideration paid (19.7) (26.6)Disposal proceeds received 10.6 1.3
Cash flow before financing activities 58.9 28.2Net interest paid (37.9) (26.6)Debt drawdown/(repayments) 1.4 (11.2)
Net cash flow 22.4 (9.6)
Opening cash balance 19.8 29.6FX movements 0.8 (0.2)
Closing cash balance 43.0 19.8Borrowings (436.1) (429.2)Capitalised arrangement fees 10.5 3.9Derivative financial instruments (1.1) (2.8)
Net Debt (383.7) (408.3)
FINANCIAL REVIEW CONTINUED
19
STRATEGIC REPORT | GOVERNANCE | FINANCIAL STATEMENTS
ASCENTIAL PLC — A REPORT OF THE YEAR 2015
The Group generated operating cash flow of £92.0m (2014: £80.8m) an increase of 14%, primarily due to the strong operational performance of the business and a return to a small working capital inflow in the year of £1.1m (compared to the £4.5m outflow in 2014 caused by the timing of the Money20/20 acquisition and event).
Capex remained broadly flat at £10.9m (2014: £11.3m) reflecting the well-invested nature of the business following the Group’s Transformation Programme of 2012/13. Cash tax was a small cash outflow of £1.2m (2014: £1.2m) and benefited from the utilisation of historic tax losses in the UK and US. The Group therefore generated free cash flow of £79.9m (2014: £68.3m) an increase of 17%, which was used to fund interest payments, acquisition costs and exceptional items with the balance reducing net indebtedness.
Capital structureIn the first half of the year Group undertook a refinancing of its borrowings to improve terms and extend maturities. The refinancing was completed in April 2015 and the new facilities comprised US$323m and €300m term loan maturing in April 2022 and a £75m revolving credit facility maturing in April 2021.
Subsequently, on 12 February 2016, and in order to achieve an opening leverage ratio of c.2.5x, the Group refinanced again and entered into new post-IPO term loan facilities of £66m, €171m and $96m as well as a revolving credit facility of £95m. Together with the net proceeds of the IPO of £183m, and existing cash resources, the Group used these new term loan facilities to repay all amounts under the Group’s existing senior facilities and to cancel certain related hedging arrangements. The new post-IPO bank facilities mature in February 2021 and have an initial rate of interest of 2.25% over LIBOR. The facilities include a net leverage ratio covenant of 4.5x which is measured at December 2016 and then semi-annually thereafter. The covenant ratio falls to 4.0x in December 2017.
Acquisitions and disposalsIn June 2015 the Group acquired RetailNet Group, a US-based provider of forecasting and analytics, consulting and executive education services to the retail sector for total consideration of £5.7m of which £3.1m was paid in the year and £2.6m is deferred and payable in 2018. The Group incurred £0.5m of professional fees on the acquisition which it recorded as an exceptional cost and the business contributed £1.8m of revenue and £0.4m of Adjusted EBITDA to the Group’s 2015 results.
The Group sold MBI in January 2015 for £11.0m generating a profit on disposal of £4.8m. MBI therefore contributed only £0.7m of revenue and £0.1m of Adjusted EBITDA to the Group’s 2015 result.
Finally, in 2015 the Group paid £17.1m of deferred consideration relating to Money20/20 and Educar.
DividendsAscential plc was incorporated in January 2016 and, as indicated at the time of the IPO, expects to pay its first dividend in respect of the 2016 financial results with one-third paid in November 2016 and two-thirds paid in May 2017. The Board is targeting a pay-out ratio of 30% of Adjusted profit after tax.
Mandy GraddenChief Financial Officer14 March 2016
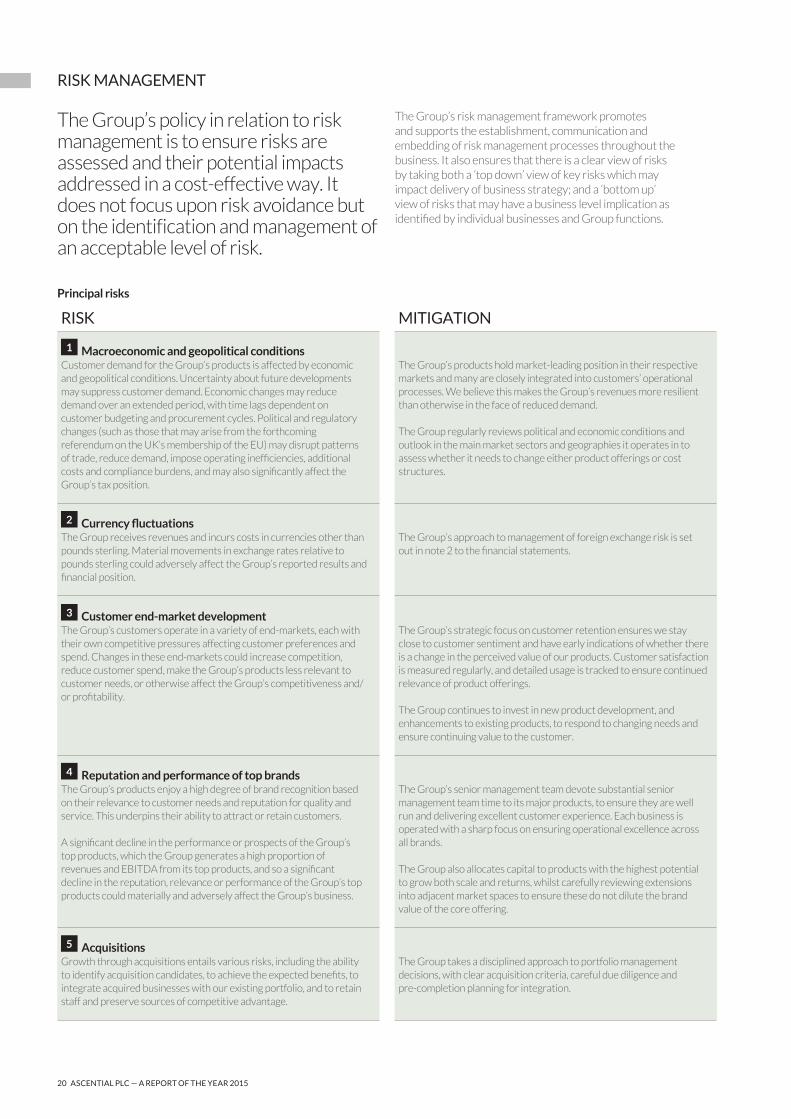
20 ASCENTIAL PLC — A REPORT OF THE YEAR 2015
RISK MANAGEMENT
Principal risks
RISK MITIGATION
1 Macroeconomic and geopolitical conditionsCustomer demand for the Group’s products is affected by economic and geopolitical conditions. Uncertainty about future developments may suppress customer demand. Economic changes may reduce demand over an extended period, with time lags dependent on customer budgeting and procurement cycles. Political and regulatory changes (such as those that may arise from the forthcoming referendum on the UK’s membership of the EU) may disrupt patterns of trade, reduce demand, impose operating inefficiencies, additional costs and compliance burdens, and may also significantly affect the Group’s tax position.
The Group’s products hold market-leading position in their respective markets and many are closely integrated into customers’ operational processes. We believe this makes the Group’s revenues more resilient than otherwise in the face of reduced demand.
The Group regularly reviews political and economic conditions and outlook in the main market sectors and geographies it operates in to assess whether it needs to change either product offerings or cost structures.
2 Currency fluctuationsThe Group receives revenues and incurs costs in currencies other than pounds sterling. Material movements in exchange rates relative to pounds sterling could adversely affect the Group’s reported results and financial position.
The Group’s approach to management of foreign exchange risk is set out in note 2 to the financial statements.
3 Customer end-market developmentThe Group’s customers operate in a variety of end-markets, each with their own competitive pressures affecting customer preferences and spend. Changes in these end-markets could increase competition, reduce customer spend, make the Group’s products less relevant to customer needs, or otherwise affect the Group’s competitiveness and/or profitability.
The Group’s strategic focus on customer retention ensures we stay close to customer sentiment and have early indications of whether there is a change in the perceived value of our products. Customer satisfaction is measured regularly, and detailed usage is tracked to ensure continued relevance of product offerings.
The Group continues to invest in new product development, and enhancements to existing products, to respond to changing needs and ensure continuing value to the customer.
4 Reputation and performance of top brandsThe Group’s products enjoy a high degree of brand recognition based on their relevance to customer needs and reputation for quality and service. This underpins their ability to attract or retain customers.
A significant decline in the performance or prospects of the Group’s top products, which the Group generates a high proportion of revenues and EBITDA from its top products, and so a significant decline in the reputation, relevance or performance of the Group’s top products could materially and adversely affect the Group’s business.
The Group’s senior management team devote substantial senior management team time to its major products, to ensure they are well run and delivering excellent customer experience. Each business is operated with a sharp focus on ensuring operational excellence across all brands.
The Group also allocates capital to products with the highest potential to grow both scale and returns, whilst carefully reviewing extensions into adjacent market spaces to ensure these do not dilute the brand value of the core offering.
5 AcquisitionsGrowth through acquisitions entails various risks, including the ability to identify acquisition candidates, to achieve the expected benefits, to integrate acquired businesses with our existing portfolio, and to retain staff and preserve sources of competitive advantage.
The Group takes a disciplined approach to portfolio management decisions, with clear acquisition criteria, careful due diligence and pre-completion planning for integration.
The Group’s policy in relation to risk management is to ensure risks are assessed and their potential impacts addressed in a cost-effective way. It does not focus upon risk avoidance but on the identification and management of an acceptable level of risk.
The Group’s risk management framework promotes and supports the establishment, communication and embedding of risk management processes throughout the business. It also ensures that there is a clear view of risks by taking both a ‘top down’ view of key risks which may impact delivery of business strategy; and a ‘bottom up’ view of risks that may have a business level implication as identified by individual businesses and Group functions.
21
STRATEGIC REPORT | GOVERNANCE | FINANCIAL STATEMENTS
ASCENTIAL PLC — A REPORT OF THE YEAR 2015
RISK MITIGATION
6 Geographic expansionAn element of the Group’s growth strategy is expanding into higher growth geographic markets. This expansion presents management, logistical and compliance challenges. Inadequate plans or poor execution in addressing these challenges may damage the Group’s growth prospects and reputation.
The Group’s plans for expansion into new markets are developed as part of the annual strategic planning cycle. Implementation of these plans involves careful selection of local partners, support from professional advisers, and regular monitoring by senior management.
7 Technological changeThe Group’s products depend on custom-designed IT platforms. These platforms require continual development to ensure the services remain competitive, by enhancing existing offerings and building new solutions to meet customer requirements. The Group also develops IT systems to support its own internal operations.
Such technological development carries the risks of poor quality implementation, delivery delays, and failure to deliver the expected benefits such as desired customer solutions, business improvements or cost efficiencies. In addition customer-facing platforms may be rendered obsolete by newer technologies offering faster, more flexible or more relevant solutions to customer needs.
The Group reviews all major technology development proposals at a senior level, and manages subsequent delivery through robust project management.
There are rigorous policies and processes in respect of maintenance and updates of hardware and software infrastructure to ensure systems are robust and up to date.
The Group maintains an awareness of emerging technology developments through a variety of sources including relationships with existing vendors and independent partners, market research, and involvement with peer networks.
8 Technology securityThe Group relies on electronic platforms and distribution systems to provide customer service. The Group also relies on IT systems to manage the Group’s business data, communications, and business processes. These systems are also heavily dependent on the internet, both as a means of distribution and for hosting services.
These systems could suffer damage or interruption from a variety of causes, including fire, natural disasters, power outages, systems failures, security breaches, cyber-attacks and viruses. Such incidents could disrupt the Group’s business, requiring management time and incurring additional cost to resolve the issue. This could also result in transaction errors, processing inefficiencies, and the loss of sales and customers.
In addition, breaches of data security systems or other unauthorised access to the Group’s data could damage its reputation and lead to a risk of loss of customers, liability for damages, litigation, and more onerous compliance requirements from government regulators.
The Group’s IT function maintains and tests network security, network resilience and business continuity plans, and monitors emerging threats to ensure our preparations and responses are current. We also make use of industry-leading software and services in support of these activities.
The Group runs quarterly meetings with representation from all major products and central group functions to review technology security issues and risks, and to ensure appropriate responses are put in place.
Each operating company develops its own clearly defined security objectives in collaboration with the central Group IT function, which are reviewed and updated on a regular basis by the senior management of that business.
9 Loss of event venue or inability to travelThe Group’s events are held at specific locations on particular dates each year. These specific locations may be unavailable for use through damage, or may become available only on uneconomic terms.
In addition, various factors may disrupt travel or pose a safety risk, preventing both customers and our own staff from reaching the event location, or leading to customers being unwilling to travel. Examples of such factors include natural disasters, risk of disease, civil disorder, political instability, and terrorism.
The Group maintains close relationships with major venue providers, and also maintains contingency plans to move events if necessary.
Business continuity plans are also in place to minimise disruption and financial impact. Our contractual terms provide some protection against the risk of late cancellation, and we maintain insurance cover in respect of certain event cancellation risks.
10 TaxationThe Group has operations in 14 countries and multiple states in the United States and sells its products and services into more than 150 countries, and so is subject to many different forms of taxation in many different jurisdictions.
Tax law and administration is complex, and tax authorities may challenge the Group’s application of tax law, potentially leading to lengthy and costly disputes and material tax charges.
The Group maintains an experienced tax function, supported by external professional advisers, to ensure that the Group maintains a constructive relationship with tax authorities, and keeps up to date with changes in tax legislation and in the development of the Group’s operations.

22 ASCENTIAL PLC — A REPORT OF THE YEAR 2015
AT THE HEART OF CUSTOMER NEEDS
Customer value retention
92%
94%
23
STRATEGIC REPORT | GOVERNANCE | FINANCIAL STATEMENTS
ASCENTIAL PLC — A REPORT OF THE YEAR 2015
94%
93%

22 ASCENTIAL PLC — A REPORT OF THE YEAR 2015
AT THE HEART OF CUSTOMER NEEDS
Customer value retention
92%
94%
23
STRATEGIC REPORT | GOVERNANCE | FINANCIAL STATEMENTS
ASCENTIAL PLC — A REPORT OF THE YEAR 2015
94%
93%

24 ASCENTIAL PLC — A REPORT OF THE YEAR 2015
The Exhibitions & Festivals segment performed extremely well in 2015, with Organic growth in revenues and Adjusted EBITDA of 13% and 11% to £150.4m (2014: £138.8m) and £56.9m (2014: £55.3m) respectively.
The segment has considerable foreign currency exposure, with Cannes Lions and CWIEME revenues denominated primarily in euro and Money20/20 in US dollars, while the majority of the segment’s cost base is denominated in pounds sterling. For this reason reported revenues grew by 8% and Adjusted EBITDA by 3%. The business made good progress against its key growth initiatives in 2015:
• Pre-book/re-book: We continued to roll out pre-book and re-book of all exhibition space targeting to achieve a 70% onsite re-book and we delivered our first on-site rebook of the exhibition space at Money20/20 US. The strengthening pre-book and re-book performance gives good visibility for business planning, strong working capital characteristics and frees up the sales force for the balance of the year to concentrate on improved
SEGMENTAL REVIEW – EXHIBITIONS & FESTIVALS
customer service, new business and supporting customer demand for extending their product purchases.
• Location-based pricing: We benefited from the 2014 launch of location-based stand pricing (where we differentiate our pricing based on position in hall and type of stand design) at Autumn Fair, and launched location-based pricing at Spring Fair 2015 and CWIEME Berlin 2015 (both coming into effect in 2016 revenues). We are rolling out location-based pricing at Bett 2016 (for 2017).
• Show editing: We undertook major re-edits at Spring Fair 2015 and benefited from the moves of the Home and Kitchen and Dining sections within the venue which optimised space and footfall in line with customer demand.
• Show Extensions: Our show extensions
programme which takes existing event products to new geographies based on customer demand delivered the successful launch of CWIEME Istanbul. Exhibitors from 18 countries showcased their latest products and technologies with almost 70% already re-booked for the 2016 event. Istanbul is the fourth show extension in the CWIEME exhibition series and joins Berlin, Chicago and Shanghai.
• Product development: We launched Lions Innovation for the data and technology specialists in the creative communications industry to run in parallel with the main Cannes Lions festival for Creativity in Cannes.
25
STRATEGIC REPORT | GOVERNANCE | FINANCIAL STATEMENTS
ASCENTIAL PLC — A REPORT OF THE YEAR 2015
Cannes LionsCannes Lions, held each June, is the world’s largest and most widely recognised festival for creativity in the branded communications industry. It saw another year of good growth in its core week-long event with over 9,500 paying delegates and 40,000 entries from over 90 countries, further cementing its position as the ‘must attend’ and ‘must enter’ festival for the branded communications industry. Revenues increased to £42.5m (2014: £41.0m) up 18% on a constant currency basis.
In addition, 2015 saw the successful launch of the Lions Innovation festival extending participation to new customer groups within the technology-led segments of the industry. This follows the launch of Lions Health in 2014, which experienced strong growth in delegates, entries and revenues in its second year in 2015. Spring and Autumn FairSpring Fair is the UK’s largest trade exhibition and is held at the NEC in Birmingham. It is the clear market leader in the UK’s gift and homewares exhibitions market.
Performance in 2015 was very strong with revenues up 10% to £33.1m (2014: £30.1m), driven by (i) the introduction of location-based pricing at Autumn Fair 2014 (benefiting the 2015 show) and (ii) a major show re-edit at Spring Fair 2015 enhancing footfall and revenues from the Home, Kitchen and Dining segments. Location-based pricing was introduced at Spring Fair 2015 for the 2016 show.
Money20/20Money20/20 is the leading US congress in the payments and financial services innovation sector, focusing on the evolution of payments and financial services through mobile, retail, marketing services, data and technology, and is held each autumn in Las Vegas.
Money20/20 US saw another year of strong growth in delegates, exhibitors, speakers and revenues in its second year of operation within the Group. Paying delegates reached 8,900 (2014: 6,900), confirming its leading position in the market. Revenues for the year were £18.7m (2014: £12.7m), up 38% on an Organic basis. Preparations are progressing well for the European product extension event to be held in Copenhagen in April 2016.
+90Entries to Cannes from over 90 countries
£33.1mSpring and Autumn Fair 2015 revenue

26 ASCENTIAL PLC — A REPORT OF THE YEAR 2015
As well as delivering good growth, the segment also expanded margins to 25% (2014: 22%) driven mainly by the successful integration of WGSN and Stylesight in 2014. The year was more mixed in terms of revenue which grew by 0.5% on an Organic basis to £168.7m (2014 £173.9m). Groundsure had strong revenue growth but this was offset by weakness in our Middle East business MEED and the continuing decline in print advertising revenues. Growth excluding the planned decline in print advertising was 3.5%.
SEGMENTAL REVIEW – INFORMATION SERVICES
We made good progress against our key growth initiatives in Information Services:
• Renewal rates: Increased billings for our subscription products by a blended 6% and increased renewal rates from 87% to 90%.
• Product development: Launched four new, high-value, digital products to sell to our existing subscriber base (WGSN StyleTrial, Retail Week Prospect, Planet Retail Shopology and Nursing Times Learning).
• Auto-renewal: Rolled out auto-renewal contract terms across all our subscription products giving our customers a simple way to continue to enjoy our products while delivering standard price increases and freeing up the account managers in our sales teams from routine renewal administration.
• Geographic expansion: Entered into an agreement to launch three joint ventures with our Chinese partner CTIC to expand the number of customers in China who buy WGSN products and to co-develop a new colour product.
• Corporate subscription model: Accelerated the shift in subscribers to our subscription-led products from individuals to corporate subscriptions (now 31% (2014: 20%) of subscribers in our subscription-led products) delivering benefits in terms of improved renewal rates, reduced cost to serve and improved product mix in favour of digital.
• Transition to digital: As part of our migration to a digital-only business we turned off the ability for new subscribers to purchase a print based version of our product in Nursing Times and Retail Week. Print advertising revenue for our continuing products reduced from £15.1m to £11.6m, a reduction of 23%. Print advertising now represents 4% (2014: 6%) of Group revenues and is planned to continue to reduce at similar rates over the next few years.
We continued to actively manage the portfolio with the sale of MBI in January 2015 and the acquisition of RetailNet Group in June 2015. We also brought the leadership of EMAP, 4C and Planet Retail together under the Plexus brand as we pursued our strategy to accelerate the migration of print customers to digital and/or events revenue streams.
The Information Services segment delivered good growth in profitability in 2015, increasing its Adjusted EBITDA by 15% on an Organic basis to £42.8m (2014: £38.9m).
27
STRATEGIC REPORT | GOVERNANCE | FINANCIAL STATEMENTS
ASCENTIAL PLC — A REPORT OF THE YEAR 2015
WGSNWGSN is the global leading product for market intelligence, insight and trend forecasts to the fashion industry and to businesses in design-led consumer markets. It is the Group’s largest product by revenue and represents 36% of the revenues of the Information Services segment. WGSN grew revenues by 3% on an Organic basis to £60.5m. However, having completed its integration with Stylesight in 2014, WGSN returned to strong billings growth in 2015 achieving 6% for the year as a whole.
WGSN continued to develop its suite of new and existing digital products,
with the imminent launch of the single integrated platform which makes all of WGSN’s various products visible to customers through a single platform to be followed by a major refresh of its range management product – WGSN INstock.
WGSN also expanded its geographical reach through agreeing a joint venture with CTIC in China. CTIC was established by the Chinese government to develop and promote the Chinese domestic and international fashion industry. This JV will become effective in 2016 and will seek to extend the customer base of WGSN in China. In addition WGSN has also entered in a further JV with CTIC to develop a new colour management product.
GroundsureGroundsure is a market-leading provider of environmental risk data to solicitors, conveyancers, architects, lenders and other participants in the UK residential and commercial property industry. It has a highly developed ecommerce ordering platform, detailed archive and well established reseller relationships. The business continued to benefit from a strengthening UK property market. In its key residential market, Groundsure was able to grow revenues during 2015 significantly ahead of the underlying growth rate for UK housing transactions. Revenues for 2015 were £14.2m (2014: £12.6m), up 13% year-on-year.

28 ASCENTIAL PLC — A REPORT OF THE YEAR 2015
TRACK RECORD OF STRONG GROWTH
Revenue (£m) and Organic growth (%)
Exhibitions & Festivals Information Services
118.12013
138.82014
150.4
153.3
173.9
168.7
271.4
312.7
319.12015
7%
6%
7%
29
STRATEGIC REPORT | GOVERNANCE | FINANCIAL STATEMENTS
ASCENTIAL PLC — A REPORT OF THE YEAR 2015

30 ASCENTIAL PLC — A REPORT OF THE YEAR 2015
Understanding and responding to customer needs, developing and delivering compelling products and services, maintaining a focused and disciplined operational approach and combining all of these to sustain a dynamic, growing business are at the core of our strategy.
This all comes from the hard work, expertise, and enthusiasm of our people, day in day out, across the world.
The Group is committed to supporting the development of employees through formal skills training programmes, and people are also encouraged to personally develop skills and learning from their Group colleagues, both at the annual company conference, through our leadership Alumni Programme, our Sales Leaders Forums, and in their day to day working lives. Ascential employees never stand still: we know there is always more to learn, more to do and more to offer. Ascential people are naturally innovative and inquisitive, seeking to better understand the industries they serve and discover new, effective ways to serve customers’ needs and grow their businesses.
EliteThe Elite programme enables us to recognise and reward our very top performers. Their outstanding contribution and exceptional achievements are celebrated at regular events, quarterly celebrations and with once in a lifetime holidays.
PEOPLE REVIEW
Elite winners stand out amongst their peers and are acclaimed for their outstanding performance, which in turn helps deliver our growth ambitions and create a sustainable, growing product portfolio with customers at their heart. Elite is open to all employees, regardless of where they work across the Group.
DiversityWe are committed to providing equality of opportunity to all existing and prospective employees without unlawful or unfair discrimination. Full support is given to the employment and advancement of disabled people.
Gender equality Ascential regularly carries out benchmarking within the industry and across locations where we work to ensure wages are appropriate, fair and equal for men and women.
In a company that employs almost 60% women, we have adopted a leading approach to gender diversity and are proud our Board currently consists of 37.5% women, exceeding the recommendations of the Davies Report.
Ascential Holdings Limited employee numbers by gender as at 31 December 2015 were 939 female and 655 male employees. Directors and Key Management were one male and one female, these being the CEO and CFO respectively.
We are a growing international company, employing highly skilled, motivated people in all our local offices around the world. During 2015 we welcomed RetailNet Group, and moved the headquarters of WGSN to New York. As a result, the US is now home to one of our principal offices and is set to become one of our major operating territories. To harness the skills and energy of a diverse, widespread group of people we believe it is vital to be clear about the values we all hold to, to help our people develop personally and professionally, to reward and celebrate excellence, and to treat everyone with respect and fairness regardless of background.
High performance cultureTo ensure our products gain and retain market leading positions, we have continued to develop our talented employees as well as attract new individuals to the Group. We now employ more than 1,500 people.
Our values
Laser focus We have absolute clarity of purpose. We are direct and straightforward. Integrity and simplicity are in our DNA. Our products enable companies to better understand their industries, their customers and the future. We have the confidence to only focus on the things that matter.
Progressive growth
We enable continuous growth for our people, our business and our customers. We never stand still, there is always more to learn, more to be and more to offer and we move at pace.
Creating value
We place great value in our people, in difference, in diversity and an outward looking perspective. Our purpose is to create value for the industries we serve and for our shareholders by providing the most influential platforms and forums for leaders of industry. We derive true value from exceptional knowledge, brilliant relationships and looking for important and unique connections.
31
STRATEGIC REPORT | GOVERNANCE | FINANCIAL STATEMENTS
ASCENTIAL PLC — A REPORT OF THE YEAR 2015
TravelAscential aims to proactively reduce its carbon footprint. Although some business plane travel is unavoidable for an international business, Ascential continues to encourage the use of webinars and video conference facilities as much as possible to remove any unnecessary travel.
Giving backA core strength of Ascential employees is their commitment and passion for the communities we live in and serve. They want to make a real difference to the world around us, not just for customers through our great products, but for those less able to help themselves.
In 2012, the Group became a Patron of The Prince’s Trust and employees have continued to give their time to help disadvantaged young people get a better start in life. In 2015, the Prince’s Trust ‘Million Makers’ team were given £1,500 seed funding to support their
SUSTAINABILITY
fundraising efforts. The team worked tirelessly running internal events for staff and organising casino tables at several Ascential awards events and a glittering Gala Dinner. Through their enormous commitment the team raised nearly £90,000. The team was also recognised by The Prince’s Trust at their annual awards ceremony, when the Ascential team won the 2015 Above and Beyond Award.
2015 was the Group’s second year supporting Great Ormond Street Hospital for Sick Children in London. Internal Ambassadors and employees worked within their business units to raise almost £42,000 – taking our two year total to more than £130,000 – which paid for specialist staff and equipment at the world-famous, pioneering hospital.
The business gives employees time to volunteer for an organisation or charity that helps those less fortunate and also matches certain fundraising by staff.
We are a destination employer and believe it is vital to create an environment where people can be their best and to grow their skills and experiences across our businesses and territories we operate in.
In October 2015, our largest shareholder, Apax, was awarded the British Venture Capital Association’s Responsible Investment Award for both its responsible investment framework and also engagement with portfolio companies on responsible investment. Ascential was mentioned as an example under social impact and governance impact.
Increasing energy efficiency and recyclingAcross the Group and around the world, we work with our landlords and employees to actively minimise waste and maximise both efficiency and recycling in all its forms. As an example, we target the installation of energy efficient low temperature hot water systems, low energy lighting and low power technology in our major offices.
Reducing print in line with customer needFor magazine print, Plexus purchased 882 tonnes of paper in 2015, a reduction of almost 50% over 2014. This was driven by the sale of MBI, the reduction in certain magazine frequencies and the continuing increase in digital-only subscribers as customers move away from print. Our contracted print suppliers all hold PEFC, FSC chain of Custody and are 14001 accredited, ensuring that the paper stock for our products is sustainably sourced.
Ascential’s environmental and social policies are guided by our values. We believe that when the business operates to the highest environmental, social and governance standards we perform more efficiently, attract and retain staff and make a difference to the communities we serve.

32 ASCENTIAL PLC — A REPORT OF THE YEAR 2015
HIGH MARGINS AND GOOD CASH GENERATION
2015 Adjusted EBITDA margin of
37.8%of Exhibition & Festival
88.0%Free cash flow conversion
33
STRATEGIC REPORT | GOVERNANCE | FINANCIAL STATEMENTS
ASCENTIAL PLC — A REPORT OF THE YEAR 2015
2015 Adjusted EBITDA margin of
25.4%of Information Services

34 ASCENTIAL PLC — A REPORT OF THE YEAR 2015
BOARD OF DIRECTORS
Scott ForbesChairman
Duncan PainterChief Executive Officer
Mandy GraddenChief Financial Officer
Paul HarrisonNon-Executive Director
Scott was appointed as an adviser to the Board in November 2015 and became Chairman in January 2016. Scott currently serves as Chairman of both Rightmove plc and Innasol Group Limited. He previously served as the Chairman of Orbitz Worldwide until September 2015. Scott has over 35 years’ experience in operations, finance and mergers and acquisitions including 15 years at Cendant Corporation, which was formerly the largest provider of travel and residential property services worldwide. Scott established Cendant’s international headquarters in London in 1999 and led this division as Group Managing Director until he joined Rightmove.
Duncan joined the Group in October 2011. Duncan previously worked as an executive in BSkyB Plc supporting their growth objectives to ten million customers. His previous roles also include Global Product Leader at Experian plc, Founder and Chief Executive of consumer intelligence company ClarityBlue, which was acquired by Experian in 2006, and European Systems Integration Director for Hitachi Data Systems.
Mandy joined the Group in January 2013. Most recently, Mandy was CFO at Torex, the privately-held retail technology firm, and was a key member of the team that managed the successful turnaround and sale of that business. Prior to that, she was CFO at the listed business and technology consultancy, Detica Group plc. Earlier, she was Director of Corporate Development at Telewest and Group Financial Controller at Dalgety. Mandy qualified as a chartered accountant with Price Waterhouse in 1992. She also sits as a Non-Executive Director on the Board, and is Chairman of the Audit Committee, of SDL plc.
Since September 2013, Paul has been CFO for WANdisco plc, a software company listed on the London Stock Exchange. Prior to this, Paul spent 16 years with the Sage Group plc, a FTSE 100 software company, serving on its board for 13 years as CFO. Since 2007, Paul has served as an independent Non-Executive Director on the Board of Hays plc, chairing its Audit Committee from 2007 to 2011 and its Remuneration Committee from 2011 to present. A chartered accountant, Paul worked for Price Waterhouse before joining the Sage Group. Paul also sits on the advisory panel for Tech City’s Future Fifty Programme.
Joined the Group: January 2016
Joined the Group: October 2011
Joined the Group: January 2013
Joined the Group: January 2016
Independent: No
Independent: No
Independent: No
Independent: Yes
Committees:Nomination Committee (Chair)
Committees:None
Committees:None
Committees: Audit Committee (Chair), Remuneration Committee
The Directors of Ascential Holdings Limited are Duncan Painter and Mandy Gradden. The Directors of Ascential plc are as follows:
35ASCENTIAL PLC — A REPORT OF THE YEAR 2015
STRATEGIC REPORT | GOVERNANCE | FINANCIAL STATEMENTS
Judy VezmarNon-Executive Director
Tom HallNon-Executive Director
Gillian KentNon-Executive Director
David PemselNon-Executive Director
Judy was Chief Executive Officer of LexisNexis International, a division of Reed Elsevier plc, from 2001 until February 2014. LexisNexis is a leading provider of content enabled workflow solutions, employing 3200 people. Judy was responsible for the successful expansion of online services to over 100 countries. Prior to LexisNexis she held executive roles within the Xerox Corporation in the United States and Europe. Judy was a Non-Executive Director of Rightmove plc from 2006 to 2015 and served on the Audit, Remuneration and Nominations Committees. She was also on the Board of Blinkx plc, the online advertising business from 2014 to 2015.
Tom joined the Group in 2011 and was Chairman until January 2016. He is an Equity Partner in the Consumer team and the Digital Practice at Apax Partners. He joined Apax in 1998 and is based in London. Exited deals he has led or participated in include SouFun, Thomson Directories, The Stationery Office, 20 Minuten, Future Publishing and Zeneus Pharma. Current investments he has led include AutoTrader, idealista and RFS/wehkamp. Prior to joining Apax, Tom worked at S.G. Warburg and Deutsche Bank.
Gillian has had an executive career spanning 25 years in software, internet, digital media and mobile technologies, including various senior roles at Microsoft, including Managing Director of MSN UK, creating one of the UK’s largest online service businesses. Both at Microsoft and in a range of other businesses, including media, fashion and as CEO of Propertyfinder.com, she established her expertise in building markets and brands for products and services Gillian is also Non-Executive Director at Pendragon plc and NAHL Group plc.
David was appointed as a Non-Executive Director of the Group in 2015. David is CEO of GMG. He joined Guardian News & Media (“GNM”) in 2011 and served as Chief Marketing Officer, Chief Commercial Officer and Deputy Chief Executive, before being appointed CEO of GMG in July 2015. As CEO of GMG, David holds a position on the boards of both GMG and The Scott Trust, GMG’s owner. Prior to joining GNM, David worked in many senior roles within advertising and marketing. In 2000 he launched Shine Entertainment before joining ITV as Group Marketing Director in 2005. David is a member of the IPA Client Council, a Council member of the Marketing Group of Great Britain and a Voting Member of BAFTA.
Joined the Group: January 2016
Joined the Group:December 2011
Joined the Group: January 2016
Joined the Group: July 2015
Independent: Yes
Independent: No
Independent: Yes
Independent: No
Committees:Remuneration Committee (Chair), Audit Committee, Nomination Committee
Committees:None
Committees:Audit Committee, Remuneration Committee and Nomination Committee
Committees:None

36 ASCENTIAL PLC — A REPORT OF THE YEAR 2015
FINANCIAL INFORMATIONThe following pages include information extracted from the audited financial statements of Ascential Holdings Limited for the year ended 31 December 2015.
STRATEGIC REPORT | GOVERNANCE | FINANCIAL STATEMENTS
37ASCENTIAL HOLDINGS LIMITED – FINANCIAL STATEMENTS 2015
STATEMENT OF DIRECTORS’ RESPONSIBILITIESFOR THE YEAR ENDED 31 DECEMBER 2015
The Directors’ of Ascential Holdings Limited (“the Company”) have accepted responsibility for the preparation of these non-statutory financial statements for the year ended 31 December 2015 which are intended by them to give a true and fair view of the state of affairs of the Company and of the profit for that year. They have decided to prepare the non-statutory financial statements in accordance with International Financial Reporting Standards (“IFRSs”) as adopted by the European Union (“the EU”).
In preparing these non-statutory financial statements, the Directors have:• selected suitable accounting policies and applied them consistently;• made judgements and estimates that are reasonable and prudent;• stated whether they have been prepared in accordance with IFRSs as adopted by the EU; and• prepared the non-statutory financial statements on the going concern basis unless it is inappropriate to presume that the
Group will continue in business.
The Directors have general responsibility for taking such steps as are reasonably open to them to safeguard the assets of the Company and to prevent and detect fraud and other irregularities.

38 ASCENTIAL HOLDINGS LIMITED – FINANCIAL STATEMENTS 2015
REPORT OF KPMG LLP TO THE DIRECTORS OF ASCENTIAL HOLDINGS LIMITEDFOR THE YEAR ENDED 31 DECEMBER 2015
Independent auditor’s report to Ascential Holdings Limited (formerly Eden Acquisition 5 Limited)We have audited the non-statutory financial statements of Ascential Holdings Limited (“the Company”) for the period 1 January 2015 to 31 December 2015 set out on pages 39 to 71. These non-statutory financial statements have been prepared for the reasons set out in Note 1 to the non-statutory financial statements and on the basis of the financial reporting framework of International Financial Reporting Standards (“IFRSs”) as adopted by the EU.
This report is made to the Company solely in response to a request from the Company for an opinion from independent auditors on the truth and fairness of the non-statutory financial statements, as required under the Shareholders’ agreement dated 16 December 2014 (and subsequently amended on 17 March and 5 May 2015). Our audit work has been undertaken so that we might state to the Company those matters we have been engaged to state to the Company in this report and for no other purpose.
Our report was designed to meet the agreed requirements of the Company determined by the Company’s needs at the time. Our report should not therefore be regarded as suitable to be used or relied on by any party wishing to acquire rights against us other than the Company for any purpose or in any context. Any party other than the Company who obtains access to our report or a copy and chooses to rely on our report (or any part of it) will do so at its own risk. To the fullest extent permitted by law, KPMG LLP will accept no responsibility or liability in respect of our audit work, this report, or the opinions we have formed, to any other party.
Respective responsibilities of Directors and auditorAs explained more fully in the Directors’ Responsibilities Statement set out on page 37, the Directors are responsible for the preparation of the non-statutory financial statements, which are intended by them to give a true and fair view. Our responsibility is to audit, and express an opinion on, the non-statutory financial statements in accordance with the terms of our engagement letter dated 10 March 2015 and International Standards on Auditing (UK and Ireland). Those standards require us to comply with the Auditing Practices Board’s Ethical Standards for Auditors.
Scope of the audit of the non-statutory financial statementsAn audit involves obtaining evidence about the amounts and disclosures in the non-statutory financial statements sufficient to give reasonable assurance that the non-statutory financial statements are free from material misstatement, whether caused by fraud or error. This includes an assessment of: whether the accounting policies are appropriate to the Company’s circumstances and have been consistently applied and adequately disclosed; the reasonableness of significant accounting estimates made by the Directors; and the overall presentation of the non-statutory financial statements.
In addition we read all the financial and non-financial information in the Annual Report and Non-statutory financial statements to identify material inconsistencies with the audited non-statutory financial statements and to identify any information that is apparently materially incorrect based on, or materially inconsistent with, the knowledge acquired by us in the course of performing the audit. If we become aware of any apparent material misstatements or inconsistencies we consider the implications for our report.
Opinion on non-statutory financial statementsIn our opinion the non-statutory financial statements:• give a true and fair view of the state of the Company’s affairs as at 31 December 2015 and of its profit for the year then
ended; and• have been properly prepared in accordance with IFRSs as adopted by the EU.
KPMG LLPChartered Accountants15 Canada Square, London, E14 5GL 14 March 2016
STRATEGIC REPORT | GOVERNANCE | FINANCIAL STATEMENTS
39ASCENTIAL HOLDINGS LIMITED – FINANCIAL STATEMENTS 2015
CONSOLIDATED PROFIT AND LOSS STATEMENT AND OTHER COMPREHENSIVE INCOMEFOR THE YEAR ENDED 31 DECEMBER 2015
(£ million) Note 2015 2014
Revenue 3 319.1 312.7Cost of sales 5 (112.0) (106.2)Sales, marketing and administrative expenses 5 (174.7) (183.9)
Operating profit 32.4 22.6
Adjusted earnings before interest, tax, exceptional items, share-based payments, depreciation and amortisation (Adjusted EBITDA) 4 90.9 85.3
Depreciation, amortisation and impairment 5 (47.0) (44.7)Exceptional items 5 (11.0) (18.0)Share-based payments 5 (0.5) –
Operating profit 32.4 22.6
Gain on disposals 8 4.8 –Finance costs 9 (37.3) (37.2)Finance income 9 8.5 9.2
Profit/(loss) before taxation 8.4 (5.4)Taxation 10 7.7 25.2
Retained profit for the year 16.1 19.8
Other comprehensive incomeItems that may be reclassified subsequently to profit or loss:Foreign exchange translation differences recognised in equity (2.7) 4.1
Total comprehensive income for the year 13.4 23.9
Attributable to:Equity holders of the parent 13.4 23.9
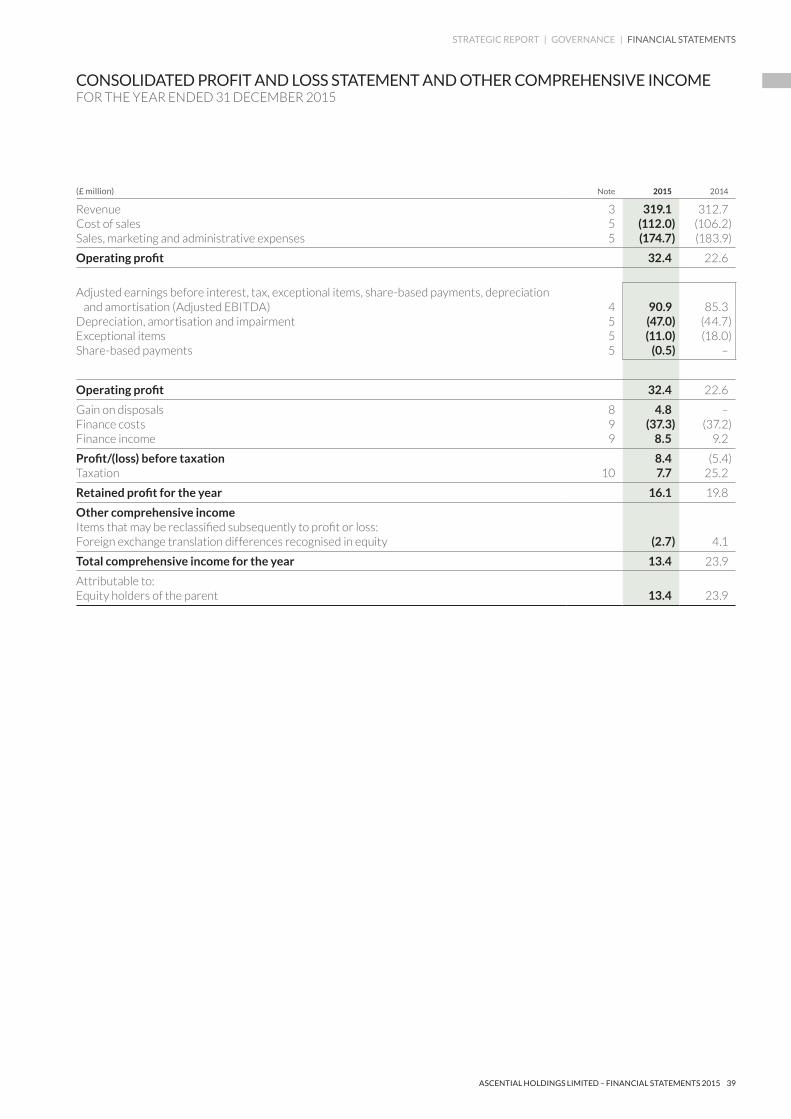

40 ASCENTIAL HOLDINGS LIMITED – FINANCIAL STATEMENTS 2015
CONSOLIDATED STATEMENT OF FINANCIAL POSITIONAS AT 31 DECEMBER 2015
(£ million) Note 2015 2014
AssetsNon-current assetsIntangible assets 11 658.7 683.3Property, plant and equipment 12 10.2 12.5Investments 13 0.7 0.6Derivative financial assets 20 0.6 –Deferred tax assets 25 40.2 35.7
710.4 732.1
Current assetsAssets classified as held for sale 16 – 9.9Inventories 14 17.6 14.6Trade and other receivables 15 65.3 51.9Derivative financial assets 20 0.4 –Cash and cash equivalents 18 43.0 19.8
126.3 96.2
LiabilitiesCurrent liabilitiesLiabilities associated with assets held for sale 16 – 3.6Trade and other payables 19 195.3 192.0Borrowings 21 2.4 15.1Provisions 24 2.3 3.1Derivative financial liabilities 20 0.4 2.8
200.4 216.6
Non-current liabilitiesBorrowings 21 423.2 410.2Provisions 24 0.2 0.2Deferred tax liabilities 25 40.7 49.9Derivative financial liabilities 20 1.7 –Other non-current liabilities 23 20.6 14.9
486.4 475.2
Net assets 149.9 136.5
Capital and reservesShare capital 26 543.7 543.7Translation reserve 27 (6.8) (4.1)Retained earnings 28 (387.0) (403.1)
Shareholders’ funds 149.9 136.5
The non-statutory financial statements were approved by the Board of Directors on 14 March 2016 and were signed on its behalf by:
Duncan Painter Mandy GraddenDirector Director
STRATEGIC REPORT | GOVERNANCE | FINANCIAL STATEMENTS
41ASCENTIAL HOLDINGS LIMITED – FINANCIAL STATEMENTS 2015
CONSOLIDATED STATEMENT OF CHANGES IN EQUITYFOR THE YEAR ENDED 31 DECEMBER 2015
(£ million) Share capitalTranslation
reserveRetained earnings Total
At 1 January 2014 543.7 (8.2) (422.9) 112.6Profit for the year – – 19.8 19.8Foreign exchange translation differences recognised in equity – 4.1 – 4.1
At 1 January 2015 543.7 (4.1) (403.1) 136.5Profit for the year – – 16.1 16.1Foreign exchange translation differences recognised in equity – (2.7) – (2.7)
At 31 December 2015 543.7 (6.8) (387.0) 149.9

42 ASCENTIAL HOLDINGS LIMITED – FINANCIAL STATEMENTS 2015
CONSOLIDATED STATEMENT OF CASH FLOWSFOR THE YEAR ENDED 31 DECEMBER 2015
(£ million) Note 2015 2014
Cash flow from operating activitiesProfit/(loss) before taxation 8.4 (5.4)Adjustments for:Amortisation of intangible assets acquired through business combinations 11 29.5 25.8Amortisation of software intangible fixed assets 11 12.9 13.4Impairment of software intangible fixed assets 11 – 0.4Depreciation of tangible fixed assets 12 4.6 4.7Impairment of tangible fixed assets 12 – 0.4Gain on disposals 8 (4.8) –Acquisition-related contingent employment costs 5 5.5 1.8Finance costs 9 37.3 37.2Finance income 9 (8.5) (9.2)
84.9 69.1Changes in: Inventories (3.0) 0.4Receivables (12.6) (3.4)Payables, net of interest payable 11.6 (0.9)Provisions (0.8) 0.8
Cash generated from operations 80.1 66.0
Cash generated from operations before exceptional operating items 92.0 80.8Cash flows from exceptional operating items (11.9) (14.8)
Cash generated from operations 80.1 66.0
Income tax paid (1.2) (1.2)
Net cash generated from operating activities 78.9 64.8
Cash flow from investing activities Acquisition of business, net of cash acquired 7 (19.6) (26.6)Acquisition of investments 13 (0.1) –Acquisition of software and property, plant and equipment 11,12 (10.9) (11.3)Disposal of business operations 8 10.6 1.3
Net cash used in investing activities (20.0) (36.6)
Cash flow from financing activitiesProceeds from borrowings 22 440.7 15.0Repayment of borrowings 22 (439.3) (26.2)Interest paid (37.9) (26.6)
Net cash used in financing activities (36.5) (37.8)
Net increase/(decrease) in cash and cash equivalents 22.4 (9.6)Cash and cash equivalents at the beginning of the year 18 19.8 29.6Effect of exchange rate fluctuations on cash and bank overdrafts 0.8 (0.2)
Cash and cash equivalents at the end of the year 18 43.0 19.8
STRATEGIC REPORT | GOVERNANCE | FINANCIAL STATEMENTS
43ASCENTIAL HOLDINGS LIMITED – FINANCIAL STATEMENTS 2015
NOTES TO THE NON-STATUTORY FINANCIAL STATEMENTSFOR THE YEAR ENDED 31 DECEMBER 2015
1. Principal accounting policiesBasis of preparationThe non-statutory financial statements have been prepared in accordance with International Financial Reporting Standards (“IFRS”) issued by the International Accounting Standards Board and International Financial Reporting Interpretations Committee’s interpretations as adopted by the European Union (“EU”) applicable at 31 December 2015 and in accordance with the accounting policies as stated within this Note 1 to the non-statutory financial statements.
Investors in Ascential plc and holders of Ascential plc’s shares may have limited or no recourse against the independent auditors of Ascential Holdings Limited.
Investors in Ascential plc and holders of Ascential plc’s shares should understand that, consistent with guidance issued by the ICAEW (the Institute of Chartered Accountants in England and Wales), the independent auditors’ report relating to financial information of Ascential Holdings Limited (“the Company”) included elsewhere in this publication states that:
The report has been prepared for the Company solely in response to a request from the Company for an opinion from independent auditors on the truth and fairness of the non-statutory financial statements; that the audit work has been undertaken so that the independent auditors might state to the Company those matters which the independent auditors have been engaged to state to the Company in the report and for no other purpose; that the report was designed to meet the agreed requirements of the Company determined by the Company’s needs at the time; that the report should not therefore be regarded as suitable to be used or relied on by any party wishing to acquire rights against the independent auditors other than the Company for any purpose or in any context; that any party other than the Company who obtains access to the report or a copy and chooses to rely on the report (or any part of it) will do so at its own risk; and that to the fullest extent permitted by law, the independent auditors will accept no responsibility or liability in respect of their audit work, the report, or the opinions they have formed, to any other party.
In the context of this publication, the independent auditors have reconfirmed to us that they do not intend their duty of care in respect of their audit to extend to any party, such as investors in Ascential plc and holders of Ascential plc’s shares, other than to the Company.
Basis of measurementThe consolidated non-statutory financial statements have been prepared on the historical cost basis with the exception of financial instruments which are stated in accordance with IAS 39 Financial Instruments: Recognition and Measurement. Accounting policies have been applied consistently to both years presented. Where applicable certain comparative amounts have been reclassified to conform to the current year’s presentation.
Going concern basis of accountingOn 8 February 2016 Ascential plc became the ultimate parent undertaking of the Group. Ascential plc was admitted to trade on the main market for the listing securities on the London Stock Exchange on 12 February 2016 and the associated Offer for Shares raised gross proceeds of £200 million. Further details are in Note 33.
Note 33 also details the new term loan facilities that were entered into on 12 February 2016 and made available to Ascential plc and certain of its subsidiaries. The Group’s forecasts, impact assessment of various downside scenarios, and senior debt and interest repayments falling due, show that the Group is expected to be able to operate within the level of its current facilities and meet its covenant requirements for a period of at least 12 months from the date of approval of these non-statutory financial statements.
After reviewing the above, taking into account current and future developments and principal risks and uncertainties, and making appropriate enquiries, the Directors have a reasonable expectation that the Group has adequate resources to continue in operational existence for the foreseeable future. Accordingly they are satisfied that the non-statutory financial information should be prepared on a going concern basis.
Functional and presentation currencyThe consolidated non-statutory financial statements are presented in pounds sterling, which is Ascential Holdings Limited’s functional currency. All non-statutory financial statements presented in pounds sterling has been rounded to the nearest hundred thousand, except where otherwise indicated.

44 ASCENTIAL HOLDINGS LIMITED – FINANCIAL STATEMENTS 2015
1. Principal accounting policies continuedCritical accounting assumptions and judgementsThe preparation of non-statutory financial statements under IFRS requires the use of certain critical accounting assumptions, and requires management to exercise its judgement and to make estimates in the process of applying the Group’s accounting policies. The areas requiring a higher degree of judgement, or areas where assumptions and estimates are significant to the consolidated non-statutory financial statements are discussed below.
(a) Use of estimatesThe preparation of non-statutory financial statements in conformity with IFRS requires the use of estimates and assumptions that affect the reported amounts of assets and liabilities at the date of the non-statutory financial statements and the reported amounts of revenues and expenses during the reporting period. Although these estimates are based on management’s best knowledge of the amount, events or actions, actual results ultimately may differ from those estimates, particularly for acquisition-related contingent consideration and acquisition-related contingent employment cost where the amounts payable are contingent on the future results of the acquired business.
(b) Business combinationsAccounting for a business on acquisition requires an assessment of the existence and fair value of separable intangible assets at the date of acquisition. These fair values are based on assumptions regarding the expected future cash flows attributable to the separable intangible assets at the point of acquisition. If subsequent actual and forecast performance indicates these cash flows are adverse to the estimates used, an impairment may be triggered at that point, or a reduction in useful economic life may be required.
(c) Intangible assetsThe Group uses forecast cash flow information and estimates of future growth to both value acquired intangible assets and goodwill and to assess whether goodwill and intangible assets are impaired, and to determine the useful economic lives of its intangible assets. If the results of operations in a future period are adverse to the estimates used for impairment testing, an impairment may be triggered at that point, or a reduction in useful economic life may be required.
(d) Income taxesIn recognising income tax assets and liabilities estimates have to be made of the likely outcome of decisions by tax authorities on transactions and events whose treatment for tax purposes is uncertain. In recognising deferred tax assets in respect of unused tax losses, judgement is required to establish the expected availability of losses and the likely timing and level of future taxable profits.
Principal accounting policiesThe following summarises the principal accounting policies adopted by the Directors, which have been adopted consistently:
(a) Basis of consolidationThe Group non-statutory financial statements consolidate the accounts of Ascential Holdings Limited and its subsidiary undertakings for the year ended 31 December 2015. A subsidiary is an entity (including special purpose entities) over which the Group has the power to direct the relevant activities, exposure to variable returns from its involvement with the investee and there is a link between power and returns. The results of each subsidiary are included from the date that control transferred to the Group and are Adjusted to align accounting policies with the Group’s accounting policies. Subsidiaries are no longer consolidated from the date that control ceases. All intercompany balances and transactions are eliminated in full.
(b) Foreign currency translationThe functional currency of subsidiaries, associates and joint ventures is the currency of the primary economic environment in which they operate. Transactions in foreign currencies are initially recorded at the functional currency rate applicable at the date of the transaction. Monetary assets and liabilities denominated in foreign currencies are retranslated at the functional currency rate of exchange in force at the reporting date.
All differences are taken to the consolidated profit and loss statement except for those on foreign currency borrowings that provide a hedge against an investment in a foreign entity. These are taken directly to equity until the disposal of the investment, at which time they are recognised in the consolidated profit and loss statement. Tax charges and credits attributable to exchange differences on those borrowings are also dealt with in equity. Non-monetary items that are measured at historical cost in a foreign currency are translated using the exchange rate in force at the date of the initial transaction.
NOTES TO THE NON-STATUTORY FINANCIAL STATEMENTS CONTINUEDFOR THE YEAR ENDED 31 DECEMBER 2015
STRATEGIC REPORT | GOVERNANCE | FINANCIAL STATEMENTS
45ASCENTIAL HOLDINGS LIMITED – FINANCIAL STATEMENTS 2015
1. Principal accounting policies continuedAs at the reporting date, the assets and liabilities of overseas subsidiaries are translated into pounds sterling at the rate of exchange applicable at the reporting date and their consolidated profit and loss statements are translated at the average exchange rates for the period. The exchange differences arising from the retranslation of foreign operations are taken directly to a separate component of equity. On disposal of a foreign operation, the cumulative amount recognised in equity relating to that operation is recognised in the consolidated profit and loss statement as part of the gain or loss on sale. Goodwill and fair value adjustments arising on the acquisition of a foreign entity are treated as assets and liabilities of the foreign entity and translated at the closing rate.
(c) Investments in associates and joint venturesAn associate is an entity over which the Group is in a position to exercise significant influence but not control, generally accompanying a shareholding of between 20% to 50% of the voting rights. A joint venture is an entity over which the Group exercises joint control, usually through a contractual arrangement. The Group’s investments in associates and joint ventures are recognised using the equity method of accounting.
Investments in associates and joint ventures are initially recognised at cost and thereafter are carried in the consolidated statement of financial position at cost less any impairment in value. The consolidated profit and loss statement reflects the Group’s share of an associate or joint venture’s profit after tax. Where the Group’s share of losses in an associate or joint venture exceeds its investment, the Group ceases to recognise further losses unless an obligation exists for the Group to fund the losses. Where a change in net assets has been recognised directly in the associate or joint venture’s equity, the Group recognises its share of those changes in the statement of changes in equity when applicable.
Adjustments are made to align the accounting policies of the associate or joint venture with the Group’s and to eliminate the Group’s share of unrealised gains and losses on transactions between the Group and its associates and joint ventures.
(d) InvestmentsInvestments are held at cost less provision for impairment. Initial recognition of investments is at the fair value of the assets given, equity instruments issued and liabilities incurred or assumed.
(e) Business combinations and intangible assetsAcquisitions are accounted for using the purchase method of accounting. The cost of an acquisition is the cash paid together with the fair value of other assets given, equity instruments issued and liabilities incurred or assumed.
Any contingent consideration is recognised at fair value at the acquisition date. Subsequent changes to the fair value of the contingent consideration, which is deemed to be an asset or liability, is recognised either in the profit and loss account or in other comprehensive income, in accordance with IAS 39. Any amounts payable by the Group directly contingent on the continuing employment of the vendors are treated as remuneration and recognised as an expense in the profit and loss account. Deferred and contingent consideration amounts payable after more than 12 months have been discounted to present value.
Costs directly attributable to acquisitions are expensed as exceptional items. The acquired identifiable assets, liabilities and contingent liabilities are measured at their fair values at the date of acquisition, irrespective of the extent of any non-controlling interest. The excess of the cost of acquisition over the fair value of net assets assumed is recorded as goodwill.
Goodwill is measured at cost less any accumulated impairment losses. Goodwill is reviewed for impairment either annually or more frequently if events or changes in circumstances indicate a possible decline in the carrying value. Impairment is determined by comparing the recoverable amount of the cash-generating unit or group of cash-generating units (“CGU”) which are expected to benefit from the acquisition in which the goodwill arose, to the carrying value of the CGU. The recoverable amount is the greater of an asset’s value-in-use and its fair value less costs to sell. Value-in-use is calculated by discounting the future cash flows expected to be derived from the asset or group of assets in a cash-generating unit at the Group’s cost of capital, adjusted for risk in a specific market if relevant. The discount and growth rates used in the value-in-use calculations are disclosed in Note 11 of the non-statutory financial statements. Where the recoverable amount is less than the carrying value, the goodwill is considered impaired and is written down through the consolidated profit and loss statement to its recoverable amount. The carrying amount of goodwill allocated to a cash-generating unit is taken into account when determining the gain or loss on the disposal of the unit or operation within it.

46 ASCENTIAL HOLDINGS LIMITED – FINANCIAL STATEMENTS 2015
1. Principal accounting policies continuedIntangible assets acquired as part of a business combination are capitalised at fair value at the date of acquisition. Intangible assets purchased separately are capitalised at cost. After initial recognition, all intangible fixed assets are measured at cost less accumulated amortisation and any accumulated impairment losses. Intangible fixed assets which have been assigned a finite life are amortised and tested for impairment if events or changes in circumstances indicate that the carrying value may have declined. This is done on a similar basis to the testing of goodwill, either for individual assets or at the level of a cash-generating unit. Useful lives are examined every year and adjustments are made, where applicable, on a prospective basis. Amortisation is charged on assets with finite lives on a systematic basis over the asset’s useful life, which in all cases is a maximum period of 30 years.
Where an intangible asset has been assigned an indefinite useful life, it is not amortised and is reviewed for impairment either annually or more frequently if events or changes in circumstances indicate a possible decline in the carrying value.
Purchases of software or direct costs relating to internal development of software are capitalised and amortised over their anticipated useful lives. Capitalisation of these costs ceases no later than the point at which the software is substantially complete and ready for its intended use. The useful life of software ranges from three to seven years.
Website development costs relating to websites which are revenue generating are capitalised and amortised over three to five years. Development costs relating to websites which are not revenue generating are taken immediately to the consolidated profit and loss statement.
(f) Property, plant and equipmentProperty, plant and equipment are stated at cost less accumulated depreciation and any impairment in value. Depreciation is calculated in such a way as to write off the cost of an asset, less its residual value, on a straight-line basis over its estimated useful life as follows:
• short leasehold property – over the period of the lease; and• office equipment – two to five years.
Estimated useful lives and residual values are reviewed at each reporting date. The carrying values of property, plant and equipment are reviewed for impairment when events or changes in circumstances indicate these values may not be recoverable. If there is an indication that impairment does exist the carrying values are compared to the estimated recoverable amounts of the assets concerned. The recoverable amount is the greater of an asset’s value-in-use and its fair value less the cost of selling it. Value-in-use is calculated by discounting the future cash flows expected to be derived from the asset. Where the carrying value of an asset exceeds its recoverable amount, the asset is considered impaired and is written down to its recoverable amount. Impairment losses are recognised in the consolidated profit and loss statement.
An item of property, plant or equipment is written off either on disposal or when there is no expected future economic benefit from its continued use. Any gain or loss on de-recognition of the asset (calculated as the difference between the net disposal proceeds and the carrying value of the asset) is included in the consolidated profit and loss statement in the year the item is derecognised.
(g) InventoriesInventories are stated at the lower of cost and net realisable value. Cost represents purchase cost, including attributable overheads, and is determined using a first-in, first-out basis. Net realisable value is the estimated selling price in the ordinary course of business, less estimated costs of completion and costs necessary to make the sale.
Costs relating to future exhibitions, festivals and congresses are deferred within inventories at the lower of cost or net realisable value. These costs are charged to the consolidated profit and loss statement when the exhibition takes place.
(h) Trade and other receivablesTrade receivables are recognised initially at fair value and subsequently measured at amortised cost, less provision for impairment. Specific provisions are made and charged to the consolidated profit and loss statement when there is objective evidence that the Group will not be able to collect all amounts due according to the original terms. Collective provisions are made based on estimated losses inherent within receivables, based on the overall level of receivables past due. These provisions are developed over time based on the review of aged debt, the type of debt and experience.
NOTES TO THE NON-STATUTORY FINANCIAL STATEMENTS CONTINUEDFOR THE YEAR ENDED 31 DECEMBER 2015
STRATEGIC REPORT | GOVERNANCE | FINANCIAL STATEMENTS
47ASCENTIAL HOLDINGS LIMITED – FINANCIAL STATEMENTS 2015
1. Principal accounting policies continuedThe carrying amount of the asset is reduced through the use of an allowance account and the amount of the loss is recognised in the consolidated profit and loss statement. When a trade receivable is uncollectible, it is written off against the allowance account for trade receivables. Subsequent recoveries of amounts previously written off are credited to the consolidated profit and loss statement.
(i) Cash and cash equivalentsCash and cash equivalents includes cash, short-term deposits and other short-term highly liquid investments with an original maturity of three months or less. For the purpose of the consolidated cash flow statement, cash and cash equivalents are as defined, net of outstanding bank overdrafts.
(j) Assets held for saleWhere the Group expects to recover the carrying amount of a group of assets through a sale transaction rather than through continuing use, and a sale is considered to be highly probable at the reporting date, the assets are classified as held for sale and measured at the lower of cost and fair value less costs to sell. No depreciation or amortisation is charged in respect of non-current assets classified as held for sale.
(k) Borrowings Borrowings are recognised initially at fair value, net of transaction costs incurred. Borrowings are subsequently stated at amortised cost; any difference between the proceeds (net of transaction costs) and the redemption value is recognised in the consolidated profit and loss statement over the period of the borrowings using the effective interest method, with the exception of debt repurchases which are recognised in the consolidated profit and loss statement in the year of the repurchase.
(l) Derivatives and other financial instruments Derivatives, including currency options and swaps, forward exchange contracts, and interest rate swaps and caps, are initially recognised and subsequently measured at fair value at each reporting date. Derivatives that do not qualify for hedge accounting are classified as a separate asset or liability. The fair value is determined by using market data and the use of established estimation techniques such as discounted cash flow and option valuation models. The method of recognising the resulting gain or loss depends on whether the derivative is designated as a hedging instrument and, if so, the nature of the item being hedged as described below. Changes in the fair value of derivative financial instruments that do not qualify for hedge accounting are recognised in the consolidated profit and loss statement as they arise.
A derivative is presented as a non-current asset or a non-current liability if the remaining maturity of the instrument is more than 12 months and it is not expected to be realised or settled within 12 months. Other derivatives are presented as current assets or current liabilities. Further details of derivative financial instruments are disclosed in Note 20.
(m) Hedging Activities The Group’s operations and funding give rise to foreign exchange risk and interest rate risk. The Group may structure its borrowings or utilise derivative financial instruments to manage the economic impact of these risks. The Group does not use derivative contracts for speculative purposes.
The Group may also formally designate certain derivatives or borrowings as hedging instruments and will at the point of inception document the relationship between the hedge instrument and hedged item, together with the risk management objective and strategy for undertaking the hedging transaction. In addition, at inception and on an ongoing basis, the Group documents whether the hedging instrument is highly effective in offsetting changes in fair values or cash flows of the hedged item.
Hedge instruments are accounted for as either: • hedges of a change of fair value of recognised assets and liabilities or firm commitments (fair value hedges); • hedges of a particular risk associated with a recognised asset or liability or a highly probable forecast transaction
(cash flow hedge); or• hedges of a net investment in a foreign operation (net investment hedge).
(i) Fair value hedgesChanges in the fair value of fair value hedge instruments are recorded in profit or loss immediately, together with any changes in the fair value of the hedged asset or liability that is attributable to the hedged risk, with these changes in fair value being recognised in the line of the consolidated profit and loss statement relating to the hedged item.

48 ASCENTIAL HOLDINGS LIMITED – FINANCIAL STATEMENTS 2015
1. Principal accounting policies continued(ii) Cash flow hedge The effective portion of changes in the fair value of cash flow hedges is recognised in other comprehensive income. The gains or losses relating to the ineffective portion are recognised immediately in the consolidated profit and loss statement. The cumulative amount recognised in other comprehensive income is reclassified to profit or loss in the periods when the hedged item is recognised in profit or loss in the same line of the consolidated profit and loss statement as the recognised hedged item. However, when the forecast transaction that is hedged results in the recognition of a non-financial asset or a non-financial liability, the cumulative amount recognised in other comprehensive income is transferred from equity and included in the initial measurement of the cost of the non-financial asset or non-financial liability.
(iii) Hedges of net investment in foreign operations The effective portion of changes in the fair value of hedges of net investment in foreign operations is recognised in other comprehensive income and accumulated in the foreign currency translation reserve. The gains or losses relating to the ineffective portion are recognised immediately in the consolidated profit and loss statement. Gains and losses on the hedging instrument accumulated in the foreign currency translation reserve are reclassified to profit or loss when the hedged item is disposed of.
Hedge accounting is discontinued when the hedge instrument expires or is sold, terminated, or exercised, or no longer qualifies for hedge accounting. At that time, any cumulative gains or losses on the hedging instrument recognised in equity are retained in equity until the forecast transaction occurs. If a hedged transaction is no longer expected to occur, the net cumulative gain or loss recognised in equity is transferred to the consolidated profit and loss statement in the period.
(n) ProvisionsProvisions are recognised when the Group has a present legal or constructive obligation as a result of a past event, when it is probable that an outflow of resources will be required to settle the obligation, and when a reliable estimate can be made of the amount of the obligation. Where the Group expects some or all of a provision to be reimbursed, the reimbursement is recognised only when it is virtually certain. The expense relating to any provision is presented in the consolidated profit and loss statement net of any reimbursement. If the time value of money has a material effect on quantifying the provision, the provision is determined by discounting the expected future cash flows at a pre-tax rate that reflects current market assessments of the time value of money and, where appropriate, the risks specific to the liability. Where discounting is used, the increase in the provision due to the passage of time is recognised as a finance charge.
A provision for restructuring is recognised when the Group has approved a detailed and formal restructuring plan, and the restructuring either has commenced or has been announced publicly. Future operating losses are not provided for.
(o) LeasesAssets held by the Group under leases which transfer to the Group substantially all of the risks and rewards of the ownership are classified as finance leases. On initial recognition, the leased asset is measured at an amount equal to the lower of its fair value and the present value of the minimum lease payments. Subsequent to initial recognition, the asset is accounted for in accordance with the accounting policy applicable to that asset.
Assets held under other leases are classified as operating leases and are not recognised in the Group’s consolidated statement of financial position. Operating lease payments are recognised as an expense in the consolidated profit and loss statement on a straight-line basis over the lease term. The benefit of any lease incentives is recognised as a reduction in rental expense on a straight-line basis over the life of the lease.
(p) RevenueRevenue for goods sold is recognised when the significant risks and rewards of ownership have been transferred to a third party. Revenue for services provided is recognised at the point when it is probable that the economic benefits will flow to the Group and when the amount of revenue can be reliably measured.
Revenue is measured at the fair value of the consideration received, net of discounts, customs duties and sales taxes. Revenue is only recognised for barter transactions which are considered dissimilar to each other in nature, and a corresponding amount is included in operating costs.
NOTES TO THE NON-STATUTORY FINANCIAL STATEMENTS CONTINUEDFOR THE YEAR ENDED 31 DECEMBER 2015
STRATEGIC REPORT | GOVERNANCE | FINANCIAL STATEMENTS
49ASCENTIAL HOLDINGS LIMITED – FINANCIAL STATEMENTS 2015
1. Principal accounting policies continuedThe following recognition criteria also apply in specific cases:
Exhibition, festival, congress and conference and awards show income is recognised when the event takes place. Data and online subscription revenues are recognised in the consolidated profit and loss statement evenly over the life of the subscription. Magazine subscriptions and advertising revenues are recognised according to the dispatch date of the publication. A provision is deducted from circulation revenue for expected returns, and is adjusted for actual returns when this is known. Pre-paid subscription and event revenues are shown as deferred income and released to the consolidated profit and loss statement in accordance with the revenue recognition criteria above.
(q) Employee benefits(i) Short-term employee benefitsShort-term employee benefit obligations are measured on an undiscounted basis and are expensed as the related service is provided. A liability is recognised for the amount expected to be paid under cash bonus schemes if the Group has a present legal or constructive obligation to pay this amount as a result of past service provided by the employee, and the obligation can be estimated reliably.
(ii) Termination benefitsTermination benefits are recognised as an expense when the Group is demonstrably committed, without realistic possibility of withdrawal, to a formal detailed plan to either terminate employment before the normal retirement date, or to provide termination benefits as a result of an offer made to encourage voluntary redundancy. Termination benefits for voluntary redundancies are recognised as an expense if the Group has made an offer of voluntary redundancy, it is probable that the offer will be accepted, and the number of acceptances can be estimated reliably. If benefits are payable more than 12 months after the reporting date, then they are discounted to their present value.
(iii) Share-based paymentsEquity-settled awards are valued at the grant date, and the difference between the grant date fair value and the consideration paid by the employee is charged as an expense in the consolidated profit and loss statement spread over the vesting period. The credit side of the entry is recorded in equity. Cash-settled awards are revalued at each reporting date with the fair value of the award charged to the profit and loss account over the vesting period and the credit side of the entry recognised as a liability.
(r) Pension and other post-employment benefitsThe Group operates defined contribution pension scheme in certain countries. Contributions payable are charged to the consolidated profit and loss statement and included in staff costs as an operating expense as incurred.
(s) Adjusted EBITDA and exceptional itemsThe consolidated non-statutory financial statements include Adjusted EBITDA as a measure of profitability in order to provide a better understanding of the trading performance of the Group. Adjusted EBITDA is a non-IFRS measure, defined as the Group’s operating profit before expensing depreciation of tangible fixed assets and amortisation of software, exceptional items, amortisation of acquired intangible assets, impairment of tangible fixed assets and software intangibles and share-based payments.
The Group defines exceptional items as costs incurred by the Group in acquisitions & disposals, integration, non-recurring business restructuring and capital restructuring. These are disclosed separately to provide additional useful information to the users of the non-statutory financial statements.
(t) Finance costs and incomeFinance costs are recognised on an effective yield basis. Finance income is recognised on the accruals basis.
(u) Income taxThe Group is primarily subject to corporation tax in the UK, the US, Brazil and China, and judgement and estimates of future profitability are required to determine the Group’s deferred tax position. If the final tax outcome is different to that assumed, resulting changes will be reflected in the consolidated profit and loss statement, unless the tax relates to an item charged to equity, in which case the changes in tax estimates on those items will be reflected in equity.
Income tax on the profit or loss for the period comprises current tax and deferred tax. Income tax is recognised in the consolidated profit and loss statement, except to the extent that it relates to items recognised directly in equity, in which case it is recognised in equity.

50 ASCENTIAL HOLDINGS LIMITED – FINANCIAL STATEMENTS 2015
1. Principal accounting policies continuedCurrent tax is tax payable based on taxable profits for the period, using tax rates that have been enacted or substantively enacted at the reporting date along with any adjustment relating to tax payable in previous years. Taxable profit differs from net profit in the consolidated profit and loss statement in that income or expense items that are taxable or deductible in other years are excluded, as are items that are never taxable or deductible. Current tax assets relate to payments on account not yet allocated against current tax liabilities or to refunds due from tax authorities on overpayments in respect of prior years.
Using the liability method, deferred tax is provided on temporary differences at the reporting date between the tax bases of assets and liabilities and their carrying amounts for financial reporting purposes, except for the following temporary differences:• goodwill that is not deductible for tax purposes; and• the initial recognition of assets or liabilities in a transaction that is not a business combination and which will affect neither
accounting nor taxable profit.
Deferred tax assets are recognised to the extent that it is probable that sufficient future taxable profits will be available to allow all or part of the deferred tax asset to be utilised. The carrying amount of deferred tax assets is reviewed at each reporting date.
Deferred tax assets and liabilities are measured at the tax rates that are expected to apply to the year in which the asset is realised or the liability is settled, based on tax rates that have been enacted or substantively enacted at the reporting date. The deferred tax assets and liabilities are only offset where they relate to the same taxing authority and the Group has a legal right to offset.
Standards issued but not yet effectiveThe standards and interpretations that are issued, but not yet effective, up to the date of issuance of the Group’s consolidated non-statutory financial statements are disclosed below. The Group intends to adopt these standards, if applicable, when they become effective. An initial assessment of the impact of IFRS 15 indicates the impact of adopting this standard will have limited effect. The Group has commenced an assessment of the impact of IFRS16 which was issued on 13 January 2016. None of the other standards are expected to materially impact the consolidated non-statutory financial statements upon adoption.
• IFRS 9 Financial Instruments (Amendment)• IFRS 11 Joint Arrangements (Amendment)• IAS 12 Recognition of Deferred Tax Assets for Unrealised losses (Amendment)• IFRS 15 Revenue from Contracts with Customers• IFRS 16 Leases• IAS 16 Property Plant and Equipment (Amendment)• IAS 27 Separate Financial Statements (Amendment)• IAS 38 Intangible Assets (Amendment)
2. Financial risk managementThis note presents information about the Group’s objectives, policies and processes for measuring and managing risk, the Group’s exposure to the risks arising from financial instruments, and the Group’s management of capital.
Market risk(i) Foreign exchange riskThe Group operates internationally and is exposed to foreign exchange risk arising from various currency exposures, primarily with respect to the US dollar and the euro. Foreign exchange risk arises from future commercial transactions, recognised assets and liabilities and net investments in foreign operations.
Foreign currency movements impact on the Group’s profit and loss account together with its cash flow profile and leverage ratio position. The impact depends on whether there is a surplus or deficit in each currency from operating activities together with the interest and finance charge in those currencies. The Group’s policy has been to protect its cash flow and leverage ratio position by maintaining a proportion of currency debt in proportion to its currency earnings to obtain natural offsets.
The Group’s net investment hedge in overseas subsidiaries may be hedged where the currency exposure is considered to be material. In 2015 the Group designated its US dollar borrowings as a net investment hedge against its US dollar denominated assets.
NOTES TO THE NON-STATUTORY FINANCIAL STATEMENTS CONTINUEDFOR THE YEAR ENDED 31 DECEMBER 2015
STRATEGIC REPORT | GOVERNANCE | FINANCIAL STATEMENTS
51ASCENTIAL HOLDINGS LIMITED – FINANCIAL STATEMENTS 2015
2. Financial risk management continued(ii) Cash flow and interest rate riskInterest rate risk arises from medium and long-term borrowings to the extent that the underlying debt instruments are not at fixed rates of interest. The Group has entered into interest rate caps to protect a portion of its bank borrowings from fully floating to capped rates to mitigate this risk.
Credit riskCredit risk is managed on a Group basis. Credit risk arises from cash and cash equivalents, derivative financial instruments and deposits with banks and financial institutions, as well as credit exposures to customers, including outstanding receivables and committed transactions. The maximum exposure to credit risk at the reporting date is the fair value of the financial assets in the consolidated statement of financial position as disclosed in Note 20 (a).
(i) Treasury-related credit riskCounterparty risk arises from the investment of surplus funds and from the use of derivative instruments. The level of risk is evaluated by reference to corporate credit ratings as ascertained by Standard & Poor’s and Moody’s. The Group’s policy is to limit the exposure to organisations that have a credit rating of at least BBB+/Baa1, with different limits depending on credit quality. As at the dates provided below the following limits were in place for investments held with banks and financial institutions:
2015 2014
(£ million)Counterparty Credit limit Utilised Credit limit Utilised
Institutions rated AA/Aa2 or better 40.0 9.3 40.0 –Institutions rated A/A2 or better but less than AA 50.0 7.1 50.0 6.6Institutions rated BB+/Baa1 or better but less than A 30.0 26.6 40.0 13.2
Total 120.0 43.0 130.0 19.8
In accordance with the Group’s treasury policies and exposure management practices, counterparty credit exposure limits are continually monitored and no individual exposure is considered significant in the ordinary course of treasury management activity. Management does not expect any significant losses from non-performance by these counterparties.
(ii) Trading riskRisk arises principally from payment default by customers. The general policy of the Group is not to risk assess all new customers and so retail credit risk information has not been included in these consolidated non-statutory financial statements. Management does not, however, expect any significant losses in respect of receivables that have not been provided for as shown in Note 15.
Liquidity riskLiquidity risk is the risk that the Group will not be able to meet its financial obligations as they fall due. The Group’s approach to managing liquidity is to ensure, as far as possible, that it will always have sufficient liquidity in the form of sufficient cash or funding from adequate credit facilities to meet such liabilities under both normal and stressed conditions.
The Group’s major banking facilities as at 31 December 2015 are detailed below:
Facility Drawn
Final maturityLC’m £’m LC’m £’m Interest Margin
Facility B1 €298.5 219.3 €298.5 219.3 April 2022 EURIBOR, 1% floor 5.00%Facility B2 $321.4 216.9 $321.4 216.9 April 2022 LIBOR, 1% floor 5.00%Revolving Credit Facility £75.0 75.0 – – April 2021 4.50%
Total facilities 511.2 436.2
As part of its previous financing arrangements, the Group was required to adhere to minimum maintenance covenants. The Group operated within these covenant limits during this period. Following the subsequent refinancing in April 2015, the Group had to adhere to a springing leverage covenant which applies to its Revolving Credit Facilities.
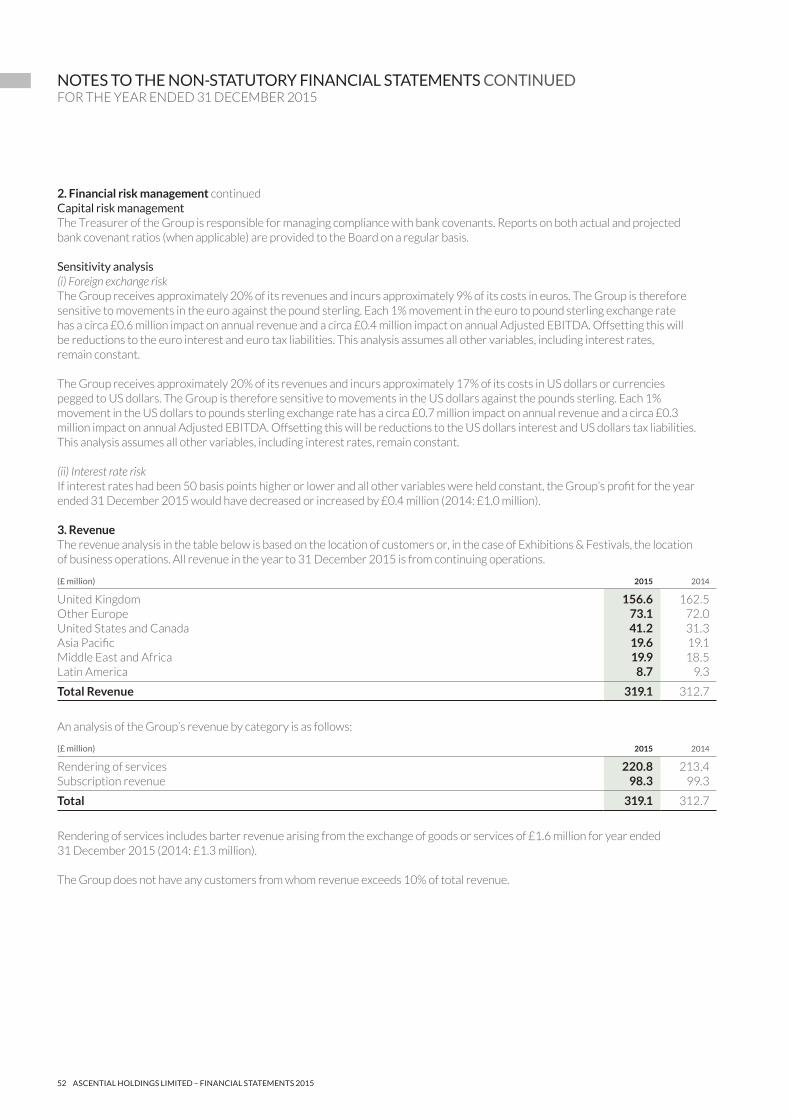
52 ASCENTIAL HOLDINGS LIMITED – FINANCIAL STATEMENTS 2015
2. Financial risk management continuedCapital risk managementThe Treasurer of the Group is responsible for managing compliance with bank covenants. Reports on both actual and projected bank covenant ratios (when applicable) are provided to the Board on a regular basis.
Sensitivity analysis(i) Foreign exchange riskThe Group receives approximately 20% of its revenues and incurs approximately 9% of its costs in euros. The Group is therefore sensitive to movements in the euro against the pound sterling. Each 1% movement in the euro to pound sterling exchange rate has a circa £0.6 million impact on annual revenue and a circa £0.4 million impact on annual Adjusted EBITDA. Offsetting this will be reductions to the euro interest and euro tax liabilities. This analysis assumes all other variables, including interest rates, remain constant.
The Group receives approximately 20% of its revenues and incurs approximately 17% of its costs in US dollars or currencies pegged to US dollars. The Group is therefore sensitive to movements in the US dollars against the pounds sterling. Each 1% movement in the US dollars to pounds sterling exchange rate has a circa £0.7 million impact on annual revenue and a circa £0.3 million impact on annual Adjusted EBITDA. Offsetting this will be reductions to the US dollars interest and US dollars tax liabilities. This analysis assumes all other variables, including interest rates, remain constant.
(ii) Interest rate riskIf interest rates had been 50 basis points higher or lower and all other variables were held constant, the Group’s profit for the year ended 31 December 2015 would have decreased or increased by £0.4 million (2014: £1.0 million).
3. RevenueThe revenue analysis in the table below is based on the location of customers or, in the case of Exhibitions & Festivals, the location of business operations. All revenue in the year to 31 December 2015 is from continuing operations.
(£ million) 2015 2014
United Kingdom 156.6 162.5Other Europe 73.1 72.0United States and Canada 41.2 31.3Asia Pacific 19.6 19.1Middle East and Africa 19.9 18.5Latin America 8.7 9.3
Total Revenue 319.1 312.7
An analysis of the Group’s revenue by category is as follows:
(£ million) 2015 2014
Rendering of services 220.8 213.4Subscription revenue 98.3 99.3
Total 319.1 312.7
Rendering of services includes barter revenue arising from the exchange of goods or services of £1.6 million for year ended 31 December 2015 (2014: £1.3 million).
The Group does not have any customers from whom revenue exceeds 10% of total revenue.
NOTES TO THE NON-STATUTORY FINANCIAL STATEMENTS CONTINUEDFOR THE YEAR ENDED 31 DECEMBER 2015
STRATEGIC REPORT | GOVERNANCE | FINANCIAL STATEMENTS
53ASCENTIAL HOLDINGS LIMITED – FINANCIAL STATEMENTS 2015
4. Operating segmentsThe Group has voluntarily complied with IFRS 8 Operating Segments. The Group has two reportable segments. In addition, there is a Group corporate function providing finance, management and IT services to the Group’s reportable segments. The reportable segments offer different products and services, and are managed separately because they require different capabilities, technology and marketing strategies. For each of the reportable segments, the Board (the chief operating decision maker) reviews internal management reports on a monthly basis. The following summary describes the operations in each of the Group’s reportable segments:
• Exhibitions & Festivals: organiser of market-leading tradeshows, congresses and festivals.• Information Services: produces intelligence, analysis and forecasting tools, subscription content including real-time online
resources, live events and awards, across a number of industry sectors including fashion, retail, property, construction and politics.
Information regarding the results of each reportable segment is included below. Reportable segment profits are measured at an Adjusted operating profit level, representing reportable segment Adjusted EBITDA, as defined in Note 1 (s), less depreciation costs and amortisation in respect of software intangibles, without allocation of central Group costs. This is the measure included in the internal management reports that are reviewed by the Board. Reportable segment Adjusted EBITDA and reportable segment Adjusted operating profit are used to measure performance as management believes that such information is the most relevant in evaluating the results of certain reportable segments relative to other comparable entities.
(£ million)Year ended 31 December 2015
Exhibitions & Festivals
Information Services Group Total
Revenue 150.4 168.7 – 319.1Adjusted EBITDA 56.9 42.8 (8.8) 90.9Depreciation and amortisation of tangible fixed assets and software intangibles (2.2) (7.1) (8.2) (17.5)
Adjusted operating profit/ (loss) 54.7 35.7 (17.0) 73.4
Amortisation and impairment of intangible assets acquired through business combinations (29.5)
Exceptional items (11.0)Share-based payments (0.5)
Operating profit 32.4Gain on disposals 4.8Net finance costs (28.8)
Profit before tax 8.4
Total assets 836.7
(£ million)Year ended 31 December 2014
Exhibitions & Festivals
Information Services Group Total
Revenue 138.8 173.9 – 312.7Adjusted EBITDA 55.3 38.9 (8.9) 85.3Depreciation and amortisation of tangible fixed assets and software intangibles (1.9) (6.8) (9.4) (18.1)
Adjusted operating profit/ (loss) 53.4 32.1 (18.3) 67.2
Amortisation and impairment of intangible assets acquired through business combinations (25.8)
Impairment of tangible fixed assets and software intangibles (0.8)Exceptional items (18.0)
Operating profit 22.6Net finance costs (28.0)
Loss before tax (5.4)
Total assets 828.3
Exceptional items of £11.0 million include £5.7 million and £3.3 million which are attributable to Exhibitions & Festivals and Information Services respectively (2014: £18.0 million, £9.8 million, £2.9 million).

54 ASCENTIAL HOLDINGS LIMITED – FINANCIAL STATEMENTS 2015
4. Operating segments continuedFinance costs and finance income are not allocated to segments, as these types of activity are driven by the Group corporate function. An analysis of the Group’s non-current assets (excluding deferred tax and financial instruments) by geographical location is as follows:
(£ million) 2015 2014
United Kingdom 418.6 450.9United States and Canada 118.1 108.3Rest of the world 132.9 137.2
Total 669.6 696.4
5. Operating costs by nature
(£ million) 2015 2014
Staff costs 104.8 106.1Operating lease rentals 6.9 6.8Other expenses 116.5 114.5
Operating costs before depreciation, amortisation, impairment, exceptional items and share-based payments 228.2 227.4
Depreciation and software amortisation 17.5 18.1Impairment of tangible fixed assets and software intangibles – 0.8Amortisation of intangible assets acquired through business combinations 29.5 25.8
Depreciation, amortisation and impairment 47.0 44.7Share-based payments 0.5 –Exceptional items: Acquisition-related contingent employment costs 5.5 1.8 Expenses related to acquisition and disposal activities 0.9 2.8 Acquisition integration costs 0.9 7.3 IPO expenditure 1.7 – Business restructuring 1.7 0.3 Professional fees relating to capital restructuring 0.3 3.6 Financing and restructuring – 1.2 Other exceptional items – 1.0
Exceptional items 11.0 18.0
Total 286.7 290.1
Exceptional items are not a defined term under IFRS, so may not be comparable to similar terminology used in other financial statements. The Board believes that reporting results in this way provides additional useful information to the users of the non-statutory financial statements.
The acquisition-related contingent employment costs relate to the acquisition of Money20/20 in 2014. Under the sale and purchase agreement an element of the deferred consideration is contingent on both (i) the results of the business in 2015-17 and (ii) the continued employment of certain of the vendors. In accordance with IFRS, this element of the deferred consideration is treated as an expense and expensed over the service lives of those vendors. In 2015 this expense amounted to £5.5 million for the full 12 months (2014: £1.8 million for a four-month period).
Exceptional costs relating to the IPO of £1.7 million were expensed in 2015, with the remainder of the IPO-related cost expected to be expensed in 2016 either as a further exceptional item or as an offset against the share premium reserve.
NOTES TO THE NON-STATUTORY FINANCIAL STATEMENTS CONTINUEDFOR THE YEAR ENDED 31 DECEMBER 2015
STRATEGIC REPORT | GOVERNANCE | FINANCIAL STATEMENTS
55ASCENTIAL HOLDINGS LIMITED – FINANCIAL STATEMENTS 2015
5. Operating costs by nature continuedExceptional costs of £1.7 million were also incurred in 2015 as a result of the creation of the Plexus operating company from the combination of EMAP, MEED, 4C Group and Planet Retail. The Group incurred exceptional costs related to acquisition and disposal activity of £0.9 million (2014: £2.8 million) in 2015, with a further charge of £0.9 million (2014: £7.3 million) related to post-acquisition integration costs. These principally relate to the acquisition of RetailNet Group (“RNG”).
Fees paid to the auditor were as follows:
(£ million) 2015 2014
Fees paid to auditor for audit of the consolidated non-statutory financial statements 0.3 0.3Fees paid to auditor for audit of the Group’s subsidiaries 0.1 0.1Fees paid to auditor for audit related assurance services – 0.1Fees paid to auditor in relation to the IPO 1.2 0.1
Total 1.6 0.6
6. Staff numbers and costsAverage monthly number of staff(i) By geographical region
2015 2014
United Kingdom 1,175 1,320United States and Canada 199 152Rest of the world 400 428
Total 1,774 1,900
(ii) By job function
2015 2014
Cost of sales 791 880Sales & marketing 689 728Other administrative functions 294 292
Total 1,774 1,900
Staff costs
(£ million) 2015 2014
Wages and salaries 93.3 94.6Social security costs 9.4 9.4Pension costs 2.1 2.1
Total 104.8 106.1
Retirement benefitsThe Group operates a defined contribution pension scheme in the UK and in certain other overseas jurisdictions. The assets of the scheme are held by independent custodians and are kept entirely separate from the assets of the Group. The pension charge represents contributions due from the UK employer and other smaller overseas employers. During the year ended 31 December 2015 the total Group charge amounted to £2.1 million (2014: £2.1 million). At 31 December 2015 there are £0.3 million contributions outstanding (2014: £0.3 million) at the year end.

56 ASCENTIAL HOLDINGS LIMITED – FINANCIAL STATEMENTS 2015
7. Business combinations 2015 – acquisition of RetailNet Group, LLCOn 22 June 2015, the Group acquired 100% of the shares in RetailNet Group, LLC, an unlisted company based in the US whose primary activity is the provision of forecasting and analytics, consulting and executive education services across the retail, fast-moving consumer goods, professional services and technology sectors.
(a) Identifiable assets acquired and liabilities assumedThe fair values of the identifiable assets purchased and liabilities assumed of RNG as at the date of acquisition were as follows:
(£ million)2015
Book value2015
Fair value
Brands, customer relationships and databases – 2.8Trade and other receivables 0.8 0.8Cash 0.6 0.6Trade and other payables (0.2) (0.2)Deferred income (1.1) (1.1)
Total identifiable net assets at fair value 0.1 2.9
Initial cash consideration relating to business combination 3.1Deferred consideration payable in 2018 2.6
Total consideration 5.7
Goodwill on acquisition 2.8
The goodwill is attributable mainly to the workforce and anticipated future growth in the customer base of the acquired business.
If new information obtained within one year from the acquisition date, about facts and circumstances that existed at the acquisition date, identifies adjustments to the above amounts or any additional provisions that existed at the acquisition date, then the acquisition accounting will be revised.
(b) Acquisition-related costsThe Group incurred acquisition-related costs of £0.5 million related to external legal fees and due diligence costs. These costs have been included within exceptional items in the consolidated profit and loss statement.
(c) Results contribution in the year ended 31 December 2015From the date of acquisition, RNG contributed £1.8 million revenue and a profit before tax from continuing operations of £0.4 million to the Group in the year ended 31 December 2015. If the combination had taken place at the beginning of 2015, revenue from continuing operations would have been £3.5 million and the profit before tax from continuing operations for the Group would have been £0.6 million. In determining these amounts, management has assumed that the fair value adjustments that arose on the date of the acquisition would have been the same if the acquisition occurred on 1 January 2015.
2014 – acquisition of Money20/20, LLCOn 29 August 2014, the Group acquired 100% of the shares in Money20/20, LLC (“Money20/20”), an unlisted company based in the US whose primary activity is the organisation of global events on payments and financial services innovation.
The purchase price is expected to total £55.5 million which comprises:• £25.9 million paid in 2014; • £16.7 million paid in 2015;• deferred consideration contingent on the revenues of the 2015, 2016 and 2017 financial years payable in 2016–2018 and
estimated to total £14.1 million which has been discounted to present value of £11.5 million using the Group’s Exhibitions & Festivals segment using a risk free discount rate; and
• cash acquired of £1.4 million.
There is no maximum or minimum limit on the contingent consideration payable.
NOTES TO THE NON-STATUTORY FINANCIAL STATEMENTS CONTINUEDFOR THE YEAR ENDED 31 DECEMBER 2015
STRATEGIC REPORT | GOVERNANCE | FINANCIAL STATEMENTS
57ASCENTIAL HOLDINGS LIMITED – FINANCIAL STATEMENTS 2015
7. Business combinations continuedIn addition to the deferred contingent consideration described above, and subject to continued employment, certain vendors also receive employment income contingent on the results of the 2015, 2016 and 2017 financial years payable in 2016 – 2018 and estimated to total £14.1 million. To determine the contingent consideration, Management is required to make a judgement regarding the current and future results.
This acquisition-related contingent employment cost is being accrued over the service lives of the relevant employees and £5.5 million was recorded as an exceptional cost in year ended 31 December 2015 (2014: £1.8 million).
(a) Identifiable assets acquired and liabilities assumedThe fair values of the identifiable assets purchased and liabilities assumed of Money20/20 as at the date of acquisition were as follows:
(£ million) Book value Fair value
Brand and trademarks – 17.2Customer relationships and databases – 10.8Tangible fixed assets 0.1 0.1Accounts receivable 1.0 1.0Prepayments 0.3 0.3Deferred event costs 3.1 3.1Other debtors 0.1 0.1Cash 1.4 1.4Accounts payable (0.4) (0.4)Deferred income (8.1) (8.1)Accruals (0.1) (0.1)
Total identifiable net assets (2.6) 25.4
Initial cash consideration relating to business combination paid in 2014 26.0Deferred consideration payable in 2015 16.4Deferred contingent consideration payable in 2016–2018 11.5Cash acquired 1.4
Total consideration 55.3
Goodwill on acquisition 29.9
The goodwill is attributable mainly to the workforce and anticipated future growth in the customer base of the acquired business. The goodwill recognised is expected to be deductible for tax purposes in the US.
(b) Acquisition-related costsThe Group incurred acquisition-related costs of £0.8 million related to external legal fees and due diligence costs. These costs have been included within exceptional items in the consolidated profit and loss statement.
(c) Results contribution in the year ended 31 December 2014From the date of acquisition, Money20/20 contributed £12.7 million revenue and a profit before tax from continuing operations of £8.4 million to the Group for the year ended 31 December 2014. If the combination had taken place at the beginning of 2014, revenue from continuing operations would have been £12.7 million and the profit before tax from continuing operations for the Group would have been £7.4 million. In determining these amounts, management has assumed that the fair value adjustments that arose on the date of the acquisition would have been the same if the acquisition occurred on 1 January 2014.

58 ASCENTIAL HOLDINGS LIMITED – FINANCIAL STATEMENTS 2015
8. Disposal of business operations 2015 – disposal of Media Business Insight Limited (“MBI”)On 30 January 2015, the Group sold MBI and its subsidiary, Brad Insight Limited. The business was classified as held for sale at 31 December 2014. Up to the date of disposal, MBI contributed £0.7 million of revenue and £0.0 million to the profit before tax from continuing operations of the Group for the year ended 31 December 2015. The consolidated profit and loss statement does not present the disposed operation separately from continuing operations. The gain on disposal for the year ended 31 December 2015 was £4.8 million.
Effect of disposal on the financial position of the Group
(£ million) 2015
Consideration received, satisfied in cash 11.0Cash and cash equivalents disposed of (0.2)
Gross cash inflow 10.8Transaction costs (0.2)
Net cash inflow 10.6
Goodwill (4.5)Brands, customer relationships and databases (2.9)Tangible fixed assets (0.4)Trade and other receivables (2.2)Trade and other payables 1.1Deferred income 2.6Deferred tax liability on disposed intangibles 0.5
Net assets and liabilities disposed (5.8)
Gain on disposal 4.8
9. Finance costs and finance income
(£ million) 2015 2014
Interest payable on borrowings (28.3) (32.8)Foreign exchange loss on cash and cash equivalents – (0.2)Amortisation of loan arrangement fees (2.4) (3.0)Break fees and write-off of loan arrangement fees on debt refinancing (4.3) –Other finance charges (2.3) (1.2)
Finance costs (37.3) (37.2)
Interest on bank deposits 0.1 0.2Foreign exchange gain on borrowings 3.4 3.1Foreign exchange gain on cash and cash equivalents 0.8 –Fair value gain on derivatives 4.2 5.9
Finance income 8.5 9.2
Net finance costs (28.8) (28.0)
NOTES TO THE NON-STATUTORY FINANCIAL STATEMENTS CONTINUEDFOR THE YEAR ENDED 31 DECEMBER 2015
STRATEGIC REPORT | GOVERNANCE | FINANCIAL STATEMENTS
59ASCENTIAL HOLDINGS LIMITED – FINANCIAL STATEMENTS 2015
10. Tax on profit on ordinary activitiesThe tax credited in the consolidated profit and loss statement is analysed as follows:
(£ million) 2015 2014
Current taxUK corporation taxCurrent tax charge on income for the year at 20.25% (2014: 21.5%) 2.8 2.7Adjustments in respect of prior years 0.2 0.4
Foreign taxCurrent tax charge on income for the year 1.8 3.0Adjustments in respect of prior years 0.2 0.1
Total current tax charge 5.0 6.2
Deferred taxCurrent year (10.4) (27.4)Adjustments in respect of prior years (0.9) (4.0)Impact of rate changes on opening deferred tax balances (1.4) –
Total deferred tax credit (12.7) (31.4)
Total tax credit (7.7) (25.2)
The difference between the tax as credited in the consolidated profit and loss statement and tax at the UK standard rate is explained below:
(£ million) 2015 2014
Profit/(loss) before tax 8.4 (5.4)
Expected tax charge/(credit) at the UK standard rate of 20.25% (2014: 21.5%) 1.7 (1.2)
Principal differencesImpact of rate changes (1.5) 0.2Impact of higher overseas tax rates (0.5) (0.2)Utilisation and recognition of previously unrecognised tax losses (5.8) (22.3)Other non-deductible items 0.9 2.5Non-taxable exchange gains and losses (1.0) (0.7)Non-taxable disposal gains (1.0) –Adjustments in respect of prior years (0.5) (3.5)
Difference (9.4) (24.0)
Total tax credit for the year (7.7) (25.2)
On 1 April 2015 the UK corporation tax rate reduced from 21% to 20%, resulting in a statutory UK corporation tax rate for the year of 20.25%. The Group’s effective tax rate is lower than the UK’s statutory tax rate in the main due to the recognition of previously unrecognised tax US losses as a result of increasing certainty over future taxable profits against which these tax assets can be recovered.
Factors that may affect future tax charges:The 2015 Autumn Statement announcement included a proposal to reduce the main rate of UK corporation tax from 20% to 19% and 18% from 1 April 2017 and 1 April 2020 respectively. As these reductions were substantively enacted, by the consolidated statement of financial position date, the deferred tax assets and liabilities have been measured at the reduced rates applicable when the assets and liabilities are forecast to reverse. The rate of writing down allowances on the main pool of plant and machinery and on the special rate pool remain unchanged at 18% and 8% respectively.

60 ASCENTIAL HOLDINGS LIMITED – FINANCIAL STATEMENTS 2015
11. Intangible fixed assets
(£ million) Goodwill Brands
Customer relationships
and databases Software Total
CostAt 1 January 2014 858.8 312.1 165.9 47.0 1,383.8Additions 29.9 17.2 10.8 8.9 66.8Disposals – – – (3.1) (3.1)Reclassification to assets held for sale (Note 16) (4.5) (3.9) (3.7) (0.8) (12.9)Effect of movements in exchange rates 3.8 0.2 – – 4.0
At 1 January 2015 888.0 325.6 173.0 52.0 1,438.6
Additions 2.8 1.0 1.8 7.9 13.5Disposals – – – (1.0) (1.0)Effect of movements in exchange rates 4.0 0.2 1.1 (0.9) 4.4
At 31 December 2015 894.8 326.8 175.9 58.0 1,455.5
Amortisation/impairmentAt 1 January 2014 (511.1) (81.0) (110.7) (21.1) (723.9)Disposals – – – 3.1 3.1Amortisation – (12.8) (13.0) (13.4) (39.2)Impairment – – – (0.4) (0.4)Reclassification to assets held for sale (Note 16) – 1.1 3.5 0.5 5.1
At 1 January 2015 (511.1) (92.7) (120.2) (31.3) (755.3)
Disposals – – – 0.9 0.9Amortisation – (15.1) (14.4) (12.9) (42.4)
At 31 December 2015 (511.1) (107.8) (134.6) (43.3) (796.8)
Net book value
At 31 December 2015 383.7 219.0 41.3 14.7 658.7
At 31 December 2014 376.9 232.9 52.8 20.7 683.3
Included within software intangible fixed assets at 31 December 2015 is £4.1 million (2014: £4.8 million) of assets under construction which were not being amortised at 31 December 2015.
Goodwill and indefinite life intangible assetsGoodwill is allocated to the cash-generating units (“CGUs”) that benefit from that business combination as follows:
(£ million)Exhibitions &
FestivalsInformation
Services Total
Net Book Value
At 31 December 2015 181.9 201.8 383.7
At 31 December 2014 180.5 196.4 376.9
The Group tests goodwill and indefinite life intangible assets annually for impairment or more frequently if there are indications of impairment. The CGUs used in testing for impairment are in line with the segment note disclosure (Note 4). When testing for impairment, recoverable amounts for all of the Group’s CGUs are measured at their value-in-use by discounting the future expected cash flows from the assets in the CGUs. These calculations use cash flow projections based on Board approved budgets and plans.
NOTES TO THE NON-STATUTORY FINANCIAL STATEMENTS CONTINUEDFOR THE YEAR ENDED 31 DECEMBER 2015
STRATEGIC REPORT | GOVERNANCE | FINANCIAL STATEMENTS
61ASCENTIAL HOLDINGS LIMITED – FINANCIAL STATEMENTS 2015
11. Intangible fixed assets continuedBrand value and customer relationships include £70.8 million (2014: £70.8 million) with an indefinite life which is not being amortised. These intangible assets are included within the Exhibitions & Festivals segment. This relates to Cannes Lions and was identified on acquisition by the Group in 2008. This brand has an indefinite life due to the strength of its recognition and revenue stream and is tested annually for impairment. It was tested for impairment as part of the Exhibitions & Festivals segment CGU using the value-in-use inputs disclosed below.
The key assumptions used for value-in-use calculations are as follows:
Exhibitions & Festivals
Information Services
Year ended 31 December 2015
Long-term growth rate 2.5% 2.5%Pre-tax discount rate 9.2% 9.8%
Year ended 31 December 2014Long-term growth rate 2.5% 2.5%Pre-tax discount rate 10.0% 10.3%
The measurement of value-in-use is sensitive to changes in these key assumptions and in the assumptions about economic growth and market penetration that underpin the cash flow projections.
The Directors have sensitised the key assumptions, including the discount rate, and under both base case and sensitised case no indicators of impairment exist. The Directors believe that any reasonably possible change in the key assumptions on which the recoverable amount is based would not cause the carrying amount to exceed its recoverable amount.
12. Property, plant and equipment
(£ million)
Short leasehold property
Office equipment Total
CostAt 1 January 2014 17.1 13.7 30.8Additions 0.3 1.8 2.1Disposals (1.5) (6.1) (7.6)Reclassification to assets held for sale (Note 16) – (0.2) (0.2)
At 1 January 2015 15.9 9.2 25.1
Additions 1.3 1.0 2.3Disposals (0.9) (0.7) (1.6)
At 31 December 2015 16.3 9.5 25.8
DepreciationAt 1 January 2014 (5.3) (9.9) (15.2)Depreciation (1.8) (2.9) (4.7)Impairment (0.4) – (0.4)Disposals 1.5 6.1 7.6Reclassification to assets held for sale (Note 16) – 0.1 0.1
At 1 January 2015 (6.0) (6.6) (12.6)
Depreciation (2.2) (2.4) (4.6)Disposals 0.9 0.7 1.6
At 31 December 2015 (7.3) (8.3) (15.6)
Net book value
At 31 December 2015 9.0 1.2 10.2
At 31 December 2014 9.9 2.6 12.5
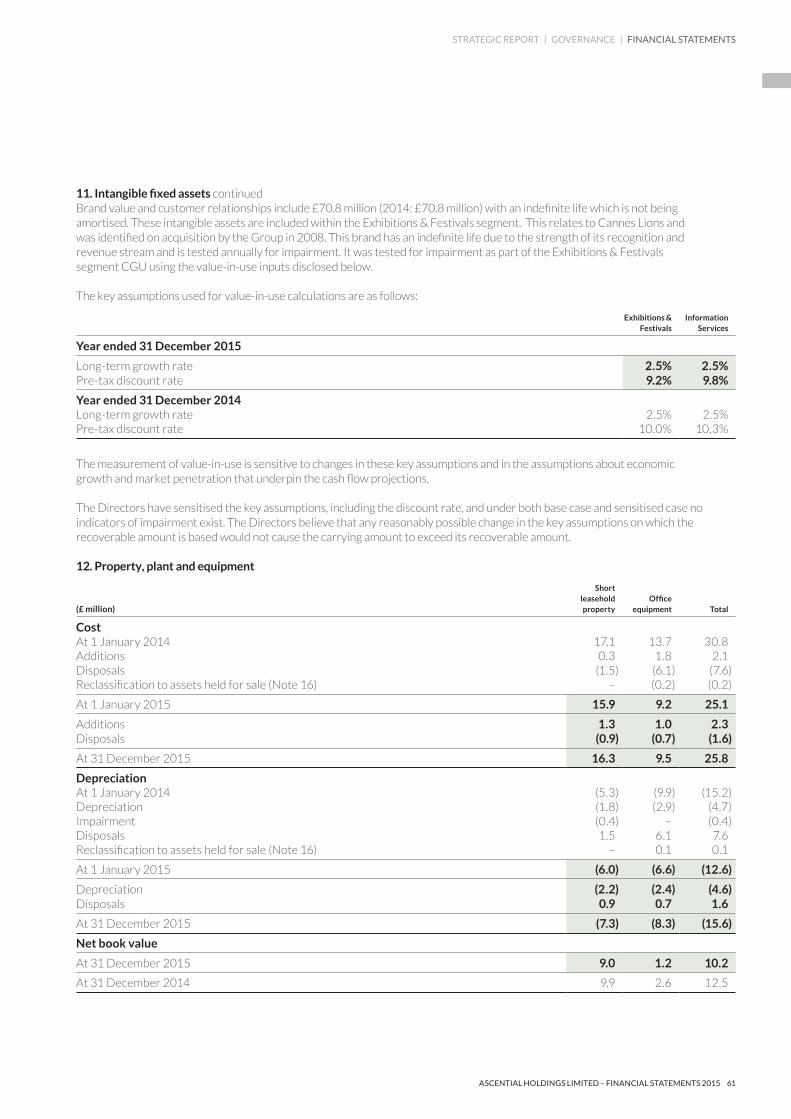

62 ASCENTIAL HOLDINGS LIMITED – FINANCIAL STATEMENTS 2015
13. Investments
(£ million) 2015 2014
At 1 January 0.6 0.6Additions 0.1 –
At 31 December 0.7 0.6
Investments include shares in unlisted associated companies, as well as a loan to a joint venture and a trade investment.
14. Inventories
(£ million) 2015 2014
Deferred event costs 17.2 14.1Physical stock 0.4 0.5
Total 17.6 14.6
15. Trade and other receivables
(£ million) 2015 2014
Trade receivables, net of the allowance for doubtful debts 53.2 43.9Prepayments and accrued income 8.1 6.8Other receivables 4.0 1.2
Total 65.3 51.9
The carrying amounts of trade and other receivables are denominated primarily in pounds sterling. The Directors consider that the carrying amount of receivables and prepayments approximates their fair value.
Trade receivables are non-interest bearing and are generally on immediate or 30 day terms and are shown net of a provision for impairment. As of 31 December 2015, the provision for impaired trade receivables was £2.1 million (2014: £1.7 million). Movements in the provision for impairment of receivables were as follows:
(£ million) 2015 2014
At 1 January 1.7 1.6Provided in the year 2.5 2.2Utilised in the year (2.1) (2.1)
At 31 December 2.1 1.7
Trade receivables, net of the allowance for doubtful debts, are aged as follows:
(£ million) 2015 2014
Not overdue 28.5 17.40 –30 days overdue 9.0 8.231 – 90 days overdue 10.6 10.5Greater than 90 days overdue 5.1 7.8
Total 53.2 43.9
NOTES TO THE NON-STATUTORY FINANCIAL STATEMENTS CONTINUEDFOR THE YEAR ENDED 31 DECEMBER 2015
STRATEGIC REPORT | GOVERNANCE | FINANCIAL STATEMENTS
63ASCENTIAL HOLDINGS LIMITED – FINANCIAL STATEMENTS 2015
16. Assets and liabilities held for sale
The major classes of assets and liabilities of operations classified as held for sale were as follows:
(£ million) 2015 2014
Goodwill – 4.5Other intangible assets – 3.2Property, plant and equipment – 0.1Trade and other receivables – 2.1
Total assets held for sale – 9.9
Trade and other payables – (3.6)
Total liabilities associated with assets held for sale – (3.6)
The assets and liabilities of Media Business Insight, an Information Services business, were presented as assets held for sale following the commitment of the Group’s management to dispose of the businesses in December 2014. A purchase had been agreed with the prospective buyer, and the sale was completed in January 2015, refer to Note 8. The assets of the disposal group were valued at the lower of their book value and fair value less costs to sell. The goodwill, intangible assets and property, plant and equipment associated with businesses were reclassified as assets held for sale, as disclosed in Note 11 and Note 12 respectively.
17. Financial assetsThe Group’s principal financial assets are bank balances and cash, financial derivative assets and trade and other receivables. The Group’s credit risk is primarily attributable to its trade receivables (see Note 15). The credit risk on liquid funds and derivative financial instruments is limited because the counterparties are banks with high credit ratings assigned by international credit rating agencies. The Group has no significant concentration of credit risk, with exposure spread over a number of counterparties and customers.
18. Cash and cash equivalentsCash and cash equivalents at 31 December 2015 of £43.0 million (2014: £19.8 million) relate to bank balances, including short-term deposits with an original maturity date of less than three months, and cash held by the Group.
19. Trade and other payables
(£ million) 2015 2014
Trade payables 13.3 11.4Payable to parent undertaking 16.5 13.5Other payables 7.9 7.8Current tax liabilities 1.2 0.6Taxes and social security costs 5.5 6.7Accruals 40.1 54.5Deferred income 110.8 97.5
Total 195.3 192.0
The Directors consider that the carrying amount of trade payables approximates their fair value. Accruals include deferred and contingent consideration of £8.0 million (2014: £19.6 million).
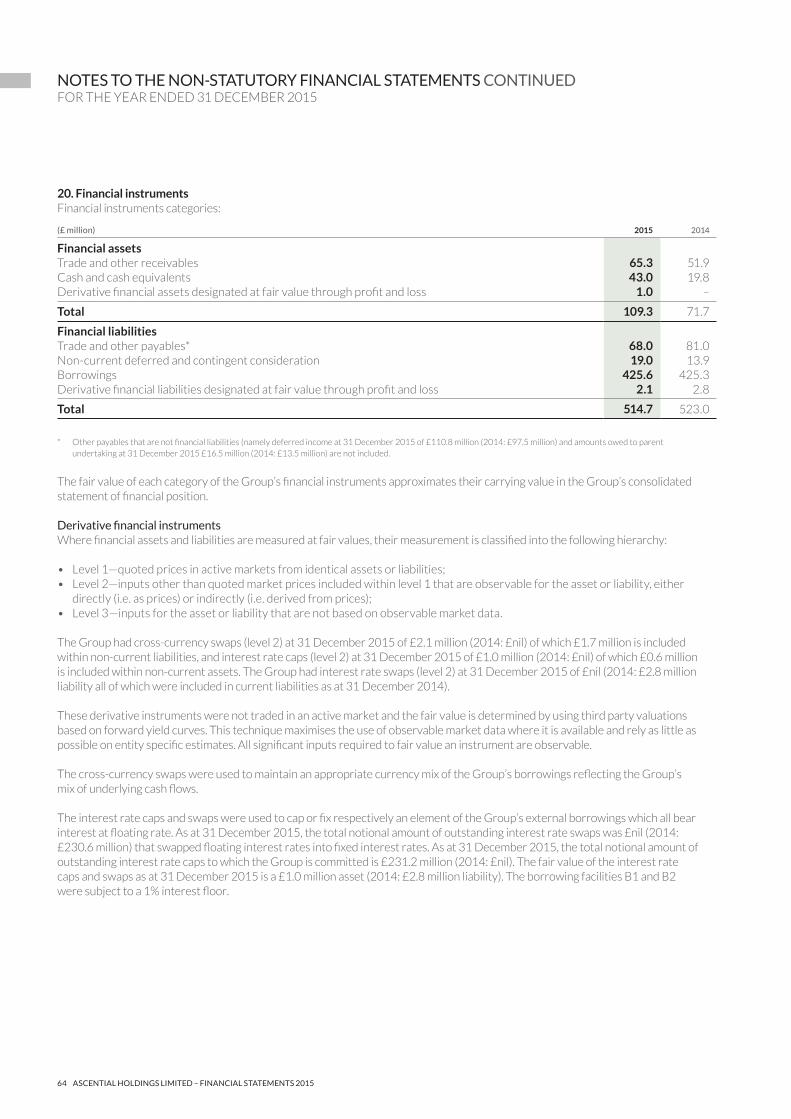
64 ASCENTIAL HOLDINGS LIMITED – FINANCIAL STATEMENTS 2015
20. Financial instrumentsFinancial instruments categories:
(£ million) 2015 2014
Financial assetsTrade and other receivables 65.3 51.9Cash and cash equivalents 43.0 19.8Derivative financial assets designated at fair value through profit and loss 1.0 –
Total 109.3 71.7
Financial liabilitiesTrade and other payables* 68.0 81.0Non-current deferred and contingent consideration 19.0 13.9Borrowings 425.6 425.3Derivative financial liabilities designated at fair value through profit and loss 2.1 2.8
Total 514.7 523.0
* Other payables that are not financial liabilities (namely deferred income at 31 December 2015 of £110.8 million (2014: £97.5 million) and amounts owed to parent undertaking at 31 December 2015 £16.5 million (2014: £13.5 million) are not included.
The fair value of each category of the Group’s financial instruments approximates their carrying value in the Group’s consolidated statement of financial position.
Derivative financial instrumentsWhere financial assets and liabilities are measured at fair values, their measurement is classified into the following hierarchy:
• Level 1—quoted prices in active markets from identical assets or liabilities;• Level 2—inputs other than quoted market prices included within level 1 that are observable for the asset or liability, either
directly (i.e. as prices) or indirectly (i.e. derived from prices);• Level 3—inputs for the asset or liability that are not based on observable market data.
The Group had cross-currency swaps (level 2) at 31 December 2015 of £2.1 million (2014: £nil) of which £1.7 million is included within non-current liabilities, and interest rate caps (level 2) at 31 December 2015 of £1.0 million (2014: £nil) of which £0.6 million is included within non-current assets. The Group had interest rate swaps (level 2) at 31 December 2015 of £nil (2014: £2.8 million liability all of which were included in current liabilities as at 31 December 2014).
These derivative instruments were not traded in an active market and the fair value is determined by using third party valuations based on forward yield curves. This technique maximises the use of observable market data where it is available and rely as little as possible on entity specific estimates. All significant inputs required to fair value an instrument are observable.
The cross-currency swaps were used to maintain an appropriate currency mix of the Group’s borrowings reflecting the Group’s mix of underlying cash flows.
The interest rate caps and swaps were used to cap or fix respectively an element of the Group’s external borrowings which all bear interest at floating rate. As at 31 December 2015, the total notional amount of outstanding interest rate swaps was £nil (2014: £230.6 million) that swapped floating interest rates into fixed interest rates. As at 31 December 2015, the total notional amount of outstanding interest rate caps to which the Group is committed is £231.2 million (2014: £nil). The fair value of the interest rate caps and swaps as at 31 December 2015 is a £1.0 million asset (2014: £2.8 million liability). The borrowing facilities B1 and B2 were subject to a 1% interest floor.
NOTES TO THE NON-STATUTORY FINANCIAL STATEMENTS CONTINUEDFOR THE YEAR ENDED 31 DECEMBER 2015
STRATEGIC REPORT | GOVERNANCE | FINANCIAL STATEMENTS
65ASCENTIAL HOLDINGS LIMITED – FINANCIAL STATEMENTS 2015
20. Financial instruments continuedThe following is an analysis of the contractual undiscounted cash flows payable under financial and derivative liabilities:
(£ million)Less than one
month
Between one and three
months
Between three and
twelve months
In one to two years
In two to five years
In more than five years
At 31 December 2015Non-derivative financial liabilitiesBorrowings – 1.1 3.3 4.4 13.1 414.3Interest payments on borrowings 6.6 2.3 19.8 26.2 77.2 37.6Non-current deferred and contingent consideration – – – 10.7 14.7 –Trade and other payables 48.5 8.0 1.9 – 3.7 –Derivative financial liabilitiesDerivative contracts – receipts (1.7) – (5.5) (7.9) (116.5) –Derivative contracts – payments 1.9 – 5.7 8.0 117.1 –
Total 55.3 11.4 25.2 41.4 109.3 451.9
(£ million)Less than one
month
Between one and three
months
Between three and
twelve months
In one to two years
In two to five years
In more than five years
At 31 December 2014Non-derivative financial liabilitiesBorrowings – – 17.4 12.0 399.8 –Interest payments on borrowings 5.0 0.1 15.9 22.3 17.2 –Non-current deferred and contingent consideration – – – 4.0 12.1 –Trade and other payables 57.1 16.4 1.7 2.1 3.7 –Derivative financial liabilitiesDerivative contracts – receipts (0.2) – (0.2) – – –Derivative contracts – payments 1.7 – 1.6 – – –
Total 63.6 16.5 36.4 40.4 432.8 –
The financial and derivative liabilities are shown in the time period in which they are due to be repaid. The interest payments on borrowings due in less than one month, represents the actual interest due, while the interest due greater than one month is an estimate based on current interest rates and exchange rates. Cash flows in respect of borrowings represent contractual payments under the Group’s lending facilities in place as of December 2015. Borrowings as disclosed in Note 21 are stated net of unamortised arrangement fees of £10.5 million as at 31 December 2015 (2014: £3.9 million) and net of Senior Debt repurchased held at the consolidated statement of financial position date of £nil (2014: £nil).
21. Borrowings The maturity profile of the Group’s borrowings, all of which are secured loans, was as follows:
(£ million) 2015 2014
Current – within one year 2.4 15.1
Non-current:– In the second year 2.4 10.4– Two to five years 7.2 399.8– After more than five years 413.6 –
Non-current 423.2 410.2
Total borrowings 425.6 425.3
The Group’s borrowings at 31 December 2015 were in US dollars: $321 million and euros: €299 million (2014: pounds sterling: £198 million, US dollars: $155 million and euros: €169 million) and are shown net of unamortised issue costs. The carrying amounts of borrowings approximate their fair value. The carrying value of the Group’s borrowing facilities at 31 December 2015 is detailed in Note 2.

66 ASCENTIAL HOLDINGS LIMITED – FINANCIAL STATEMENTS 2015
21. Borrowings continuedEach 1% movement in the euro to pounds sterling exchange rate has a circa £2.2 million impact on the carrying value of borrowings. Each 1% movement in the US dollar to pounds sterling exchange rate has a circa £2.2 million impact on the carrying value of borrowings, offset by a circa £1.1 million impact on the carrying value of derivative financial instruments in respect of cross-currency swaps.
In April 2014, the Group completed a currency redenomination of some of its senior term debt. In total, £60.0 million of pounds sterling debt was redenominated into €72.2 million of euro debt.
In January 2015, the Group raised an additional £15.0 million of short-term debt consisting of a £6.0 million pounds sterling term loan and a £9.0 million multi-currency revolving credit. The term on each of these facilities was 6 months. The facility was repaid and cancelled in April 2015.
In April 2015, the Group completed a refinancing of its borrowings to improve terms and extend maturities. The existing senior, mezzanine and facilities and short-term debt facilities referred to above were repaid in full and new facilities put in place comprising a $323 million and a €300 million term loan maturing in April 2022 and a £75 million revolving credit facility maturing in April 2021.
The effective annual interest rate at 31 December 2015 was 6.0% (2014: 6.29%).
22. Reconciliation of movement in net debt
(£ million) CashShort-term
depositsInterest rate
swapsInterest rate
cap
Cross currency
swaps Borrowings Net debt
At 1 January 2014 12.4 17.2 (9.2) – – (430.2) (409.8)
Exchange differences (0.2) 0.1 – – – 2.9 2.8Debt drawdown 15.0 – – – – (15.0) –Debt repayment (26.2) – – – – 26.2 –Fair value movements – – 5.9 – – – 5.9Non-cash movements – – (6.2) – – (9.7) (15.9)Net cash movement 17.6 (16.1) 6.7 – – 0.5 8.7
At 31 December 2014 18.6 1.2 (2.8) – – (425.3) (408.3)
Exchange differences 0.9 (0.1) – – – (3.8) (3.0)Debt drawdown 440.7 – – – – (440.7) –Debt repayment (439.3) – – – – 439.3 –Fair value movements – – 1.4 0.3 2.5 – 4.2Non-cash movements – – (1.8) – (0.5) (8.4) (10.7)Net cash movement 12.9 8.1 3.2 0.7 (4.1) 13.3 34.1
At 31 December 2015 33.8 9.2 – 1.0 (2.1) (425.6) (383.7)
23. Other non-current liabilities
(£ million) 2015 2014
Deferred income 1.6 1.0Deferred and contingent consideration 19.0 13.9
Total 20.6 14.9
The Directors consider that the carrying amount of other non-current liabilities approximate their fair value.
NOTES TO THE NON-STATUTORY FINANCIAL STATEMENTS CONTINUEDFOR THE YEAR ENDED 31 DECEMBER 2015
STRATEGIC REPORT | GOVERNANCE | FINANCIAL STATEMENTS
67ASCENTIAL HOLDINGS LIMITED – FINANCIAL STATEMENTS 2015
24. Provisions
(£ million) Property
provisions OtherTotal
provisions
At 1 January 2014 0.1 2.4 2.5Provided in the year 0.8 0.2 1.0Utilised in the year – (0.2) (0.2)
At 31 December 2014 0.9 2.4 3.3
Provided in the year 0.1 0.3 0.4Released in the year (0.8) (0.3) (1.1)Utilised in the year – (0.1) (0.1)
At 31 December 2015 0.2 2.3 2.5
Provisions have been analysed between current and non-current as follows:
(£ million) 2015 2014
Current 2.3 3.1Non-current 0.2 0.2
Total 2.5 3.3
The property provisions relate to on-going lease commitments on vacant properties. Other provisions relate to the acquisition of CWIEME of £1.4 million (2014: £1.5 million), end of service liabilities of £0.7 million (2014: £0.7 million) and onerous contracts of £0.2 million (2014: £0.2 million).
25. Deferred taxThe major deferred tax assets and liabilities recognised by the Group, and the movements in the year, are set out below:
(£ million) Tax losses
Depreciation vs. tax
allowances
Other temporary
differences Intangible
assets Total
At 1 January 2014 7.3 5.5 (0.1) (57.8) (45.1)Credit to the consolidated profit and loss statement for the year 18.3 3.2 – 5.9 27.4Adjustments in respect of prior years – 1.1 0.1 2.8 4.0Foreign exchange movements 0.4 – – (0.8) (0.4)Other – (0.2) 0.1 – (0.1)
At 31 December 2014 26.0 9.6 0.1 (49.9) (14.2)
Credit to the consolidated profit and loss statement for the year (1.3) 3.2 3.0 5.5 10.4Adjustments in respect of prior years (0.1) (0.1) 1.1 – 0.9Impact of rate changes (0.7) (0.9) – 3.0 1.4Foreign exchange movements 0.7 (0.1) (0.2) 0.1 0.5Disposals – (0.1) – 0.6 0.5
At 31 December 2015 24.6 11.6 4.0 (40.7) (0.5)
The following is the analysis of the deferred tax balances for consolidated statement of financial position purposes:
(£ million) 2015 2014
Deferred tax assets – non-current 40.2 35.7Deferred tax liabilities – non-current (40.7) (49.9)
Total (0.5) (14.2)

68 ASCENTIAL HOLDINGS LIMITED – FINANCIAL STATEMENTS 2015
25. Deferred tax continuedAt 31 December 2015, the Group has net deferred tax liabilities provided across the categories set out above totalling £0.5 million (2014: £14.2 million liability), of which £2.3 million is payable to the Group (2014: £0.6 million) within one year and £1.8 million (2014: £25.5 million) payable by the Group after more than one year. The reduction in the net liability position in the year arises from the increased level of recognition of tax assets in respect of tax losses as well as the continued amortisation of intangible assets and the associated deferred tax liability.
The Group has trading tax losses in the US totalling £94.7 million carried forward at 31 December 2015 (2014: £105.0 million). It has been agreed with the US tax authorities that these losses are available for offset against taxable profits. However, it is expected that these losses will be subject to change of ownership restrictions following the listing of Ascential plc as described in Note 33. A deferred tax asset of £11.5 million (2014: £9.6 million) has been recognised which represents the expected recoverable value of losses taking into account the expected impact of these restrictions. The restriction of losses is dependent on the valuation of the US business which will need to be agreed with the US tax authorities and, as such, is uncertain. The deferred tax asset recognised is based on management’s best estimate of the valuation.
The Group has not recognised a deferred tax asset on US capital losses at 31 December 2015 totalling £164.9 million (2014: £178.4 million) which have varying expiry dates from 2016 to 2025.
The Group has trading and non-trading tax losses in the UK totalling £68.3 million carried forward at 31 December 2015 (2014: £82.7 million) which are likely to be fully utilised. Therefore a deferred tax asset of £13.1 million (2014: £16.3 million) has been recognised in respect of the full amount of these losses.
The Group has not recognised a deferred tax asset on UK capital losses at 31 December 2015 totalling £146.3 million (2014: £146.0 million) which can be carried forward indefinitely.
No deferred tax liability is recognised on the unremitted earnings for overseas subsidiaries and joint ventures as any remittances would not give rise to tax payable in the foreseeable future.
26. Share capital
(£ million) 2015 2014
Allotted, called up and fully paid:Ordinary shares of £1 each 543.7 543.7
The total authorised number of ordinary shares is 600,000,000 (2014: 600,000,000) shares with a nominal value of £1 per share and two shares with a nominal value of US$1 which is unchanged from 2014. All issued ordinary shares are allotted, called up and fully paid.
27. Translation reserve
(£ million) 2015 2014
1 January (4.1) (8.2)Exchange differences arising on translation of foreign operations (2.7) 4.1
31 December (6.8) (4.1)
The translation reserve arises on the translation into pounds sterling of the net assets of the Group’s foreign operations.
28. Retained earnings
(£ million) 2015 2014
1 January (403.1) (422.9)Profit for the year attributable to equity holders of the parent 16.1 19.8
31 December (387.0) (403.1)
NOTES TO THE NON-STATUTORY FINANCIAL STATEMENTS CONTINUEDFOR THE YEAR ENDED 31 DECEMBER 2015
STRATEGIC REPORT | GOVERNANCE | FINANCIAL STATEMENTS
69ASCENTIAL HOLDINGS LIMITED – FINANCIAL STATEMENTS 2015
29. Operating leasesThe Group had total future minimum lease payments under non-cancellable operating leases at 31 December 2015 as set out below:
(£ million)
2015 2014
Land and buildings Other assets
Land and buildings Other assets
Within one year 6.8 0.3 6.8 0.4Two to five years 21.4 0.5 20.6 0.5After more than five years 11.8 – 16.6 –
Total 40.0 0.8 44.0 0.9
The Group leases various offices under non-cancellable operating lease agreements. The leases have various terms, escalation clauses and renewal rights. The Group also leases other equipment under non-cancellable operating lease agreements. The Group does not have any finance leases.
30. Commitments and contingenciesContracted commitments for capital expenditure relating to the Group’s business applications at 31 December 2015 totalled £0.5 million (2014: £1.8 million). The Group has commitments under a non-cancellable contract as part of the Group’s outsourcing of part of its accounting functions whereby it is committed to six months of contractual payments with an annual charge of £1.1 million (2014: £1.1 million).
31. Related party transactionsAt 31 December 2015 the Group owed £16.5 million to Hazel Acquisition 1 Limited (2014: £13.5 million) in relation to utilisation of tax losses, and was owed £nil by Eden 2 & Cie S.C.A. (2014: £68,656). The Group paid £nil to Eden 2 & Cie S.C.A. in relation to the issue of shares in that company to senior managers of the Group (2014: £12,682). The Group also incurred £250,877 of costs which Apax had incurred and recharged to Apax Europe VII GP Co. Limited, which were subsequently recharged to the Group (2014: £78,883). There were also £nil (2014: £27,653) costs from GMG which were recharged to the Group.
In addition, GMG acts as the UK representative for and is a sponsorship customer of Cannes Lions. In the year ending 31 December 2015, the Group received £94,577 (2014: £104,757) of revenue from GMG and billed a further £24,484 relating to 2016 sponsorship. There were no other related party transactions throughout the year.
32. Remuneration of Directors and key management personnel The remuneration of Directors was as follows:
(£ million) 2015 2014
Emoluments for services to the Group 1.0 0.2
Retirement benefits were not accrued for any Director at 31 December 2015 (2014: one under a money purchase scheme).
None of the Directors received remuneration for their services from Ascential Holdings Limited (2014: none). Duncan Painter and Mandy Gradden were remunerated by other members of the Group. Frank Ehmer and Tom Hall have an indirect interest in the value of the Group through their interests in funds advised by Apax Partners.

70 ASCENTIAL HOLDINGS LIMITED – FINANCIAL STATEMENTS 2015
32. Remuneration of Directors and key management personnel continuedThe remuneration of key management personnel was as follows:
(£ million) 2015 2014
Salaries, bonus and other short-term employee benefits 1.0 1.0
Key management personnel comprise the Chief Executive Officer and Chief Financial Officer of the Group.
A number of the Group’s senior managers became shareholders of Ascential Holdings Limited’s ultimate parent undertaking, Eden 2 & Cie S.C.A., during 2014 and early 2015. The continued ownership of these shares was subject to certain ‘good’ and ‘bad’ leaver provisions, which was linked to their continued employment by the Group. As such, the shares are deemed to constitute an equity settled share-based payment scheme under IFRS. The shares are deemed to have vested upon issue. No expense has been recognised as the consideration received for the shares by the parent undertaking was equal to, or greater than, the fair value of the shares at that date. For legal and administrative reasons certain participants outside the UK and the US received their LTIP in cash-settled phantom awards giving rise to a share-based payments charge of £0.5 million.
33. Events after the reporting periodSince 31 December 2015 the following events have taken place:
On 8 February 2016 Ascential plc became the ultimate parent undertaking of the Group by acquiring the entire issued share capital of and certain voting beneficiary certificates (having no economic monetary value) in, Eden 2 & Cie S.C.A., (which was the ultimate parent of Ascential Holdings Limited) other than the one unlimited share of negligible value held by Eden 2 S.a.r.l., and the entire issued share capital of Eden 2 S.a.r.l. On 12 February 2016 Ascential plc was admitted to trade on the main market for the listing securities on the London Stock Exchange and the associated Offer for Shares (the “Offer”) raised gross proceeds of £200 million.
On 12 February 2016, Ascential plc entered into new term loan facilities of £66 million, €171 million and $96 million and a revolving credit facility of £95 million (“New Facilities Agreement”), which were made available to Ascential plc and certain of its subsidiaries.
On 12 February 2016, Ascential plc used proceeds of the Offer, together with the new bank facilities under the New Facilities Agreement and existing available cash to repay all amounts outstanding under the Group’s existing senior facilities agreement and to cancel certain hedging arrangements. In addition, Ascential plc used the proceeds of the Offer to redeem in full certain instruments held on behalf of certain current and former employees (which instruments were cancelled).
There were no other reportable events after 31 December 2015.
34. Related undertakingsAt 31 December 2015 Ascential Holdings Limited had the following subsidiaries, associates and joint venture undertakings:
Company name Country of registrationDirect / indirect
Percentage shareholding/ interest
Top Right Group Financing Limited England & Wales Direct 100%Ascential Group Limited England & Wales Indirect 100%EMAP America Holdings Limited England & Wales Indirect 100%EMAP America Limited England & Wales Indirect 100%EMAP Limited England & Wales Indirect 100%EMAP Group Holdings Limited England & Wales Indirect 100%EMAP Radio Financing Limited England & Wales Indirect 100%Edgware 174 England & Wales Indirect 100%International Advertising Festival Limited England & Wales Indirect 100%Worth Global Style Network Limited England & Wales Indirect 100%4C Information Group Limited England & Wales Indirect 100%WGSN Group Limited England & Wales Indirect 100%Ascential 4C Group Limited England & Wales Indirect 100%Trades Exhibitions Limited England & Wales Indirect 20%DeHavilland Information Services Limited England & Wales Indirect 100%
NOTES TO THE NON-STATUTORY FINANCIAL STATEMENTS CONTINUEDFOR THE YEAR ENDED 31 DECEMBER 2015
STRATEGIC REPORT | GOVERNANCE | FINANCIAL STATEMENTS
71ASCENTIAL HOLDINGS LIMITED – FINANCIAL STATEMENTS 2015
34. Principal subsidiary undertakings continued
Company name Country of registrationDirect / indirect
Percentage shareholding/ interest
EMAP Publishing Limited England & Wales Indirect 100%Glenigan Limited England & Wales Indirect 100%GroundSure Limited England & Wales Indirect 100%i2i Events Limited England & Wales Indirect 100%Lions Festivals Limited England & Wales Indirect 100%Planet Retail Limited England & Wales Indirect 100%Ascential Technology Limited England & Wales Indirect 100%WGSN Limited England & Wales Indirect 100%Stylesight Europe Limited England & Wales Indirect 100%4C Dormant Limited England & Wales Indirect 100%TRG EMAP Dormant 4 Limited England & Wales Indirect 100%i2i Eventos Ltda Brazil Indirect 100%4C Servicos de Informacao Ltda Brazil Indirect 100%Mindset Comunicacao e Marketing Ltda Brazil Indirect 100%2WH Assessoria Empresarial Ltda Brazil Indirect 100%Eden Bidco Limited(1) Cayman Islands Direct 100%Eden Loanco Limited(1) Cayman Islands Indirect 100%i2i Events GmbH Germany Indirect 100%Planet Retail GmbH Germany Indirect 100%WGSN Asia Pacific Limited Hong Kong Indirect 100%Stylesight Limited Hong Kong Indirect 100%i2i Events (India) Pte Limited India Indirect 100%Top Right Group India Knowledge Services Private Limited India Indirect 100%EMAP Jersey Holdings Limited Jersey Indirect 100%EMAP Jersey Financing Limited(1) Jersey Indirect 100%Eden Financing S.a.r.l. Luxembourg Indirect 100%i2i Events (Shanghai) Company Limited People’s Republic of China Indirect 100%WGSN Business Information Consulting (Shanghai) Company Limited People’s Republic of China Indirect 100%Stylesight Information Technology (Shanghai) Company Limited People’s Republic of China Indirect 100%Asian Advertising Festivals (Spikes Asia) Pty Ltd Singapore Indirect 50%WGSN Intelligence Espana S.L Spain Indirect 100%WGSN Group Trend Forecasting Moda Danismanlik Hizmetleri Limited Turkey Indirect 100%i2i Fuarcilik Organizasyon ve Tanitim Hizmetleri Anonim Sti. Turkey Indirect 100%MEED Media FZ-LLC United Arab Emirates Indirect 100%TRG Financing LLC USA Indirect 100%Planet Retail USA LLC USA Indirect 100%WGSN, Inc. USA Indirect 100%RetailNet Group, LLC USA Indirect 100%Money20/20, LLC USA Indirect 100%
(1) Tax resident in the United Kingdom
35. Company details and ultimate parent undertakingThe Company is registered in the Cayman Islands as a limited company. Its registered office is Intertrust Corporate Services (Cayman) Limited, 190 Elgin Avenue, George Town, Grand Cayman KY1-9005, Cayman Islands.
As at 31 December 2015, Hazel Acquisition 1 Limited was the Company’s parent undertaking and Eden 2 & Cie S.C.A. was regarded by the Directors as the Company’s ultimate parent undertaking and ultimate controlling party. This was a joint venture between the Apax Europe VII Fund, which is advised by Apax Partners LLP, incorporated in England and Wales, and Guardian Media Group plc, incorporated in England and Wales. All the ordinary shares of Guardian Media Group plc were owned by The Scott Trust Limited. The Directors regarded Eden 2 & Cie S.C.A. as the ultimate controlling party.
Hazel Acquisition 1 Limited was established in the Cayman Islands, and Eden 2 & Cie S.C.A. was established in Luxembourg. No Group accounts have been prepared for these companies or for any other intermediate holding company.

72 ASCENTIAL HOLDINGS LIMITED – FINANCIAL STATEMENTS 2015

ASCENTIAL PLC — A REPORT OF THE YEAR 2015
Ascential is an international business to business media company with a focused portfolio of essential, market-leading products that connect and inform business professionals in more than 150 countries.
We employ more than 1,500 people and our Group’s headquarters are in London. We have offices in 14 countries, and our main operational locations are in the UK, US and UAE.
We serve customers in 150 countries through market-leading Exhibitions, Festivals and Information Services. 23 of Ascential’s 32 product lines are number one in their respective markets.
Our products are organised under two reportable segments based on operational expertise: Exhibitions & Festivals and Information Services.
In the Exhibitions & Festivals segment, we organise large scale exhibitions, congresses and festivals where customers come together to form business relationships and transact. Key products in this segment are Cannes Lions, Spring and Autumn Fair and Money20/20.
In Information Services, we provide high quality, industry-specific business intelligence, and forecasting via digital subscription products. In some product lines, customers can also purchase print subscriptions, attend conferences and award ceremonies, and promote their services. Key products in this segment are WGSN and Groundsure.
WELCOME
Strategic report01 Highlights02 Company overview03 Top five products04 History05 Key strengths06 Chairman’s statement10 Chief Executive’s review12 Strategy summary14 Financial review20 Risk management24 Segmental review Exhibitions & Festivals Information Services30 People review31 Sustainability
Governance34 Board of Directors
Financial statements37 Statement of Directors’ responsibilities38 Report of KPMG LLP to the Directors of
Ascential Holdings Limited39 Consolidated profit and loss statement
and other comprehensive income40 Consolidated statement of
financial position41 Consolidated statement of changes
in equity42 Consolidated statement of cash flows43 Notes to the non-statutory
financial statements

Ascential plcThe Prow1 Wilder WalkLondon W1B 5APascential.com
ASC
EN
TIA
L PLC
— A
RE
PO
RT
OF
TH
E Y
EA
R 2
01
5
ASCENTIAL PLCA REPORT OF THE YEAR 2015