Ascend Aircraft Investment Index -...
20
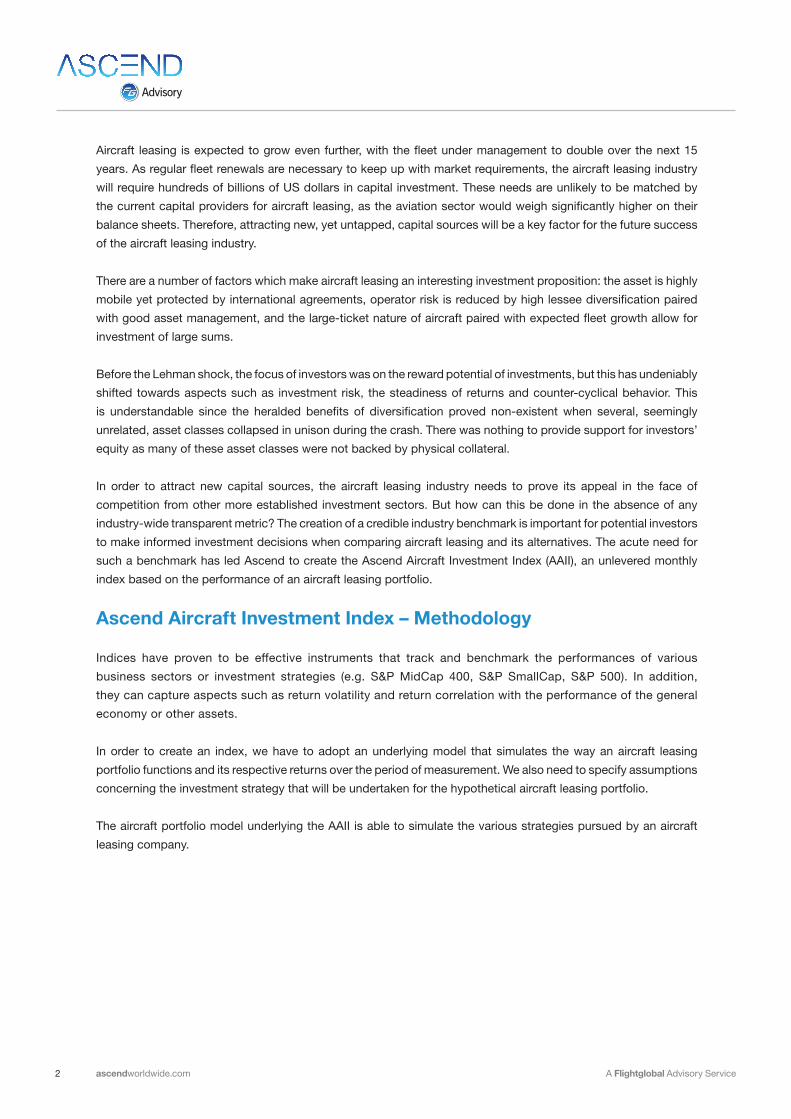
1 A Flightglobal Advisory Service ascendworldwide.com Ascend Aircraft Investment Index Summary In this paper, we will elaborate on the future capital needs of the aircraft leasing industry and the challenges faced in raising this capital in the presence of competition from other asset classes. We have established the Ascend Aircraft Investment Index (AAII) as a dedicated solution to benchmark the rewards and risks of aircraft leasing against those of other industries. The AAII will demonstrate achievable annual core returns of 6.2% for the 1991-2012 period, when paired with a return volatility of 5.7%. We will also discuss the low correlation between returns from aircraft leasing and the general economy or the performance of other indices, and its causes. The performance results of various aircraft types included in the AAII will be shown in a dedicated section, followed by a presentation of the assumptions underlying the AAII. While our analysis of past data is important to providing insight to this industry, this paper does not intend to forecast or extrapolate the future performance of aircraft leasing. Benchmarking the performance of Aircraft Leasing Portfolios A defining trend in commercial aviation has been the rise of aircraft leasing. Whereas only 2% of the global fleet in service was managed by operating lessors in 1981, this share has increased to nearly 40% today. In absolute numbers, the growth of aircraft leasing has been even more impressive as the total lessor-managed fleet has soared from less than 150 aircraft in 1981 to well over 9,000 in 2013 – a 60-fold increase. Benchmarking Historical Performance of Aircraft Leasing Chart 1: The Growth of Operating Leasing
-
Upload
phungquynh -
Category
Documents
-
view
352 -
download
5
Transcript of Ascend Aircraft Investment Index -...
1A Flightglobal Advisory Service ascendworldwide.com
Ascend Aircraft Investment Index
Summary
In this paper, we will elaborate on the future capital needs of the aircraft leasing industry and the challenges
faced in raising this capital in the presence of competition from other asset classes. We have established the
Ascend Aircraft Investment Index (AAII) as a dedicated solution to benchmark the rewards and risks of aircraft
leasing against those of other industries. The AAII will demonstrate achievable annual core returns of 6.2% for the
1991-2012 period, when paired with a return volatility of 5.7%. We will also discuss the low correlation between
returns from aircraft leasing and the general economy or the performance of other indices, and its causes. The
performance results of various aircraft types included in the AAII will be shown in a dedicated section, followed by
a presentation of the assumptions underlying the AAII.
While our analysis of past data is important to providing insight to this industry, this paper does not intend to
forecast or extrapolate the future performance of aircraft leasing.
Benchmarking the performance of Aircraft Leasing Portfolios
A defining trend in commercial aviation has been the rise of aircraft leasing. Whereas only 2% of the global fleet
in service was managed by operating lessors in 1981, this share has increased to nearly 40% today. In absolute
numbers, the growth of aircraft leasing has been even more impressive as the total lessor-managed fleet has
soared from less than 150 aircraft in 1981 to well over 9,000 in 2013 – a 60-fold increase.
Benchmarking Historical Performance of Aircraft Leasing
Chart 1: The Growth of Operating Leasing
2 ascendworldwide.com A Flightglobal Advisory Service
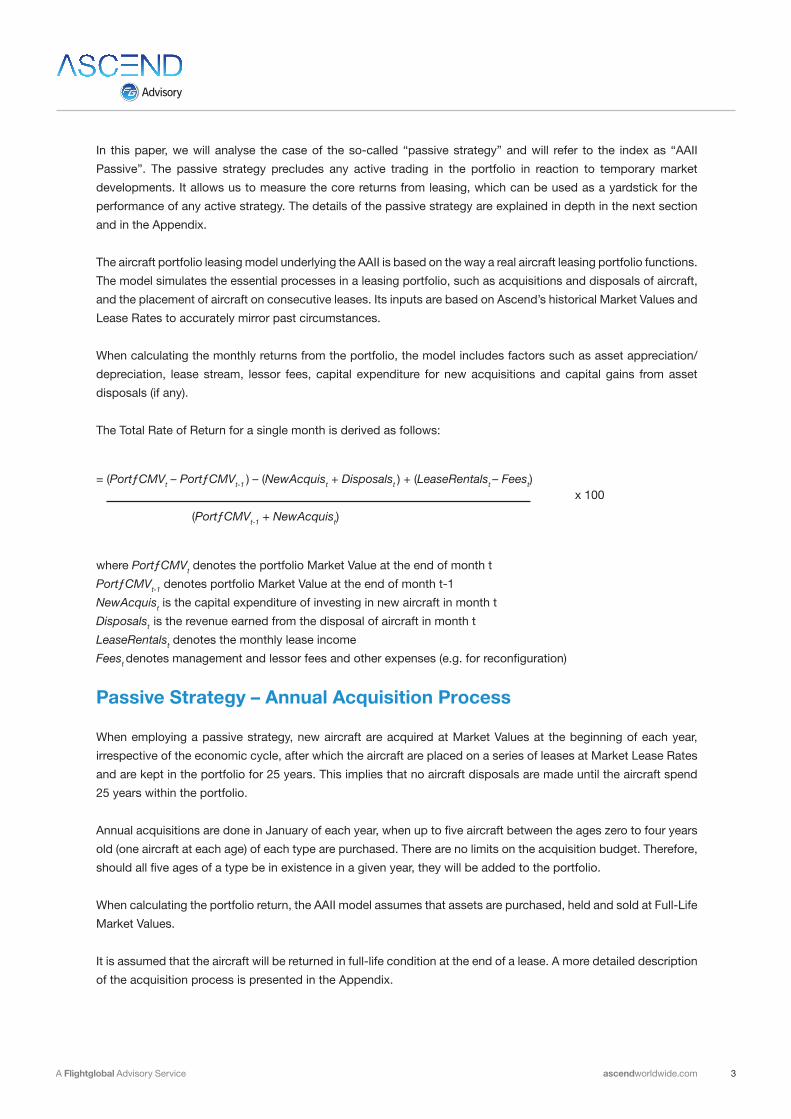
Aircraft leasing is expected to grow even further, with the fleet under management to double over the next 15
years. As regular fleet renewals are necessary to keep up with market requirements, the aircraft leasing industry
will require hundreds of billions of US dollars in capital investment. These needs are unlikely to be matched by
the current capital providers for aircraft leasing, as the aviation sector would weigh significantly higher on their
balance sheets. Therefore, attracting new, yet untapped, capital sources will be a key factor for the future success
of the aircraft leasing industry.
There are a number of factors which make aircraft leasing an interesting investment proposition: the asset is highly
mobile yet protected by international agreements, operator risk is reduced by high lessee diversification paired
with good asset management, and the large-ticket nature of aircraft paired with expected fleet growth allow for
investment of large sums.
Before the Lehman shock, the focus of investors was on the reward potential of investments, but this has undeniably
shifted towards aspects such as investment risk, the steadiness of returns and counter-cyclical behavior. This
is understandable since the heralded benefits of diversification proved non-existent when several, seemingly
unrelated, asset classes collapsed in unison during the crash. There was nothing to provide support for investors’
equity as many of these asset classes were not backed by physical collateral.
In order to attract new capital sources, the aircraft leasing industry needs to prove its appeal in the face of
competition from other more established investment sectors. But how can this be done in the absence of any
industry-wide transparent metric? The creation of a credible industry benchmark is important for potential investors
to make informed investment decisions when comparing aircraft leasing and its alternatives. The acute need for
such a benchmark has led Ascend to create the Ascend Aircraft Investment Index (AAII), an unlevered monthly
index based on the performance of an aircraft leasing portfolio.
Ascend Aircraft Investment Index – Methodology
Indices have proven to be effective instruments that track and benchmark the performances of various
business sectors or investment strategies (e.g. S&P MidCap 400, S&P SmallCap, S&P 500). In addition,
they can capture aspects such as return volatility and return correlation with the performance of the general
economy or other assets.
In order to create an index, we have to adopt an underlying model that simulates the way an aircraft leasing
portfolio functions and its respective returns over the period of measurement. We also need to specify assumptions
concerning the investment strategy that will be undertaken for the hypothetical aircraft leasing portfolio.
The aircraft portfolio model underlying the AAII is able to simulate the various strategies pursued by an aircraft
leasing company.
3A Flightglobal Advisory Service ascendworldwide.com
In this paper, we will analyse the case of the so-called “passive strategy” and will refer to the index as “AAII
Passive”. The passive strategy precludes any active trading in the portfolio in reaction to temporary market
developments. It allows us to measure the core returns from leasing, which can be used as a yardstick for the
performance of any active strategy. The details of the passive strategy are explained in depth in the next section
and in the Appendix.
The aircraft portfolio leasing model underlying the AAII is based on the way a real aircraft leasing portfolio functions.
The model simulates the essential processes in a leasing portfolio, such as acquisitions and disposals of aircraft,
and the placement of aircraft on consecutive leases. Its inputs are based on Ascend’s historical Market Values and
Lease Rates to accurately mirror past circumstances.
When calculating the monthly returns from the portfolio, the model includes factors such as asset appreciation/
depreciation, lease stream, lessor fees, capital expenditure for new acquisitions and capital gains from asset
disposals (if any).
The Total Rate of Return for a single month is derived as follows:
= (PortƒCMVt – PortƒCMVt-1 ) – (NewAcquist + Disposalst ) + (LeaseRentalst – Feest) x 100
(PortƒCMVt-1 + NewAcquist)
where PortƒCMVt denotes the portfolio Market Value at the end of month t
PortƒCMVt-1 denotes portfolio Market Value at the end of month t-1
NewAcquist is the capital expenditure of investing in new aircraft in month t
Disposalst is the revenue earned from the disposal of aircraft in month t
LeaseRentalst denotes the monthly lease income
Feest denotes management and lessor fees and other expenses (e.g. for reconfiguration)
Passive Strategy – Annual Acquisition Process
When employing a passive strategy, new aircraft are acquired at Market Values at the beginning of each year,
irrespective of the economic cycle, after which the aircraft are placed on a series of leases at Market Lease Rates
and are kept in the portfolio for 25 years. This implies that no aircraft disposals are made until the aircraft spend
25 years within the portfolio.
Annual acquisitions are done in January of each year, when up to five aircraft between the ages zero to four years
old (one aircraft at each age) of each type are purchased. There are no limits on the acquisition budget. Therefore,
should all five ages of a type be in existence in a given year, they will be added to the portfolio.
When calculating the portfolio return, the AAII model assumes that assets are purchased, held and sold at Full-Life
Market Values.
It is assumed that the aircraft will be returned in full-life condition at the end of a lease. A more detailed description
of the acquisition process is presented in the Appendix.

4 worldwide.com A Flightglobal Advisory Service
Passive Strategy – Lease Placement Cycle and Associated Costs
When an aircraft is acquired, it is leased at the historical Market Lease Rate for that aircraft type and vintage. The
calculated lease rate is the actual rent recorded for this aircraft in the market when purchased and will only change
when a new lease occurs after the initial term.
To reflect the leasing market, the lease term is defined as 10 years for twin-aisle aircraft and seven years for
single-aisle aircraft in the index, while all subsequent leases are defined as five years, regardless of the aircraft
classification. Each aircraft is assumed to operate for 25 years, after which it will be sold at its Market Value at
that point in time.
The associated costs of transitioning aircraft between operators are included in this index and detailed in the
Appendix.
The contribution of each aircraft to the portfolio’s performance is determined by the acquisition process (which
determines the number of each type’s aircraft in the portfolio), the aircraft’s Market Value and Market Lease Rates.
It is not weighted by the historical composition of the general aircraft leasing market, although it can be simulated
by the model.
Comparative performance of AAII
Using the passive strategy, the AAII index shows the following returns:
Table 1: AAII Results
Chart 2: Ascend Aircraft Investment Index (1991-2012)
Period ReturnStandard deviation
1991-2000 7.1% 2.4%
2000-2013 5.4% 7.5%
1991-2013 6.2% 5.7%

5A Flightglobal Advisory Service ascendworldwide.com
The chart below shows the performance of AAII Passive (black curve), as well as general stock indices (S&P 500,
MSCI World Index) and sector indices (S&P 500 Airlines Index, Dow Jones Transportation Index, S&P Railroads
Index, S&P Global Property Index).
The remarkably smooth shape of the AAII Passive curve contrasts with the more volatile lines for the other
benchmarks. The dips in the AAII Passive curve after the recessions of 2001 and 2008 are small compared with
the steep falls for other indices, while the growth for the rest of the period is noticeably stable and devoid of any
sudden rises. This suggests a low volatility of returns provided by the underlying aircraft leasing portfolio. Where
does such low volatility stem from?
The inherent characteristic of a properly structured aircraft leasing portfolio is the stacked re-lease process, where
only a certain portion of aircraft require new lessees each year. This is modeled by the AAII underlying portfolio,
where around 15-18% of a narrowbody fleet is re-leased in each year as a result of the continuous acquisition
process and a five to seven year lease term (depending on whether it is a first or a later lease).
As a longer first lease term is assumed for widebodies (10 years for the first lease, five years for subsequent
lease-terms), this ratio will be even lower for widebody assets. Since lease rates are typically agreed upon at
the beginning of the lease and continue until their expiration, one of the main components of the profitability
Chart 3: Ascend Aircraft Investment Index – Comparative Performance Benchmark

6 worldwide.com A Flightglobal Advisory Service
equation is insulated from market conditions for 85-90% of the portfolio fleet. Although lease rates are sometimes
renegotiated, mainly if a lessee runs into significant financial troubles, this is not the norm.
Good returns, paired with low volatility, promise a favourable profit-to-risk return. Low volatility also implies that
the returns from the portfolio are largely independent of cyclical movements. The fact that the AAII curve has
a visibly different shape from other curves, which largely have a similar profile, suggests that the AAII has a
low correlation with other indices. This would be a highly desired characteristic that allows for genuine portfolio
diversification and insulation of returns from temporary market swings. It is important to note that this does not
appear to be as achievable with other indices, since they all move in the same direction and closely track the
general economy to a high degree.
A comparison with alternative investment benchmarks, such as shipping or precious metal indices, tells a similar
story. The AAII has had the steadiest growth path and clearly outperformed the shipping indices. Although it was
outpaced by the precious metal indices in 2010, this could be a transitory development as investors rallied to
gold and silver in the wake of the global financial crisis and European sovereign debt crisis. While the AAII has
continued to increase, the precious metal indices have remained stagnant since mid-2011.
A popular finance approach used to compare investments in different assets is the Sharpe ratio. The Sharpe ratio
is calculated as the asset class return, less US Treasuries, divided by the asset class standard deviation.
The passive strategy shows that investment in commercial aircraft offers an attractive risk- adjusted return as
compared with other investment classes. The unleveraged return of 6.2% over the 21-year period compares
favorably to returns offered by the S&P 500 (6.9%) and MSCI World Index (5%), whose volatility is almost four
Chart 4: Ascend Aircraft Investment Index vs. Alternative Investments
7A Flightglobal Advisory Service ascendworldwide.com
times that of the AAII. On a Sharpe ratio basis, the AAII outperforms both of these equity indices, suggesting that
investment in this alternative asset class has historically offered superior results.
The debate on whether to have exposure to the underlying asset or the credit of the airline becomes inherently
clear from analysing the performance of these indices. In banking, the credit process tends to have a greater focus
on the credit quality of the borrower than the asset being financed. However, within the aviation industry, many
would argue that the greater focus should be on the asset as investing in the most liquid of aircraft types should
ensure strong demand and strong lease cashflows, and is a less risky proposition than investing in the airline itself.
Investing in airline stock through the S&P 500 Airlines Index shows returns of -1% and a standard deviation of
29%, which is six times greater volatility than investing in commercial aircraft on lease. The respective Sharpe
ratios for the AAII and S&P 500 Airlines of 0.30 and -0.19 provide conclusive evidence that investing in aircraft is
more attractive than investing in airline stocks.
Investing in an AAII Passive approach has consistently generated stable risk-adjusted returns compared with
other alternative assets, which have experienced more volatility through the economic cycles.
Real estate investments have some similarities to aircraft leasing and, because of their popularity, are commonly
used as a benchmark for other investment classes. For these reasons, the NCREIF Property index is used in
comparison with the AAII and over the same period, is shown to offer returns of 7.7%, with a standard deviation
of 9.5%. On an overall Sharpe ratio basis, this property index offers slightly better risk-adjusted returns than the
AAII Passive strategy, but the higher lease rates offered with aircraft investment allow for quicker payback coupled
with limited downside risk.
When the Sharpe ratio is used to compare the performance of the AAII with other alternative investments, it
implies that a higher risk-adjusted return is achieved from investing in aircraft as opposed to gold, precious metals
or shipping. Although the returns for both gold and precious metals are higher than aircraft, their volatility is also
more than double that of the AAII.
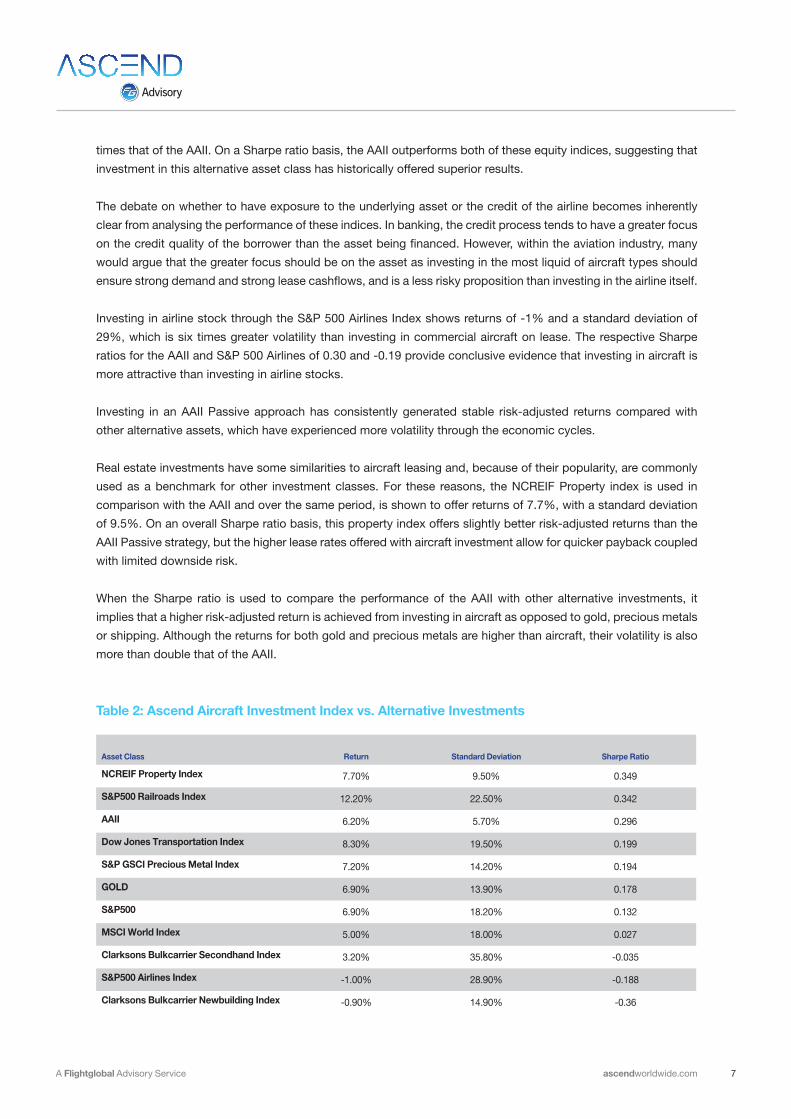
Asset Class Return Standard Deviation Sharpe Ratio
NCREIF Property Index 7.70% 9.50% 0.349
S&P500 Railroads Index 12.20% 22.50% 0.342
AAII 6.20% 5.70% 0.296
Dow Jones Transportation Index 8.30% 19.50% 0.199
S&P GSCI Precious Metal Index 7.20% 14.20% 0.194
GOLD 6.90% 13.90% 0.178
S&P500 6.90% 18.20% 0.132
MSCI World Index 5.00% 18.00% 0.027
Clarksons Bulkcarrier Secondhand Index 3.20% 35.80% -0.035
S&P500 Airlines Index -1.00% 28.90% -0.188
Clarksons Bulkcarrier Newbuilding Index -0.90% 14.90% -0.36
Table 2: Ascend Aircraft Investment Index vs. Alternative Investments
8 worldwide.com A Flightglobal Advisory Service
Comparative performance of type-specific indices
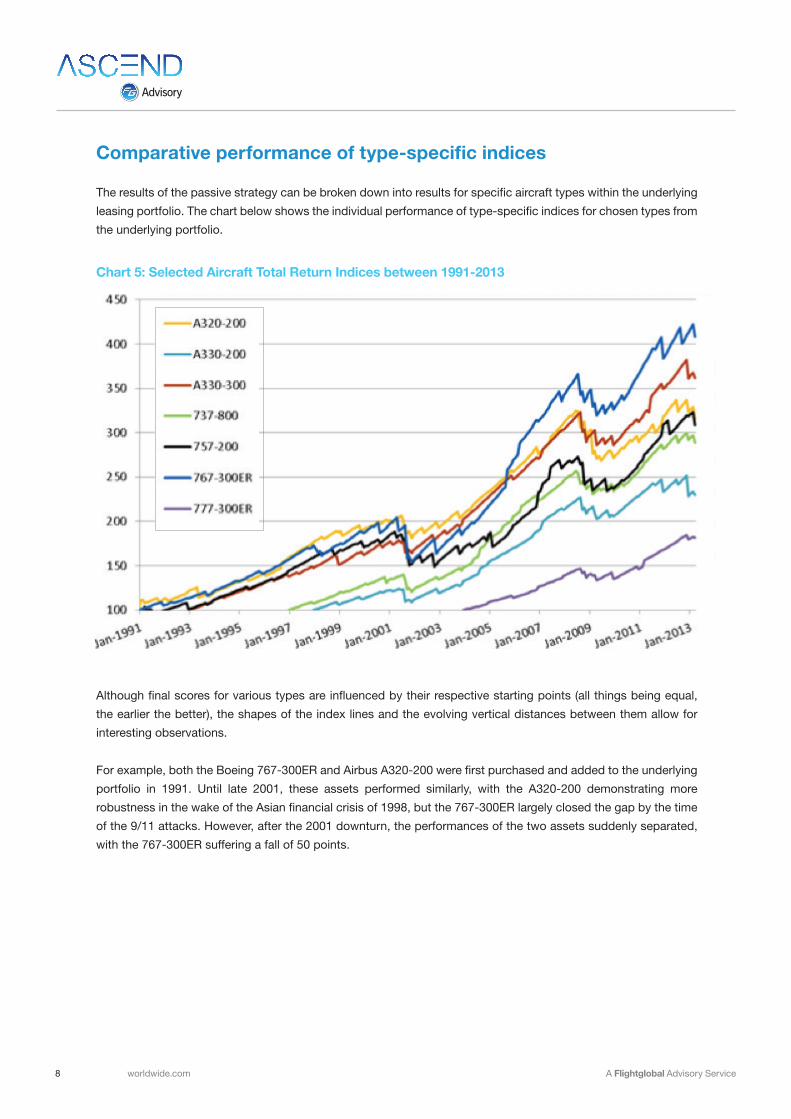
The results of the passive strategy can be broken down into results for specific aircraft types within the underlying
leasing portfolio. The chart below shows the individual performance of type-specific indices for chosen types from
the underlying portfolio.
Although final scores for various types are influenced by their respective starting points (all things being equal,
the earlier the better), the shapes of the index lines and the evolving vertical distances between them allow for
interesting observations.
For example, both the Boeing 767-300ER and Airbus A320-200 were first purchased and added to the underlying
portfolio in 1991. Until late 2001, these assets performed similarly, with the A320-200 demonstrating more
robustness in the wake of the Asian financial crisis of 1998, but the 767-300ER largely closed the gap by the time
of the 9/11 attacks. However, after the 2001 downturn, the performances of the two assets suddenly separated,
with the 767-300ER suffering a fall of 50 points.
Chart 5: Selected Aircraft Total Return Indices between 1991-2013
9A Flightglobal Advisory Service ascendworldwide.com
This fall was due to greater volatility in the 767-300ER’s Market Values, which fell by 20-25% during Q3 2001.
The value loss for the A320-200 was much more moderate and in the region of 10%. As the market started to
recover around 2003, so did the values of the 767-300ER. And with the extra lift from the Boeing 787 delays, the
depreciation of the 767-300ER values was effectively arrested for the next five years, until late 2008.
During that time, the 767-300ER index caught up again and in 2005, overtook that of the A320-200. Despite this
dynamic convergence and recent robust performance, the presence of steep value falls suggests that the 767-
300ER has been a volatile asset.
On the other hand, the Airbus A330-300 index, which started two years later than the A320-200 and the 767-
300ER indices, converges with them by 2004. Although its current level is still below the level of the 767-300ER
index (but above the A320-200 curve), its line displays the smoothest profile of the three. This suggests that the
A330-300 returns had the lowest volatility, and possibly outperformed the 767-300ER and the A320-200 indices
in terms of risk-adjusted returns.
By benchmarking the Boeing 737-800 and Boeing 757-200 returns, we are provided some interesting insights.
The 757-200 index started in 1991, while the 737-800 began in 1997 when the 757-200 index already had risen to
166 points. However, after seven years the difference between the two disappeared, indicating that performance
of the 757-200 in the period of 2001-2005 has been weak, and the 737-800 has proven to be a stellar investment.
Since 2005, these two indices have moved in tandem. The recession following 9/11 has shifted the 757-
200 values to such a point that when combined with a more robust lease rate, it was able to offer attractive
profitability from 2005.
This demonstrates that aircraft assets can have periods of poor performance followed by strong returns
once different components (Market Values or Market Lease Rates) of the lease return formula move to
appropriate levels.

10 worldwide.com A Flightglobal Advisory Service
Charting the results in a scatter chart will allow us to remove the bias introduced by the differing starting points of
the indices and to get a better understanding of return-to-risk profiles. The graph below shows the returns (Y axis)
and volatility (standard deviation of returns on X axis).
In the chart above, we can see the clear winners and losers of the 1991-2012 period. The 737-800 has been the
best performing asset in terms of profitability and has had medium volatility. The A330-300 and the 777-300ER
have scored well on returns and even better in terms of volatility. The 767-300ER provides a mixed picture, with
returns comparable to that of the A330-300 but with double the volatility.
One of those apparent losers is the A320-200, with below-average returns and average volatility. The 757-200
has scored even worse with lower average returns and higher volatility than the A320-200. However, if we only
consider the 2005-2012 period, the 757-200 would have been one of the winners in terms of profitability, with an
average return of 7% (although coupled with an elevated volatility of 9.3%).
Chart 6: Historical Returns / Standard Deviation for Selected Types, 1991-2012
11A Flightglobal Advisory Service ascendworldwide.com
A complete table with the returns and risk profiles for all types included in the underlying portfolio can be found
in the Appendix.
Market volatility driving stronger correlations between asset classes
When selecting asset classes to invest in, investors are not only concerned with expected return and risk but
must also look at the correlation between their investments. Correlation is a statistical measure which indicates
the degree to which the prices of two assets move together. Correlation between two assets is 1.0 when the two
assets move completely in tandem. It is -1.0 if the price of asset A always goes up when the price of asset B goes
down. Correlation is 0 if the two assets move completely independently of each another.
Holding assets that have no correlation or low positive or negative correlation can offer investors some protection
against downside. The importance of correlation has intensified since the 2008 downturn, where increased market
volatility has increased the correlation between asset classes. The focus on holding a diversified portfolio means
that investors are now seeking out new opportunities that offer stable and uncorrelated returns.
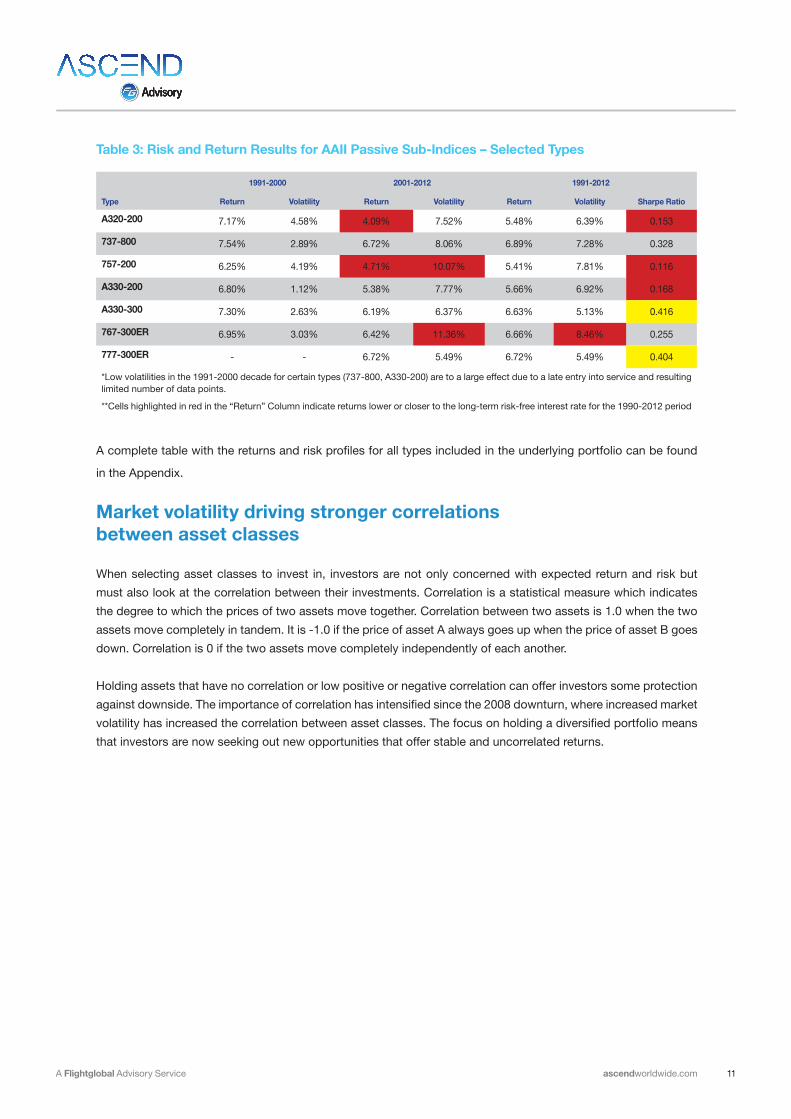
Table 3: Risk and Return Results for AAII Passive Sub-Indices – Selected Types
1991-2000 2001-2012 1991-2012
Type Return Volatility Return Volatility Return Volatility Sharpe Ratio
A320-200 7.17% 4.58% 4.09% 7.52% 5.48% 6.39% 0.153
737-800 7.54% 2.89% 6.72% 8.06% 6.89% 7.28% 0.328
757-200 6.25% 4.19% 4.71% 10.07% 5.41% 7.81% 0.116
A330-200 6.80% 1.12% 5.38% 7.77% 5.66% 6.92% 0.168
A330-300 7.30% 2.63% 6.19% 6.37% 6.63% 5.13% 0.416
767-300ER 6.95% 3.03% 6.42% 11.36% 6.66% 8.46% 0.255
777-300ER - - 6.72% 5.49% 6.72% 5.49% 0.404
*Low volatilities in the 1991-2000 decade for certain types (737-800, A330-200) are to a large effect due to a late entry into service and resulting limited number of data points.
**Cells highlighted in red in the “Return” Column indicate returns lower or closer to the long-term risk-free interest rate for the 1990-2012 period

12 worldwide.com A Flightglobal Advisory Service
To this end, the AAII Passive strategy satisfies these requirements as it has low positive/negative correlation with
all asset classes listed in the tables below. The correlation ranges are broken into four groupings;
1. Red represents high correlation less than or equal to -70% and greater than or equal to 70%
2. Yellow represents medium correlation less than or equal to -50% and greater than or equal to 50%
3. Green represents low correlation less than or equal to -15% and greater than or equal to 15%
4. White represents no correlation
To protect against the downside, investing in a combination of assets that fall between the ranges identified in 2-4
above are best. The tables below show the correlations between asset classes for the periods of 1991-2000 and
2001-2012.
During the 1991-2000 period there was low correlation between the AAII Passive index and all other asset classes.
Table 4: Correlation from 1991 to 2000
Type
Ascend Aircraft Investment Index
S&P 500
MSCI World Index
Dow Jones Transportation Index
S&P 500 Railroads Sub Industry Index
S&P 500 Airlines Index
S&P Global Property Index
Baltic Dry Index Gold
S&P GSCI Precious Metal Index
NCREIF Property Index
Clarkson - Bulkcarrier Newbuilding Price
Ascend Aircraft Investment Index
1 -13% -18% 3% 48% 9% 12% 15% -20% -6% -5% 20%
S&P 500 -13% 1 77% 63% -7% 36% 6% -47% -26% -33% 25% 2%
MSCI World Index
-18% 77% 1 31% -4% -2% -10% -19% 27% 22% 20% 6%
Dow Jones Transportation Index
3% 63% 31% 1 -2% 69% 25% -55% -30% -32% -26% 54%
S&P 500 Railroads Sub Industry Index
48% -7% -4% -2% 1 -46% -9% -15% -5% -5% -47% -31%
S&P 500 Airlines Index
9% 36% -2% 69% -46% 1 29% -39% -49% -40% 29% 49%
S&P Global Property Index
12% 6% -10% 25% -9% 29% 1 -14% 19% 17% -13% 48%
Baltic Dry Index
15% -47% -19% -55% -15% -39% -14% 1 6% 10% -1% 24%
Gold -20% -26% 27% -30% -5% -49% 19% 6% 1 96% -27% 8%
S&P GSCI Precious Metal Index
-6% -33% 22% -32% -5% -40% 17% 10% 96% 1 -22% 12%
NCREIF Property Index
-5% 25% 20% -26% -47% 29% -13% -1% -27% -22% 1 -30%
Clarkson - Bulkcarrier Newbuilding Price Index
20% 2% 6% 54% -31% 49% 48% 24% 8% 12% -30% 1

13A Flightglobal Advisory Service ascendworldwide.com
Table 5: Correlation from 2001 to 2012
The increased volatility in the markets following 9/11 and the liquidity crisis in 2008 have resulted in stronger
correlation between different asset classes in the 2001-2012 cycle. While the relationship between the AAII
Passive index and other assets remains in the medium-to-low range, there has been an increase in its correlation
with other assets. However, from assessing both periods, it is evident that by adding the AAII Passive Index to a
portfolio of equities, property or other alternative assets, it would reduce the overall volatility of a total portfolio
investment, and provide higher returns and lower risk.
Type
Ascend Aircraft Investment Index
S&P 500
MSCI World Index
Dow Jones Transportation Index
S&P 500 Railroads Sub Industry Index
S&P 500 Airlines Index
S&P Global Property Index
Baltic Dry Index Gold
S&P GSCI Precious Metal Index
NCREIF Property Index
Clarkson - Bulkcarrier Newbuilding Price
Ascend Aircraft Investment Index
1 40% 45% 52% 29% 13% 34% -1% 38% 42% 64% 69%
S&P 500 40% 1 98% 90% -26% 80% 88% 58% 43% 53% 1% 26%
MSCI World Index
45% 98% 1 90% -33% 80% 90% 63% 48% 57% 0% 33%
Dow Jones Transportation Index
52% 90% 90% 1 -24% 80% 84% 35% 31% 45% 8% 40%
S&P 500 Railroads Sub Industry Index
29% -26% -33% -24% 1 -48% -25% -70% -16% -13% 70% 7%
S&P 500 Airlines Index
13% 80% 80% 80% -48% 1 72% 52% 41% 54% -40% -3%
S&P Global Property Index
34% 88% 90% 84% -25% 72% 1 58% 34% 46% -3% 28%
Baltic Dry Index
-1% 58% 63% 35% -70% 52% 58% 1 53% 50% -53% -4%
Gold 38% 43% 48% 31% -16% 41% 34% 53% 1 98% 2% 18%
S&P GSCI Precious Metal Index
42% 53% 57% 45% -13% 54% 46% 50% 98% 1 3% 19%
NCREIF Property Index
64% 1% 0% 8% 70% -40% -3% -53% 2% 3% 1 63%
Clarkson - Bulkcarrier Newbuilding Price Index
69% 26% 33% 40% 7% -3% 28% -4% 18% 19% 63% 1
Appendix
Annual Acquisition Process
The annual acquisition is limited to aircraft in the early life cycle stage (zero to four years) and are conducted for
the most popular aircraft types held by the leasing community over the past 20 years. These aircraft cover the four
categories of narrowbodies, widebodies, regional jets (RJs) and turboprops.
14 worldwide.com A Flightglobal Advisory Service
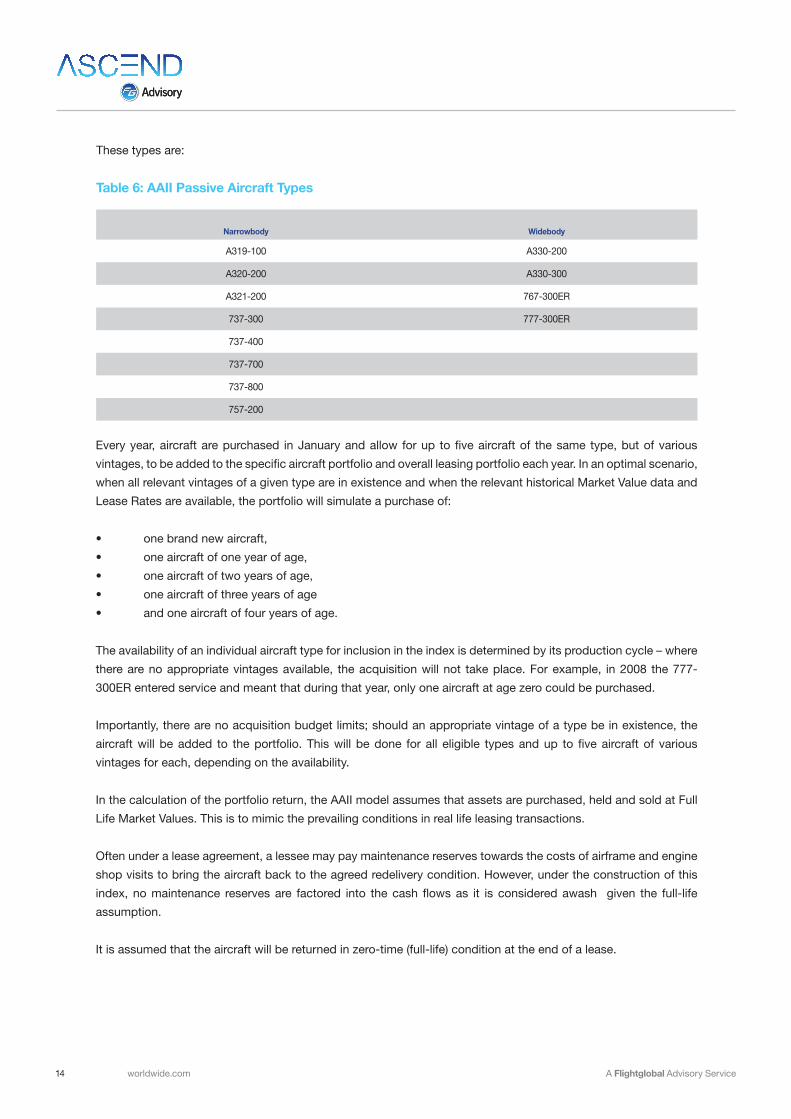
These types are:
Table 6: AAII Passive Aircraft Types
Narrowbody Widebody
A319-100 A330-200
A320-200 A330-300
A321-200 767-300ER
737-300 777-300ER
737-400
737-700
737-800
757-200
Every year, aircraft are purchased in January and allow for up to five aircraft of the same type, but of various
vintages, to be added to the specific aircraft portfolio and overall leasing portfolio each year. In an optimal scenario,
when all relevant vintages of a given type are in existence and when the relevant historical Market Value data and
Lease Rates are available, the portfolio will simulate a purchase of:
• one brand new aircraft,
• one aircraft of one year of age,
• one aircraft of two years of age,
• one aircraft of three years of age
• and one aircraft of four years of age.
The availability of an individual aircraft type for inclusion in the index is determined by its production cycle – where
there are no appropriate vintages available, the acquisition will not take place. For example, in 2008 the 777-
300ER entered service and meant that during that year, only one aircraft at age zero could be purchased.
Importantly, there are no acquisition budget limits; should an appropriate vintage of a type be in existence, the
aircraft will be added to the portfolio. This will be done for all eligible types and up to five aircraft of various
vintages for each, depending on the availability.
In the calculation of the portfolio return, the AAII model assumes that assets are purchased, held and sold at Full
Life Market Values. This is to mimic the prevailing conditions in real life leasing transactions.
Often under a lease agreement, a lessee may pay maintenance reserves towards the costs of airframe and engine
shop visits to bring the aircraft back to the agreed redelivery condition. However, under the construction of this
index, no maintenance reserves are factored into the cash flows as it is considered awash given the full-life
assumption.
It is assumed that the aircraft will be returned in zero-time (full-life) condition at the end of a lease.
15A Flightglobal Advisory Service ascendworldwide.com
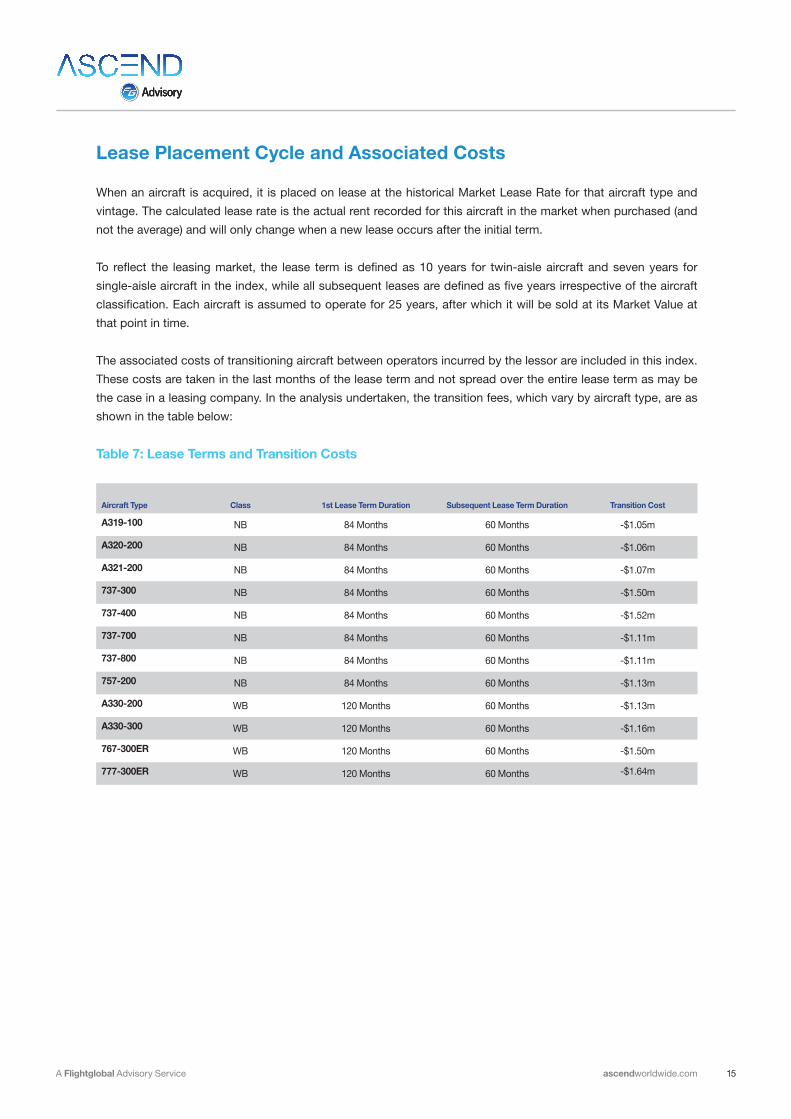
Lease Placement Cycle and Associated Costs
When an aircraft is acquired, it is placed on lease at the historical Market Lease Rate for that aircraft type and
vintage. The calculated lease rate is the actual rent recorded for this aircraft in the market when purchased (and
not the average) and will only change when a new lease occurs after the initial term.
To reflect the leasing market, the lease term is defined as 10 years for twin-aisle aircraft and seven years for
single-aisle aircraft in the index, while all subsequent leases are defined as five years irrespective of the aircraft
classification. Each aircraft is assumed to operate for 25 years, after which it will be sold at its Market Value at
that point in time.
The associated costs of transitioning aircraft between operators incurred by the lessor are included in this index.
These costs are taken in the last months of the lease term and not spread over the entire lease term as may be
the case in a leasing company. In the analysis undertaken, the transition fees, which vary by aircraft type, are as
shown in the table below:
Table 7: Lease Terms and Transition Costs
Aircraft Type Class 1st Lease Term Duration Subsequent Lease Term Duration Transition Cost
A319-100 NB 84 Months 60 Months -$1.05m
A320-200 NB 84 Months 60 Months -$1.06m
A321-200 NB 84 Months 60 Months -$1.07m
737-300 NB 84 Months 60 Months -$1.50m
737-400 NB 84 Months 60 Months -$1.52m
737-700 NB 84 Months 60 Months -$1.11m
737-800 NB 84 Months 60 Months -$1.11m
757-200 NB 84 Months 60 Months -$1.13m
A330-200 WB 120 Months 60 Months -$1.13m
A330-300 WB 120 Months 60 Months -$1.16m
767-300ER WB 120 Months 60 Months -$1.50m
777-300ER WB 120 Months 60 Months -$1.64m

16 worldwide.com A Flightglobal Advisory Service
As a result of the nature of leasing, the risk of downtime between leases is factored in by applying an adjustment
multiplier to the lease stream during the lease term. For example a 1% discount (multiplier of 0.99) for a 60-month
lease term is equivalent to 0.6 months of lease stream. Storage costs are accounted for in the transition costs in
the table above.
In developing this passive strategy, a management fee of 3% of lease rates was taken into account, to be charged
on monthly lease revenue.
AAII Result Tables and Charts
The graph below shows the returns and volatilities of each aircraft type and their development over the periods of
1991-2000 and 2001-2012. For each of the selected types, these two periods are represented individually by the
smaller symbols (with labels), while the combined 1991-2012 period is represented by a larger symbol (no label)
between the two. As shown, there has been a noticeable dip in performance during the second period for each
aircraft type.
Table 8: Downtime and Market Lease Rates Adjustment Factors
Aircraft Type1st Lease Term MLR Adjustment factor
2nd Lease Term MLR Adjustment factor
3rd Lease Term MLR Adjustment factor
4th Lease Term MLR Adjustment factor
A319-100 1.00 0.985 0.965 0.965
A320-200 1.00 0.985 0.965 0.965
A321-200 1.00 0.985 0.965 0.965
737-300 1.00 0.985 0.965 0.965
737-400 1.00 0.985 0.965 0.965
737-700 1.00 0.985 0.965 0.965
737-800 1.00 0.985 0.965 0.965
757-200 1.00 0.985 0.965 0.965
A330-200 1.00 0.985 0.965 0.965
A330-300 1.00 0.985 0.965 0.965
767-300ER 1.00 0.985 0.965 0.965
777-300ER 1.00 0.985 0.965 0.965
17A Flightglobal Advisory Service ascendworldwide.com
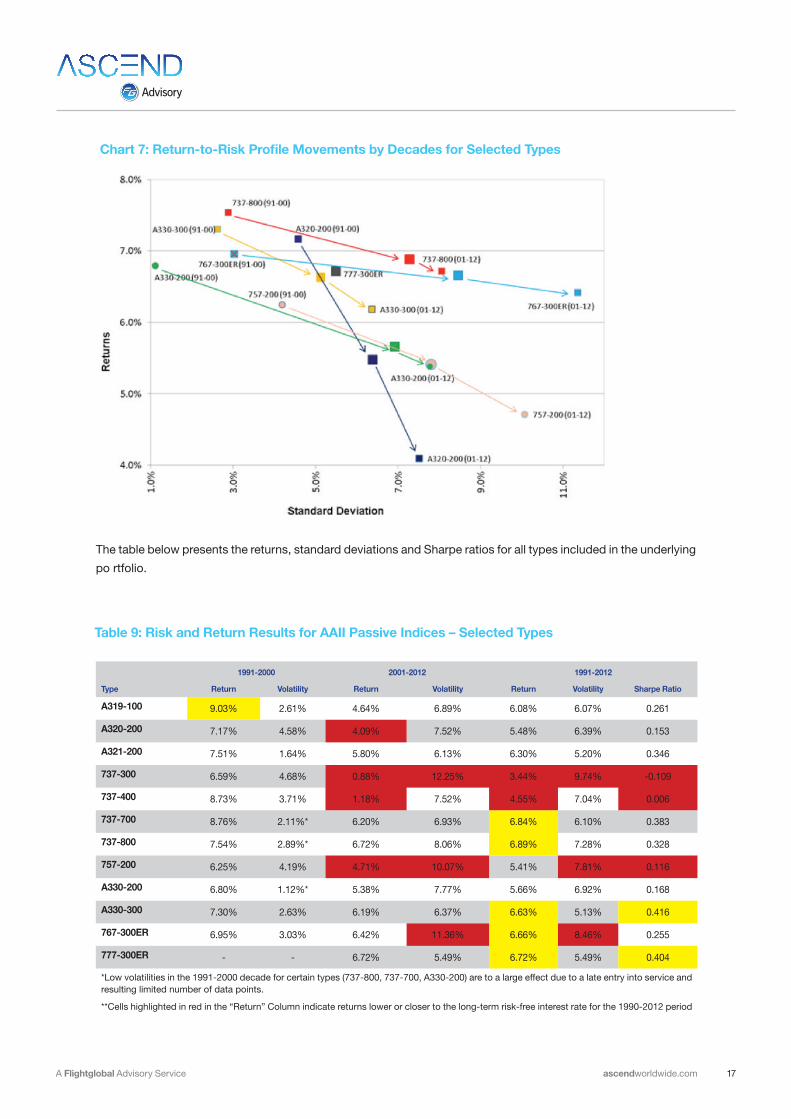
The table below presents the returns, standard deviations and Sharpe ratios for all types included in the underlying
po rtfolio.
Chart 7: Return-to-Risk Profile Movements by Decades for Selected Types
Table 9: Risk and Return Results for AAII Passive Indices – Selected Types
1991-2000 2001-2012 1991-2012
Type Return Volatility Return Volatility Return Volatility Sharpe Ratio
A319-100 9.03% 2.61% 4.64% 6.89% 6.08% 6.07% 0.261
A320-200 7.17% 4.58% 4.09% 7.52% 5.48% 6.39% 0.153
A321-200 7.51% 1.64% 5.80% 6.13% 6.30% 5.20% 0.346
737-300 6.59% 4.68% 0.88% 12.25% 3.44% 9.74% -0.109
737-400 8.73% 3.71% 1.18% 7.52% 4.55% 7.04% 0.006
737-700 8.76% 2.11%* 6.20% 6.93% 6.84% 6.10% 0.383
737-800 7.54% 2.89%* 6.72% 8.06% 6.89% 7.28% 0.328
757-200 6.25% 4.19% 4.71% 10.07% 5.41% 7.81% 0.116
A330-200 6.80% 1.12%* 5.38% 7.77% 5.66% 6.92% 0.168
A330-300 7.30% 2.63% 6.19% 6.37% 6.63% 5.13% 0.416
767-300ER 6.95% 3.03% 6.42% 11.36% 6.66% 8.46% 0.255
777-300ER - - 6.72% 5.49% 6.72% 5.49% 0.404
*Low volatilities in the 1991-2000 decade for certain types (737-800, 737-700, A330-200) are to a large effect due to a late entry into service and resulting limited number of data points.
**Cells highlighted in red in the “Return” Column indicate returns lower or closer to the long-term risk-free interest rate for the 1990-2012 period

18 worldwide.com A Flightglobal Advisory Service
Chart 8: Ascend aircraft investment index – comparative performance benchmark
Chart 9: Selected narrowbody aircraft total return indices between 1991-2013
19A Flightglobal Advisory Service ascendworldwide.com
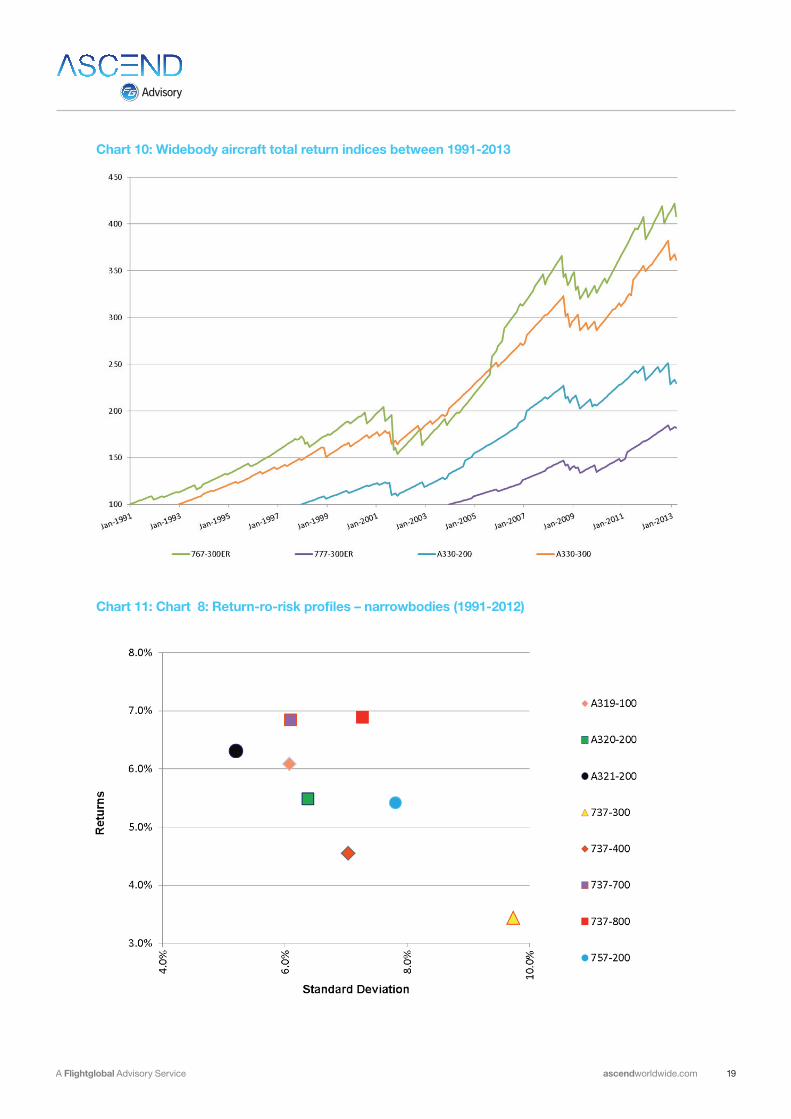
Chart 10: Widebody aircraft total return indices between 1991-2013
Chart 11: Chart 8: Return-ro-risk profiles – narrowbodies (1991-2012)

20 worldwide.com A Flightglobal Advisory Service
Chart 8: Return-ro-risk profiles – widebodies (1991-2012)