arXiv:nucl-ex/0205012v1 20 May 2002
14
arXiv:nucl-ex/0205012v1 20 May 2002 Gold fragmentation induced by stopped antiprotons P. Lubi´ nski, 1,2, * A. Grochulska, 1 T. von Egidy, 3 K. Gulda, 4 F.J. Hartmann, 3 J. Jastrz¸ ebski, 1 W. Kurcewicz, 4 L. Pienkowski, 1 A. Stolarz, 1 and A. Trzci´ nska 1 1 Heavy Ion Laboratory, Warsaw University, Pasteura 5a, 02-093 Warsaw, Poland 2 Nicolaus Copernicus Astronomical Center, Bartycka 18, 00-716 Warsaw, Poland 3 Physik-Department, Technische Universit¨ at M¨ unchen, D-8046 Garching, Germany 4 Institute of Experimental Physics, Warsaw University, Ho˙ za 69, 00-681 Warsaw, Poland (Dated: November 6, 2018) A natural gold target was irradiated with the antiproton beam from the Low Energy Antiproton Ring at CERN. Antiprotons of 200 MeV/c momentum were stopped in a thick target, products of their annihilations on Au nuclei were detected using the off-line γ-ray spectroscopy method. In total, yields for 114 residual nuclei were determined, providing a data set to deduce the complete mass and charge distribution of all products with A 20 from a fitting procedure. The contribution of evaporation and fission decay modes to the total reaction cross section as well as the mean mass loss were estimated. The fission probability for Au absorbing antiprotons at rest was determined to be equal to (3.8 ± 0.5) %, in good agreement with an estimation derived using other techniques. The mass-charge yield distribution was compared with the results obtained for proton and pion induced gold fragmentation. On the average, the energy released in ¯ p annihilation is similar to that introduced by ≈1 GeV protons. However, compared to proton bombardment products, the yield distribution of antiproton absorption residues in the N -Z plane is clearly distinct. The data for antiprotons exhibit also a substantial influence of odd-even and shell effects. PACS numbers: 25.43.+t, 25.85.Ge I. INTRODUCTION The large energy of almost 2 GeV released in nucleon- antinucleon annihilation had awoken hopes to observe some unique nuclear reactions induced in this way. Espe- cially energetic antiprotons were presumed to reach the deep interior of the nucleus. Exotic processes, like phase transitions to quark-gluon plasma and explosive decay of that hot system had been expected to occur [1, 2], but were not verified in experiments performed shortly after the commissioning of the Low Energy Antiproton Ring at CERN [3, 4]. Nevertheless, the character of the re- actions starting with antiproton absorption in nuclei is quite unique in comparison with reactions induced with protons or heavy ions. Whereas the excitation energy carried in by post-annihilation mesons is quite large, the linear and angular momentum transfer as well as the mat- ter compression are reduced, particularly in the stopped antiproton case which is preceded by the exotic atom phase. Hence, one may investigate a clear thermal reac- tion aspects with suppressed collective motion complica- tions. Such phenomena were intensively studied during the LEAR era for stopped and for energetic antiprotons. The spectra for neutrons and light charged particles [5, 6, 7, 8, 9, 10], mass yield distributions [11, 12, 13, 14, 15, 16] and characteristics of the fission fragments [17, 18, 19] were measured for a wide range of targets. The mean excitation energy derived from these studies, ≈ 150 MeV * Electronic address: [email protected] and ≈ 300 MeV for heavy nuclei absorbing stopped and 1.2 GeV antiprotons, respectively, compares well with the average values obtained for protons which have about 1 GeV larger energies, i.e. approximately the nucleon rest mass. Yield distributions of residual nuclei were studied as soon as more intense p beams were provided by LEAR. Many targets were irradiated with antiprotons, mainly at rest energy, but only few of them were examined in detail: nat Cu [14], 92,95 Mo [11], 98 Mo [12], nat Ag [15], nat Ba [13], 165 Ho [12] and 181 Ta [16]. Average quantities such as the mean mass removed from the target as well as individ- ual yield features, e.g. isomeric ratios, were investigated. Clear odd-even effects in the mass and charge yield dis- tribution were observed. Theoretical calculations, based on intranuclear cascade + evaporation models, were able to reproduce only the gross features and failed to predict yield dependence on the detailed N and Z [13]. The odd- even phenomenon, although postulated to be present and used to model the yield distribution for years [20, 21] and sometimes reaching very large values [22], still seems to be almost completely unexplored theoretically in a more quantitative way. One of the most distinct features observed in reactions with stopped antiprotons is the large probability (≈ 0.1) of very small energy transfer, when the target nucleus looses only one nucleon in annihilation and is left ex- cited below the nucleon separation energy. Nuclear spec- troscopy studies of the relative yield of both types of these residual (A T - 1) nuclei (a neutron or a proton lost in such soft antiproton absorptions) were used to estab- lish a new and powerful method of probing the nuclear periphery composition [23, 24, 25, 26]. Typeset by REVT E X
Transcript of arXiv:nucl-ex/0205012v1 20 May 2002
arX
iv:n
ucl-
ex/0
2050
12v1
20
May
200
2
Gold fragmentation induced by stopped antiprotons
P. Lubinski,1, 2, ∗ A. Grochulska,1 T. von Egidy,3 K. Gulda,4 F.J. Hartmann,3
J. Jastrzebski,1 W. Kurcewicz,4 L. Pienkowski,1 A. Stolarz,1 and A. Trzcinska1
1Heavy Ion Laboratory, Warsaw University, Pasteura 5a, 02-093 Warsaw, Poland2Nicolaus Copernicus Astronomical Center, Bartycka 18, 00-716 Warsaw, Poland3Physik-Department, Technische Universitat Munchen, D-8046 Garching, Germany
4Institute of Experimental Physics, Warsaw University, Hoza 69, 00-681 Warsaw, Poland
(Dated: November 6, 2018)
A natural gold target was irradiated with the antiproton beam from the Low Energy AntiprotonRing at CERN. Antiprotons of 200 MeV/c momentum were stopped in a thick target, productsof their annihilations on Au nuclei were detected using the off-line γ-ray spectroscopy method. Intotal, yields for 114 residual nuclei were determined, providing a data set to deduce the completemass and charge distribution of all products with A & 20 from a fitting procedure. The contributionof evaporation and fission decay modes to the total reaction cross section as well as the mean massloss were estimated. The fission probability for Au absorbing antiprotons at rest was determinedto be equal to (3.8± 0.5) %, in good agreement with an estimation derived using other techniques.The mass-charge yield distribution was compared with the results obtained for proton and pioninduced gold fragmentation. On the average, the energy released in p annihilation is similar to thatintroduced by ≈1 GeV protons. However, compared to proton bombardment products, the yielddistribution of antiproton absorption residues in the N-Z plane is clearly distinct. The data forantiprotons exhibit also a substantial influence of odd-even and shell effects.
PACS numbers: 25.43.+t, 25.85.Ge
I. INTRODUCTION
The large energy of almost 2 GeV released in nucleon-antinucleon annihilation had awoken hopes to observesome unique nuclear reactions induced in this way. Espe-cially energetic antiprotons were presumed to reach thedeep interior of the nucleus. Exotic processes, like phasetransitions to quark-gluon plasma and explosive decay ofthat hot system had been expected to occur [1, 2], butwere not verified in experiments performed shortly afterthe commissioning of the Low Energy Antiproton Ringat CERN [3, 4]. Nevertheless, the character of the re-actions starting with antiproton absorption in nuclei isquite unique in comparison with reactions induced withprotons or heavy ions. Whereas the excitation energycarried in by post-annihilation mesons is quite large, thelinear and angular momentum transfer as well as the mat-ter compression are reduced, particularly in the stoppedantiproton case which is preceded by the exotic atomphase. Hence, one may investigate a clear thermal reac-tion aspects with suppressed collective motion complica-tions.
Such phenomena were intensively studied during theLEAR era for stopped and for energetic antiprotons. Thespectra for neutrons and light charged particles [5, 6, 7,8, 9, 10], mass yield distributions [11, 12, 13, 14, 15, 16]and characteristics of the fission fragments [17, 18, 19]were measured for a wide range of targets. The meanexcitation energy derived from these studies, ≈ 150 MeV
∗Electronic address: [email protected]
and ≈ 300 MeV for heavy nuclei absorbing stopped and1.2 GeV antiprotons, respectively, compares well with theaverage values obtained for protons which have about 1GeV larger energies, i.e. approximately the nucleon restmass.
Yield distributions of residual nuclei were studied assoon as more intense p beams were provided by LEAR.Many targets were irradiated with antiprotons, mainly atrest energy, but only few of them were examined in detail:natCu [14], 92,95Mo [11], 98Mo [12], natAg [15], natBa [13],165Ho [12] and 181Ta [16]. Average quantities such as themean mass removed from the target as well as individ-ual yield features, e.g. isomeric ratios, were investigated.Clear odd-even effects in the mass and charge yield dis-tribution were observed. Theoretical calculations, basedon intranuclear cascade + evaporation models, were ableto reproduce only the gross features and failed to predictyield dependence on the detailed N and Z [13]. The odd-even phenomenon, although postulated to be present andused to model the yield distribution for years [20, 21] andsometimes reaching very large values [22], still seems tobe almost completely unexplored theoretically in a morequantitative way.
One of the most distinct features observed in reactionswith stopped antiprotons is the large probability (≈ 0.1)of very small energy transfer, when the target nucleuslooses only one nucleon in annihilation and is left ex-cited below the nucleon separation energy. Nuclear spec-troscopy studies of the relative yield of both types ofthese residual (AT −1) nuclei (a neutron or a proton lostin such soft antiproton absorptions) were used to estab-lish a new and powerful method of probing the nuclearperiphery composition [23, 24, 25, 26].
Typeset by REVTEX

2
The irradiation of the heavy, gold target gave us achance to study the competition between evaporationand fission induced by antiproton absorption. The yielddistribution of heavy residual nuclei complements the re-sults obtained from on-line measurements of neutron andcharged particle spectra [8]. Since gold is a commonlyused target, there was also the opportunity to comparethese data with a rich set of information gathered from ir-radiations with energetic protons or pions. In particular,the yield distribution after the reaction of 1 GeV protonswith Au has been extensively studied in older and recentγ-ray spectroscopy measurements [27, 28] and also witha new method using the mass-charge spectrometry for in-verse kinematic reactions [29, 30]. Our preliminary dataof the reaction p + Au at rest were already published[31], this work presents the complete results obtained af-ter fitting the Y (A,Z) yield distribution.The article is organized as follows. In Section II we
briefly present some details of the experiment, in Sec. IIIdata analysis is described together with the yield fittingmethod. Experimental results are presented and initiallydiscussed within Sec. IV. In Sec. V we compare the re-sults of this experiment with those obtained with otherprojectiles impinging on Au and with data coming fromstudies of antiproton absorption in various targets. Fi-nally, our main conclusions are presented in Sec. VI.
II. EXPERIMENT
A thick target of natural gold was irradiated with theantiproton beam of 200 MeV/c momentum from LEARfacility. The target of the total thickness of 549 mg/cm2
was composed of ten foils of 80, 30, 30, 30, 2, 30, 30,37, 80 and 200 mg/cm2, starting from the beam side.The initial energy of the antiprotons, equal to about 21MeV, was reduced in the scintillation counter (from Pi-lot B) and in some additional moderators (mylar,silicon)to about 6.5 MeV at the target surface. Such an ar-rangement assured that the majority of antiprotons wasstopped in few central Au foils. The very central andextremely thin foil of 2 mg/cm2 was applied to monitorthe X-ray activity, while the last and thickest one (200mg/cm2) was used to check the secondary reactions level.Two scintillation counters, S1 and S2, were used to
control beam intensity and transverse dispersion. Thefirst anticounter S1 had a hole of 10 mm diameter and theactive area of counter S2 was a disc of the same diameter.Consequently the signal S1S2 indicated particles goingtowards the target. The irradiation lasted 15 minuteswith the total number of antiprotons equal to (9.25 ±0.35)× 108 (S1S2 number).Monitoring of the target activity started 13 min after
the irradiation and continued at CERN during one week;afterwards the spectra were collected in Warsaw, the lastone was taken more than a year after target activation.
Two HPGe detectors were used at CERN, a γ-ray counterof 15% relative efficiency for all foils and an X-ray counterfor the thinest one. In Warsaw two more efficient γ-ray detectors were applied, of 20% and of 60% relativeefficiency, and a third X-ray detector for the thin foil.All collected spectra were analyzed with the program
ACTIV [32, 33]. Gamma-ray lines were identified bytheir energies, half-lives and intensity ratios. The de-cay data were taken from the eighth edition of the Tableof Isotopes [34].Experimental yields for all detected residual nuclei,
normalized to 1000 p stopped in the target, are listedin Table I. The independent yields represent the totalnumber of nuclei, summed over all isomers. Cumulativeyields include also the yields of all β-decay precursors ofa given isotope. Besides that, there are presented partialyields for some isomers not representing the whole pro-duction for a given (A,Z) pair as well as some productionlimits for Hg nuclei. Mercury may be produced from goldafter p absorption in a charge exchange reactions, whenone of the annihilation π+, π0 pions exchanges chargewith a target neutron. Such a phenomenon was ob-served for some targets irradiated with stopped antipro-tons [12, 13, 15, 16], where nuclei of target charge plusone were produced at level ranging from 0.5 to 5 per 1000p. On the other hand, for some other targets, studied inthe neutron halo project, rather low upper limits (0.5-2%) were given [35]. Our data obtained for Au, exceptfor the 195Hg isomers with low γ intensity, indicate thatsuch an effect should happen very rarely.Initially, the distribution of the activity induced in in-
dividual target foils was estimated several hours afterthe irradiation with the use of the measurement of the186Ir(g) yield in each foil. Five inner foils (30, 30, 2, 30,30 mg/cm2) gathered about 90% of the total activity andonly these foils were monitored later. This reduced theγ-ray self-absorption effect. The distribution of the tar-get activity was determined more precisely afterwards onthe basis of yields obtained for six evaporation residues:186Ir, 184Ir, 183Os, 181Re, 157Dy and 152Dy. On aver-age, five inner foils stopped (89.7 ± 2.1)% of the wholenumber of antiprotons. These data, together with the re-sults for 196Au and 192Au, were used also to estimate theyield introduced by secondary reactions with particles(mainly pions and neutrons) produced after antiprotonannihilation on target nuclei. It was done by comparingthe number of given nuclei produced per foil thicknessunit, averaged for three inner foils, with the similar re-sult obtained for the last, thickest foil. The upper limitfor the secondary reactions leading to 196Au is equal to3%, the limit for 192Au is about 2.6% and for the rest ofquoted isotopes it does not exceed 2%, i.e. in all cases itis below the yield uncertainties. The negligible influenceof the secondary reactions on our results is additionallyconfirmed by very small upper limit given in Table I for198Au, a (n,γ) reaction product.
3
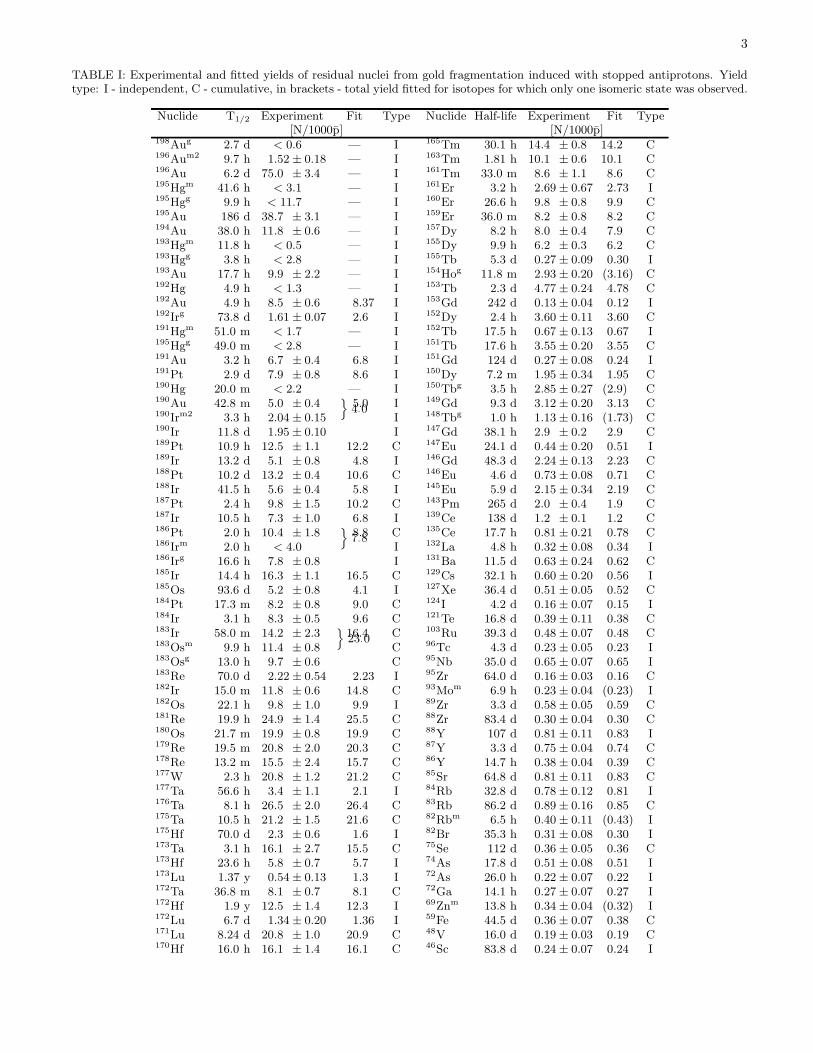
TABLE I: Experimental and fitted yields of residual nuclei from gold fragmentation induced with stopped antiprotons. Yieldtype: I - independent, C - cumulative, in brackets - total yield fitted for isotopes for which only one isomeric state was observed.
Nuclide T1/2 Experiment Fit Type Nuclide Half-life Experiment Fit Type[N/1000p] [N/1000p]
198Aug 2.7 d < 0.6 — I 165Tm 30.1 h 14.4 ± 0.8 14.2 C196Aum2 9.7 h 1.52± 0.18 — I 163Tm 1.81 h 10.1 ± 0.6 10.1 C196Au 6.2 d 75.0 ± 3.4 — I 161Tm 33.0 m 8.6 ± 1.1 8.6 C195Hgm 41.6 h < 3.1 — I 161Er 3.2 h 2.69± 0.67 2.73 I195Hgg 9.9 h < 11.7 — I 160Er 26.6 h 9.8 ± 0.8 9.9 C195Au 186 d 38.7 ± 3.1 — I 159Er 36.0 m 8.2 ± 0.8 8.2 C194Au 38.0 h 11.8 ± 0.6 — I 157Dy 8.2 h 8.0 ± 0.4 7.9 C193Hgm 11.8 h < 0.5 — I 155Dy 9.9 h 6.2 ± 0.3 6.2 C193Hgg 3.8 h < 2.8 — I 155Tb 5.3 d 0.27± 0.09 0.30 I193Au 17.7 h 9.9 ± 2.2 — I 154Hog 11.8 m 2.93± 0.20 (3.16) C192Hg 4.9 h < 1.3 — I 153Tb 2.3 d 4.77± 0.24 4.78 C192Au 4.9 h 8.5 ± 0.6 8.37 I 153Gd 242 d 0.13± 0.04 0.12 I192Irg 73.8 d 1.61± 0.07 2.6 I 152Dy 2.4 h 3.60± 0.11 3.60 C191Hgm 51.0 m < 1.7 — I 152Tb 17.5 h 0.67± 0.13 0.67 I195Hgg 49.0 m < 2.8 — I 151Tb 17.6 h 3.55± 0.20 3.55 C191Au 3.2 h 6.7 ± 0.4 6.8 I 151Gd 124 d 0.27± 0.08 0.24 I191Pt 2.9 d 7.9 ± 0.8 8.6 I 150Dy 7.2 m 1.95± 0.34 1.95 C190Hg 20.0 m < 2.2 — I 150Tbg 3.5 h 2.85± 0.27 (2.9) C190Au 42.8 m 5.0 ± 0.4 5.0 I 149Gd 9.3 d 3.12± 0.20 3.13 C190Irm2 3.3 h 2.04± 0.15
}
4·0I 148Tbg 1.0 h 1.13± 0.16 (1.73) C
190Ir 11.8 d 1.95± 0.10 I 147Gd 38.1 h 2.9 ± 0.2 2.9 C189Pt 10.9 h 12.5 ± 1.1 12.2 C 147Eu 24.1 d 0.44± 0.20 0.51 I189Ir 13.2 d 5.1 ± 0.8 4.8 I 146Gd 48.3 d 2.24± 0.13 2.23 C188Pt 10.2 d 13.2 ± 0.4 10.6 C 146Eu 4.6 d 0.73± 0.08 0.71 C188Ir 41.5 h 5.6 ± 0.4 5.8 I 145Eu 5.9 d 2.15± 0.34 2.19 C187Pt 2.4 h 9.8 ± 1.5 10.2 C 143Pm 265 d 2.0 ± 0.4 1.9 C187Ir 10.5 h 7.3 ± 1.0 6.8 I 139Ce 138 d 1.2 ± 0.1 1.2 C186Pt 2.0 h 10.4 ± 1.8 8.8 C 135Ce 17.7 h 0.81± 0.21 0.78 C186Irm 2.0 h < 4.0
}
7·8I 132La 4.8 h 0.32± 0.08 0.34 I
186Irg 16.6 h 7.8 ± 0.8 I 131Ba 11.5 d 0.63± 0.24 0.62 C185Ir 14.4 h 16.3 ± 1.1 16.5 C 129Cs 32.1 h 0.60± 0.20 0.56 I185Os 93.6 d 5.2 ± 0.8 4.1 I 127Xe 36.4 d 0.51± 0.05 0.52 C184Pt 17.3 m 8.2 ± 0.8 9.0 C 124I 4.2 d 0.16± 0.07 0.15 I184Ir 3.1 h 8.3 ± 0.5 9.6 C 121Te 16.8 d 0.39± 0.11 0.38 C183Ir 58.0 m 14.2 ± 2.3 16.4 C 103Ru 39.3 d 0.48± 0.07 0.48 C183Osm 9.9 h 11.4 ± 0.8
}
23·0C 96Tc 4.3 d 0.23± 0.05 0.23 I
183Osg 13.0 h 9.7 ± 0.6 C 95Nb 35.0 d 0.65± 0.07 0.65 I183Re 70.0 d 2.22± 0.54 2.23 I 95Zr 64.0 d 0.16± 0.03 0.16 C182Ir 15.0 m 11.8 ± 0.6 14.8 C 93Mom 6.9 h 0.23± 0.04 (0.23) I182Os 22.1 h 9.8 ± 1.0 9.9 I 89Zr 3.3 d 0.58± 0.05 0.59 C181Re 19.9 h 24.9 ± 1.4 25.5 C 88Zr 83.4 d 0.30± 0.04 0.30 C180Os 21.7 m 19.9 ± 0.8 19.9 C 88Y 107 d 0.81± 0.11 0.83 I179Re 19.5 m 20.8 ± 2.0 20.3 C 87Y 3.3 d 0.75± 0.04 0.74 C178Re 13.2 m 15.5 ± 2.4 15.7 C 86Y 14.7 h 0.38± 0.04 0.39 C177W 2.3 h 20.8 ± 1.2 21.2 C 85Sr 64.8 d 0.81± 0.11 0.83 C177Ta 56.6 h 3.4 ± 1.1 2.1 I 84Rb 32.8 d 0.78± 0.12 0.81 I176Ta 8.1 h 26.5 ± 2.0 26.4 C 83Rb 86.2 d 0.89± 0.16 0.85 C175Ta 10.5 h 21.2 ± 1.5 21.6 C 82Rbm 6.5 h 0.40± 0.11 (0.43) I175Hf 70.0 d 2.3 ± 0.6 1.6 I 82Br 35.3 h 0.31± 0.08 0.30 I173Ta 3.1 h 16.1 ± 2.7 15.5 C 75Se 112 d 0.36± 0.05 0.36 C173Hf 23.6 h 5.8 ± 0.7 5.7 I 74As 17.8 d 0.51± 0.08 0.51 I173Lu 1.37 y 0.54± 0.13 1.3 I 72As 26.0 h 0.22± 0.07 0.22 I172Ta 36.8 m 8.1 ± 0.7 8.1 C 72Ga 14.1 h 0.27± 0.07 0.27 I172Hf 1.9 y 12.5 ± 1.4 12.3 I 69Znm 13.8 h 0.34± 0.04 (0.32) I172Lu 6.7 d 1.34± 0.20 1.36 I 59Fe 44.5 d 0.36± 0.07 0.38 C171Lu 8.24 d 20.8 ± 1.0 20.9 C 48V 16.0 d 0.19± 0.03 0.19 C170Hf 16.0 h 16.1 ± 1.4 16.1 C 46Sc 83.8 d 0.24± 0.07 0.24 I

4
TABLE I: - continued.
Nuclide Half-life Experiment Fit Type Nuclide Half-life Experiment Fit Type[N/1000p] [N/1000p]
170Lu 2.0 d 3.8 ± 0.7 3.9 I 41Ar 1.8 h 0.22± 0.05 0.22 C169Lu 34.1 h 16.0 ± 0.6 16.0 C 24Na 15.0 h 0.27± 0.07 0.27 C169Yb 32.0 d 2.15± 0.67 2.18 I 22Na 2.6 y < 2.7 0.31 C166Yb 56.7 h 15.5 ± 0.8 15.5 C 7Be 53.3 d < 3.5 — C
III. DATA ANALYSIS
The method based on off-line γ-ray spectroscopy hassome limitations. The most important is the necessityto use some phenomenological model to reconstruct theyields of unobservable products [12, 20, 21, 36, 37]. Insimilar experiments with other projectiles the data aresparsely spread over the N -Z plane. In this case less de-tailed models may be applied and the results obtainedare only a first order approximation of the true yield dis-tribution Y (A,Z), even when cumulative cross sectionsare involved in the fitting procedure. Moreover, the pre-cision of tabulated absolute γ-ray intensities sometimesleaves much to be desired and, finally, the decomposi-tion of spectra with a few hundreds of lines, as they aremeasured for heavier targets, becomes a challenge for thepersistence of the evaluator.Targets irradiated with antiproton beams, much less
intense than the proton beams, have a rather low activ-ity level. In particular, yields obtained for the fissionfragments were close to our detection limit. Keeping inmind one of our goals, the estimation of the probabilityfor antiproton induced fission, the data analysis neededspecial care and some feedback. A primary set of yieldresults obtained from the spectrum analysis served as aninput for the model distribution fitting at its early stage,when the best approach was searched for. This relatesto the choice of the final formula as well as to the divi-sion of the data to subsets assuring the lowest total χ2.Afterwards, a modeling procedure was applied to check,confirm or eliminate some doubtful experimental yields.For some mass regions it appeared necessary to apply anadditional or separate evaluation, and we describe it atthe end of this section.
A. Fitting procedure
The formula, used to describe the yield distributionwas rather complex in order to be as universal as possibleand to test various models. This complexity mainly arosefrom the aim of taking into account cumulative yieldsand from introducing the (N,Z) evenness corrections.The general formula was factorized into two components,mass and charge distributions, YA and YZP, respectively,
Y (A,Z) = YA × YZP . (1)
The distribution over the mass (the main distributionridge) was modeled with the exponential of a fourth-order
polynomial with parameters a1 − a5,
YA = e(a1+a2A+a3A2+a4A
3+a5A4). (2)
This was useful for testing the fit in broader mass regions,where the ridge shape may change more rapidly.The form of the second factor in Eq. (1), YZP , (the
charge distribution) was multiplied by the odd-even cor-rections FP . When needed, an additional component,containing the sum of yields of the decay predecessors ofgiven (A,Z) isotope, was added here
YZP =
5∑
k=0
FP (Z + ck,N − ck)× e−(Z+ck−Zp)w/2σ2
,
(3)
where the term with k = 0 corresponds to the indepen-dent YZP (A,Z) yield and the terms with k = 1÷5 standfor the precursors contributions. The upper limit of thesum over k was set to 5, because the charge distributionfor given A is rather narrow and neglecting k > 5 did notchange the sum by more than 1%.The most probable charge path Zp and the charge dis-
tribution width σ were expressed as a third-order poly-nomials of A, with parameters a6 − a9 and a10 − a13,respectively,
Zp = a6 + a7A+ a8A2 + a9A
3, (4)
σ = a10 + a11A+ a12A2 + a13A
3. (5)
The value of the factor c in the sum of the yield cumu-lation for a given A depended on the side of the stabilityvalley on which the given isotope lies,
c =
{
1, EC, β+decay (neutron-deficient nuclei);
−1, β−decay (neutron-rich nuclei).
(6)
The power index w in the exponent argument in Eq.(3) was allowed to be different for Z > Zp and Z ≤ Zp,
w =
{
a16, Z > Zp
a17, Z ≤ Zp,(7)
where a16 was always set to 2 and a17 = 2 or a17 = 1.5 wasused in order to test the asymmetric charge distributionin the latter case.

5
FIG. 1: The path of the most probable atomic number Zp
corresponding to the best fit values for the parameters a6−a8
in seven mass regions (solid lines). Positions of nuclei, forwhich a cumulative or an independent yield was determined,are denoted by circles and triangles, respectively. Dashedline - valley of stability approximated by the relation Zβ =
A/(1.98+ 0.0155A2/3) [38]. Open square indicates the targetnucleus, vertical and horizontal dotted crosses are plotted forthe magic N = 82 and the closed shell Z = 64 and for themagic N = 50 and the closed shell Z = 40.
Finally, the odd-even correction was assumed to be asimple factor depending on the Z and N evenness com-bination
FP =
1, Z - even, N - even;
a14, Z - odd, N - even;
a15, Z - even, N - odd;
a14a15, Z - odd, N - odd.
(8)
A division of the whole A-Z plane into subregions maybe treated as yet another model parameter. To havecontrol over it we have plotted positions of all detectednuclei in the N -Z plane; this appeared to be very helpfulfor a preliminary determination of the Zp path, espe-cially for regions with many data. The final mass regiondivision is illustrated in Fig. 1 by the solid lines show-ing Zp fitted for seven data regions. Mass range limitswere fixed to get the smallest total χ2 for the whole datarange and to possibly simplify the model for the courseof the Zp path. We have tested many alternative divi-sions, especially for the region of the heavy evaporationresidues (143 ≤ A ≤ 183). The fitting applied to broaderA ranges than those listed in Table II resulted in at leastone order of magnitude larger χ2 values, mainly due torapid changes in the Zp course at A = 162 and A = 150.For three separate regions of the lighter products with A= 121-139, 82-103 and 24-75 the limits were defined bythe grouping of the experimental data.As may be seen from Table II, presenting the final pa-
rameters, sometimes the best fit is obtained when thenumber of parameters exceeds the number of data. Thiswas done by fixing some parameters when the others were
fitted, and vice versa. Various combinations and order offixing/releasing of parameters as well as their total num-ber were tested. The shape of the mass ridge could beparametrized with a maximum of four parameters, themost probable Z path was approximated via a parabolaexcept for two cases and the charge distribution widthwas constant or changed linearly with mass. Odd-evencorrections were applied only for three heaviest mass re-gions, where a larger number of points and smaller rel-ative errors of the experimental data allowed to get areliable fit. The shape of the charge distributions wasmodeled better with the use of an asymmetric form forthe evaporation residues, lying further from the stabilityvalley (see Fig. 1). For lighter, fission products the Zp
path goes closely along the valley of stability and here asymmetric Gaussian shape was more adequate.The normalized charge distributions for six mass inter-
vals are plotted in Fig. 2 against the normalized chargedifference (Z − Zp)/σ. This reduces the distributions to
FIG. 2: Normalized Z distributions for six mass ranges. Thefitted function (line) is the exponent exp(−|(Z − Zp)/σ|
w),where w is the charge distribution power index, Zp the mostprobable Z and σ the Z distribution width. Experimentalvalues (△ - independent, � - cumulative) are normalized asdescribed in the text. All distributions have the same normal-ized width equal to unity (please note the asymmetric shapesfor four distributions of heavier isotopes, with different slopefor both sides).

6
TABLE II: Best fit parameters obtained for the yield distribution model applied to six mass regions.
Paramater Mass range163-182 150-161 143-149 121-139 82-103 24-75
YA a1 -93.98(2) -90.63(3) -479.2(1) 18.13(9) -30.97(5) -2.07(11)a2 1.0951(1) 1.060 (2) 6.486(1) -0.207(1) 0.690(1) -0.0059(18)a3 -0.00310(1) -0.00302(2) -0.02192(3) -0.000706(5) -0.00390(6) 0.00029(3)a4 -0.3(2)E-7 0.884(4)E-5
Zp a6 96.26(4) 136.6(1) -3.06(9) -7.2(3) -142.1(1) 0.77(10)a7 -0.6681(2) -1.201(1) 0.5051(6) 0.525(3) 4.886(1) 0.456(2)a8 0.003081(1) 0.00485(5) -0.000329(4) -0.00029(2) -0.0456(1) -0.000329(2)a9 0.8(14)E-7 0.000153(1)
σ a10 -0.82(2) 1.17(4) 1.12(8) 0.91(9) 1.15(4) 2.12(11)a11 0.0105(2) -0.013(2)
FP a14 0.67(3) 0.82(5) 0.58(7) 1. 1. 1.a15 0.74(3) 0.91(6) 0.90(8) 1. 1. 1.
w a16 2. 2. 2. 2. 2. 2.a17 1.5 1.5 1.5 1.5 2. 2.
χ2/NDF 0.045 0.006 0.164 0.131 0.082 0.020
the same width in the case where σ is not constant in thegiven region. The fitted function is the simple exponentexp(−|(Z−Zp)/σ|
w), then, for comparison, experimentaldata Y (A,Z)E are normalized with three factors comingfrom the fit
YZ =Y (A,Z)E
Y (A)× FP (N,Z)× fI. (9)
Here, the mass distribution Y (A) is as in Eq. (1), the odd-even correction FP (N,Z) follows Eq. (8) and the factorfI corresponds to the independent yield fraction in thecase of the cumulative yield
fI =
FP (Z,N)
∫ Z+0.5
Z−0.5
e−(z−Zp)w/2σ2
dz
5∑
k=0
[
FP (Z + ck,N − ck)×
∫ Z+ck+0.5
Z+ck−0.5
e−(z+ck−Zp)w/2σ2
dz]
. (10)
Sometimes charge distributions are normalized to unityintegral over Z to get the total yield for a given A equaldirectly to YA [36, 39]. However, when odd-even correc-tions are used the distribution of the total yield cannot bedescribed by a simple continuous function as in Eq. (2).Also the generalization of the charge distribution shapewith the two-valued (or released) index w leads to prob-lems in obtaining an analytical form of the normalizationfactor for this function. Hence our distributions for sixmass regions are normalized only to the same width σ =1, not to the same integral.
B. Treatment of the heaviest residues
It is a well known fact that none simple phenomenolog-ical model can properly describe the charge distributionof yields for isotopes lying near the target nuclide [21, 36].
The main reason for this is the asymmetric, non-Gaussianshape of the charge distribution, with the most probableZ and width rapidly changing with mass. Such a phe-nomenon is clearly seen when one uses a longer section ofthe Y (A,Z) yield, along constant Z value instead of con-stant A. Fig. 3 presents isotopic YA(A) distributions ob-tained in this experiment for elements ranging from Au toLu. Also isotopic distributions obtained for the heaviestelement after stopped antiproton absorption on 176Yb,148Nd and 130Te targets [35] exhibit such a behavior: asteep and narrow distribution for the target element ZT ,a flat and broad distribution for the ZT -1 element anddeformed quasi-Gaussian shapes for some smaller Z, withthe deformation on the heavy mass side decreasing withincreasing distance from ZT . Even though the low massside for all elements but ZT may be described with thesame slope, the slope at the higher mass side changesrapidly and cannot be fitted well with a fixed isotopic

7
distribution asymmetry, i.e. with the unique, constanta17 parameter. As a consequence, the heaviest elementsshould be excluded from the global fit and their YA(A)yields have to be fitted separately for a given Z.
FIG. 3: Isotopic yield distributions for the nine heaviestresidual elements produced in the fragmentation of gold withstopped antiprotons. Dashed lines show yields obtained fromthe fit applied to the region 163 ≤ A ≤ 182; triangles, full andopen circles represent the experimental yields: independent,cumulative and cumulative transformed to independent, re-spectively. Solid lines illustrate the corrections of the isotopicyield distribution for the heaviest isotopes of the elementsfrom Pt to Hf, and for the lightest Au isotopes (see Sec. IIIfor discussion).
The method of the yield completion for the heaviestelements is recursive: at the beginning we estimate thelacking yields of the lighter Au isotopes. With the useof these results cumulative, experimental yields for Ptare converted to independent ones and the isotopic dis-tribution for this element is evaluated. Then, a similarprocedure is applied for Ir, Os and so on. The methodwas applied down to Ta and Hf elements, where theyields for A ≥ 175 were corrected. Finally, the summedY (A) yields for A ≥ 175 presented with a line in Fig. 4are the combination of results of both evaluations: the163 ≤ A ≤ 182 region global fit and the procedure de-scribed above.The platinum distribution was the most laborious case,
FIG. 4: Mass distribution of residual nuclei produced by thereaction of stopped p with Au. The cumulative sum of ex-perimentally observed yields for a given mass is shown withcrosses, the corresponding fitted Y (A) yield for all input data(averaged over Z for given A) is represented by full circles.The line shows the sum of fitted yields completed with inter-polated yields for mass intervals not fitted. For the heaviestisotopes (A ≥ 175) an additional correction of the mass yielddata was performed, as described in Sec. III.
due to lack of radioactive isotopes above mass 191 andowing to the strong odd-even N effect (up to 30%), ob-served for this even-Z element produced after low-energyabsorption of antiprotons. The overall shape of the iso-topic distribution was assumed to be similar to that ob-served for Tm residues after Yb fragmentation with an-tiprotons [35], with an increasing enhancement of yieldsfor three heaviest nuclei, which for Pt are these with themass numbers 194, 195 and 196. The number for 196Ptobtained in this way (16/1000p) was confronted with theresult of another estimation, based on the so-called halofactor dependence on separation energy Sn of the neu-tron from target nucleus [25]. For heavy nuclei with Sn
close to 8 MeV the halo factor is of the order of 4 ÷ 5,hence, using the 196Au yield the Y (196Pt) should be be-tween 14 and 23 per 1000p. These two estimations areconsistent. For the lightest Pt isotopes we assumed thatthe steep slope coming from the 163 ≤ A ≤ 182 region fitis a good approximation, this assumption was used alsofor consecutive, lower Z elements (we have checked thejustification of this approach using the lightest mass datapoints of these isotopes in an additional test fit). At last,on the basis of observed changes of Pt yield for odd andeven N isotopes an appropriate correction was applied.
C. Region of the α-decay
There is a narrow bump at A = 147 in the mass yielddistribution, a feature observed for Au [27, 28] and forTa [16, 40] target fragmentation after reactions with pro-

8
tons, heavy ions and stopped antiprotons. The enhance-ment of the cross section in this region was suggestedto be the result of α-decay of nuclei above the N = 82shell [27], but the authors abstained to estimate quanti-tatively this effect due to lack of charge dispersion curveswhich could not be fitted for limited experimental data.We have done such an estimation for our data perform-ing a preliminary fit for isotopes not affected by α-decay,i.e. for 154 ≤ A ≤ 161, adding 150Dy with an inde-pendent yield. Taking into account a charge dispersionyield Y (A,Z) obtained in this way we have calculatedappropriate decay corrections for experimentally mea-sured yields of 153Tb (+2.9% correction), 153Gd (+2.8%),152Dy (+7.2%), 152Tb (+6.0%), 151Tb (+14.8%), 151Gd(+13.6%), 150Tb (+32.5%), 149Gd (+5.5%), 147Gd (-13.7%), 147Eu (-12.1%) and 146Gd (-23.7%). The ex-perimental results listed in Table I are the corrected onesand were used for fitting in two mass ranges affected bythis effect. As can be seen from Fig. 4 the corrections ob-tained are too small to remove the local yield maximumat A = 147 (crosses show the yield before correction, cir-cles after that). Therefore, α-decay alone cannot explainfully such a feature and the observed yield enhancementin this region should be partially ascribed to the closedN = 82 shell influence.
IV. RESULTS
The experimental data are presented in Table I, to-gether with the fit results for isotopes representing fullyield for a given pair of A and Z. Results are normalizedto yield per 1000 p with the total number of antiprotonsstopped in the target (9.25 × 10⁸). The final mass yielddistribution is presented in Fig. 4. The cumulative sumof all yields observed for a given mass number A is herecompared with the total yield Y (A) obtained from the fitvia summation of all fitted Y (A,Z) values over Z, or fromthe interpolation between fitted mass regions. The globalcurve of the fitted Y (A) yield, when compared with thesummed experimental yields, forms its exact skyline inalmost the whole region of the evaporation residues. Adeviation from this rule is observed for three mass ranges:the heaviest, with A > 176, a few mass numbers aroundA = 147 and all fission fragments (A < 120). Exceptfor the second region (affected by the α-decay), this isthe result of prevailing accumulation of the isobaric yieldby non-detectable isotopes. The depression of observedyield of the heaviest evaporation residues is narrow butdeep, with a maximum decrease to about 40% of the fit-ted Y (A) for A ≈ 192, and comes mainly from the stablePt isotopes produced. For fission products, where theZp path goes over the stability valley, the observed yieldis strongly suppressed and its outline reaches only about20-50% of the fitted yield.Leaving out two heaviest masses, the maximal Y (A)
yield is reached at mass 180 but the largest individualY (A,Z) production is fitted for 176W. The small yield
peaks observed for some even masses (A = 180, 176, 170,...) are due to the strongest odd-even effect for some evenZ lying almost on the Zp path. On the other hand, theglobal mass yield minimum appears between A = 105and A = 120. As numerous γ-lines of strongly populatedheavier nuclei covered this region, no valuable productionlimits can be given for this region and we have to stickto the interpolated curve.After evaluation of the mass yield curve it is possi-
ble to estimate the relative yields for different reactionchannels. The fission fragments mass range should betreated with some care as their multiplicity is equal to2 or greater when one takes into account any multi-fragmentation process. Assuming that all residues with40 ≤ A ≤ 120 are binary fission products (i.e. twoheavy residues per antiproton) and neglecting the light-est A < 40 masses, we have obtained the summed fissionyield. Comparing this number with the total Y (A) inte-gral in the mass limits from 40 to 196 we have extractedthe probability of gold fission induced with stopped an-tiprotons to be (3.8 ± 0.5)%. The lighter mass region(A = 10 − 40), not taken into account in fission due topossible multiplicity > 2 and/or the not fully negligiblechance to have a fission partner in the A > 120 region,constitutes additionally less than 0.9% of the total yield(the error quoted above takes this into account). Our re-sult compares well with the fission probability of 3.1(3)%obtained in an experiment where fission fragments yieldswere measured with PIN diodes [41] and is substantiallylarger then the value of 1.5% derived from another ex-periment using also on-line technique [42].
V. DISCUSSION
A. Antiprotons versus other projectiles
The properties of reactions induced by stopped an-tiproton absorption can be investigated by comparisonwith yield distributions obtained for other, more ”clas-sical” projectiles. We have confined this comparisonto the gold target as the literature is quite rich here[27, 28, 36, 39, 43, 44, 45]. The two other popularneighbor-mass targets, Pb and Ta, represent rather dif-ferent decay scenarios, with respectively more and lesspronounced fission channel.
1. Mass yield curve
First, we present a rather qualitative comparison withthe yield curve shapes extracted for protons. Figure5 shows the summed isobaric Y (A) yield obtained forstopped antiprotons plotted together with yield distri-butions resulting from Au fragmentation by 0.49, 0.8,1.0 and 3.0 GeV protons [27, 29, 30]. Since the yieldsfor stopped antiprotons and protons are measured in dif-ferent units, we have normalized our yield axis with an

9
FIG. 5: Comparison of the mass yield distribution obtainedfor protons and stopped antiprotons. Curves for protons at0.49 GeV, 1.0 GeV and 3.0 GeV adopted from [27], for theinverse kinematic reaction of Au on H at 800 MeV from [29,30]. The yield axis for antiprotons was normalized with afactor of 1.75.
arbitrary factor equal to 0.57, providing the concordancebetween p’s and 1 GeV protons results in the 150-170mass range. It should be stated here that the yield curvepresented for fission residues in the case of 1 GeV protonswas fitted with only 5 mass points [27].
The most striking differences between the curves shownin Fig. 5 are seen for the fission region. The fission prob-ability for gold excited by protons, estimated as in Sec.IV, is equal to ≈ 6.5%, ≈ 3.7% and ≈ 3.3% for 1 GeV, 0.8GeV and 0.49 GeV protons, respectively. Then, 800 MeVprotons seem to correspond to stopped antiprotons, butfission takes only a small part of the total yield and thecomparison of distribution shapes in the evaporation re-gion is much more adquate. Such inspection leads to theconclusion that stopped antiprotons match with protonsat 1 GeV.
Besides the level and width of the fission hump, a sec-ond major feature distinguishing the mass yield shapesobserved for stopped antiprotons and protons is the dis-tribution for the heaviest masses close to the target.Here the experimental situation is much better than inthe fission case: more reliable nuclear spectroscopy datais additionally confirmed by the results of inverse kine-matic measurements. The yield distribution for protonsis rather unchanged in energy range from 0.5 to 1 GeVand forms a plateau between A ≈ 175 and A ≈ 194. Onthe contrary, for antiprotons in this mass range, not onlyfor the gold target [15, 16, 35], the yield slowly decreasesfrom A ≈ AT−20 toA ≈ (AT−3) and then strongly rises,reaching an absolute maximum at A = (AT − 1). Theenhancement of yield for few masses closest to the targetmay be explained by two mechanisms. The first one isthe soft antiproton absorption, where almost all annihi-lation pions miss the rest of the target nucleus. Then the
FIG. 6: Average mass removal from the Au targets irradiatedwith: N, pions; •, protons (Refs. cited in Table III) andstopped antiprotons (pion data are shifted right by the π restmass). The hatched band shown for antiproton data reflectsthe error in ∆A and a possible range of energy deposition forstopped p annihilation with one of the target nucleons.
(AT − 1) nuclei are left with very low excitation energy.Only after antiproton absorption on nucleons occupyinga deeper states [46] rearrangement of nucleon configura-tions results in a mass loss of one or two additional units.The probability of the production of (AT − 1) nuclei isquite large, about 10% for targets used in our nuclearperiphery studies [25, 26] and the results obtained forgold are also of this order of magnitude (cf. Table I).The second mechanism leading to low excitation ener-gies is the class of all processes where the annihilationpions escape unabsorbed by the target nucleus but dueto the sizeable total π-nucleus cross section excite thisnucleus enough to emit few nucleons. The probabilityof such kind of quasi-elastic meson escapes may be quitelarge when the nuclear diffuseness and partial opacity areconsidered [47].A quantitative comparison between antiprotons and
other projectiles is presented in Table III and Fig. 6.For this purpose we have calculated the average massremoved from the target, ∆A, defined as:
∆A = A⋆T −
∫ Amax
Amin
Y (A)AdA
∫ Amax
Amin
Y (A)dA
, (11)
where A⋆T equals AT for protons and pions or AT − 1 for
antiprotons. Amin is the lower integration limit adjustedto get all single heavy residues and Amax is equal to AT
for protons and pions or to AT − 2 for antiprotons. Theresidual mass AT − 1 is ignored in the integration of thereaction yields for antiprotons since it attests no reaction(soft p absorption).To get consistent and comparable results, for each data

10
set taken from the literature we have applied a uniformmethod to determine ∆A. Only experimental data repre-senting the highest (approximately the whole) cumulativeyield for a given A were used to construct the mass yielddistribution curve. The absolute errors of the quantitiespresented in Table III were estimated to be of the orderof 10-20%, but the relative errors should be smaller. Inaddition to proton data, results for pions absorbed by thegold target are presented, their energy range is limitedas compared to the rest of data but coincides with thekinetic energy of pions emitted in antiproton annihila-tion. The average mass removal from the target nucleussmoothly correlates with the projectile energy. As canbe seen from Table III and Fig. 6, the average massremoved from the gold target by stopped antiprotons isonly slightly lower than ∆A obtained for 1 GeV protons.
2. Charge distribution
The information on the reaction mechanism, obtainedfrom the investigation of mass yield distributions, maybe enriched by the examination of other features of theY (A,Z) yield topography. Two such properties werecompared for results of gold fragmentation by antipro-tons and other projectiles: the course of the fitted Zp
path and the charge dispersion width. Figure 7 illustratessuch an inspection for some cases quoted in Table III. Tobring differences into prominence, we have recalculatedZp(A) to its distance δstab from the line modeling thebeta stability valley Zβ (defined as in the caption to Fig.1). Such a presentation was earlier applied to study the
TABLE III: Characteristics of the mass yield distribution af-ter the reaction of different projectiles with a gold nuclei.
Projectile Energy ∆A Ref.[GeV]
π+,− 0.0 7.2 ± 1.1 [48]π+,− 0.1 8.7 ± 1.0 [44]π+,− 0.18 10.4 ± 1.2 [44]π+,− 0.3 12.2 ± 1.3 [44]p 0.2 8.6 ± 1.1 [27]p 0.49 14.9 ± 1.8 [27]p 0.8a 17.0 ± 1.4 [45]p 0.76 17.8 ± 2.3 [28]p 0.8 18.0 ± 2.3 [28]p 1.0 20.7 ± 2.8 [27]p 1.2 23.2 ± 3.2 [28]p 1.6 26.5 ± 3.4 [28]p 2.6b 30.1 ± 1.9 [36]p 3.0 30.6 ± 4.3 [27]p 11.5 30.3 ± 4.2 [43]p 800.0 26.1 ± 3.7 [39]p 0.0b 17.3 ± 1.3 [37]p 0.0 20.0 ± 0.8 this work
aInverse kinematic reaction.bFit for generalized formula.
FIG. 7: Upper part: Distance of the fitted most probable Zfrom the beta stability line: protons/heavy ions compilationat saturation limit [36], antiprotons at rest energy compilation[37], Au at 800 MeV on H [29, 30], protons at 11.5/300 GeV[43], protons at 3/6 GeV [27] and fission for protons at 1 GeV[27]. Lower part: Charge distribution widths as a function ofresidue mass. The results of the same evaluations as in theupper part are presented (with unchanged notation), exceptfor protons at 1 GeV and at 3/6 GeV, for which the widthparameter is equal to that obtained for 11.5/300 GeV [27].
distribution of products of gold projectile fragmentationon C and Al targets [49]. To compare with our resultswe present δstab obtained for the inverse kinematic Au +p reaction at 800 MeV [29, 30] and for energetic protons[27, 43]. Besides this, we have also plotted curves derivedfor the Au target from a general formulae describing theZp(A) path for products of various medium and heavytarget fragmentations induced with protons at the frag-mentation limit [36] and with stopped antiprotons [37].The lower part of Fig. 7 shows the dependence of thecharge distribution width on the product mass.
As can be seen from Fig. 7, the relative course of Zp
and Zβ for stopped antiprotons changes now much moredramatically than in Fig. 1. The δstab calculated formore general Y (A,Z) models [36, 37] is smooth due tothe broad A range fitting. ZP fitted for 11.5 and 300GeV protons [43] lies very close to this curves in theevaporation residues region. Surprisingly, Zp derived forthe inverse reaction at smaller energy extends farther to-wards the neutron-deficient nuclei for heavy products. Inthe fission region the situation is reversed except for thelightest products. The curve plotted for 3 and 6 GeV

11
protons lies closer to the valley of stability, for 1 GeVprotons only the fission region is represented as there areno fit parameters given in Ref. [27].When Y (A,Z) models are applied to shorter mass
ranges a rather non-continuous behavior with segmentsof rapidly changing position and orientation is observed.This happens both for protons [39] and heavy ions[50, 51, 52] investigated with γ-ray spectroscopy tech-nique and for heavy ion reactions on Au studied with theinverse kinematic technique [49]. Obviously, this situa-tion cannot be ascribed merely to the uncertainties of theexperimental data, even in the worst cases. In our case,the experimental data distribution in the N − Z planeshown in Fig. 1 strongly favors the segmentation of theevaporation region in fitting.Generally, lower energy reactions lead to Zp running
closer the valley of stability, with passages to the neutron-rich side for fission fragments. Antiproton data show apeculiar tendency: although Zp lies quite away from thevalley of stability for evaporation residues, it does notreach such a neutron-deficient region as the energetic pro-tons. Such a behavior may be partially explained by theinfluence of shell effects observed in antiproton distribu-tion for N/Z crossings at 106/76, 82/64 and 50/40. TheY (A,Z) yield reaches local maxima in these regions, themost probable Z goes towards the more neutron-deficientnuclei and the charge dispersion becomes broader, as canbe seen from Fig. 7.The width of the Z distribution, σ, was found to de-
crease smoothly with decreasing A when a generalizedapproach is used for protons [36] or antiprotons [37].On the contrary, results of fitting within shorter massregions are again inconsistent with compilations usingbroad mass regions, with quite small widths for evapo-ration residues and with a large scatter of σ for fissionfragments [39, 51, 52]. For antiprotons stopped in Au thecharge width is rather small in the evaporation region, es-pecially in comparison with 800 MeV/nucleon Au on Hdata. On the other hand, products of fission induced bystopped antiprotons are distributed quite broadly, simi-larly to the proton reaction products.From a methodological point of view, results on Zp(A)
and σ(A) fitted in different ways are not consistent, evenfor protons at similar energies. The Y (A,Z) modelingapplied for wide mass regions may be reasonable for lim-ited experimental data and for generalization purposes,however, this approach washes out any possible feature ofmore discrete nature. Hence, the division of input data tosome A subregions should work better in detailed studies,especially for lower excitation reactions.
B. Antiprotons stopped in various targets
There were many other targets irradiated with low en-ergy antiprotons from LEAR [12, 13, 14, 15, 16, 35]. Areview of some results of these experiments will allowus to look closer at antiproton induced reactions. Mass-
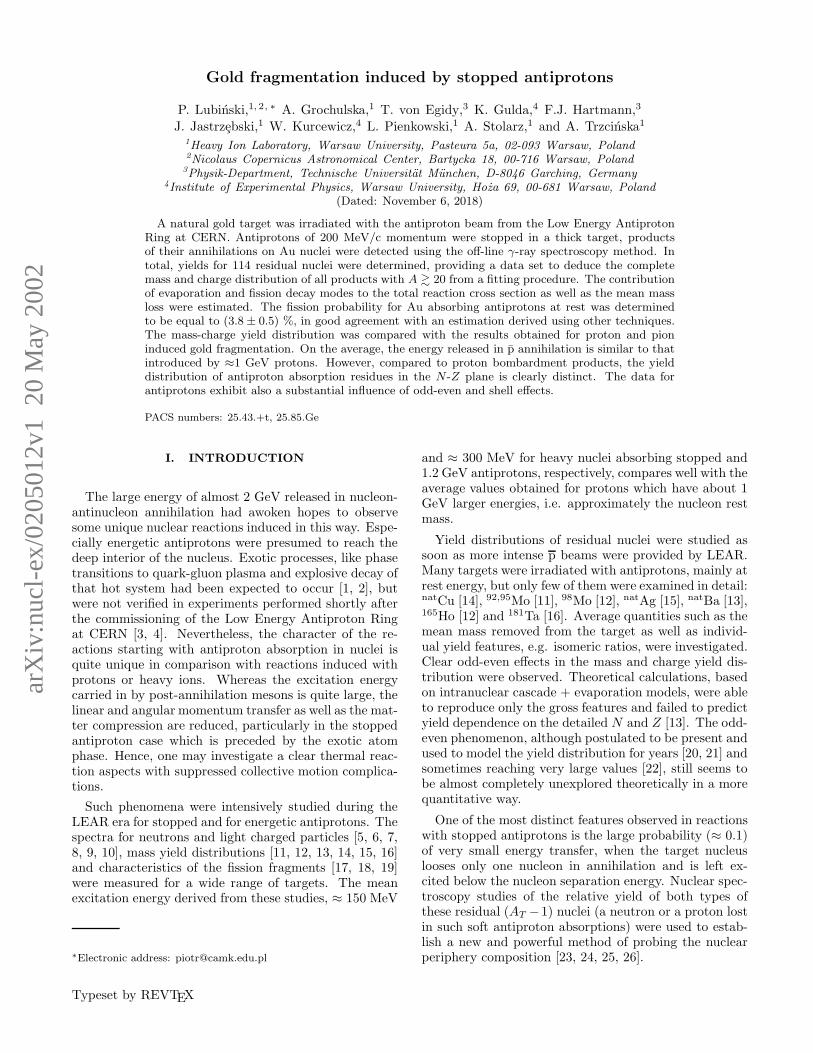
charge yield models were fitted only for a part of thesetargets, the parameters of the mass yield distributions forthe rest were evaluated on the basis of summed direct ex-perimental Y (A) yields. However, either for the formeror the latter results, the yields for the heaviest nuclei,close to the target, are underestimated since a significantpart of the total Y(A) is hidden in non-detectable iso-topes. To take this effect into account, we recalculated∆A values obtained for other targets in the way as itwas done for Au (see Sec. VA). The results are listedin Table IV. The removed mass increases with increas-ing target mass, as illustrated in Fig. 8. Such behavioris consistent with the simple geometrical picture of anexcitation energy proportional to the number of partic-ipating nucleons [8], hence to the volume of the nucleusbombarded with annihilation mesons.
TABLE IV: Characteristics of mass yield distribution afterantiproton stopping in different targets.
Target ∆A Ref.natCu 13.9± 1.8 [14]96Ru 15.8± 1.9 [35]96Zr 16.2± 2.0 [35]98Mo 16.2± 2.1 [12]106Cd 16.4± 2.3 [35]natAg 17.7± 1.8 [15]130Te 18.9± 1.6 [35]natBa 17.9± 2.1 [13]144Sm 17.5± 1.9 [35]148Nd 19.4± 2.0 [35]160Gd 19.2± 2.2 [35]165Ho 21.7± 2.5 [12]176Yb 21.1± 2.0 [35]natTa 22.4± 2.2 [16]natAu 20.0± 0.8 this work
Using the ∆A value obtained for the Au target wemay estimate the mean thermal excitation energy of thedecaying system. The compilation of the measured par-ticle emission [5, 6, 8] gives 5.4 nucleons ejected in thecascade+preequilibrium stages through n, p, d, t, 3Heand 4He ejectiles. Hence we have on the average 14.6evaporated nucleons and assuming 8 MeV separation en-ergy and 3 MeV kinetic energy per nucleon [8] leads to(161±23) MeV stored in the thermalized system. Such aresult compares nicely with the value of (183± 21) MeVderived from the measurements of the spectra of neutronsand of light charged particles [8].
C. Odd-even effects
Data on odd-even and shell effects observed in theY (A,Z) yield distribution are rather rarely discussed inthe yield modeling context [20, 21, 37]. Their influence onthe yields is difficult to observe if the experimental dataset is limited and errors are of the order of the possible
12
FIG. 8: Average mass removed from different targets afterstopped antiproton absorption. Results from earlier experi-ments studying mass yield curves [12, 13, 14, 15, 16, 35], arerecalculated after yield correction for the heaviest products.
odd-even correction. The conclusion of Rudstam [20],looking for a general formula predicting cross sectionsfor p and α induced reactions, was that there is no needto introduce such a correction as the experiment/modelyield ratios for various N and Z combinations do not showany clear correlation with the nucleon number evenness.Later, Silberberg and Tsao [21] found a moderate effect,modeled with factors equal to 1.25, 0.9, 1.0 and 0.85 foreven-even, odd-N, odd-Z and odd-odd (N,Z) pairs, re-spectively.Since off-line nuclear spectroscopy was applied to study
the Y (A,Z) distribution the odd-even effect was observedin reactions induced with stopped antiprotons [12, 13].Results for lighter targets (92,95,98Mo, natBa) are consis-tent, with an 18-26 % correction for odd-Z nuclei anda 32-34 % correction for odd-N nuclei (and the sum ofthese values in the odd-odd case). Corresponding valuesfitted for 165Ho [12] are not so evident, the yield of odd-Nnuclei is strongly reduced (by ≈ 66%) whereas there is noneed to correct the odd-Z results. Because these fits weremade simultaneously for the whole heavy residue region,no dependence on the emitted number of nucleons (henceexcitation) was studied, also no indication for any shelleffects was reported.Using the heavy and fissionable gold nuclei to absorb
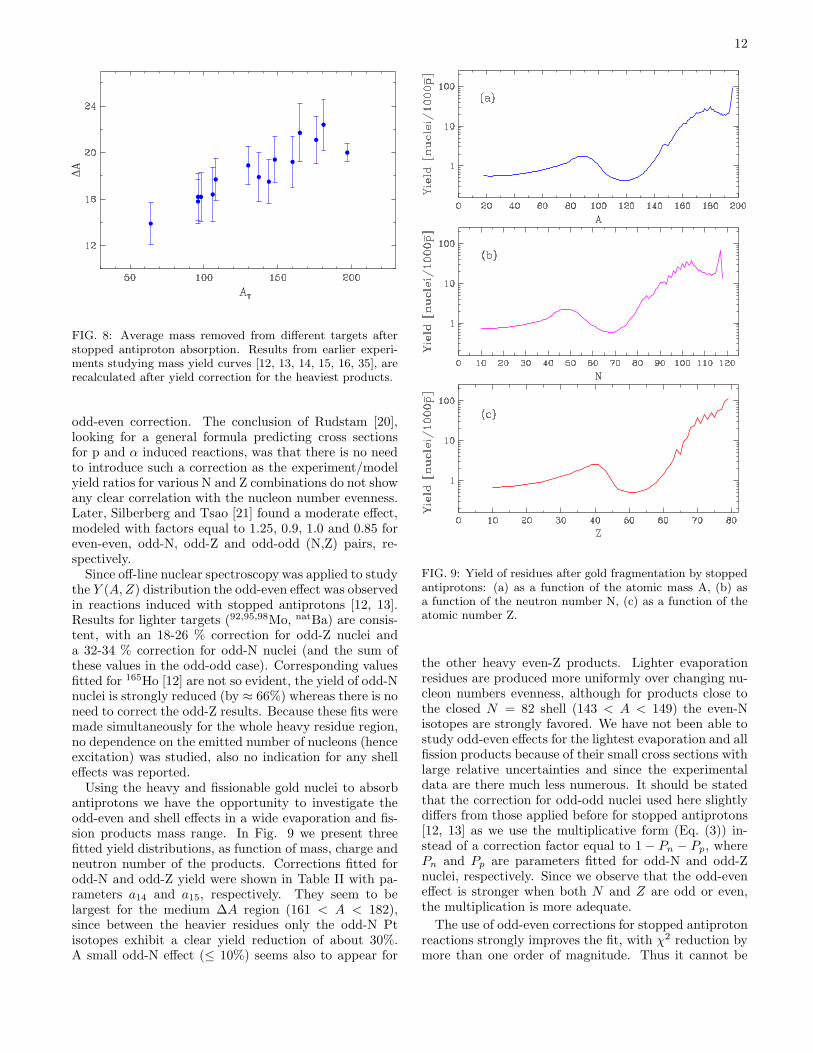
antiprotons we have the opportunity to investigate theodd-even and shell effects in a wide evaporation and fis-sion products mass range. In Fig. 9 we present threefitted yield distributions, as function of mass, charge andneutron number of the products. Corrections fitted forodd-N and odd-Z yield were shown in Table II with pa-rameters a14 and a15, respectively. They seem to belargest for the medium ∆A region (161 < A < 182),since between the heavier residues only the odd-N Ptisotopes exhibit a clear yield reduction of about 30%.A small odd-N effect (≤ 10%) seems also to appear for
FIG. 9: Yield of residues after gold fragmentation by stoppedantiprotons: (a) as a function of the atomic mass A, (b) asa function of the neutron number N, (c) as a function of theatomic number Z.
the other heavy even-Z products. Lighter evaporationresidues are produced more uniformly over changing nu-cleon numbers evenness, although for products close tothe closed N = 82 shell (143 < A < 149) the even-Nisotopes are strongly favored. We have not been able tostudy odd-even effects for the lightest evaporation and allfission products because of their small cross sections withlarge relative uncertainties and since the experimentaldata are there much less numerous. It should be statedthat the correction for odd-odd nuclei used here slightlydiffers from those applied before for stopped antiprotons[12, 13] as we use the multiplicative form (Eq. (3)) in-stead of a correction factor equal to 1 − Pn − Pp, wherePn and Pp are parameters fitted for odd-N and odd-Znuclei, respectively. Since we observe that the odd-eveneffect is stronger when both N and Z are odd or even,the multiplication is more adequate.
The use of odd-even corrections for stopped antiprotonreactions strongly improves the fit, with χ2 reduction bymore than one order of magnitude. Thus it cannot be

13
treated as a trivial improvement via adding another pa-rameter. Moreover, since corrections obtained for differ-ent mass regions are consistent, therefore, taking into ac-count previous results obtained for lighter targets [12, 13]the inclusion of such a component is unavoidable in cor-rect modeling of the data coming from experiments withstopped antiprotons. Its strength, more pronounced thanin the corresponding energetic proton data at 800 MeV[29, 30], is one of the most distinct features of the an-tiproton absorption induced reactions.
VI. CONCLUSIONS
The independent and/or cumulative yields for 114 iso-topes produced after absorption of stopped antiprotonsin gold were measured by using the off-line γ-ray spec-troscopy technique. On this basis, with the help of a phe-nomenological model, the whole yield distribution wasextracted for residues ranging from the target mass mi-nus one down to the light fission products with mass≥ 20.The fission probability was estimated to be (3.8± 0.5)%,in agreement with the results of measurements using on-line techniques.An average thermal excitation energy, gained by the
Au nucleus after p annihilation, was shown to be quitesimilar to that of 1 GeV protons, although the fissionprobability for such protons is almost twice as large.Moreover, the inspection of the yield distribution over
the A-Z plane indicates a fairly peculiar character of thereaction induced with low energy antiprotons. The mostprobable Z course is quite different, lying closer to thestability line and exhibiting a more complex shape. Fur-thermore, the charge dispersion over Z does not comparewith that observed for 0.8 GeV protons, being almosttwice as narrow.The average mass removal observed for various targets
reacting with stopped antiprotons rises linearly with in-creasing target mass. This behavior is consistent with in-beam studies of the light particle emission. ∆A derivedfrom mass yield data helps to complete such measure-ments, unable to detect charged particles of the lowestenergy.A clear odd-even and some shell effects distinguish ev-
idently the reaction with stopped antiproton from thoseinduced with energetic protons. For the first time thedependence of this phenomenon on the residue mass wasstudied. The strength of such effects seems to diminishwith the excitation energy, although for long evaporationchains and fission products it may be unobserved due toscarce and uncertain data.
Acknowledgments
This work was supported by the Polish State Com-mittee for Scientific Research and by the German Bun-desministerium fur Forschung und Technologie, Bonn.
[1] J. Rafelski, Phys. Lett. B 91, 281 (1980).[2] M. R. Clover, R. M. DeVries, N. J. DiGiacomo, and
Y. Yariv, Phys. Rev. C 26, 2138 (1982).[3] F. Balestra, S. Bossolasco, M. P. Bussa, L. Busso, L. Fer-
rero, A. Grasso, D. Panzieri, G. Piragino, T. Tosello,G. Bendiscioli, et al., Nucl. Phys. A 452, 573 (1986).
[4] M. P. McGaughey, K. D. Bol, M. R. Clover, R. M. De-Vries, N. J. DiGiacomo, J. S. Kapustinsky, W. E. Sond-heim, G. R. Smith, J. W. Sunier, Y. Yariv, et al., Phys.Rev. Lett. 56, 2156 (1986).
[5] W. Markiel, H. Daniel, T. von Egidy, F. J. Hartmann,P. Hofmann, W. Kanert, H. S. Plendl, K. Ziock, R. Mar-shall, H. Machner, et al., Nucl. Phys. A 485, 445 (1988).
[6] P. Hofmann, F. J. Hartmann, H. Daniel, T. von Egidy,W. Kanert, W. Markiel, H. S. Plendl, H. Machner,G. Riepe, D. Protic, et al., Nucl. Phys. A 512, 669 (1990).
[7] H. Machner, S. Jun, G. Riepe, D. Protic, H. Daniel,T. von Egidy, F. J. Hartmann, W. Kanert, W. Markiel,H. S. Plendl, et al., Z. Phys. A 343, 73 (1992).
[8] D. Polster, D. Hilscher, H. Rossner, T. von Egidy, F. J.Hartmann, J. Hoffmann, W. Schmid, I. A. Pshenichnov,A. S. Iljinov, Y. S. Golubeva, et al., Phys. Rev. C 51,1167 (1995).
[9] F. Goldenbaum, W. Bohne, J. Eades, T. von Egidy,P. Figuera, H. Fuchs, J. Galin, Y. S. Golubeva, K. Gulda,D. Hilscher, et al., Phys. Rev. Lett. 77, 1230 (1996).
[10] B. Lott, F. Goldenbaum, A. Bohm, W. Bohne, T. vonEgidy, P. Figuera, J. Galin, D. Hilscher, U. Jahnke,
J. Jastrzebski, et al., Phys. Rev. C 63, 034616 (2001).[11] E. F. Moser, H. Daniel, T. von Egidy, F. J. Hartmann,
W. Kanert, G. Schmidt, M. Nicholas, and J. J. Reidy,Phys. Lett. B 179, 25 (1986).
[12] E. F. Moser, H. Daniel, T. von Egidy, F. J. Hartmann,W. Kanert, G. Schmidt, Y. S. Golubeva, A. S. Iljinov,M. Nicholas, and J. J. Reidy, Z. Phys. A 333, 89 (1989).
[13] T. von Egidy, H. Daniel, F. J. Hartmann, W. Kanert,E. F. Moser, Y. S. Golubeva, A. S. Iljinov, and J. J.Reidy, Z. Phys. A 335, 451 (1990).
[14] J. Jastrzebski, W. Kurcewicz, P. Lubinski,A. Grabowska, A. Stolarz, H. Daniel, T. von Egidy, F. J.Hartmann, P. Hofmann, Y. S. Kim, et al., Phys. Rev. C47, 216 (1993).
[15] A. Szmalc, Master’s thesis, Warsaw University (1992),unpublished.
[16] K. Gulda, Master’s thesis, Warsaw University (1993), un-published.
[17] P. Hofmann, A. S. Iljinov, Y. S. Kim, M. V. Mebel,H. Daniel, P. David, T. von Egidy, T. Haninger, F. J.Hartmann, J. Jastrzebski, et al., Phys. Rev. C 49, 2555(1994).
[18] Y. S. Kim, A. S. Iljinov, M. V. Mebel, P. Hofmann,H. Daniel, T. von Egidy, T. Haninger, F. J. Hartmann,H. Machner, H. S. Plendl, et al., Phys. Rev. C 54, 2469(1996).
[19] U. Jahnke, W. Bohne, T. von Egidy, P. Figuera, J. Galin,F. Goldenbaum, D. Hilscher, J. Jastrzebski, B. Lott,

14
M. Morjean, et al., Phys. Rev. Lett. 83, 4959 (1999).[20] G. Rudstam, Z. Naturforsch. A 21, 1027 (1966).[21] R. Silberberg and C. H. Tsao, Astrophys. J. Suppl. 25,
315 (1973).[22] S. V. Tipnis, J. M. Campbell, G. P. Couchell, S. Li, H. V.
Nguyen, D. J. Pullen, W. A. Schier, E. H. Seabury, andT. R. England, Phys. Rev. C 58, 905 (1998).
[23] J. Jastrzebski, H. Daniel, T. von Egidy, A. Grabowska,Y. S. Kim, W. Kurcewicz, P. Lubinski, G. Riepe,W. Schmid, A. Stolarz, et al., Nucl. Phys. A 558, 405c(1993).
[24] P. Lubinski, J. Jastrzebski, A. Grochulska, A. Stolarz,A. Trzcinska, W. Kurcewicz, F. J. Hartmann, W. Schmid,T. von Egidy, J. Skalski, et al., Phys. Rev. Lett. 73, 3199(1994).
[25] P. Lubinski, J. Jastrzebski, A. Trzcinska, W. Kurcewicz,F. J. Hartmann, W. Schmid, T. von Egidy,R. Smolanczuk, and S. Wycech, Phys. Rev. C 57,2962 (1998).
[26] R. Schmidt, F. J. Hartmann, B. Ketzer, T. von Egidy,T. Czosnyka, J. Jastrzebski, M. Kisielinski, P. Lubinski,P. Napiorkowski, L. Pienkowski, et al., Phys. Rev. C 60,054309 (1999).
[27] S. B. Kaufman and E. P. Steinberg, Phys. Rev. C 22,167 (1980).
[28] R. Michel, R. Bodemann, H. Busemann, R. Daunke,M. Gloris, H.-J. Lange, B. Klug, A. Krins, I. Leya,M. Lupke, et al., Nucl. Inst. Meth. B129, 153 (1997).
[29] F. Rejmund, B. Mustapha, P. Armbruster, J. Benlli-ure, M. Bernas, A. Boudard, J. P. Dufour, T. Enqvist,R. Legrain, S. Leray, et al., Nucl. Phys. A 683, 540(2001).
[30] J. Benlliure, P. Armbruster, M. Bernas, A. Boudard, J. P.Dufour, T. Enqvist, R. Legrain, S. Leray, B. Mustapha,F. Rejmund, et al., Nucl. Phys. A 683, 513 (2001).
[31] J. Jastrzebski, P. Lubinski, and A. Trzcinska, Acta. Phys.Pol. B 26, 467 (1995).
[32] V. B. Zlokazov, Nucl. Inst. Meth. 199, 509 (1982).[33] W. Karczmarczyk, M. Kowalczyk, and L. Pienkowski,
adaptation for PC.[34] R. B. Firestone, Table of Isotopes (Wiley, New York,
1996).[35] P. Lubinski, Ph.D. thesis, Warsaw University, Warsaw
(1997), unpublished.[36] K. Summerer, W. Bruchle, D. J. Morrisey, M. Schadel,
B. Szweryn, and Y. Weifan, Phys. Rev. C 42, 2546(1990).
[37] T. von Egidy and H. H. Schmidt, Z. Phys. A 341, 79(1991).
[38] P. Marmier and E. Sheldon, Physics of Nuclei and Par-
ticles, vol. I (Academic, New York and London, 1971).[39] L. Sihver, K. Aleklett, W. Loveland, P. L. McGaughey,
D. H. E. Gross, and H. R. Jaqaman, Nucl. Phys. A 543,703 (1992).
[40] P. Kozma, C. Damdinsuren, D. Chultem, and B. Tu-mendemberel, J. Phys. G 17, 675 (1991).
[41] W. Schmid, P. Baumann, H. Daniel, T. von Egidy, F. J.Hartmann, J. Hoffmann, Y. S. Kim, H. H. Schmidt, A. S.Iljinov, M. V. Mebel, et al., Nucl. Phys. A 569, 689(1994).
[42] J. P. Bocquet, F. Malek, H. Nifenecker, M. Rey-Campagnolle, M. Maurel, E. Monnand, C. Perrin, C. Ris-tori, G. Ericsson, T. Johansson, et al., Z. Phys. A 342,183 (1992).
[43] S. B. Kaufman, M. W. Weisfield, E. P. Steinberg, B. D.Wilkins, and D. Henderson, Phys. Rev. C 14, 1121(1976).
[44] S. B. Kaufman, E. P. Steinberg, and G. W. Butler, Phys.Rev. C 20, 2293 (1979).
[45] B. Mustapha, Ph.D. thesis, University Paris, Orsay(1999).
[46] S. Wycech, J. Skalski, R. Smolanczuk, J. Dobaczewski,and J. R. Rook, Phys. Rev. C 54, 1832 (1996).
[47] J. Cugnon, S. Wycech, J. Jastrzebski, and P. Lubinski,Phys. Rev. C 63, 027301 (2001).
[48] H. S. Pruys, R. Engfer, R. Hartmann, U. Sennhauser, H.-J. Pfeiffer, H. K.Walter, J. Morgenstern, A. Wyttenbach,E. Gadioli, and E. Gadioli-Erba, Nucl. Phys. A 316, 365(1979).
[49] G. A. Souliotis, K. Hanold, W. Loveland, I. Lhenry, ,D. J. Morrissey, A. C. Veeck, and G. J. Wozniak, Phys.Rev. C 57, 3129 (1998).
[50] H. Kudo, K. J. Moody, and G. T. Seaborg, Phys. Rev. C30, 1561 (1984).
[51] W. Loveland, K. Aleklett, L. Sihver, Z. Xu, C. Casey,D. Morrissey, J. Liljenzin, M. de Saint-Simon, andG. Seaborg, Phys. Rev. C 41, 973 (1990).
[52] W. Loveland, M. Hellstrom, L. Sihver, and K. Aleklett,Phys. Rev. C 42, 1753 (1990).

![arXiv:nucl-ex/0611012 v1 9 Nov 2006kperl/HIP/QGP_MATTER_revier_11_2006.pdf · • Parton structure and evolution at small-x: HERA data [7] indicates that when probed at high energies,](https://static.fdocuments.net/doc/165x107/5f53f92d1c854e7f6670ca6f/arxivnucl-ex0611012-v1-9-nov-kperlhipqgpmatterrevier112006pdf-a-parton.jpg)