arXiv:astro-ph/9711251v1 21 Nov 1997 · arXiv:astro-ph/9711251v1 21 Nov 1997 OUR BEST FRIEND, THE...
35
arXiv:astro-ph/9711251v1 21 Nov 1997 OUR BEST FRIEND, THE COMA CLUSTER (A HISTORICAL REVIEW) Andrea BIVIANO Istituto Te.S.R.E., Area della Ricerca del CNR, via Gobetti 101, I-40129 BOLOGNA E-mail: [email protected] In this paper I describe how our knowledge and understanding of the properties and structure of the Coma cluster of galaxies has evolved through the years, since early this century, when the first maps of the density of nebulæ in the Coma region were produced, and until the present time. It is shown that most of the recent discoveries that have led to a change in our view of this cluster, were in fact anticipated very early on. 1 Introduction: Why Coma? Coma is one of the most studied clusters of galaxies of the sky, along with Virgo and Perseus a . While being the most distant of the three, with a mean redshift z ≃ 0.23, Coma has also been the most appealing to observers because of its location near the galactic pole (bII= 88 ◦ ) and because of its richness b . Another characteristic that differentiates Coma from Virgo and Perseus is its regular and (roughly) spherical shape. In Shane & Wirtanen 122 ’s words: There appear to be two extreme structuraltypes among the pop- ulous clusters, exemplified by the Virgo and the Coma clusters. The Virgo type is characterized by the absence of a strong central con- densation and by lack of symmetry [. . . ] The Coma-type cluster is characterized by a strong central condensation and a tendency towards spherical symmetry. What could be more charming than spherical symmetry (even if only ap- proximate, see e.g. Schipper & King 119 ) for a theoretician? It is indeed not surprising that Coma has been chosen as the prototype cluster by theoreti- cians, since the early papers of Zwicky 163, 164 and others (e.g. Carpenter 25 , Holmberg 70 , Tuberg 141 ), and until the recent estimates of the density of matter in the Universe (e.g. the ”baryon catastrophe” of Briel et al. 19 ) and recent a Of the three clusters, Perseus was never dedicated a whole conference, while it was the case for Virgo 148 and Coma (these proceedings). b Of the nearby clusters (distance class ≤ 1) only five are as rich or richer than Coma (according to Abell et al. 6 ).
Transcript of arXiv:astro-ph/9711251v1 21 Nov 1997 · arXiv:astro-ph/9711251v1 21 Nov 1997 OUR BEST FRIEND, THE...

arX
iv:a
stro
-ph/
9711
251v
1 2
1 N
ov 1
997
OUR BEST FRIEND, THE COMA CLUSTER(A HISTORICAL REVIEW)
Andrea BIVIANO
Istituto Te.S.R.E.,
Area della Ricerca del CNR, via Gobetti 101, I-40129 BOLOGNA
E-mail: [email protected]
In this paper I describe how our knowledge and understanding of the propertiesand structure of the Coma cluster of galaxies has evolved through the years, sinceearly this century, when the first maps of the density of nebulæ in the Comaregion were produced, and until the present time. It is shown that most of therecent discoveries that have led to a change in our view of this cluster, were in factanticipated very early on.
1 Introduction: Why Coma?
Coma is one of the most studied clusters of galaxies of the sky, along withVirgo and Perseusa. While being the most distant of the three, with a meanredshift z ≃ 0.23, Coma has also been the most appealing to observers becauseof its location near the galactic pole (bII= 88◦) and because of its richnessb.
Another characteristic that differentiates Coma from Virgo and Perseus isits regular and (roughly) spherical shape. In Shane & Wirtanen122’s words:
There appear to be two extreme structural types among the pop-ulous clusters, exemplified by the Virgo and the Coma clusters. TheVirgo type is characterized by the absence of a strong central con-densation and by lack of symmetry [. . . ] The Coma-type clusteris characterized by a strong central condensation and a tendencytowards spherical symmetry.
What could be more charming than spherical symmetry (even if only ap-proximate, see e.g. Schipper & King119) for a theoretician? It is indeed notsurprising that Coma has been chosen as the prototype cluster by theoreti-cians, since the early papers of Zwicky163,164 and others (e.g. Carpenter25,Holmberg70, Tuberg141), and until the recent estimates of the density of matterin the Universe (e.g. the ”baryon catastrophe” of Briel et al.19) and recent
aOf the three clusters, Perseus was never dedicated a whole conference, while it was the casefor Virgo148 and Coma (these proceedings).bOf the nearby clusters (distance class ≤ 1) only five are as rich or richer than Coma(according to Abell et al.6).

Figure 1: The number of papers published on the Coma cluster through the years (dashedline), and the ratio between the number of papers published on Coma and the number ofpapers published on galaxy clusters in general (solid line).
scenarios for the structure formation (e.g. the ”filament” scenario of West etal.154).
Nevertheless, Coma’s richness and regularity are not typical of all clusters.As Kent & Gunn78 pointed out:
Coma is quite atypical among clusters in its richness, compact-ness, and degree of symmetry.
On the other hand, the title of this conference indicates that we now have ”anew vision” of Coma, that emerged through the (once controversial) works ofmany people (e.g. Fitchett & Webster47, Mellier et al.93). As Biviano et al.16
wrote:
Coma can now be considered as the prototype of rich clustersendowed with subclusters, and thus not fully relaxed
The interest of the astronomical community in Coma can be traced bycounting the number of publications dealing with this cluster, through theyears. While the total number of publications on Coma has continuously in-creased with time (Fig.1), the increase rate diminished in the 70’s, when Comabecame one of many well-studied clusters. This can be also seen by plottingthe same number divided by the number of publications on galaxy clusters in

general (Fig.1): there is a continuously decreasing trend from the 70’s on. Nodoubt the proceedings of this conference will mark a change in this trend!
In the next sections I will describe how our vision of Coma has evolvedthrough the yearsc. For topics not covered in this review, I refer the reader tothe contributions of Feretti, Gavazzi, Jones, and West in these same proceed-ings.
2 Coma: an Old Friend
2.1 The Myth
The origin of the name ”Coma Berenices” dates back to the year ∼ 245 B.C,when Ptolemy III, the Egypt pharaon, left his country to make war againstSyria. His wife, Berenices, worried for her husband’s safety, offered a lock ofher hairs to the goddess Arsinœs Zephiritis in the temple of Canopus (neartoday’s Abuqır).
The lock misteriously disappeared during the night, and princess Berenicesfelt very sad about what she considered a bad omen. Conon, the court as-tronomer, told the princess that the lock had been transformed into a starconstellation, Coma Berenices, i.e. Berenices’ hairs.
Apparently, the goddess appreciated Berenices’ offer, infact Ptolemy cameback safe. Berenices had a pleasant and rich life until she was killed by one ofher sons.
It was not until 1629 that the constellation name was used again, by Kepler.
2.2 The Coma cluster of nebulæ
In historic times, Herschel69 was the first to notice the concentration of neb-ulæ in the constellation of Coma Berenices. A more rigorous catalogationof nebulæ in the Coma region was done by Wolf159,160 in the early years ofthis century (following up an earlier work of D’Arrest32). Wolf counted 108nebulæ in a circle of 30’ diameter. The number of catalogued nebulæ inthe Coma region increased to more than 300 with the observations of Curtis31.Wolf’s map of the density of nebulæ in the Coma region (see Fig.2), alreadyshows the elongated shape of the cluster in the south-west direction, where asecondary density concentration appears to lie (the south-west subcluster, see§ 7.1).
cI have stopped my historical review with the year 1995. More recent works are cited onlyoccasionally (with a possible bias towards my owns!).

Figure 2: The density of nebulae in the region of Coma, according to Wolf. Note the south-western extension (north is up, east is to the left). Every grid element is 28’×60’.
Hubble & Humason71 first measured the velocities of a few cluster nebulæ,ranging from 5100 km/s to 8500 km/s (an interval quite close to the real fullextension of Coma in velocity space – see, e.g. Gavazzi et al.54).
3 Weighing Coma
3.1 Zwicky’s Heresy
The mass of Coma was first estimated by Zwicky162,163 to bed M > 5×10¹⁴M⊙,using the virial theorem. This estimation was based on a value165 of 1200 km/sfor the radial velocity dispersion of the cluster galaxies, σv, not too far fromcurrent estimates (e.g. Colless & Dunn27).
The corresponding mass-to-light ratio was large, M/L > 50M⊙/L⊙, anda form of unvisible matter seemed needed. Zwicky suggested that this darkmatter could be detected as diffuse IC light.
dThroughout this paper I use H0 = 50 km/s/Mpc, and scale all H0-dependent quantitiesaccordingly. Note that the recent measurement of the Sunyaev-Zel’dovich effect in Coma(Herbig et al.68) implies H0 = 71+30
−25km/s/Mpc, consistent with the value adopted here.

Zwicky’s hypothesis of some form of dark matter dominating the clus-ter dynamics, was not accepted by his contemporaries. Holmberg70 consid-ered it ”an unlikely assumption”, and his scepticism was still shared by theBurbidges20 and de Vaucouleurs36 20 years later! However, the alternative hy-pothesis, clusters being unbound and expanding systems, would imply a veryshort timescale for disruption. This was found to be incompatible with thelarge number of galaxy clusters in the sky, and the similarity of nearby anddistant (z ≃ 0.2) clusters (Zwicky169, Limber85).
Had Zwicky grossly overestimated the total cluster mass? Zwicky165 him-self pointed out that the application of the virial theorem may be of onlylimited validity when the system has an irregular distribution of galaxies, im-plicitely questioning the results obtained by Smith126 on the Virgo cluster, andanticipating recent results on clusters affected by substructures. The problemof outliers in the velocity distribution was first considered by Schwarschild120.The lower limit he set to the velocity dispersion of Coma, σv > 630 km/s, wasstill too high to get rid of the dark matter problem.
3.2 More Data!
A step further in the understanding of the mass and structure of Coma wasdone by Mayall91, thanks to the new technology of electronic photography. InFig.3 of his paper ∼ 50 galaxy velocities are plotted vs. clustercentric distance,d, and the decrease of σv with d is already quite evident. Despite this significantprogress, Mayall complained that:
. . . it is doubtful that satisfactory answers will be obtained untilthere are at least a hundred velocities available for discussion, andseveral hundred would be much better. If this is the case, then thecurrent rate of less than 10 velocities per year is impracticably slow.
It is ironic that the actual average rate since the 60’s has been only twice ashighe as the ”impracticably low” rate in Mayall’s times!
The first numerical simulation of the evolution of a Coma-like cluster(Peebles106) showed that the 3D-σv should decrease with increasing cluster-centric distance. Nearly simultaneously, the decrease of projected-σv was ac-tually measured by Rood113 in Coma. He pointed out that such a radial trendof σv could be due to a real dependence of the 3D-σv with radius, or to ananisotropic distribution of galaxy orbits. In the early 70’s Coma M/L estimateswere already quite close to current estimates (see Fig.3).
eThe total number of currently available velocities for Coma cluster galaxies is ≥ 800 (seevan Haarlem’s contribution in these proceedings), i.e. 750 new velocities in the last 37 years.

Figure 3: Several estimates of Coma M/L vs. the year when they were derived. Diamondsrepresent estimates based on optical data, X’s represent estimates based on X-ray data; atriangle represent Zwicky’s original lower limit estimate.
The density profile, accurately determined by Omer et al.104 and Rood etal.115, in combination with the σv-profile (see Fig.4), was used by Rood et al.to derive Coma’s M/L, and constrain the orbital anisotropy of Coma galaxies.They came to the conclusion that the density and velocity dispersion profilesare ”consistent with an isotropic velocity distribution”. Ivan King81, the lastauthor in Rood et al.’s paper, relaxed this conclusion. He noted that, in fact,several distributions of the galaxies and the dark matter were consistent withthe data, and current cluster mass estimates could be systematically in error bya factor three. Ten years after, Kent & Gunn and Bailey13 arrived at (rouhgly)the same conclusions of Rood et al. and, respectively, King!
In the following years, mainly through the observations of Gregory &Tifft60,61,62,138, the total number of measured redshifts for Coma galaxies in-creased to over 200.
3.3 Beyond the Virial Theorem
With some hundreds velocities available, more detailed models became possi-ble. A new heresy came around, the ”binary model” of Valtonen & Byrd143,144,somewhat anticipated in the works of Gainullina51, and Wesson et al.152,153.Valtonen & Byrd suggested that Coma could be dymanically dominated bya tightly bound couple of galaxies (NGC 4874 – NGC 4889). Their model,

Figure 4: The radial velocity dispersion profile of Coma, km/s vs. arcminutes – from Roodet al.
while reducing the global dark-matter discrepancy for the cluster, neverthelessimplied a very large M/L ratio for the two central dominant galaxies (∼ 2000).During the last 40 years, Zwicky’s heresy had become common sense; trying toreject the dark-matter hypothesis had become the new heresy! This model wasrejected 10 years later, when The & White133 showed that Valtonen & Byrd’smodel was inconsistent with the σv-profile at the centre of Coma.
Other groups followed more traditional approaches. Most (Kent & Gunn,Millington & Peach97, The & White130, Merritt94) came to the conclusions thatthe best-fit model is also the simplest, i.e. light traces mass, and galaxy orbitsare isotropic throughout the cluster (Fuchs & Materne49 disagreed, but theirfitting method was found97 to be very sensitive to the assumed form of thedensity profile). While ”simplest is best” provided an adequate description ofthe cluster dynamics, other models could not be excluded, and the mass-to-light ratio of Coma was shown to be uncertain by a factor four (from 50 to 200M⊙/L⊙, see Bailey). Merritt first showed that the shape of the galaxy velocitydistribution at different radii contains information on the orbital anisotropy.His attempt of fitting the velocity distribution of galaxies in Coma was unsuc-cesful though, because of the skewness of the velocity distribution (see Fig.5).It took 9 years to understand that the skewness was caused by the contaimi-nation of the SW group galaxy velocities (Colless & Dunn).
The X-ray observations of Gursky et al.63 and Meekins et al.92 showed the

Figure 5: The observed line-of-sight distribution of the Coma galaxy velocities (in km/s)with three theoretical models superposed – from Merritt
existence of a hot IC gas component in Coma. The mass of this new componentwas estimated by Gursky et al. to be quite below the total cluster mass, butfar from negligible.
The newly discovered IC gas mass component was taken into account inthe so-called ”Multi-Mass Model” of Capelato, Gerbal et al.23,24,34,55, wherethey also considered a spectrum of galaxy masses. Capelato et al.24 suggestedthe existence of a virialized core surrounded by a still collapsing halo. Gerbalet al.55 were possibly the first to show that the IC gas contribution to the totalmass increases with the clustercentric distance (see Fig.6).
The basic uncertainty in the X-ray based mass estimation is the ignoranceof the detailed gas temperature profile. From the HEAO 1 A-2 and OSO 8observations in the 2-60 keV band, Henriksen & Mushotzky67 deduced a steepgas temperature decrease with clustercentric distance. As a consequence, theyrevised the total cluster mass estimate downward by a factor four. Cowie etal.29 reached a similar conclusion, by using additional data from the EinsteinIPC.
The & White131 criticized these results, showing that such a steep temper-ature decrease would require galaxies in the outer part of the cluster to be onnearly circular orbits. Based on X-ray data, Hughes et al.72,73,74 showed thatthe X-ray temperature does decrease off-centre (see Fig.7), but not as steeply

Figure 6: The mass (in solar mass units) of the various components of the Coma cluster, asa function of the clustercentric distance, in arcminutes, according to the model of Gerbal etal. (log-log plot)
Figure 7: 2D χ2 contours (at 68, 90 and 90 % confidence level) for the Iron abundance (withrespect solar) vs. gas temperature (keV), for two pointings of EXOSAT - from Hughes et al.
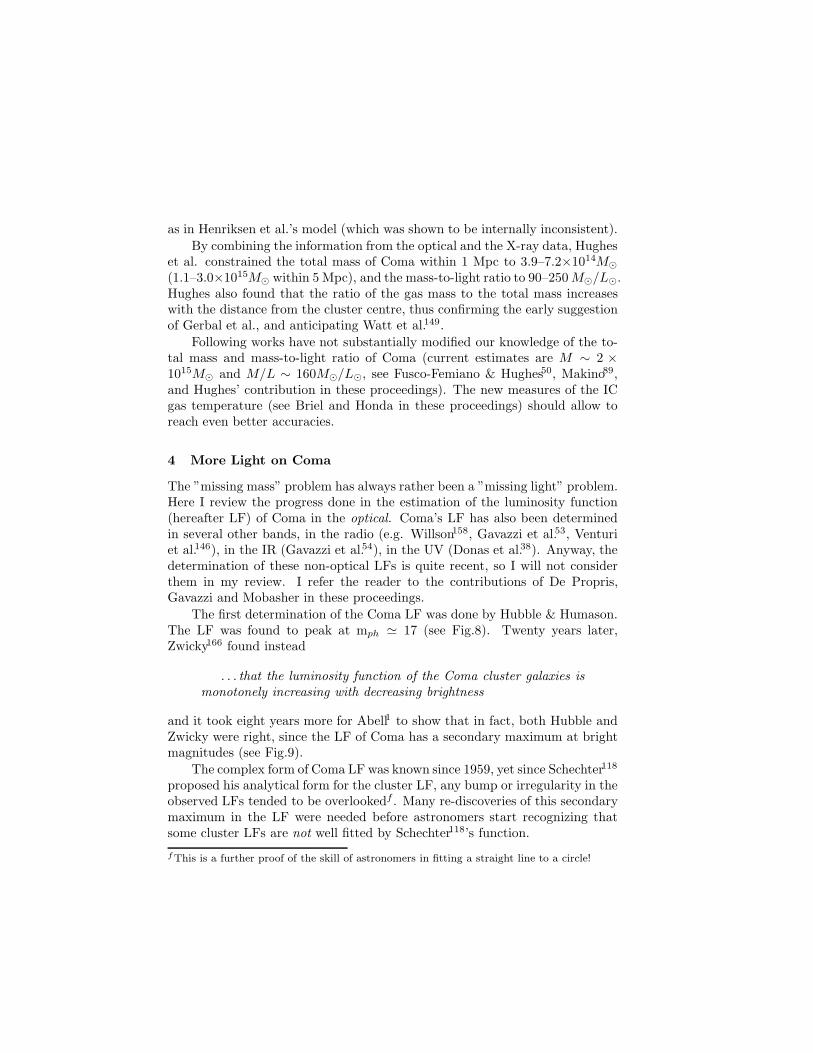
as in Henriksen et al.’s model (which was shown to be internally inconsistent).
By combining the information from the optical and the X-ray data, Hugheset al. constrained the total mass of Coma within 1 Mpc to 3.9–7.2×10¹⁴M⊙
(1.1–3.0×10¹⁵M⊙ within 5 Mpc), and the mass-to-light ratio to 90–250M⊙/L⊙.Hughes also found that the ratio of the gas mass to the total mass increaseswith the distance from the cluster centre, thus confirming the early suggestionof Gerbal et al., and anticipating Watt et al.149.
Following works have not substantially modified our knowledge of the to-tal mass and mass-to-light ratio of Coma (current estimates are M ∼ 2 ×
1015M⊙ and M/L ∼ 160M⊙/L⊙, see Fusco-Femiano & Hughes50, Makino89,and Hughes’ contribution in these proceedings). The new measures of the ICgas temperature (see Briel and Honda in these proceedings) should allow toreach even better accuracies.
4 More Light on Coma
The ”missing mass” problem has always rather been a ”missing light” problem.Here I review the progress done in the estimation of the luminosity function(hereafter LF) of Coma in the optical. Coma’s LF has also been determinedin several other bands, in the radio (e.g. Willson158, Gavazzi et al.53, Venturiet al.146), in the IR (Gavazzi et al.54), in the UV (Donas et al.38). Anyway, thedetermination of these non-optical LFs is quite recent, so I will not considerthem in my review. I refer the reader to the contributions of De Propris,Gavazzi and Mobasher in these proceedings.
The first determination of the Coma LF was done by Hubble & Humason.The LF was found to peak at mph ≃ 17 (see Fig.8). Twenty years later,Zwicky166 found instead
. . . that the luminosity function of the Coma cluster galaxies ismonotonely increasing with decreasing brightness
and it took eight years more for Abell1 to show that in fact, both Hubble andZwicky were right, since the LF of Coma has a secondary maximum at brightmagnitudes (see Fig.9).
The complex form of Coma LF was known since 1959, yet since Schechter118
proposed his analytical form for the cluster LF, any bump or irregularity in theobserved LFs tended to be overlookedf . Many re-discoveries of this secondarymaximum in the LF were needed before astronomers start recognizing thatsome cluster LFs are not well fitted by Schechter118’s function.
fThis is a further proof of the skill of astronomers in fitting a straight line to a circle!

Figure 8: Cumulative counts of nebulae in the central region of Coma vs. the photographicmagnitude. In this figure, magnitudes range from 14 to slightly more than 20, and countsfrom 0 to slightly more than 250 – from Hubble & Humason
Figure 9: Differential LF of Coma galaxies. Magnitudes (on the x-axis) range from 12.3 to18.3, counts (on the y-axis) range from 0 to 500 – from Sky & Telescope, XVIII, 495 (1959)
The first one to re-discover (or confirm) the secondary maximum wasRood112, 10 years later; then followed Godwin & Peach58, in the late 70’s,Thompson & Gregory135 in 1993, and finally Biviano et al.15 who closed thisissue, by using only spectroscopically confirmed cluster members from a com-plete galaxy sample.
New data allowed Rood112 to show that the LF is not the same for galaxiesin the inner and outer regions of Coma. The secondary maximum looked morepronounced in the LF of galaxies in the inner region, where the fraction ofbright galaxies is higher. This result was confirmed by Lugger87,88, 10 yearsafter (despite the opposite conclusions reached by Gregory & Tifft62).
Numerical simulations allowed White155 to show that dynamical frictioncan lead to the segregation of brighter galaxies in the cluster centre, and amodification of the inner LF. New simulations of Roos & Aarseth117 showedthat also merging can significantly affect the LF of galaxies in the centre ofComa.
The increase of Coma’s LF at faint magnitudes seemed not to be strongenough to provide all the ”missing light”; galaxies fainter than mpv = 18.3only contribute ∼ 13 % of the total cluster light (Abell4). However, deeper ob-servations were to indicate a further steepening of the LF. First, Abell5 showedthat at magnitudes fainter than than mv = 17.5, the LF had an asymptoticslopeg α = −1.4. Then, using Godwin et al.57’s new catalogue, Metcalfe95 de-termined an even steeper slope (α = −1.9) for the LF at b ≥ 19.74. With sucha steep slope, the faint galaxy contribution to the total cluster light is signif-icant, ∼ 20 %. Metcalfe’s result anticipated recent findings by Lobo et al.86
(who find α = −1.8; see also the contributions of Adami, Lobo, and Sekiguchiin these proceedings). Other evidences for a (more or less) steep LF at thefaint end came from Karachentsev et al.76 and Bernstein et al.14.
5 Looking into the Dark
Observations and modelling of the Coma cluster have led theoreticians to pro-pose and eventually discard hypotheses on the nature of dark matter. HereI review some of these hypotheses, although most are already ruled out, andmaybe none will turn out to be correct.
5.1 No Dark Matter?
Zwicky’s original estimate of the large mass of Coma was regarded with consid-erable scepticism at the beginning (see § 3.1). Possible solutions to the problem
gα is defined by: N(L) dL ∝ Lα dL

of dark matter were that Coma (and clusters in general) are unbound and ex-panding, or that the σv-estimate was boosted by the presence of interlopers.In the words of Holmberg:
The temporary members with their hyperbolic velocities seem tooffer a more plausible solution of the difficulty.
This solution to the problem was never totally discarded, since unidentifiedsubclustering is known to significantly affect cluster σv-estimates. In the caseof Coma, however, Schwarschild pointed out that interlopers cannot led tomore than a factor two overestimate of the cluster σv. On the other hand, theinstability argument could not explain why we see so many clusters, nor theapparent lack of significant evolution in the structure of clusters at differentredshifts (see § 3.1).
The existence of dark matter was again questioned by Tifft137. He discov-ered a correlation between galaxy redshifts and magnitudes that led him toquestion the usual physical interpretation of a galaxy redshift. Tifft estimatedthat the intrinsic Doppler velocity dispersion could be less than 220 km/s. Tomy knowledge, this so-called ”band-effect” has never really been ruled out (itwas even recently confirmed by Nanni et al.99), unless Simkin124 was right andthe effect is an artefact due to night-sky distorsion in the observed spectra.
Another viable solution to the ”missing mass” problem, that does notrequire any dark matter, came from Milgrom96 who proposed a modification ofthe theory of Newton dynamics. Nevertheless, MOND, this new theory, cannotat the same time explain Coma dynamics and the spiral rotation curves (The& White132).
5.2 Diffuse Light
Zwicky167’s original approach to the ”missing mass” problem consisted in look-ing for the missing light. He was the first to claim detection of large luminouspatches in the centre of Coma. Later on, Welch & Sastry150, Kormendy &Bahcall82, Thuan & Kormendy136 and Mattila90 also found evidence for diffuselight in the centre of Coma. The contribution of this diffuse component to thetotal cluster mass was however estimated to be negligible (at most 3 % of thetotal mass, according to Kormendy & Bahcall).
Mattila proposed several possible origins for this diffuse light: extendedgalaxy envelopes, dwarf galaxies (see § 4), globular clusters, intergalactic stars,scattering by dust grains (see § 5.4).
Recently, based on deep CCD observations, Bernstein et al. showed thatthe diffuse light in Coma follows the same distribution of globular clusters and

dwarf galaxies, and the units that make up such a diffuse luminosity must be≤ 103L⊙.
5.3 Diffuse Gas
As early as in 1956, the first detection of IC gas was claimed by Heeschen66,based on 21-cm line-emission observations. Heeschen concluded that the totalmass in HI was ∼ 1/4 of the total cluster mass. However, his result was shownto be spurious by Muller98.
Boldt et al.17 first claimed detection of extended X-ray emission in thedirection of Coma, but this finding was shown to be inconsistent with otherobservations (Friedman & Byram48).
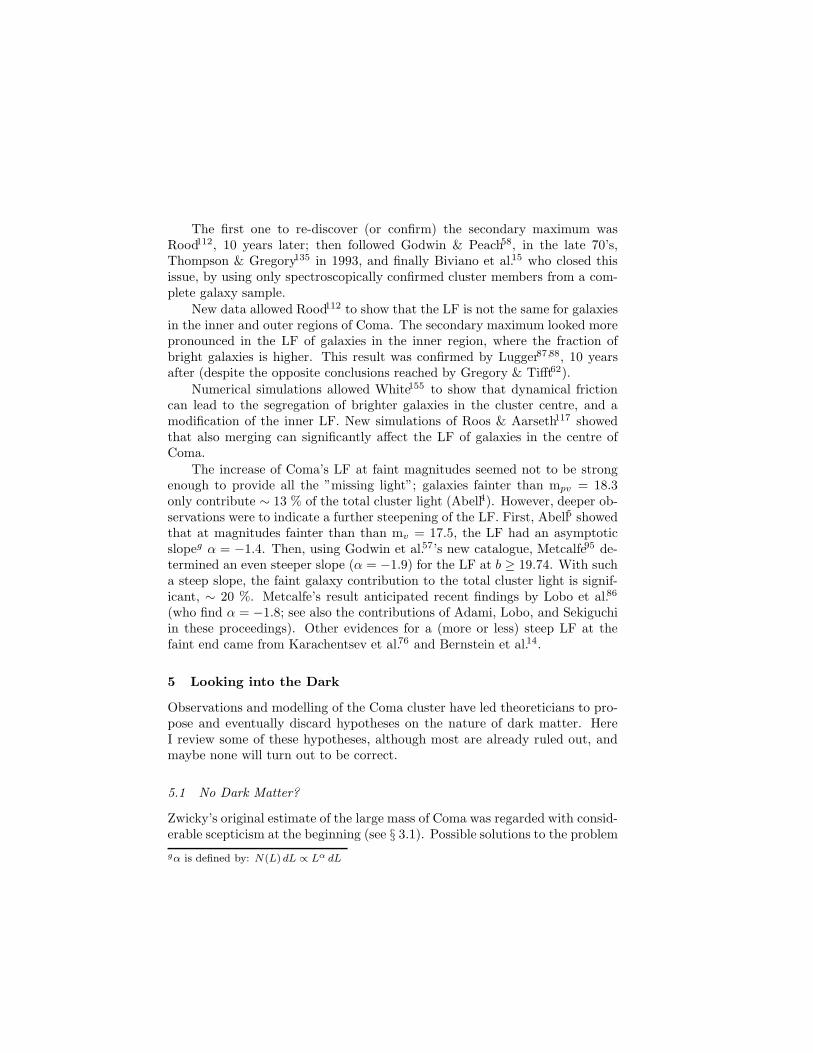
In 1970 Turnrose & Rood142 used the available Hβ and X-ray data to setan upper limit of 105 K to the temperature of a diffuse gas with the massneeded to bind the cluster. Their work was published shortly before the realdetection of Coma in the X-ray by Meekins et al. and Gursky et al. (seeFig.10). Assuming that the emission was thermal bremsstrahlung from an ICgas, Gursky et al. estimated its mass in a few percent only of the total clustermass.
The detection of the Fe line with OSO-8 by Serlemitsos et al.121, provedthe thermal nature of the X-ray emission. At the same time, the presence ofmetals in the IC gas indicated that this had been at least partly processed instars.
Currently, the contribution of the hot gas to the total mass is known toincrease with the distance from the cluster centre, possibly up to ∼ 50 %(Hughes). A cool diffuse gas component may have now been detected (Lieu,these proceedings).
5.4 Diffuse Dust
Zwicky168 noted a deficiency of clusters behind the Coma cluster as comparedto other regions of the sky. He interpreted this deficiency as evidence for ICextinction, presumably due to diffuse dust. Later, Noonan101 found evidencefor IC extinction of ∼ 0.4 mag in the blue band, in agreement with the estimategiven by Karachentsev & Lipovetskii77. Few years later, Wesson151 made therather extreme hypothesis that IC dust may be present in such large quantitiesas to bind the Coma cluster!
The IC dust hypothesis encountered more criticism than consensus. In the60’s de Vaucouleurs noted that the fact that diffuse gas remained undetectedimplied a low density of diffuse dust, and Abell4 considered the evidence forIC inconclusive. Smart125 showed that IC dust must be significantly depleted
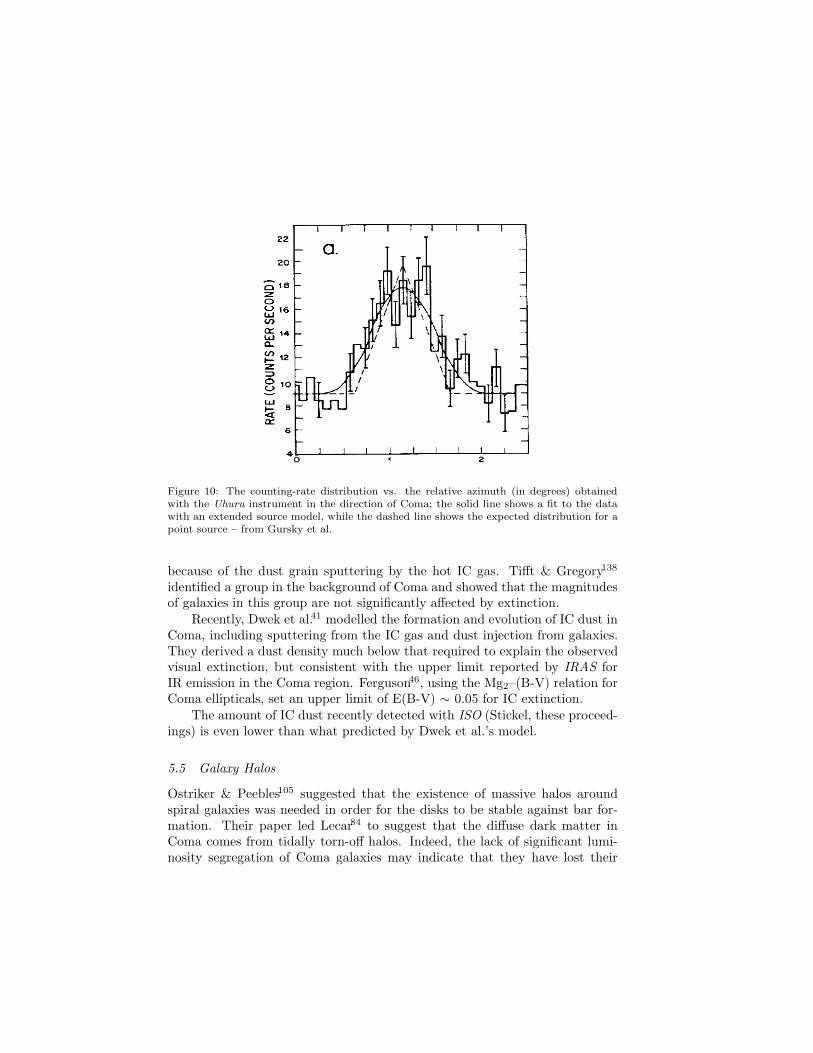
Figure 10: The counting-rate distribution vs. the relative azimuth (in degrees) obtainedwith the Uhuru instrument in the direction of Coma; the solid line shows a fit to the datawith an extended source model, while the dashed line shows the expected distribution for apoint source – from Gursky et al.
because of the dust grain sputtering by the hot IC gas. Tifft & Gregory138
identified a group in the background of Coma and showed that the magnitudesof galaxies in this group are not significantly affected by extinction.
Recently, Dwek et al.41 modelled the formation and evolution of IC dust inComa, including sputtering from the IC gas and dust injection from galaxies.They derived a dust density much below that required to explain the observedvisual extinction, but consistent with the upper limit reported by IRAS forIR emission in the Coma region. Ferguson46, using the Mg2–(B-V) relation forComa ellipticals, set an upper limit of E(B-V) ∼ 0.05 for IC extinction.
The amount of IC dust recently detected with ISO (Stickel, these proceed-ings) is even lower than what predicted by Dwek et al.’s model.
5.5 Galaxy Halos
Ostriker & Peebles105 suggested that the existence of massive halos aroundspiral galaxies was needed in order for the disks to be stable against bar for-mation. Their paper led Lecar84 to suggest that the diffuse dark matter inComa comes from tidally torn-off halos. Indeed, the lack of significant lumi-nosity segregation of Coma galaxies may indicate that they have lost their
massive halos very early in the history of the cluster (see § 6.1).Support to his model came from the observations of Thompson134, who
showed that the density of barred galaxies is higher in the cluster centre, aspredicted if these galaxies have indeed lost their halos.
Lecar’s hypothesis would imply similar mass-to-light ratios for galaxiesand clusters, and this is consistent with current estimates (e.g. Bahcall11).
5.6 Particles
Most today’s cosmologists think that dark matter is made of some sort ofweakly interacting massive particles filling the Universe. Massive neutrinoshave long been considered as possible candidates. Cowsik & McClelland30
were the first to draw the attention of the astrophysical community to massiveneutrinos. Their work is of relevance here, as they compared their model tothe observations of Coma. In their acknowledgments, we can read:
Our interest in the problem of the Coma cluster started afterlistening to the excellent seminars on the subject by Professors IvanR. King, Eugene D. Commins, and Joseph Silk.
6 The Tidy Coma: A Place for Each Galaxy
When we say that Coma is a cluster of galaxies, we better specify the kind ofgalaxies we are speaking of. In fact, galaxies of different type and luminosityhave different distributions in the Coma cluster, and the cluster looks differentwhen only, say, the ellipticals, or the spirals are selected. Here I review thehistory of the discovery of galaxy segregation in the Coma cluster.
6.1 Luminosity segregation
Zwicky169 was the first to notice that bright and faint galaxies in Coma havedifferent radial distribution, bright galaxies being more concentrated. His find-ing was at odd with the conclusion reached by Omer102 few years before. Inthe 60’s the evidence for luminosity segregation had less supporters (Reaves109)than opponents (Abell4 and Omer103), until the new data-set of Rood allowedRood & Turnrose116 to conclude that dwarfs are indeed less concentrated thanbright galaxies (see Fig.11). Their results were confirmed by Noonan101.
However, the luminosity segregation in Coma is not a very strong effect.Rood110 and White155,156 noted that a much stronger effect would result fromtwo-body relaxation if all the cluster dark mass was in galaxy halos.
Using the new data-set of Godwin & Peach, Capelato et al.23 showed thatluminosity segregation is a more complicated issue than previously thought.
Figure 11: Bright and dwarf galaxy distributions in concentric rings centered on the Comacluster centre. The ring no. increases with clustercentric distance – from Rood & Turnrose
While dynamical friction tends to produce a concentration of brighter galax-ies in the Coma centre, merging of these same galaxies tends to reduce thenumber of intermediate brightness galaxies, and to create ultra-bright galax-ies. Observationally, this effect is seen as an anti-segregation of galaxies withm25 ≤ 14.5. Capelato et al.’s observational evidence was reproduced in Roos& Aarseth’s numerical simulations only two years later (see also Athanassoula,these proceedings).
Thompson & Gregory showed that, among the dwarf galaxies, dwarf ellip-ticals follow the same distribution of giant ellipticals, while dwarf spheroidalsare lacking in the core. This was interpreted as evidence for tidal disruptionof the spheroidal galaxies (see also Secker, these proceedings).
Recently, Biviano et al.16 showed that faint galaxies describe a more regularcluster than do bright galaxies, for which the effect of subclustering is stronger,and interpreted this finding as evidence for ongoing accretion of groups ontothe cluster (see also § 7 and Lobo, these proceedings).
6.2 Spirals in Coma?
The fact that nebulæ near the centre of concentrated clustersare predominantly of the elliptic type, whereas spirals are relatively

more numerous on the outskirts of clusters . . .
. . . was already well known at the time Zwicky164 was writing these lines, evenif, in 1962, Neyman et al.100 maintained that most (if not all) of this effectwas due to an observational bias. Although Andreon7 has recently shown theywere not completely wrong, morphological segregation is real, and it can beseen in Coma as in (almost) any other cluster (being particularly evident whengalaxies are selected in the UV, see Donas et al.38).
In this respect, what distinguishes Coma from most other clusters, is thealmost complete absence of spirals. Abell4 maintained there are no spirals inComa at all, in contrast with Rood111 and Rood et al. who found that somepeculiar spirals do belong to Coma, and that at least 16 of the spectroscopicallyconfirmed members of Coma were spirals or irregulars. Faced to the evidencethat some spirals have velocities close to the mean cluster velocity, Abell5
made the hypothesis that these spirals are members not of the cluster but ofthe Coma supercluster.
Sullivan & Johnson129 observed three spirals in Coma and found that theyhad a surprisingly low HI abundance for their luminosity, when compared tosimilar spirals in the field, i.e. they were ”HI-deficient”. The authors concludedthat these spirals have passed through Coma and have been stripped of partof their gas. Following studies (Sullivan et al.128, Chincarini et al.26, Bothun etal.18, Gavazzi et al.53) not only confirmed these results, but also showed thatthe HI-deficiency mostly concerns spirals in the core of Coma, and not spiralsin the Coma supercluster. This definitely proved the existence of a populationof cluster spirals (note however that Coma spirals are not H2-deficient, seeBoselli, these proceedings).
Doi et al.37, via automatic classification of galaxy types, have recentlyconcluded that the spiral fraction in Coma was previously underestimated (seealso the contribution of Andreon in these proceedings).
Note that, even if spirals are cluster members, dwarf irregulars are not(Thompson & Gregory).
6.3 Velocity Segregation
Different galaxies in Coma have different velocity distributions. This was firstnoticed by Hawkins65 who pointed out that galaxies in the Coma centre have alower mean velocity than galaxies at the edge. However, the value he quoted forthe central galaxies (6254 km/s) was very low, and has never been confirmedsince.
The first firm result on the velocity segregation in Coma was obtained byRood et al. These authors noticed that the five brightest galaxies (mp < 15.0)
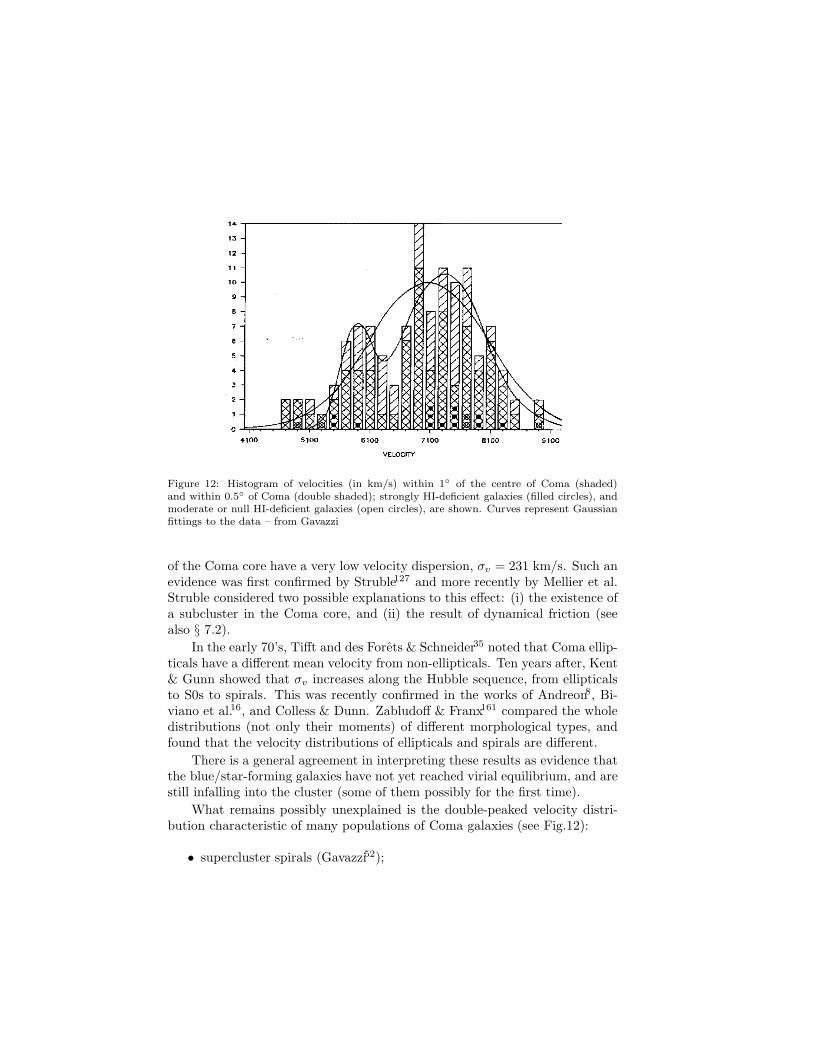
Figure 12: Histogram of velocities (in km/s) within 1◦ of the centre of Coma (shaded)and within 0.5◦ of Coma (double shaded); strongly HI-deficient galaxies (filled circles), andmoderate or null HI-deficient galaxies (open circles), are shown. Curves represent Gaussianfittings to the data – from Gavazzi
of the Coma core have a very low velocity dispersion, σv = 231 km/s. Such anevidence was first confirmed by Struble127 and more recently by Mellier et al.Struble considered two possible explanations to this effect: (i) the existence ofa subcluster in the Coma core, and (ii) the result of dynamical friction (seealso § 7.2).
In the early 70’s, Tifft and des Forets & Schneider35 noted that Coma ellip-ticals have a different mean velocity from non-ellipticals. Ten years after, Kent& Gunn showed that σv increases along the Hubble sequence, from ellipticalsto S0s to spirals. This was recently confirmed in the works of Andreon8, Bi-viano et al.16, and Colless & Dunn. Zabludoff & Franx161 compared the wholedistributions (not only their moments) of different morphological types, andfound that the velocity distributions of ellipticals and spirals are different.
There is a general agreement in interpreting these results as evidence thatthe blue/star-forming galaxies have not yet reached virial equilibrium, and arestill infalling into the cluster (some of them possibly for the first time).
What remains possibly unexplained is the double-peaked velocity distri-bution characteristic of many populations of Coma galaxies (see Fig.12):
• supercluster spirals (Gavazzi52);

• HI-deficient galaxies (Gavazzi52);
• post-starburst galaxies (Caldwell et al.22, see Fig.16 in Biviano et al.16);
• UV-selected galaxies (Donas et al.39);
• radio-galaxies (Kim et al.79);
• S0 galaxies (Zabludoff & Franx);
• blue galaxies (Biviano et al.16).
Of the two peaks, one is centered at ∼ 7500 km/s (close to the meanvelocity of the SW group, see § 7.1), and the other is centered at ∼ 5500 km/s,while the cluster mean velocity is ∼ 6900 km/s. Subclustering would seem themost obvious explanation for this complex velocity distribution, yet galaxieswith velocities close to these peaks are not spatially subclustered (see alsoGerbal, these proceedings).
7 Slicing Coma
Coma has long been considered the prototype of well-relaxed, regular clusters(see § 1). Nevertheless, also the existence of substructures in Coma has longbeen known. This is shown in the next sections.
7.1 The SW Group
The existence of a subcluster at ∼ 0.5◦ South-West of the Coma centre, aroundthe bright galaxy NGC 4839, was already noticeable in the map of the densityof nebulæ in the Coma region (see Fig.2), that Wolf made in 1902. Thepresence of the SW galaxy concentration was confirmed by Shane &Wirtanen’sgalaxy counts, half a century later (see Fig.13). Here is how Shane & Wirtanendescribed the SW subcluster:
It is apparent that there is a subsidiary concentration of neb-ulæ southwest of the cluster center. This grouping may be a sec-ondary feature of the cluster or it may represent an independentaggregation.
Note that Wolf’s map was not mentioned in Shane & Wirtanen’s paper.Following up Shane & Wirtanen’s ”discovery” of the SW subcluster, van
den Bergh145 developed the first objective method for the detection of sub-clustering. He measured the apparent galaxy separations in Coma, before andafter scrambling the galaxy position angles, while keeping their clustercentric
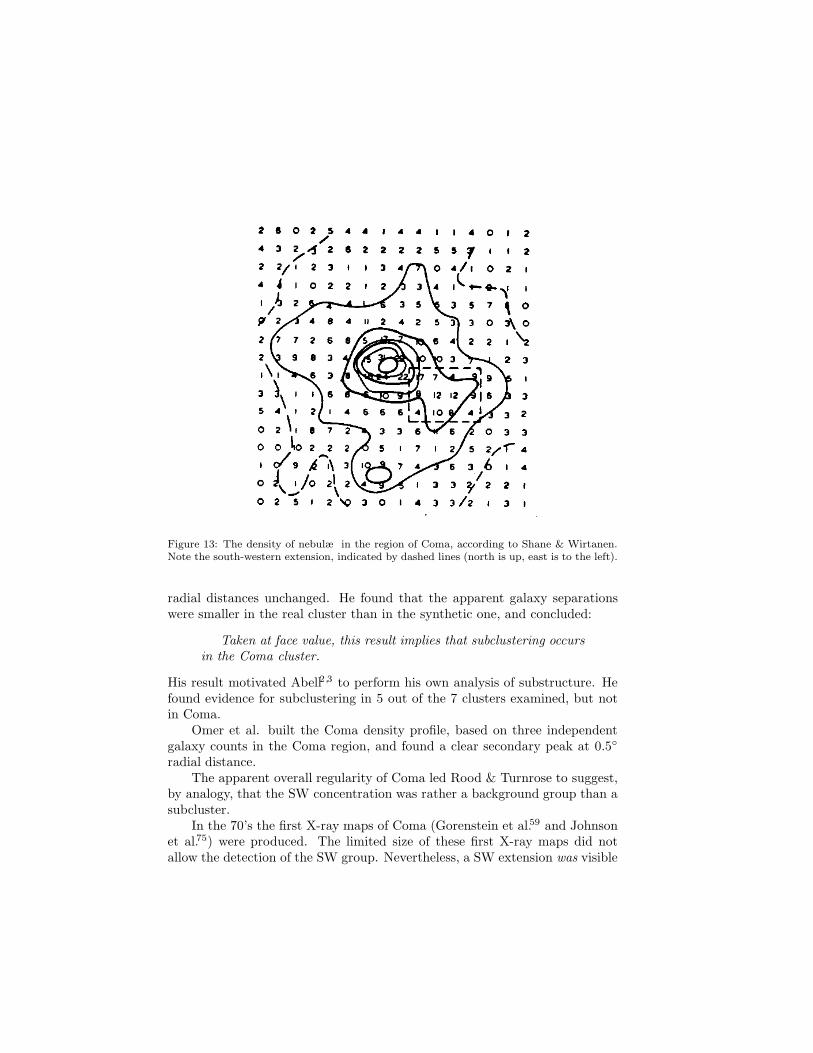
Figure 13: The density of nebulæ in the region of Coma, according to Shane & Wirtanen.Note the south-western extension, indicated by dashed lines (north is up, east is to the left).
radial distances unchanged. He found that the apparent galaxy separationswere smaller in the real cluster than in the synthetic one, and concluded:
Taken at face value, this result implies that subclustering occursin the Coma cluster.
His result motivated Abell2,3 to perform his own analysis of substructure. Hefound evidence for subclustering in 5 out of the 7 clusters examined, but notin Coma.
Omer et al. built the Coma density profile, based on three independentgalaxy counts in the Coma region, and found a clear secondary peak at 0.5◦
radial distance.The apparent overall regularity of Coma led Rood & Turnrose to suggest,
by analogy, that the SW concentration was rather a background group than asubcluster.
In the 70’s the first X-ray maps of Coma (Gorenstein et al.59 and Johnsonet al.75) were produced. The limited size of these first X-ray maps did notallow the detection of the SW group. Nevertheless, a SW extension was visible

Figure 14: The map of the X-ray emission from Coma in the 0.5-5 keV band – from Johnsonet al.
in the map of Johnson et al. (see Fig.14).
In the 80’s the SW group was finally identified also in the velocity space.Baier12 reportedh on Sherbanowsky123’s identification of a group of 12 galaxieswith an average velocity of 7437 km/s in the SW of Coma. Sherbanowsky’sestimate for the mean velocity of the SW group was only ∼ 100 km/s higherthan the current estimatei.
Another (independent) detection of the SW group in the phase-space camefrom Perea et al.108 Their estimates of the average velocity and σv of the SWgroup, were however offset by 200 km/s from current ones27.
In spite of all previous evidences on the existence of a SW subcluster,in 1988 Dressler & Shectman40 claimed ≤ 6 % probability that Coma hadsubstructures! In the same year, however, Mellier et al. published their seminalpaper, in which they identified ”not less than 9 local density peaks”, includingthe SW group. Their estimates of the SW velocity moments were neverthelessbased on 4 galaxies only, and therefore rather uncertain. Escalera et al.42 putMellier et al.’s results on a firm statistical basis, using the wavelet method forstructure detection.
hSherbanowsky’s paper is extremely difficult (impossible?) to find even in very good libraries.It would have probably remained unnoticed, had Baier not mentioned it.iColless & Dunn estimate a mean velocity of the SW group of 7339 km/s and a velocitydispersion of 329 km/s
In the 90’s the group around NGC 4839 was also discovered in the X-rays,first by Briel et al. using the ROSAT PSPC, and almost at the same time byWatt et al. using the SL2 XRT.
In the last years, the emphasis moved from the determination of the SWgroup properties to the determination of its evolution in relation to Coma. Hasthe group already passed through Coma, or is it infalling into the cluster forthe first time? Both in the X-ray (White et al.157) and in the radio (Cordey28)there is evidence for a tail of gas behind NGC 4839, in the opposite directionto the cluster centre, as if the galaxy was falling into the Coma core, and itsgaseous atmosphere was swept away by motion through an external medium.On the other hand, Burns et al.21’s numerical simulations suggest that thegroup has already passed through the cluster corej.
The issue is still controversial (see Colless & Dunn vs. Biviano et al.16).Evidences in favour of the ”first infall” scenario are:
• the X-ray and radio tail of NGC 4839;
• spiral galaxies in the SW group region do not show HI-deficiency (Bravo,these proceedings);
• the group properties (richness, velocity dispersion, X-ray luminosity), areall consistent with a non-perturbed group (Colless, these proceedgins).
Nevertheless, this scenario cannot explain the presence of a bridge of materialconnecting Coma and the group, detected as diffuse optical light (Mattila), asa spray of post-starburst galaxies (Caldwell et al., and Caldwell’s contributionin these proceedings), in the X-ray (Briel et al.) and in the radio (Kim et al.80).If the group has crossed the cluster, this bridge could be interpreted as tidallystripped material from the group. The bridge is unlikely to be related to thefilament connecting Coma to A1367 (see, e.g., West, these proceedings) sincethe filament orientation is different from that of the bridge. On the other hand,the North-East filament of the Coma supercluster has the correct orientation.Several groups are found to lie in this filament, and these are predicted to fallinto the cluster in the future (West, these proceedings).
This issue could be solved by an accurate determination of the relativedistances between Coma and the group, via the use of secondary distanceindicators (see the preliminary results of Lima-Neto in these proceedings).
jIn their paper Burns et al. note that ”the recession velocity of the NGC 4839 group isslightly smaller (by ∼ 100 km s−1) than that of the Coma cluster”. This is wrong, therecession velocity of the group is ∼ 400 km/s higher than that of Coma.
7.2 Subclusters in the Core
The existence of substructure within the core of Coma was first suggested byBahcall10 in the 70’s. She observed an anisotropic distribution of the brightgalaxies in the Coma core, along the E-W direction and suggested that:
. . . the observed anisotropy of the bright galaxies could arise fromsubclustering around each of the two supergiants at the center of thecluster.
She also noticed that subclustering was stronger around NGC 4874, the lessbright of the two central dominant galaxies. Recent results16,27 confirm herearly suggestions.
One year later, Rood114 pointed out ”a possible tendency for S0 galaxiesto surround NGC 4874 and ellipticals to surround NGC 4889”. To my knowl-edge, there has been no confirmation of this effect. The recent morphologicalcatalogue of Andreon et al.9 is best suited for the investigation of this issue(see also Andreon, these proceedings).
In January 1979 two papers appeared, both fundamental for the under-standing of subclustering in the Coma core, one from Quintana107, the otherfrom Struble.
Quintana noticed a narrow density peak centered very close to NGC 4874,and suggested it ”may indicate the presence of a dynamically separated sub-unit”. Struble observed that the velocity dispersion of three clusters (amongwhich Coma) decreases when only the core region is selected. This was inter-preted as evidence that
. . . the most massive galaxies in the core have ”captured” lessmassive galaxies as satellites and formed isolated subsystems
Struble also mentioned dynamical friction as a possible alternative explanation(see § 6.3).
Valtonen & Byrd’s binary model for the Coma cluster (see § 3.3) wasmotivated by the growing evidence of the existence of subclusters in the Comacore. This suggests that by the late 70’s the idea of a complex structure for theComa core was already taking root in the astrophysical community. In 1984,Baier published the first paper specifically devoted to the issue of subclusteringin Coma. He reviewed the evidence for subclustering in Coma, partly comingfrom the presence of the SW-group (see § 7.1), and partly from the ”doublecharacter of the central cluster region”.
The evidence for subclustering in the Coma core was growing fast. Pereaet al. first identified the two central groups in velocity space, and found mean

Figure 15: Isocontours of galaxy number densities in the Coma cluster; the brightest Comagalaxies are listed. The vertical line on the left indicates a scale of 1◦ – from Mellier et al.
velocities of 6431 km/s and 7072 km/s, and velocity dispersions of 220 km/sand 137 km/s for the groups centered around NGC 4889 and NGC 4874, re-spectively. Their results anticipated those of Fitchett & Webster and Mellieret al., both qualitatively and quantitatively (Mellier et al.’s estimates of thevelocity moments of the two central groups differ by less than 10 % from Pereaet al.’s), yet Perea et al.’s paper received much less attention than the othertwok (was the word ”taxonomical” in the title of their paper weird enough todiscourage potential readers?).
Fitchett & Webster were possibly the first to use the word ”substructure”in the title of a paper on Coma. Using the Lee-method, they separated galaxymembers of the NGC 4889 group from galaxy members of the NGC 4874 group,and proposed a circular-orbit dynamical model for the two central subgroups(reminiscent of Valtonen & Byrd’s model). They mentioned two possible ori-
kThe NASA Astrophysics Data System lists only three papers making reference to Perea etal., as compared to 75 papers referring to Fitchett & Webster and 43 papers to Mellier et al.

gins for the substructures in the core:
1. Coma is presently forming by the merger of two large subunits;
2. the two substructures in the Coma core were independent groups thathave fallen into a pre-existent cluster.
Nowadays, a third interpretation27 has made his way:
3. NGC 4874 is the original dominant galaxy of the cluster, that has recentlysuffered from a collision with a small group centered on NGC 4889.
The difference between the NGC 4874 velocity and the mean cluster velocity(as well as its radio-morphology, see below), still gives some credit to Fitchett& Webster’s scenario n.2 (see Biviano et al.16).
Of the 9 density peaks identified by Mellier et al. in Coma, two of themare in the cluster core (see Fig.15), centered on NGC 4889 and NGC 4874,that are surrounded by a population of satellite galaxies. In Mellier et al.’sscenario, these subclusters exist as independent groups before infalling intothe cluster. At the time of infall, they have already passed through a mass-segregation instability-phase. During the infall, tidal effects strip the groups oftheir less bound low-mass galaxies, while the high-mass galaxies in the groupcores, resist longer. Support from their scenario came recently from Biviano etal.16, who showed that faint galaxies (b ≥ 17) do not cluster around the giantgalaxies, at variance with bright galaxies.
Mellier et al. estimated masses of 6 × 10¹³M⊙ and 5 × 10¹³M⊙, for thegroups around NGC 4874 and NGC 4889, respectively. Their estimates havesince been confirmed (to within 50 %) by later works (see below).
Some years later, Escalera et al.’s wavelet analysis detected the two centralsubstructures with 99.9 % significance. The velocity dispersions they derivedfor the two subclusters are rather high, and more similar to the values foundby Fitchett & Webster than to those found by Perea et al. and Mellier et al.Probably, contamination by cluster (and not group) members, affected theirσv-estimates.
Non-optical wavelength observations also provided evidence for for a com-plex structure of the Coma core. In 1985, Feretti & Giovannini45’s radio ob-servations of NGC 4874 showed that this galaxy was a Wide-Angle-Tail radio-source. This morphology is indicative of motion of NGC 4874 through thesurrounding IC gas, i.e. the galaxy is not at rest at the bottom of the clusterpotential (or the IC gas has a bulk velocity).
Based on the radio morphology of another galaxy in the Coma core,NGC 4869, whose radio-emission was first mapped by Willson, Feretti et al.44
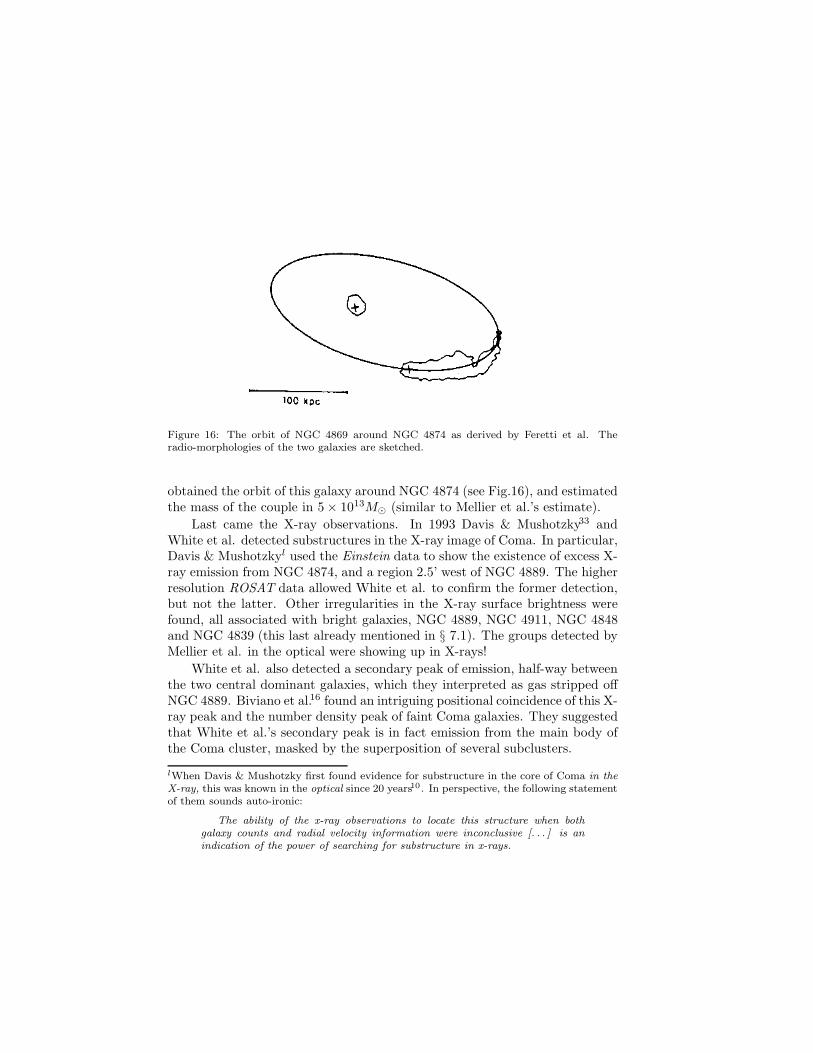
Figure 16: The orbit of NGC 4869 around NGC 4874 as derived by Feretti et al. Theradio-morphologies of the two galaxies are sketched.
obtained the orbit of this galaxy around NGC 4874 (see Fig.16), and estimatedthe mass of the couple in 5× 10¹³M⊙ (similar to Mellier et al.’s estimate).
Last came the X-ray observations. In 1993 Davis & Mushotzky33 andWhite et al. detected substructures in the X-ray image of Coma. In particular,Davis & Mushotzkyl used the Einstein data to show the existence of excess X-ray emission from NGC 4874, and a region 2.5’ west of NGC 4889. The higherresolution ROSAT data allowed White et al. to confirm the former detection,but not the latter. Other irregularities in the X-ray surface brightness werefound, all associated with bright galaxies, NGC 4889, NGC 4911, NGC 4848and NGC 4839 (this last already mentioned in § 7.1). The groups detected byMellier et al. in the optical were showing up in X-rays!
White et al. also detected a secondary peak of emission, half-way betweenthe two central dominant galaxies, which they interpreted as gas stripped offNGC 4889. Biviano et al.16 found an intriguing positional coincidence of this X-ray peak and the number density peak of faint Coma galaxies. They suggestedthat White et al.’s secondary peak is in fact emission from the main body ofthe Coma cluster, masked by the superposition of several subclusters.
lWhen Davis & Mushotzky first found evidence for substructure in the core of Coma in theX-ray, this was known in the optical since 20 years10. In perspective, the following statementof them sounds auto-ironic:
The ability of the x-ray observations to locate this structure when bothgalaxy counts and radial velocity information were inconclusive [. . . ] is anindication of the power of searching for substructure in x-rays.

Finally, Vikhlinin et al.147 applied the wavelet analysis to the ROSATimage of Coma, disentangling the emission of the two central groups fromthat of the cluster. The optical42 and X-ray wavelet-images looked remarkablysimilar. Under quite general assumptions, they were able to estimate themasses of the NGC 4874 and NGC 4889 subclusters in 3.4 × 10¹³M⊙ and2.6× 1013M⊙, again quite close to the original Mellier et al.’s estimates.
7.3 The Radio Halo Coma C
A complete history of the Coma structure would not be complete withoutmentioning the radio-halo of Coma. In fact, theory and observations suggestthat it is related to the subclustering in Coma.
Cluster radio-halos are very rare; Hanisch64 searched for Coma-like radio-halos in 72 nearby Abell clusters and did not find any! So, Coma is ratherexceptional in this respect (there are only ∼ 10 cluster radio-halos known,see Feretti, these proceedings). Its radio-halo, Coma C, was first detected at408 MHz by Large et al.83, as an extended source of 45’ size at the Comacentre. Willson showed that Coma C could not be produced by the integratedradiation from normal galaxies. Kim et al.80 and Venturi et al.146 found thatComa C extends to the SW, and Giovannini et al.56 proposed the existenceof a unique source extending from Coma C to 1253+274, passing through theSW group around NGC 4839 (see § 7.1). Recently, Feretti et al.43 measureda magnetic field associated with the cluster of ∼ 8.5µG, tangled on scales≤ 1 kpc.
The theorists had trouble in explaining the energy source of Coma C (see,e.g., Tribble139). The radio-halo can be powered by relativistic electrons mov-ing in a magnetic field. Cluster radio-galaxies can provide the relativistic elec-trons, but the strength of the magnetic field and the large extent of the radio-halo imply that the electrons must be re-accelerated far from their sources.
In the currently best model, recent (∼ 108 years) subcluster collisionsprovide the re-acceleration energy (see Tribble140). However, many clusterscontain substructures, and only a few clusters contain radio-halos, so the sit-uation is not so simple (see Feretti’s contribution in these proceedings for adiscussion on this topic).
8 An Old Vision of a New Cluster: Summary and Conclusions
At the end of this long yet not exhaustive historical review, one is left withthe feeling that everything was already known since long ago. It is sufficientto have a quick look to the important steps in our scientific understanding ofthe Coma cluster, before 1980:

• 1901: Wolf gives a map of Coma in which the SW group is already clearlyvisible;
• 1937: Zwicky discovers the ”missing-mass” problem;
• 1954: Shane & Wirtanen’s galaxy counts also show very clearly the SWsubcluster;
• 1957: Zwicky finds that bright and faint galaxies have different radialdistributions;
• 1958: Zwicky shows that the ”missing-mass” problem is a ”dark-matter”problem, because clusters are stable and non-expanding;
• 1959: Abell finds the secondary peak in the otherwise monotonicallyincreasing luminosity function of Coma galaxies;
• 1959: Large et al. detect Coma C, the radio-halo, at 408 MHz;
• 1960: Mayall shows that the velocity dispersion decreases with increasingclustercentric distance;
• 1961: van den Bergh makes the first objective detection of subclusteringin Coma;
• 1966: Reaves suggests that the lack of dwarf galaxies in the Coma coreis due to tidal disruption;
• 1971: Meekins et al. discover the X-ray emitting IC gas in Coma;
• 1973: Bahcall suggests the existence of subclustering around each of thetwo central dominant galaxies;
• 1973: des Forets & Schneider show that galaxies of different types havedifferent velocity distributions;
• 1975: Lecar shows that the lack of significant luminosity segregationimply that cluster galaxies have lost their halos;
• 1978: Sullivan & Johnson find three HI-deficient spirals in Coma;
• 1979: Johnson et al.’s X-ray map of Coma hints at the presence of a SWextension.

At the time they were produced, many of these early results needed firmconfirmation, that eventually came from more (and more accurate) data; onthe other hand, our theoretical understanding of these observational evidencesis still far from complete. However, it seems to me that the picture of adynamically young Coma cluster was already contained in these early results.So, maybe a more appropriate choice for this conference title could have been:”An Old Vision of a New Cluster”.
Acknowledgments
This paper is dedicated to my wife Patrizia, for sharing my busy life of wan-dering astronomer.
No historical review is unbiased. I apologize for the excessive emphasis Imay have put on my personal results, and for all other people’s results that Ihave misquoted or forgotten to mention.
I wish to thank Fabienne Casoli, Florence Durret, Daniel Gerbal, AlainMazure, for the perfect organization of this conference. I thank Michael Westfor pointing out to me Herschel’s work on the Coma cluster. I acknowledge thehospitality of the Trieste Astronomical Observatory, where a significant partof my bibliographic research was done.
References
1. Abell G.O., AJ 64, 1269 (1959)2. Abell G.O., in Problems of Extra-galactic research, IAU Symp. 15, p.213
(1961)3. Abell G.O., AJ 69, 529 (1964)4. Abell G.O., ARAA 3, 1 (1965)5. Abell G.O., ApJ 213, 327 (1977)6. Abell G.O., Corwin H.G., Olowin R.P., ApJS 70, 1 (1989)7. Andreon S., AA 276, L17 (1993)8. Andreon S., AA 314, 763 (1996)9. Andreon S., AAS 116, 429 (1996)10. Bahcall N.A., ApJ 183, 783 (1973)11. Bahcall N.A., astro-ph 9611148 (1996)12. Baier F.W., Astron.Nachr. 305, 175 (1984)13. Bailey M.E., MNRAS 201, 271 (1982)14. Bernstein G.M., Nichol R.C., Tyson J.A., Ulmer M.P., Wittman D. AJ
110, 1507 (1995)15. Biviano A., Durret F., Gerbal D. et al. AA 297, 610 (1995)16. Biviano A., Durret F., Gerbal D. et al. AA 311, 95 (1996)
17. Boldt E., McDonald F.B., Riegler G., Serlemitsos P., Phys.Rev.Letters17, 447 (1966)
18. Bothun G.D., Schommer R.A., Sullivan W.T. III, AJ 89, 466 (1984)19. Briel U.G., Henry J.P., Bohringer H., AA 259, L31 (1992)20. Burbidge E.M., Burbidge G.R. AJ 66, 10 (1961)21. Burns J.O., Roettiger K., Ledlow M., Klypin A., ApJ 427, L87 (1994)22. Caldwell N., Rose J.A., Sharples R.M., Ellis R.S., Bower R.G., AJ 106,
473 (1993)23. Capelato H.V., Gerbal D., Mathez G., et al., ApJ 241, 521 (1980)24. Capelato H.V., Gerbal D., Mathez G., Mazure A., Salvador-Sole E., ApJ
252, 433 (1982)25. Carpenter E.F., ApJ 88, 344 (1938)26. Chincarini G., Giovanelli R., Haynes M.P., ApJ 269, 13 (1983)27. Colless M., Dunn A. M., ApJ 458, 435 (1996)28. Cordey R.A., MNRAS 215, 437 (1985)29. Cowie L.L., Henriksen M.J., Mushotzky R.F., ApJ 317, 593 (1987)30. Cowsik R., McClelland J., ApJ 180, 7 (1973)31. Curtis H.D., Pub. Lick Obs., 13, 33, (1918).32. d’Arrest H., Astron.Nachr. 65, 1 (1865)33. Davis D.S., Mushotzky R.F., AJ 105, 409 (1993)34. des Forets G., Dominguez-Tenreiro R., Gerbal D., et al., ApJ 280, 15
(1984)35. des Forets G.P., Schneider J., AA 26, 397 (1973)36. de Vaucouleurs G., ApJ 131, 585 (1960)37. Doi M., Fukugita M., Okamura S., Turner E.L., AJ 109, 1490 (1995)38. Donas J., Milliard B., Laget M., AA 252, 487 (1991)39. Donas J., Milliard B., Laget M., AA 303, 661 (1995)40. Dressler A., Shectman S.A., AJ 95, 985 (1988)41. Dwek E., Rephaeli Y., Mather J.C., ApJ 350, 104 (1990)42. Escalera E., Slezak E., Mazure A., AA 264, 379 (1992)43. Feretti L., Dallacasa D., Giovannini G., Tagliani A., AA 302, 680 (1995)44. Feretti L., Dallacasa D., Giovannini G., Venturi T., AA 232, 337 (1990)45. Feretti L., Giovannini G., AA 147, L13 (1985)46. Ferguson H.C., MNRAS 263, 343 (1993)47. Fitchett M., Webster R., ApJ 317, 653 (1987)48. Friedman H., Byram E.T., ApJ 147, 399 (1967)49. Fuchs B., Materne J., AA 113, 85 (1982)50. Fusco-Femiano R., Hughes J.P., ApJ 429, 545 (1994)51. Gainullina R.H., Trudy Astr. Inst. Alma-Ata 12, 113 (1969)52. Gavazzi G., ApJ 320, 96 (1987)

53. Gavazzi G., Jaffe W., Valentijn E., in Clusters and Groups of Galaxies,F. Mardirossian et al. eds., p.147 (1984)
54. Gavazzi G., Randone I., Branchini E. ApJ 438, 590 (1995)55. Gerbal D., Mathez G., Mazure A., Monin J.L., in Clusters and Groups
of Galaxies, F. Mardirossian et al. eds., p.147 (1984)56. Giovannini G., Feretti L., Stanghellini C., AA 252, 528 (1992)57. Godwin J.G., Metcalfe N., Peach J.V. MNRAS 202, 113 (1983)58. Godwin J.G., Peach J.V. MNRAS 181, 323 (1977)59. Gorenstein P., Fabricant D., Topka K., Harnden F.R.Jr., ApJ 230, 26
(1979)60. Gregory S.A., ApJ 199, 1 (1975)61. Gregory S.A., Tifft W.G., ApJ 205, 716 (1976)62. Gregory S.A., Tifft W.G., ApJ 206, 934 (1976)63. Gursky H., Kellogg E., Murray S. et al., ApJ 167, L81 (1971)64. Hanisch R.J., AA 111, 97 (1982)65. Hawkins G.S., AJ 65, 346 (1960)66. Heeschen D.S., ApJ 124, 660 (1956)67. Henriksen M.J., Mushotzky R.F., ApJ 302, 287 (1987)68. Herbig T., Lawrence C.R., Readhead A.C.S., Gulkis S., ApJ 449, L5
(1995)69. Herschel W. ”On the Construction of the Heavens” in Philosophical
Trans. Royal Soc. London 75, 213 (1785)70. Holmberg E., ApJ 92, 200 (1940)71. Hubble E., Humason M.L., ApJ 74, 43 (1931)72. Hughes J.P., ApJ 337, 21 (1989)73. Hughes J.P., Gorenstein P., Fabricant D., ApJ 329, 82 (1988)74. Hughes J.P., Yamashita K., Okumura Y., Tsunemi H., Matsuoka M.,
ApJ 327, 615 (1988)75. Johnson M.W., Cruddace R.G., Fritz G., Shulman S., Friedman H. ApJ
230, 26 (1979)76. Karachentsev I.D., Karachentseva V.E., Richter G.M., Vennik J.A., AA
296, 643 (1995)77. Karachentsev I.D., Lipovetskii V.A., Astron.Zh. 45, 148 (1968)78. Kent S.M., Gunn J.E., AJ 87, 945 (1982)79. Kim K.-T., Kronberg P.P., Dewdney P.E., Landecker T.L., AAS 105,
385 (1994)80. Kim K.-T., Kronberg P.P., Giovannini G., Venturi T., Nature 341, 720
(1989)81. King I.R., ApJ 174, L123 (1972)82. Kormendy J., Bahcall J.N., AJ 79, 671 (1974)

83. Large M.I., Mathewson D.S., Haslam C.G.T., Nature 183, 1663 (1959)84. Lecar M., in Dynamics of Stellar Systems, IAU Symp. No.69, p.161
(1975)85. Limber D.N., in Problems of Extra-galactic research, IAU Symp. 15,
p.239 (1961)86. Lobo C., Biviano A., Durret F. et al., AA 317, 385 (1997)87. Lugger P. ApJ 303, 535 (1986)88. Lugger P., Structure and Dynamics of Elliptical Galaxies, T. de Zeeuw
ed., p.459 (1987)89. Makino N., PASJ 46, 139 (1994)90. Mattila K., AA 60, 425 (1977)91. Mayall N.U., Annales d’Astroph. 23, 344 (1960)92. Meekins J.F., Fritz G., Chubb T.A., Friedman H., Nature 231, 107
(1971)93. Mellier Y., Mathez G., Mazure A., Chauvineau B., Proust D., AA 199,
67 (1988)94. Merritt D., ApJ 313, 121 (1987)95. Metcalfe N., Ph.D. thesis (1983)96. Milgrom M., ApJ 270, 384 (1983)97. Millington S.J.C., Peach J.V., MNRAS 221, 15 (1986)98. Muller C.A., IAU Symp. no. 9, p.465 (1959)99. Nanni D., Pittella G., Trevese D., Vignato A., AA 95, 188 (1981)100. Neymann J., Scott E.L., Zonn W., AJ 67, 583 (1962)101. Noonan T.W., AJ 76, 182 (1971)102. Omer G.C., AJ 57, 22 (1952)103. Omer G.C., AJ 71, 394 (1966)104. Omer G.C., Page T.L., Wilson A.G., AJ 70, 440 (1965)105. Ostriker J.P., Peebles P.J.E., ApJ 186, 467 (1973)106. Peebles P.J.E., AJ 75, 13 (1970)107. Quintana H., MNRAS 219, 511 (1986)108. Perea J., Moles M., del Olmo A., MNRAS 219, 511 (1986)109. Reaves G., PASP 78, 407 (1966)110. Rood H.J., Ph.D. thesis (1965)111. Rood H.J., PASP 80, 424 (1968)112. Rood H.J., ApJ 158, 657 (1969)113. Rood H.J., ApJ 162, 333 (1970)114. Rood H.J., ApJ 188, 451 (1974)115. Rood H.J., Page T.L., Kintner E.C., King I.R., ApJ 175, 627 (1972)116. Rood H.J., Turnrose B.E., ApJ 152, 1057 (1968)117. Roos N., Aarseth S.J., AA 114, 41 (1982)

118. Schechter, P., ApJ 203, 297 (1976)119. Schipper L., & King I.R., ApJ 220, 798 (1978)120. Schwarschild M., AJ 59, 273 (1954)121. Serlemitsos P.J., Smith B.W., Boldt E.A., Holt S.S., Swank J.H., ApJ
211, L63 (1977)122. Shane C.D., Wirtanen C.A., AJ 59, 285 (1954)123. Sherbanowski A.L., Soobsch.Spets.Astrofis.Obs.Vyp. 31, 23 (1981)124. Simkin S.M., AA 55, 369 (1977)125. Smart N.C., Ap.Letters 14, 233 (1973)126. Smith S., ApJ 83, 499 (1936)127. Struble M.F., AJ 84, 27 (1979)128. Sullivan W.T.III, Bothun G.D., Bates B., Schommer R.A., AJ 86, 919
(1981)129. Sullivan W.T.III, Johnson P.E., ApJ 225, 751 (1978)130. The L.S., White S.D.M., AJ 92, 1248 (1986)131. The L.S., White S.D.M., AJ 95, 15 (1988)132. The L.S., White S.D.M., AJ 95, 1642 (1988)133. The L.S., White S.D.M., AJ 99, 7 (1990)134. Thompson L.A., ApJ 244, L43 (1981)135. Thompson L.A., Gregory S.A., AJ 106, 2197 (1993)136. Thuan T.X., Kormendy J., PASP 89, 466 (1977)137. Tifft W.G., ApJ 175, 613 (1972)138. Tifft W.G., Gregory S.A., ApJ 205, 696 (1976)139. Tribble, P.C., MNRAS 253, 147 (1991)140. Tribble, P.C., MNRAS 263, 31 (1993)141. Tuberg M., ApJ 98, 501 (1943)142. Turnrose B.E., Rood H.J., ApJ 159, 773 (1970)143. Valtonen M.J., Byrd G.G., ApJ 230, 655 (1979)144. Valtonen M.J., Byrd G.G., ApJ 303, 523 (1986)145. van den Bergh S., PASP 73, 46 (1961)146. Venturi T., Giovannini G., Feretti L., AJ 99, 1381 (1990)147. Vikhlinin, A., Forman, W., Jones C., ApJ 435, 162 (1994)148. The Virgo Cluster of Galaxies, ESO workshop proceedings, 1985, O.-G.
Richter & B. Binggeli eds.149. Watt M.P., Ponman T.J., Bertram D., et al., MNRAS 258, 738 (1992)150. Welch G.A., Sastry G.N., ApJ 169, L3 (1971)151. Wesson P.S., AA 61, 177 (1977)152. Wesson P.S., Lermann A., Ap. Space Sci. 46, 335 (1977)153. Wesson P.S., Lermann A., Goodson R.E., Ap. Space Sci. 48, 357 (1977)154. West M.J., Jones C., Forman W., ApJ 451, L5 (1995)
155. White S.D.M., MNRAS 177, 717 (1976)156. White S.D.M., MNRAS 179, 33 (1977)157. White S.D.M., Briel U.G., Henry J.P., MNRAS 261, L8 (1993)158. Willson M.A.G., MNRAS 151, 1 (1970)159. Wolf M., Astron.Nachr. 155, 127 (1901)160. Wolf M., Pub. Astrophysik. Obs. Konigstuhl-Heidelberg, p.127 (1902)161. Zabludoff A.I., Franx M., AJ 106, 1314 (1993)162. Zwicky F., Helv. Phys. Acta 6, 110 (1933)163. Zwicky F., ApJ 86, 217 (1937)164. Zwicky F., PASP 50, 218 (1938)165. Zwicky F., ApJ 95, 555 (1942)166. Zwicky F., PASP 63, 61 (1951)167. Zwicky F., PASP 64, 242 (1952)168. Zwicky F., PASP 64, 247 (1952)169. Zwicky F., Morphological Astronomy, Springer-Verlag, Berlin (1957)