Artigo Novo 3
15
Measuring the regional availability of biomass for biofuels and the potential for microalgae Jana Kosinkova a,b , Amar Doshi c , Juliette Maire d , Zoran Ristovski a,b , Richard Brown a , Thomas J. Rainey a,n a School of Chemistry, Physics and Mechanical Engineering, Science and Engineering Faculty, Queensland University of Technology, 2 George St, Brisbane 4000, QLD, Australia b International Laboratory for Air Quality and Health, Queensland University of Technology, Brisbane, QLD, Australia c School of Economics and Finance, QUT Business School, Queensland University of Technology, Brisbane, QLD, Australia d Ecole Nationale Supérieure d’Agronomie et des Industries Alimentaires, 2 Avenue de la Foret de Haye, 54505 Vandoeuvre-les-Nancy, France article info Article history: Received 3 October 2014 Received in revised form 22 January 2015 Accepted 23 April 2015 Available online 26 May 2015 Keywords: Bioenergy Biomass Microalgae Australia Biofuel abstract Biomass is an important energy resource for producing bioenergy and growing the global economy whilst minimising greenhouse gas emissions. Many countries, like Australia have a huge amount of biomass with the potential for bioenergy, but non-edible feedstock resources are significantly under- exploited. Hence it is essential to map the availability of these feedstocks to identify the most appropriate bioenergy solution for each region and develop supply chains for biorefineries. Using Australia as a case study, we present the spatial availability and opportunities for second and third generation feedstocks. Considerations included current land use, the presence of existing biomass industries and climatic conditions. Detailed information on the regional availability of biomass was collected from government statistics, technical reports and energy assessments as well as from academic literature. Second generation biofuels have the largest opportunity in New South Wales, Queensland and Victoria (NSW, QLD and VIC) and the regions with the highest potential for microalgae are Western Australia and Northern Territory (WA, NT), based on land use opportunity cost and climate. The approach can be used in other countries with a similar climate. More research is needed to overcome key technical and economic hurdles. & 2015 Elsevier Ltd. All rights reserved. Contents 1. Introduction ....................................................................................................... 1272 1.1. Biofuels in Australia........................................................................................... 1272 1.2. Feedstocks .................................................................................................. 1272 1.2.1. Forestry and sawmill residue ............................................................................ 1272 1.2.2. Sugar cane waste fibre, bagasse, and trash.................................................................. 1273 1.2.3. Agricultural residues ................................................................................... 1273 1.2.4. Microalgae ........................................................................................... 1273 1.3. Conversion technologies ....................................................................................... 1274 1.3.1. Waste biomass conversion technologies .................................................................... 1274 1.3.2. Microalgae conversion .................................................................................. 1276 2. Methodology ...................................................................................................... 1276 2.1. Collation of data on existing industry biomass waste and land-use ........................................................... 1276 2.2. Logistical considerations ....................................................................................... 1276 3. Results ........................................................................................................... 1276 3.1. Forest and sawmill residues .................................................................................... 1276 3.2. Bagasse and cane trash ........................................................................................ 1278 3.3. Agricultural residues .......................................................................................... 1279 Contents lists available at ScienceDirect journal homepage: www.elsevier.com/locate/rser Renewable and Sustainable Energy Reviews http://dx.doi.org/10.1016/j.rser.2015.04.084 1364-0321/& 2015 Elsevier Ltd. All rights reserved. n Corresponding author at: O Block Level 7 708, 2 George St, Brisbane 4000, QLD, Australia. Tel.: þ61 7 3138 1977. E-mail address: [email protected] (T.J. Rainey). Renewable and Sustainable Energy Reviews 49 (2015) 1271–1285
-
Upload
marina-sartori -
Category
Documents
-
view
214 -
download
0
description
microalgas
Transcript of Artigo Novo 3

Measuring the regional availability of biomass for biofuelsand the potential for microalgae
Jana Kosinkova a,b, Amar Doshi c, Juliette Maire d, Zoran Ristovski a,b, Richard Brown a,Thomas J. Rainey a,n
a School of Chemistry, Physics and Mechanical Engineering, Science and Engineering Faculty, Queensland University of Technology, 2 George St, Brisbane4000, QLD, Australiab International Laboratory for Air Quality and Health, Queensland University of Technology, Brisbane, QLD, Australiac School of Economics and Finance, QUT Business School, Queensland University of Technology, Brisbane, QLD, Australiad Ecole Nationale Supérieure d’Agronomie et des Industries Alimentaires, 2 Avenue de la Foret de Haye, 54505 Vandoeuvre-les-Nancy, France
a r t i c l e i n f o
Article history:Received 3 October 2014Received in revised form22 January 2015Accepted 23 April 2015Available online 26 May 2015
Keywords:BioenergyBiomassMicroalgaeAustraliaBiofuel
a b s t r a c t
Biomass is an important energy resource for producing bioenergy and growing the global economywhilst minimising greenhouse gas emissions. Many countries, like Australia have a huge amount ofbiomass with the potential for bioenergy, but non-edible feedstock resources are significantly under-exploited. Hence it is essential to map the availability of these feedstocks to identify the mostappropriate bioenergy solution for each region and develop supply chains for biorefineries. UsingAustralia as a case study, we present the spatial availability and opportunities for second and thirdgeneration feedstocks. Considerations included current land use, the presence of existing biomassindustries and climatic conditions. Detailed information on the regional availability of biomass wascollected from government statistics, technical reports and energy assessments as well as from academicliterature. Second generation biofuels have the largest opportunity in New South Wales, Queensland andVictoria (NSW, QLD and VIC) and the regions with the highest potential for microalgae are WesternAustralia and Northern Territory (WA, NT), based on land use opportunity cost and climate. The approachcan be used in other countries with a similar climate. More research is needed to overcome key technicaland economic hurdles.
& 2015 Elsevier Ltd. All rights reserved.
Contents
1. Introduction . . . . . . . . . . . . . . . . . . . . . . . . . . . . . . . . . . . . . . . . . . . . . . . . . . . . . . . . . . . . . . . . . . . . . . . . . . . . . . . . . . . . . . . . . . . . . . . . . . . . . . . 12721.1. Biofuels in Australia. . . . . . . . . . . . . . . . . . . . . . . . . . . . . . . . . . . . . . . . . . . . . . . . . . . . . . . . . . . . . . . . . . . . . . . . . . . . . . . . . . . . . . . . . . . 12721.2. Feedstocks . . . . . . . . . . . . . . . . . . . . . . . . . . . . . . . . . . . . . . . . . . . . . . . . . . . . . . . . . . . . . . . . . . . . . . . . . . . . . . . . . . . . . . . . . . . . . . . . . . 1272
1.2.1. Forestry and sawmill residue . . . . . . . . . . . . . . . . . . . . . . . . . . . . . . . . . . . . . . . . . . . . . . . . . . . . . . . . . . . . . . . . . . . . . . . . . . . . 12721.2.2. Sugar cane waste fibre, bagasse, and trash. . . . . . . . . . . . . . . . . . . . . . . . . . . . . . . . . . . . . . . . . . . . . . . . . . . . . . . . . . . . . . . . . . 12731.2.3. Agricultural residues . . . . . . . . . . . . . . . . . . . . . . . . . . . . . . . . . . . . . . . . . . . . . . . . . . . . . . . . . . . . . . . . . . . . . . . . . . . . . . . . . . . 12731.2.4. Microalgae . . . . . . . . . . . . . . . . . . . . . . . . . . . . . . . . . . . . . . . . . . . . . . . . . . . . . . . . . . . . . . . . . . . . . . . . . . . . . . . . . . . . . . . . . . . 1273
1.3. Conversion technologies . . . . . . . . . . . . . . . . . . . . . . . . . . . . . . . . . . . . . . . . . . . . . . . . . . . . . . . . . . . . . . . . . . . . . . . . . . . . . . . . . . . . . . . 12741.3.1. Waste biomass conversion technologies. . . . . . . . . . . . . . . . . . . . . . . . . . . . . . . . . . . . . . . . . . . . . . . . . . . . . . . . . . . . . . . . . . . . 12741.3.2. Microalgae conversion . . . . . . . . . . . . . . . . . . . . . . . . . . . . . . . . . . . . . . . . . . . . . . . . . . . . . . . . . . . . . . . . . . . . . . . . . . . . . . . . . . 1276
2. Methodology . . . . . . . . . . . . . . . . . . . . . . . . . . . . . . . . . . . . . . . . . . . . . . . . . . . . . . . . . . . . . . . . . . . . . . . . . . . . . . . . . . . . . . . . . . . . . . . . . . . . . . 12762.1. Collation of data on existing industry biomass waste and land-use . . . . . . . . . . . . . . . . . . . . . . . . . . . . . . . . . . . . . . . . . . . . . . . . . . . . . . . . . . . 12762.2. Logistical considerations . . . . . . . . . . . . . . . . . . . . . . . . . . . . . . . . . . . . . . . . . . . . . . . . . . . . . . . . . . . . . . . . . . . . . . . . . . . . . . . . . . . . . . . 1276
3. Results . . . . . . . . . . . . . . . . . . . . . . . . . . . . . . . . . . . . . . . . . . . . . . . . . . . . . . . . . . . . . . . . . . . . . . . . . . . . . . . . . . . . . . . . . . . . . . . . . . . . . . . . . . . 12763.1. Forest and sawmill residues . . . . . . . . . . . . . . . . . . . . . . . . . . . . . . . . . . . . . . . . . . . . . . . . . . . . . . . . . . . . . . . . . . . . . . . . . . . . . . . . . . . . 12763.2. Bagasse and cane trash . . . . . . . . . . . . . . . . . . . . . . . . . . . . . . . . . . . . . . . . . . . . . . . . . . . . . . . . . . . . . . . . . . . . . . . . . . . . . . . . . . . . . . . . 12783.3. Agricultural residues . . . . . . . . . . . . . . . . . . . . . . . . . . . . . . . . . . . . . . . . . . . . . . . . . . . . . . . . . . . . . . . . . . . . . . . . . . . . . . . . . . . . . . . . . . 1279
Contents lists available at ScienceDirect
journal homepage: www.elsevier.com/locate/rser
Renewable and Sustainable Energy Reviews
http://dx.doi.org/10.1016/j.rser.2015.04.0841364-0321/& 2015 Elsevier Ltd. All rights reserved.
n Corresponding author at: O Block Level 7 708, 2 George St, Brisbane 4000, QLD, Australia. Tel.: þ61 7 3138 1977.E-mail address: [email protected] (T.J. Rainey).
Renewable and Sustainable Energy Reviews 49 (2015) 1271–1285

3.4. Microalgae . . . . . . . . . . . . . . . . . . . . . . . . . . . . . . . . . . . . . . . . . . . . . . . . . . . . . . . . . . . . . . . . . . . . . . . . . . . . . . . . . . . . . . . . . . . . . . . . . . 12814. Discussion . . . . . . . . . . . . . . . . . . . . . . . . . . . . . . . . . . . . . . . . . . . . . . . . . . . . . . . . . . . . . . . . . . . . . . . . . . . . . . . . . . . . . . . . . . . . . . . . . . . . . . . . 12825. Conclusion . . . . . . . . . . . . . . . . . . . . . . . . . . . . . . . . . . . . . . . . . . . . . . . . . . . . . . . . . . . . . . . . . . . . . . . . . . . . . . . . . . . . . . . . . . . . . . . . . . . . . . . . 1283Acknowledgements . . . . . . . . . . . . . . . . . . . . . . . . . . . . . . . . . . . . . . . . . . . . . . . . . . . . . . . . . . . . . . . . . . . . . . . . . . . . . . . . . . . . . . . . . . . . . . . . . . . . . 1283References . . . . . . . . . . . . . . . . . . . . . . . . . . . . . . . . . . . . . . . . . . . . . . . . . . . . . . . . . . . . . . . . . . . . . . . . . . . . . . . . . . . . . . . . . . . . . . . . . . . . . . . . . . . . 1283
1. Introduction
Population growth and global warming have led to a focus onproducing renewable and sustainable fuels for motor vehicles.First generation biofuels such as ethanol from starch and molasses,and biodiesel from some oil crops use edible feedstocks; but theyhave limited sustainability credentials. Their use has created the“food vs. fuel” debate, questions have arisen about sustainableland use and there has been speculation about the contribution offirst generation biofuels to declining global wheat and maizestocks, with oilseed prices tripling. Although there are otherfactors contributing to price increases, such as drought, it appearsthese price rises may have been more moderate without usingedible feedstocks and arable land for generating fuels [1]. Firstgeneration biofuels also raise ethics questions about convertingfoodstuffs to fuel when there is malnourishment in some devel-oping countries [2]. Finally, another important aspect is theenvironmental damage caused by deforestation, and the destruc-tion of ecosystems for increased biomass production [3].
The issues associated with first generation biofuels havecreated interest in second generation biofuels, which do not useedible feedstocks, as a renewable energy alternative. The Interna-tional Energy Agency projected that second generation biofuelswill account for 25% of total biofuels production by 2030 [4].Second generation biofuels often use waste biomass from otherindustries such as forestry and the sugar industry, and otheragriculture waste fibres which are affordable [5]. The utilisationof residues decreases the demand on arable land which couldotherwise be used for food or energy crop production. In recentyears, interest in feedstock supply has increased. There are pub-lications dealing with locally available, sustainable biomassresources [6–9].
More recently there has been considerable interest in microalgaeas a feedstock for biofuels [10,11]. Microalgae are microscopic photo-synthetic organisms with numerous constituents such as proteins,carbohydrates, and lipids, and are amenable for renewable biofuelproduction. It has the advantage of being grown in vast quantities onnon-arable land, leading to the term “third generation” biofuel.Microalgae also has numerous advantages in comparison with terres-trial biomass in terms of high oil yield, short growing periods, andadaptability. However, there are also concerns about financial viabilityand water use with current technology, which need to be greatlyrefined if it can be used for fuel [12].
Unfortunately, to date, a comprehensive and mapping of theavailability and potential use of bioenergy feedstock for secondand third generation biorefineries in Australia was missing. Theaim of this paper is to explore the sustainable energy feedstockslandscape in order to determine how land may be best used forrenewable energy production. There is no single database compar-ing the potential amount of all lignocellulosic and microalgaeresources available for biofuel utilisation and so data was collectedfrom government and academic sources for this purpose. Manyprevious studies have provided analyses on the suitability of landfor a single technological pathway without a detailed regionalsurvey of existing land use. A raster graphic program based onaccurate map references provides a better illustration of collatedvalues from the available literature and statistic institutions. This
paper also provides an introduction to the conversion technolo-gies, including likely feedstock price and conversion routes.
Australia is used as a case study. It has abundant waste fibrefrom numerous industries for second generation biofuels, anabundance of data from these industries, and a large diversity ofland and climate types. The last point would allow for observa-tions made to have general implications in other countries. Also, ifmicroalgae technology becomes a viable fuel option, Australia is anobvious candidate with vast areas of non-arable land in warmclimates that can provide high growth rates [13].
1.1. Biofuels in Australia
In Australia energy consumption in the transport sector isincreasing at the rate of 2.4% per year [9] and it is dependent onfossil fuels [14–16], and so sustainable alternatives are sought.Ethanol production uses molasses from sugar processing andstarch from flour milling as feedstocks. Most of the fuel ethanolproduced by the three Australian producers is blended with petrolas E10 blend petrol (10% ethanol and 90% petrol). Biodiesel ismainly produced from tallow and waste cooking oil. Biodiesel canbe mixed with regular diesel; B5 is the common blend and B20biodiesel blend is generally sold for commercial operations.
In terms of first generation biofuels feedstocks, in 2005–2006,Australia produced and consumed 57 million litres of biofuels,consisting of 41 million litres of ethanol fuel and 16 million litres ofbiodiesel, which corresponds to only 0.4% of total transport fuelconsumption [17]. Renewable energy sources accounted for theremaining 6% of total energy consumption in 2012–2013, with itsshare of the energy mix increasing compared with the previous year[18]. Total production capacity of ethanol and biodiesel was about330 ML and 175 ML respectively in 2010 [19]. In 2013 the productionof ethanol was only 280 ML and biodiesel was 110 ML [20] due to theclosure of several plants. While the existing ethanol and biodieselsector is based on first generation biofuels technology, research anddevelopment of second and third generation technology biofuels iscontinuing. Previous workers found that second generation biofuelscan overcome the major shortcomings of first generation biofuels inAustralia [9]. The following subsections relate to second and thirdgeneration feedstock opportunities.
1.2. Feedstocks
In Australia, the main second generation feedstocks are tallowand used cooking oil with biodiesel production facilities in VIC, SA,WA, NSW, NT and QLD [9]. However, new forestry and sawmillresidue, sugarcane waste fibre, other agricultural residues, andmicroalgae are being researched and developed. The feedstocksexplored in this study were perceived by the authors to be the mainopportunities for large scale biofuels development in Australia.
1.2.1. Forestry and sawmill residueForestry residues consist of the crown and branches of trees, the
leaf material, bark and stump, as well as non-merchantable stembiomass, which are left in the forests or are burned. Furthermore,large areas of forests and woodlands are still cleared annually for the
J. Kosinkova et al. / Renewable and Sustainable Energy Reviews 49 (2015) 1271–12851272

expansion of agricultural activity or foresting. A small fraction of thecut wood from the cleaning activity is used for energy production,but the majority is not utilised and is either burned or left to decayon site [21]. However, these sources are broadly distributed in remotelocations, so collection and transportationwould be expensive. Wastefibre is produced at sawmills in the form of sawdust and offcuts.
1.2.2. Sugar cane waste fibre, bagasse, and trashSugarcane is harvested and crushed at a sugar factory which
produces juice and fibre. The juice is purified and concentrated toproduce sugar crystals, and the fibre (i.e. bagasse) is typically burnedto produce steam and electricity for the factory. Sugarcane bagasse hasthe advantage in that it is already collected at a centralised location,reducing transport costs. Sugarcane harvesters allow the leaves(known as trash) to drop to the ground so that only the stem of theplant is used. However, leaves could either be harvested together withthe stem (although this generates some issues in the sugar productionprocess), or collected separately at a higher cost. Bagasse is onlyproduced for six months of the year, so while it has many advantages,it cannot be produced all year round and during long term storagethere is a risk of biological degradation.
Australia produces over 11 million tonnes of bagasse annuallyand over 9 million tonnes of cane harvest waste, comprising leavesand tops, which have traditionally been burnt in the field eachyear [22]. However, the majority of the industry harvests green (i.e. unburned) cane. Around 95% of Australian sugar productionoccurs in Queensland with a small amount being produced innorthern New South Wales.
1.2.3. Agricultural residuesAustralia has a potentially large biomass resource in the form of
agricultural crop waste. The residues from grain cropping gener-ally comprise the stalks of the grain (i.e. stubble). The main cropsin Australia are wheat (22,856 kt) and barley (7472 kt) with arange of smaller crops totalling 9548 kt including sorghum, cotton,canola, oats, and rice for grain in the year 2013 [23]. Theproportion of the plant which is left as residue varies with plant
type and is often left in the field. Currently, the stubble is notcollected as a feedstock for producing bio-oil, but removed andburned in the field or used for animal feed or bedding. The mostimportant issue for biofuels from agricultural residues is the effecton soil structure and nutrients. There are a few options: eitherremove only a percentage of residues for biofuel production, or usethe ash residue that remains after processing as a soil conditioner.
1.2.4. MicroalgaeUnlike second generation biofuel feedstocks, microalgae is not a
waste biomass. It is often cultivated in extensive or intensive artificialenvironments—the latter being of more interest with regard tobiofuels. Research in the intensive cultivation of microalgae has beenconducted since the 1950s [24,25]. Subsequent research into inten-sive cultivation, as found in reviews by Goldman [26], and Tapie andBernard [27], has investigated biomass yields through differentproduction technologies and assumptions, resulting in varyingdegrees of technical and financial feasibility of microalgae produc-tion. Benemann and Oswald [28] highlighted the potential of micro-algae production for biodiesel through production pathways thatincorporated recycled input sources of carbon dioxide and nitrogenthrough flue gas and wastewater, respectively. This review was acatalogue of the production technology up to that point. Mosteconomic feasibility studies since have not been able to deriveeconomically feasible production pathways. However, current studiesare focussed on improving the potential for microalgae as a feasiblebiomass for biodiesel production.
Intensive autotrophic microalgal biomass cultivation requiressubstantial resources to achieve high rates of solar conversion andproductivity yields. The two most common cultivation methodsare through open-pond systems or some variant of photo-bioreactors (PBRs) [29]. There have been substantial researchfindings on the much higher capital and operating costs of PBR,and despite the higher productivity, the resulting price of biofuel(assuming similar downstream processing and hence comparingcosts of biomass cultivation) was almost two times higher thanopen ponds [30–32]. This has been contradicted by Norsker and
Fig. 1. Australia’s key climate groups (ACT not shown due to small geographical size; adapted from [44]).
J. Kosinkova et al. / Renewable and Sustainable Energy Reviews 49 (2015) 1271–1285 1273

co-workers [33] who found little consistent difference betweenthe unit costs of biomass and energy between the two systems. Inaddition, the exposed nature of open-pond systems is suggested tolead to more significant water demands in highly evaporativeclimates [31] and risks of exposure to contaminative elements[34], the latter increasing the risk to potential productive biomassoutput. Campbell and co-workers [35] suggest that based oncurrent productivities of algal strains, producing biofuels fromopen-pond systems is also currently unfeasible, but future tech-nological and scale investments can overcome this.
1.3. Conversion technologies
1.3.1. Waste biomass conversion technologiesThere are different reviews focusing on effective technologies
and the processes to convert biomass into useful liquid biofuelsand bio-products [36–38]. In this paper we briefly describe themost common which have the most research interest. Key con-version technologies for biomass to fuel are the thermo-chemicalprocesses such as gasification, pyrolysis, and liquefaction wherehigh temperature is used to degrade the fibre. Gasification is themost developed and commercialised route, while liquefaction isthe least developed. Gasification occurs at high temperatures(approaching 800 1C) to produce syngas which can then bereformed to liquid fuels by Fischer Tropsch synthesis. Pyrolysisand liquefaction occur at lower temperatures (200–350 1C); thedifference being pressure (up to 350 bar for liquefaction). Moredescription of the thermochemical technologies and an analysis ofthe potential production of advanced biofuels is nicely describedin Sanna’s [39]. These processes generate a biocrude which mustthen be further treated to convert it to a liquid fuel. Liquefactionhas a tremendous advantage in that it is feedstock agnostic andcan tolerate feedstocks with very high water contents, and doesnot require feedstock predrying. Waste biomass can be pre-treatedto liberate glucose monomers which are then fermented toproduce ethanol. This process is the focus of a significant interna-tional research effort.
A well-established technology route used on a small scale is theproduction of fatty acid methyl esters (FAME) through various
Second generationfeedstock
Pre-processing Transport
Transport
Storage
On-site Off-site
Transport
Conversion technology
Third generation feedstock cultivation
Harvesting and pre-processing On-site
Conversion Technology
Off-site (transport)
Intermediatestorage
Fig. 2. Processing for (a) second and (b) third generation biofuel feedstocks (optional steps represented by dashed lines).
Fig. 3. Forest area by state [53-55] (NB: Different scales on each axis; ACT nativearea is too small to be seen (123,000 ha)).
J. Kosinkova et al. / Renewable and Sustainable Energy Reviews 49 (2015) 1271–12851274

Fig. 4. Australian forest area (adapted from [54]).
Fig. 5. The location of sawmills in Australia.
J. Kosinkova et al. / Renewable and Sustainable Energy Reviews 49 (2015) 1271–1285 1275
types of transesterification whereby vegetable or animal oils canbe converted to fuel by reaction with methanol, producing glycerolas a waste product [40].
1.3.2. Microalgae conversionThe most common approach to produce microalgae fuels so far has
been to use mechanical disruption to liberate lipids by bead milling,homogenisation, and mechanical pressing [41,42], followed by extrac-tion (solvent extraction or supercritical CO2). Most commonly thelipids are converted to FAME via the same reaction as for wastevegetable oil. Liquefaction and ultrasonic-assisted extraction have alsobeen studied. Kumar and collective provide a comprehensive reviewon various methods of lipid extraction from microalgae available, aswell as discussion of advantages and disadvantages [43].
2. Methodology
2.1. Collation of data on existing industry biomass waste and land-use
Australia is a developed nation with a large amount of existingforestry, sugar, and other agriculture production. Australia is alsovast, with both arable and non-arable land and it has a wide rangeof climates (desert, tropical, and temperate climates, Fig. 1), mak-ing it a suitable case study. The population is concentrated in thesouth east corner with New South Wales (NSW), Victoria (VIC) andQueensland (QLD) being the most populous states (44 millioninhabitants), followed by South Australia (SA) and Western Aus-tralia (WA; 1–2 million) and finally Tasmania (TAS), NorthernTerritory (NT), and the Australian Capital Territory (ACT; notshown in the figure due to its small geographical size).
In order to study renewable fuel production and appropriateland use using existing industrial waste and microalgae, theapproach has been to firstly collate information about the sizeand geographical location of existing industries which producewaste biomass, and hence an estimate of each region’s waste. Foreach industry, the cultivation area and total biomass data werecollected at a state level from the Australian Bureau of Statistics(ABS) for agriculture (for each of many crop types)1, and theDepartment of Agriculture, Fisheries and Forestry (DAFF) forsugarcane2 and forestry (native and plantation)3. These statisticswere collated and then distributed proportionally on a regionalbasis as a proportion of the total production for each industry—agriculture [45], sugarcane [46], and forestry [45]. Assumptionswere made that all of the total available residue/waste biomasscould potentially be allocated for biofuels and the availability ofthese biomasses by state is proportionally consistent across theareas of cultivation.
For regions where there is no industry producing wastebiomass, much of the land is native forest or mountainous (e.g.south eastern Australia), which was excluded from the mappingactivity (these maps are shown later in this article). The areas thatremain are a range of non-arable areas and unused arable land,which may be potentially useful for microalgae production. Thus,the allocation of regions for potential microalgae cultivation werebased on intersecting factors of land availability, exposure tosufficient/abundant solar energy, and the presence of an abundantwater supply (i.e. in coastal regions [47]). The guiding principleapplied was that for microalgae production, areas could only beused that were not already dominated by existing biomassproduction such as agriculture and forests, as this will have amajor impact on Life Cycle Analysis outcomes.
2.2. Logistical considerations
The logistics for bringing feedstock to a biorefinery will varydepending on the type of feedstock, the geographical location andthe local weather/climate as well as the prevailing industry. Beforebiomass can be processed, considerations include:
� Harvesting and collection of biomass from sole suppliers (as inthe sugar industry) or multiple suppliers (e.g. saw mills). It ismore efficient when there is enough material to be collectedfrom a single site without the need for collecting from adistributed region. Collecting biomass from the field includesthe scheduling of labour, machinery and other equipment.
� Loading, handling and transport. Biomass is taken to a centrallocation where road transport can be used. Increasing remote-ness increases transportation costs.
� Unloading and loading to road vehicles in order to transportthe biomass to central biorefineries, and the unloading andstorage of biomass on site.
� Biomass storage. Allen and co-workers [48] modelled inter-mediate storage systems. This system, in which the biomasshad to be transported twice, resulted in higher delivered costthan a system in which there is only one transport movement,due to the additional transport and handling cost incurred.Some feedstocks are seasonal; therefore consideration needs tobe made of the length of time and the large quantities involved,which will have influence on the total cost.
Lakovou and co-workers [49] designed a system for the manage-ment of a waste biomass supply chain for energy production whichincludes a hierarchy of decision-making parameters. This system wasadapted for our purposes for use in a subsequent study (Fig. 2).
Other factors for each biofuel feedstock include moisture content,energy density, and the value placed on the waste biomass by theproducer. The price of the biomass can also be affected by availabilityof other fuels in the vicinity. The available data on Australia's biomassfeedstocks are summarised in Table 4 (in the conclusion part), whichreports the amount (Mt/year) and price ($/t).
3. Results
3.1. Forest and sawmill residues
Liquid biofuels derived fromwood residues are not widely usedin Australia. In 2006, Australia’s total forested area was 149.2million hectares (ha) or 19% of Australia’s land area [50]. Howeveronly 2.0 Mha belonged to plantation forestry comprised of hard-wood (mainly eucalyptus), and softwood, consisting of varioustypes of pine species. An overview of Australia’s energy resourcesin 2007 estimated total forestry residues at 23 million tonnes per
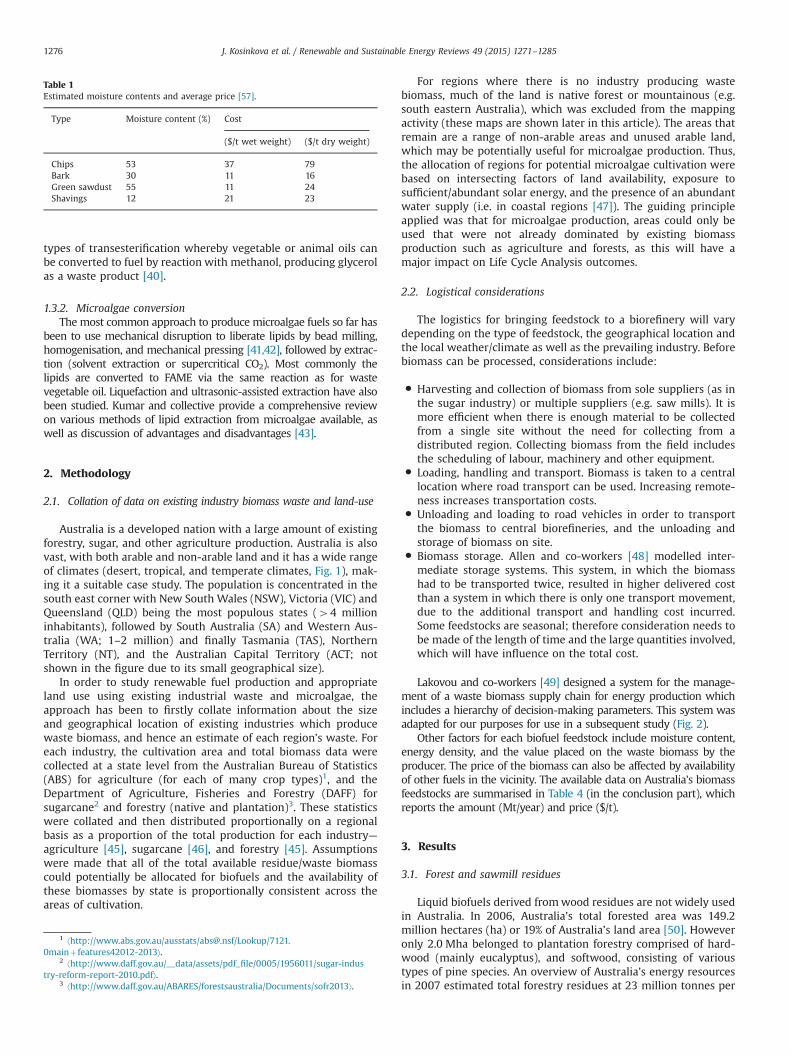
Table 1Estimated moisture contents and average price [57].
Type Moisture content (%) Cost
($/t wet weight) ($/t dry weight)
Chips 53 37 79Bark 30 11 16Green sawdust 55 11 24Shavings 12 21 23
1 ⟨http://www.abs.gov.au/ausstats/[email protected]/Lookup/7121.0mainþfeatures42012-2013⟩.
2 ⟨http://www.daff.gov.au/__data/assets/pdf_file/0005/1956011/sugar-industry-reform-report-2010.pdf⟩.
3 ⟨http://www.daff.gov.au/ABARES/forestsaustralia/Documents/sofr2013⟩.
J. Kosinkova et al. / Renewable and Sustainable Energy Reviews 49 (2015) 1271–12851276

year [51]. Large amounts of forest residue can be produced in theregions of Australia dominated by native forest, particularly fromdefective trees, and the remnants of bushfires or diseased trees.
Ximenes and co-workers [52] examined the proportion ofabove-ground biomass (AGB) in logs and the residues of threehardwood and two softwood species, which account for approxi-mately 65% of the total volume of sawlogs harvested in Australia.The percentage of the AGB in forest residues at harvest ranged
from 30% to 55% depending on the species. The average dry weightof residues left in the forest per tree ranged from 800 to 1600 kgfor hardwoods and 80 to 350 kg for softwoods.
The following graph (Fig. 3) compares the native and plantationforest area in hectares for all states and territories in Australia. Theterritories have minimal investment in plantation forestry, while thesix states have significant plantations in the following order: Victoriaand Western Australia4New South Wales4Queensland4South
Table 3Potential availability of bagasse by region [63].
Region Cane crushed (million t/a) Dry bagasse potential (dry tonnes per year)
Northern 7.8 856,700Herbert 4.0 439,400Burdekin 8.6 946,400Mackay 10.0 1098,500Bundaberg 3.9 429,000NSW 2.3 252,200
Fig. 6. Sugar cane regions in Australia (adapted from [66]).
Table 2Primary considerations for handling lignocellulose materials.
Issue Solution
Contamination and hygiene Concrete floorsMoisture Sealed containers, roofed bunkerOverheating and biological degradation Monitoring temperature and moistureParticle size Screening
J. Kosinkova et al. / Renewable and Sustainable Energy Reviews 49 (2015) 1271–1285 1277
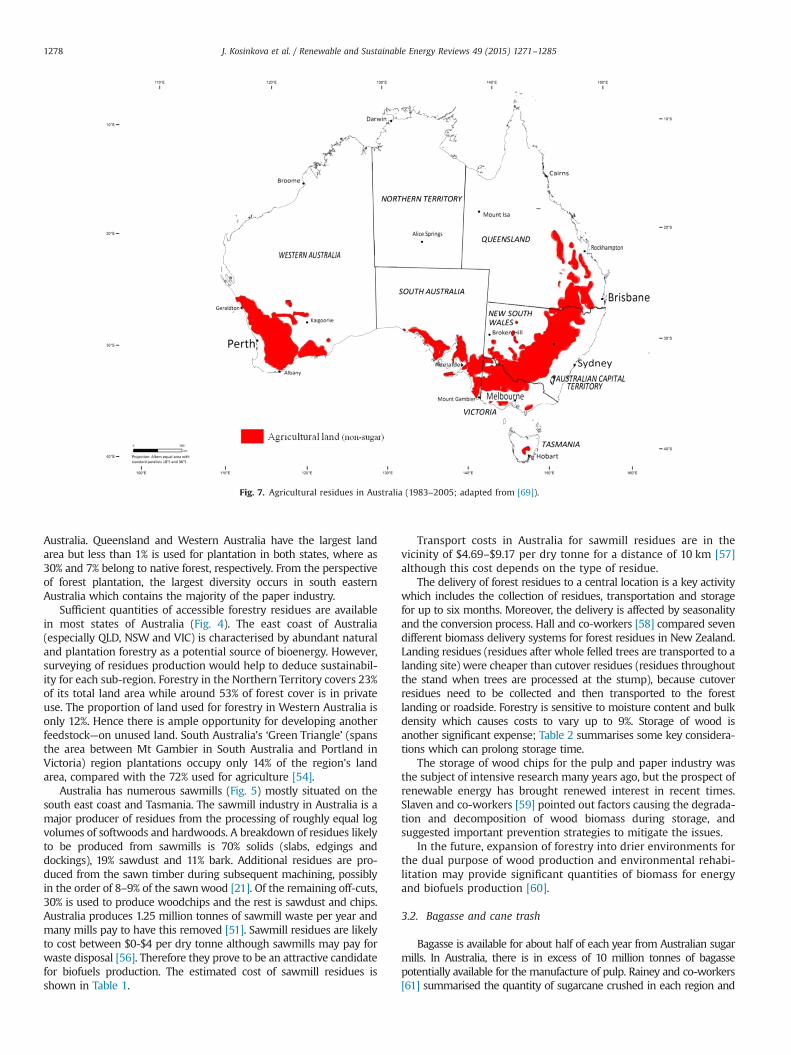
Australia. Queensland and Western Australia have the largest landarea but less than 1% is used for plantation in both states, where as30% and 7% belong to native forest, respectively. From the perspectiveof forest plantation, the largest diversity occurs in south easternAustralia which contains the majority of the paper industry.
Sufficient quantities of accessible forestry residues are availablein most states of Australia (Fig. 4). The east coast of Australia(especially QLD, NSW and VIC) is characterised by abundant naturaland plantation forestry as a potential source of bioenergy. However,surveying of residues production would help to deduce sustainabil-ity for each sub-region. Forestry in the Northern Territory covers 23%of its total land area while around 53% of forest cover is in privateuse. The proportion of land used for forestry in Western Australia isonly 12%. Hence there is ample opportunity for developing anotherfeedstock—on unused land. South Australia’s ‘Green Triangle’ (spansthe area between Mt Gambier in South Australia and Portland inVictoria) region plantations occupy only 14% of the region’s landarea, compared with the 72% used for agriculture [54].
Australia has numerous sawmills (Fig. 5) mostly situated on thesouth east coast and Tasmania. The sawmill industry in Australia is amajor producer of residues from the processing of roughly equal logvolumes of softwoods and hardwoods. A breakdown of residues likelyto be produced from sawmills is 70% solids (slabs, edgings anddockings), 19% sawdust and 11% bark. Additional residues are pro-duced from the sawn timber during subsequent machining, possiblyin the order of 8–9% of the sawnwood [21]. Of the remaining off-cuts,30% is used to produce woodchips and the rest is sawdust and chips.Australia produces 1.25 million tonnes of sawmill waste per year andmany mills pay to have this removed [51]. Sawmill residues are likelyto cost between $0-$4 per dry tonne although sawmills may pay forwaste disposal [56]. Therefore they prove to be an attractive candidatefor biofuels production. The estimated cost of sawmill residues isshown in Table 1.
Transport costs in Australia for sawmill residues are in thevicinity of $4.69–$9.17 per dry tonne for a distance of 10 km [57]although this cost depends on the type of residue.
The delivery of forest residues to a central location is a key activitywhich includes the collection of residues, transportation and storagefor up to six months. Moreover, the delivery is affected by seasonalityand the conversion process. Hall and co-workers [58] compared sevendifferent biomass delivery systems for forest residues in New Zealand.Landing residues (residues after whole felled trees are transported to alanding site) were cheaper than cutover residues (residues throughoutthe stand when trees are processed at the stump), because cutoverresidues need to be collected and then transported to the forestlanding or roadside. Forestry is sensitive to moisture content and bulkdensity which causes costs to vary up to 9%. Storage of wood isanother significant expense; Table 2 summarises some key considera-tions which can prolong storage time.
The storage of wood chips for the pulp and paper industry wasthe subject of intensive research many years ago, but the prospect ofrenewable energy has brought renewed interest in recent times.Slaven and co-workers [59] pointed out factors causing the degrada-tion and decomposition of wood biomass during storage, andsuggested important prevention strategies to mitigate the issues.
In the future, expansion of forestry into drier environments forthe dual purpose of wood production and environmental rehabi-litation may provide significant quantities of biomass for energyand biofuels production [60].
3.2. Bagasse and cane trash
Bagasse is available for about half of each year from Australian sugarmills. In Australia, there is in excess of 10 million tonnes of bagassepotentially available for the manufacture of pulp. Rainey and co-workers[61] summarised the quantity of sugarcane crushed in each region and
Fig. 7. Agricultural residues in Australia (1983–2005; adapted from [69]).
J. Kosinkova et al. / Renewable and Sustainable Energy Reviews 49 (2015) 1271–12851278

the potential quantity of depithed bagasse (Table 3). Some sugar millsvalue bagasse around $40 per dry tonne, which presents bagasse as alow cost raw material when compared to wood [46].
An important transport consideration for bagasse is its bulkynature, which makes transport potentially expensive. Bagasse has anadvantage over some other feedstocks in that it is already collected ata central location (i.e. at the mill), so there are few additionalcollection and transport costs. Hodgson and Hocking [62] reportedthat the cost of transporting bagasse from one site to another was$11 per tonne. The concentration of sugar mills in northern Queens-land in the Mackay, Bundaberg, Herbert and Burdekin regions ishigher than in other regions. These areas offer the best prospects fora biofuels facility based on bagasse. In Table 3 it can be seen thatMackay has the highest quantity of bagasse and is also wellsupported by infrastructure and has low transport costs. The NewSouth Wales region is less attractive, as it has the smallest fibresupply and relatively high transportation costs.
Pre-processing of the original biomass feedstock to change theenergy density can decrease the price of transport and storage.
Hobson [64] compared costs for the road transport and storage ofraw bagasse and bagasse pre-processed torrefaction followed bypelletisation (TPB) for mills of four varying distances. Torrefactionis a thermal pre-treatment technology to upgrade ligno-cellulosicbiomass to a higher quality and more attractive biofuel [65]—oxygen is removed, and torrefied biomass has a lower O/C ratiowhen compared to the original biomass. Hobson indicated atransport cost saving of over 30% for TPB when compared to rawbagasse for long distance haulage, although TPB was more expen-sive to transport than raw bagasse for distances less than 100 km(Fig. 6).
3.3. Agricultural residues
Quantifying the amount of feedstock from agricultural residueswas problematic owing to the broad number of crop types whichvary from state to state, the differences in farming and processing,and production data for each crop being reported by differentorganisations. The amounts of agricultural residues available per
Fig. 8. Second generation biomass production in Australia by state (ACT excluded).
J. Kosinkova et al. / Renewable and Sustainable Energy Reviews 49 (2015) 1271–1285 1279

Table 4A regional suitability comparison of 2nd and 3rd generation feedstocks and their prices.
Feedstock Region offer the bestprospects
Least attractivelocation
EstimatedAustralianproductionamount (Mt/year)
Estimatedprice oftransport($/t /km)
Potentialfeedstockprice($/toven dryweight)
Seasonality Advantages Disadvantages
Sugar caneBagasse North of Queensland
(Mackay, Bundaberg,Hebert, Burdekin)
New South Wales 10.6[22,46,51]
$ 8-15 per50 km
$40/t [66] 6 monthsproduction
Cheap Bulky nature ofbagasse makes thetransport moreexpensive
Cane trash Based on sugar cane cropsArea [66]
Based on sugar canecrops area [66]
9.25 [46,51] $11/t [62] Sustainablefor storage
Proximity of the mill: noadditional collection andtransport cost
Risk of biologicalcontaminationduring storage[45,46]
Cane waste is not used forsugar extractionSustainable land use
NAd US5–6b
[81]Low emissions [45,46]
ForestSawmillresidues
South east of Queensland,Tasmania, Victoria, SouthAustralia, New SouthWales, South WesternAustralia
Northern Territory,North Queensland,North WesternAustralia
1.3a [45] $4.7-$9.2/t/10 km[59]
10-60c [19] Availablewhole year
Sawmill are currentlypaying for waste disposal
Collection andtransport would beexpensive by thelocation of theresources
Forestwaste
Based on wood wastefacility location [19]
Based on woodwaste facilitylocation [19]
2.7a fromNative Forest
$12-$40/tper 50-200km [19]
60-120c
[19]Sustainable land use Storage 6 months
[19,45,52,57]
2.1a fromPlantation[45]
$14-$45/tper 50-200km [19]
Low emissions[19,45,52,57]
Agriculturalwastes
East, southern and westcoast, South Australia andCentral West of NewSouth Wales
North, NorthQueensland, NorthWestern Australia
53a [45] $15-$45/tper 50-200km [19]
55-70/c [19] Seasonalproduction
Large amount available Loss of nutrient
(Malle, Wimmera areas,Yorke, Lower North, OuterAdelaide, Murrumbidgee)
Based on the spatialdistribution ofstubble productionfor years 1983-2005[69]
Suitable forstorage
Sustainable land use Low amount perhectare: increasethe collection andtransportation cost
Based on the spatialdistribution of stubbleproduction for years1983-2005 [69]
Low emissions[42,45,56,70]
Need an in-fieldphysicalfractionation toremoveunattractiveresiduecomponentsStorage, biologicalcontamination[42,45,56,70]
Algae Pilbara, WA; NorthernQLD; Borroloola, NT
Southwest WA,Southeast NSW
No currentcommercialproduction
Potentialestimates$80-$1300[83]
Potentialyear-roundproduction
High growth rate High Capital cost
Low solar exposure.[92]
Can be grown in saline orhypersaline water, notcompeting with agriculturefor limited freshwaterresources
New technology,lack of risk data towarrantinvestment
NSW, Highagriculture andforestry
Less portable waterdemand than land crops
Risk of yield lossby biologicalcontamination
Can be located on marginaland no-arable land
Harvesting algaeand separating oilis energy-intensive
High efficiency CO2sequestration
Salt precipitationon the bioreactorwalls, pumps andvalves [93,94]
Nutrient fixing (N&P) ofwastewaterNo pesticides/herbicidesuse
J. Kosinkova et al. / Renewable and Sustainable Energy Reviews 49 (2015) 1271–12851280

hectare vary with crop type, thus affecting the cost of collectionand transportation to biorefineries. Not all crop residues are ofequal value, considering the chemical composition varies, thusaffecting the yield of conversion to biofuel. Not all of the non-grainbiomass of a particular crop will be available for collection forbiomass energy production, because most farmers will retainsome straw to provide soil cover to prevent wind and watererosion, and to help maintain soil carbon and recycle nutrients[67]. Hess and co-workers [68] describe a strategy for reducing theamount of unattractive residue components shipped to centralisedbiorefineries by an in-field physical fractionation.
Fig. 7 (adapted from [69]) shows large cropping areas in theeastern, southern and western areas of Australia. From the map itcan be seen that high productivity mainly occurs in the northwestof Victoria, and also around the Yorke Peninsula and lower northand outer Adelaide areas of South Australia, and in the west ofNew South Wales. In an average year, these areas have 4500 ktstubble within a 70 km radius, but only 21 Mt of the total stubbleproduction is potentially harvestable [70]. There remains anopportunity for storing agricultural fibres together with forestryresidue when the two industries are in close proximity.
There has been little research into the potential delivery systemfor straw. In Europe large rectangular bales are used for transpor-tation. Allen and co-workers [48] modelled five supply systems forstraw, and showed that large Hesston rectangular bales havesubstantially lower delivered costs than systems involving theproduction of small rectangular bales or roll bales. However, largebales require specialised and relatively expensive machinery. Baleweight is approximately 500 kg for Hesston bales but depends onthe moisture content, packing density and size.
Straw can be stored and dried outside only in the summer (it isgrown in non-tropical climates which are dry in summer). Internalstorage requires good ventilation, stock must be raised off the flooron pallets, as even concrete floors can transmit moisture bycapillary action, and must be kept inside a building where thereis no possible moisture contamination. If the straw is wet it startsto grow mould, it can also begin to ferment and can thenspontaneously combust. However, it can keep for up to a yearwithout issues if stored correctly.
Several researchers proposed supply chains for the optimalprocessing of agricultural residues, taking into account the con-tributions of the cost of production, harvesting, collection, trans-portation and storage [71–73]. Kumar and co-workers [71]concluded that the production cost method essentially reflectsthe minimum amount a farmer has to be paid for the agriculturalresidues, with the estimates based on the maximum acceptableprice defining the upper limit up which the energy end-user canpay for the agricultural residues. There is also a need to address
cultural and social issues, as farmers’ own attitudes and those oftheir peers will influence their management of residues [74].
3.4. Microalgae
Australia is an increasingly popular target locale for microalgaeresearch. This is due to benefits pertaining to climate, solar insola-tion, and the availability of vast land areas of marginal/low agricul-tural value [13,75,76]. Griffin and co-workers [77] suggested thatAsian-Pacific countries would benefit more from importing micro-algal biofuels from Australia rather than cultivating their ownmicroalgae due to these inherent benefits. There is currently nolarge-scale intensive microalgae production in Australia [75]. Currentcultivation of microalgae for biofuels has been for mostly pilot andresearch activities, with many airline companies funding suchprograms for developing alternative aviation fuels [78], and com-mercial producers with as yet unreleased production data [77].
Hypothetical studies have only been able to suggest potentialeconomic feasibility through assumptions for future developments inproductivity and efficiency, with current technologies suggesting ahigher production cost than the fossil fuel diesel prices. This is alsoconsistent with studies outside Australia. The lowest cost estimate foran Australian-based analysis was US$0.63 per litre of biodiesel, albeitwith optimistic assumptions for growth rate and lipid yield [79]. US-based estimates were between US$3.54 to 8.94 per litre4 based on theproduction system (i.e. open-pond or PBR with same downstreamprocessing) [80]. As for algal oil production, Davis and co-workers [30]estimated the lowest cost being between US$0.80 to 1.30 per litre(using open-ponds), again with optimistic potential future yields;current production yields produced an algal oil price of US$2.25 to4.78 per litre. The corresponding diesel price was similar to Richardsonand co-workers [80] at US$ 2.60 to 5.42 per litre (with PBRs yieldingthe higher estimate).
There has been much discussion in the literature relating tomicroalgae biomass cultivation (most often for biofuels), and theassociated opportunities and limitations thereof. Factors related towater and energy demand have been significant in determining thefeasibility of the biomass production. Although touted much for itsability to grow in saline [79] and wastewater [81], the costs involved inpre-treating and transporting the water resource have been high-lighted as a potential limitation [82]. Lundquist and co-workers [83]had estimated that water provision can make up as much as 6–7% ofthe total cost, which is significant considering a majority of that cost isfrom piping and transportation. Yang at al. [84] discussed that the
Table 4 (continued )
Feedstock Region offer the bestprospects
Least attractivelocation
EstimatedAustralianproductionamount (Mt/year)
Estimatedprice oftransport($/t /km)
Potentialfeedstockprice($/toven dryweight)
Seasonality Advantages Disadvantages
Algae can also providevaluable co-product (e.g.animal/aquaculture feed,fertilisers, methane)[93,94]
a Estimated production amount of total biomass availability for fuel and energy.b Opportunity cost of trash in field.c Estimated production cost including growing, harvest, collection and chipping except agricultural wastes.d Price is the same as bagasse if it is green cane harvest (cane and trash is harvested at the same time and transported to the mill).
4 All US based studies were converted from gallons to litres using1 gal¼3.7854118 l.
J. Kosinkova et al. / Renewable and Sustainable Energy Reviews 49 (2015) 1271–1285 1281
significant water costs (footprint) can be reduced with improvedgrowth and lipid accumulation rates, although these two factors arecounteractive. Additionally, the need for high solar irradiation toencourage biomass growth also has a correlation with water loss fromevaporation in open-ponds. In the use of saline and wastewater, hererecycling can reduce the water requirements by up to 90% [84], thereis, however, increased risk associated with the contamination of thecultivation culture [82].
There have been a number of studies estimating the net energyreturn from microalgae biomass production, testing various cultivation,harvest, and drying technologies. The energy ratios have also oftenaccounted for transport energy for fertilisers, water, and other relatedinputs. In comparing open ponds and PBRs, the former is most oftenfound to have a more efficient energy ratio, with only Sander andMurthy [85] finding otherwise due to their relatively higher valueestimates. Open ponds were also generally found to have less energyintensive cultivation, with more significant energy costs coming fromthe harvesting and drying stages of the biomass production, increasingthe energy ratio as much as 10-fold [82,86,87]. In contrast, the morecontrolled environments associated with PBRs resulted in significantenergy costs for cultivation, causing an inefficient energy ratio; themajority of energy costs were attributed to construction and culturecirculation [32,88]. Slade and Bauen [82] found that assuming themajority of the energy in the production is derived from fossil fuels,the net carbon emissions from biomass production are positive, andmore significantly so for PBRs.
4. Discussion
There are challenges in the commercial transition to second genera-tion biofuels produced from lignocellulosic feedstocks. These include thesupply of the potential feedstock, associated logistics, and the cost ofconversion. While the latter two factors are important to the success incommercial production of lignocellulosic biofuels, this study found that
the potential supply sources of feedstock are most important indetermining the location of feasible biorefineries. Large quantities ofbiomass are required tomeet current and future transport fuel demands.
Fig. 8 illustrates the potential availability of second generationfeedstock by state. This was estimated based on the state-basedproportion of land use and total national feedstock availability foragricultural waste [45], sugarcane residues [46] and forest waste[45,89]. Based on current production, the east coast of Australia(QLD, NSW, VIC) appears to have the greatest potential for secondgeneration biofuel production. The availability of arable land andideal climate conditions have resulted in the majority of theagricultural production, including sugarcane, being produced inthis region. Queensland in particular has the highest potential forgenerating biofuel from sugarcane waste. In contrast, the avail-ability of feedstock in WA is about half that of the east coast; this iseven lower (5–10%) in the northern and southern regions.
Despite ACT containing some agricultural land and a large areaof national conservation parks (almost 88% of the total land area),the availability of feedstocks was negligible; hence ACT wasexcluded from the figure. At the lower end of the availabilityspectrum, NT and Tasmania have some proportions of forestlandthat at first glance, could provide a source of biofuel feedstock;Tasmania in particular is renowned for its forest-rich landscapes.However, a large proportion of these forestlands are inaccessiblefor the collection of waste biomass. More than 50% of Tasmania’sforest are nature conservation reserves (33%) and multiple-useforests (30%) where harvesting is not permitted [90]. Similarly, NTis sparsely covered by accessible forestry with the remaindermostly held in private and leasehold tenure use for grazing.
Unlike the case with second generation biofuel feedstocks,there are no large-scale microalgae cultivation facilities in Aus-tralia and hence, a similar data analysis for potential availabilitycould not be conducted.
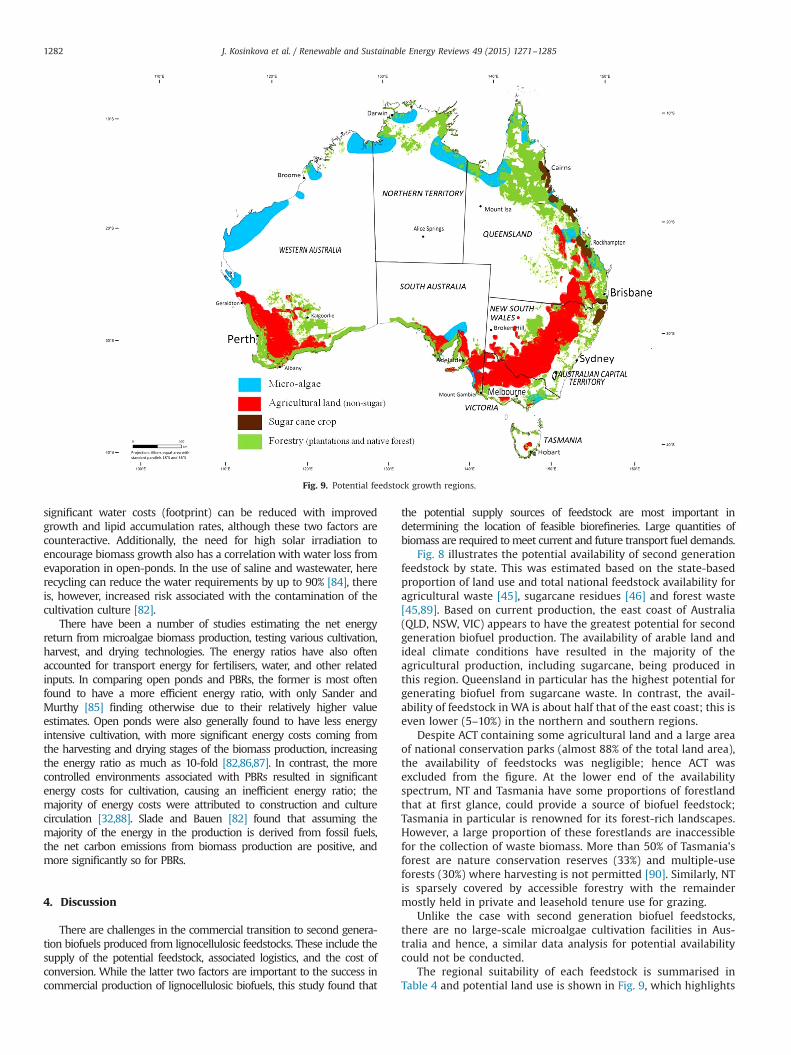
The regional suitability of each feedstock is summarised inTable 4 and potential land use is shown in Fig. 9, which highlights
Fig. 9. Potential feedstock growth regions.
J. Kosinkova et al. / Renewable and Sustainable Energy Reviews 49 (2015) 1271–12851282

the spatial distribution of potential feedstocks. The distribution ofsecond generation feedstock is based on location of existingcultivation, and therefore potential areas of waste biomass avail-ability, with the assumption that all available biomass is poten-tially available for biofuels. The spatial distribution on feedstocksas shown in Fig. 9 can be used to assess the feasibility ofprospective biorefineries locations. Geographical locations demon-strate the potential utilisation of a diversity of supply sources thatcan extend the operating period of biofuel production.
Hypothetical studies pertaining to Australian-based microalgaeproduction have suggested southwest of Broome in WA as asuitable region based on climate conditions [79,91], with particu-larly high solar radiation and low average rainfall. There has alsobeen indication of other regions in Australia as being potentialcultivation regions e.g. NT and northwest Queensland [47]. Factorssuch as ownership, affordability, and restrictions from cultivationsystems have been suggested as those which will affect thepotential availability of land for microalgae cultivation, but onlyas secondary and tertiary to climate and land topography [91].Thus, the allocation for potential microalgae availability in Fig. 9 isbased on the most suitable regions for microalgae cultivationstemming from these various intersecting factors.
The development of microalgae-based biofuel technologiesdoes present potential for future biofuel production. This isespecially applicable to regions outside of the east coast that havesubstantial areas of unutilised coastal land, such as in WA. Theseland areas are generally plagued with inadequate land and climateconditions for terrestrial agriculture and forestry, but are suitablefor artificial microalgae cultivation. This highlights one of themajor benefits of intensive microalgae cultivation in artificialenvironments, where ideal land and climate conditions are notessential for cultivation [13,75,76].
However, there is a relationship between ideal climate conditionsand achieving maximum biomass production, both in terrestrial andartificial environments that depend on autotrophic photosynthesis. Theprevalence of agriculture and forestry in the east coast can be attributedto both the highly suitable land type and the climate. This suggests thatboth arable land and ideal climate are subject to scarcity and therefore,will play a key role in land use selection for biofuels. Transitioning awayfrom existing terrestrial cultivation raises opportunity costs, especially foragriculture and food production.
For microalgae cultivation, ideal climate conditions would allow formaximum growth rates to be realised, particularly for open pondsystems. Achieving high biomass growth rates of microalgae has beenhighlighted as a major factor that can determine the financial feasibilityof microalgae production for biofuels, given high harvesting and con-version costs [79]. An assessment of microalgae cultivation locations byBorowitzka et al. [91] had detailed the climate conditions to includeexposure to solar irradiation, net evaporation rates, and temperature.
The selection of regions for microalgae cultivation requires aneconomic analysis of the related tradeoffs, including with existingbiomass industries. Although microalgae production appears possiblein regions that do not compete with existing agriculture/forestry (e.g.away from coastal land), the cultivation operations will potentially beunable to realise the maximum possible growth rates compared toareas with ideal climate characteristics, which may have existingterrestrial cultivation. Developing microalgae production in idealregions in the east coast raises opportunity costs in replacing existingagricultural and forestland particularly in terms of resource realloca-tion, food production, and ecosystem services; despite the potential toeclipse second generation feedstock production for bioenergy by over7 times in the east coast, and 20 times on average across the country5.
Therefore, this review finds that regions in WA and NT (as outlined inFig. 9) are the most suitable locations for development of microalgaecultivation for biofuels due to the availability of unutilised land andpreferable climate.
The approach presented in this article can be used as afoundation to better understand the regional availability ofbiomass feedstocks and the potential for microalgae. Theauthors believe that the approach and rationale used in theanalysis can be applied at local, national and internationalscales. A large amount of data was collected for Australia as acase study and this data suggests some opportunities for thegeographical location of a local biorefinery based on forestry,agriculture or sugarcane waste or microalgae.
5. Conclusion
Second and third generation biofuel feedstocks were studied inorder to identify their regional suitability, taking into considerationland use, existing biomass industries, the relevant conversion tech-nologies, and using Australia as a case study. The study included thecollection of a large amount of detailed information on the biomassindustries for the case study and a detailed mapping activity wasconducted. For areas with existing agriculture and forestry, secondgeneration biofuels appear to be more attractive than microalgae,based on opportunity costs of resource reallocation. Second generationbiofuels have the best opportunities where there are areas of arableland and suitable climatic conditions. For Australia, this is particularlytrue in NSW, QLD and VIC. The best regions for microalgae are inregions that are coastal, warmer, and non-arable as these regions areless likely to have existing biomass industries and yet have access towater. However, growth rates may be less than the optimal rates basedon the climatic conditions of these regions. For areas with existingagriculture based on operation cost, investment should be directedtowards making second generation biofuels from agricultural waste.With further improvement in costs for microalgae production, micro-algae cultivation may be warranted in areas that have available waterand abundant unutilised, non-arable land.
Acknowledgements
This work was financially supported by QUT’s School of Chemistry,Physics and Mechanical Engineering via a PhD scholarship and theUniversity’s Early Career Academic Research Development (ECARD)program.
References
[1] Mitchell D. A note on rising food prices. The World Bank, DevelopmentProspects Group; 2008. p. 21.
[2] Mortimer N. Ethics for biofuels… and everything else. Significance 2011;8:108–11.[3] Gui MM, Lee KT, Bhatia S. Feasibility of edible oil vs. non-edible oil vs. waste
edible oil as biodiesel feedstock. Energy 2008;33:1646–53.[4] Bioenergy IEA. From 1st-to 2nd-Generation BioFuel technoloGies. An overview
of current industry and RD&D activities IEA-OECD; 2008.[5] Sticklen M, Alameldin H, Oraby H. Towards cellulosic biofuels evolution: using
the petro-industry model. Adv Crop Sci Technol 2014;2:2.[6] Gupta A, Verma JP. Sustainable bio-ethanol production from agro-residues: a
review. Renewable Sustainable Energy Rev 2015;41:550–67.[7] Ho DP, Ngo HH, Guo W. A mini review on renewable sources for biofuel.
Bioresour Technol 2014;169:742–9.[8] Brennan-Tonetta M, Guran S, Specca D, Cowan B, Sipos C, Melillo J. Feedstock
opportunities for bioenergy production: assessment of biomass energy poten-tial in New Jersey. Ind Biotechnol 2014;10:404–12.
[9] Azad A, Rasul M, Khan M, Sharma SC, Hazrat M. Prospect of biofuels as analternative transport fuel in Australia. Renewable Sustainable Energy Rev2015;43:331–51.
[10] Han S-F, Jin W-B, Tu R-J, Wu W-M. Biofuel production from microalgae asfeedstock: current status and potential. Crit Rev Biotechnol 2014:1–14.
5 This estimate is based on conservative open-pond growth rates (20 g/m2/day) [79].
J. Kosinkova et al. / Renewable and Sustainable Energy Reviews 49 (2015) 1271–1285 1283

[11] Zhu L. Biorefinery as a promising approach to promote microalgae industry: aninnovative framework. Renewable Sustainable Energy Rev 2015;41:1376–84.
[12] Singh B, Guldhe A, Rawat I, Bux F. Towards a sustainable approach fordevelopment of biodiesel from plant and microalgae. Renewable SustainableEnergy Rev 2014;29:216–45.
[13] Campbell PK, Beer T, Batten D. Life cycle assessment of biodiesel productionfrom microalgae in ponds. Bioresour Technol 2011;102:50–6.
[14] Surawski NC, Miljevic B, Ayoko GA, Elbagir S, Stevanovic S, Fairfull-Smith KE,et al. Physicochemical characterization of particulate emissions from acompression ignition engine: the influence of biodiesel feedstock. EnvironSci Technol 2011;45:10337–43.
[15] Bezergianni S, Dimitriadis A. Comparison between different types of renew-able diesel. Renewable Sustainable Energy Rev 2013;21:110–6.
[16] Surawski NC, Ristovski ZD, Brown RJ, Situ R. Gaseous and particle emissionsfrom an ethanol fumigated compression ignition engine. Energy ConversManage 2012;54:145–51.
[17] Love G, Cuevas-Cubria C. Outlook for biofuels in Australia—the challengesahead. Aust Commodities 2007;14:212–20.
[18] Bareau of Resource and Energy Economics. Australian energy update, ⟨http://www.bree.gov.au/files/files//publications/aes/2014-australian-energy-statistics.pdf2013⟩; 2014.
[19] Geoscience Australia and ABARE. Australian energy resource assessment. In:Department of Resources EaT, editor. Australian Government, Canberra,Australia; 2010. p. 358.
[20] Roger Farrell and Agricultural Specialist. Australia biofuels annual, ⟨http://gain.fas.usda.gov/Recent%20GAIN%20Publications/Biofuels%20Annual_Canberra_Australia_7-1-2014.pdf2014⟩; 2014.
[21] Fung PYH, Kirschbaum MUF, Raison RJ, Stucley C. The potential for bioenergyproduction from Australian forests, its contribution to national greenhousetargets and recent developments in conversion processes. Biomass Bioenergy2002;22:223–36.
[22] Puri M, Abraham RE, Barrow CJ. Biofuel production: prospects, challenges andfeedstock in Australia. Renewable Sustainable Energy Rev 2012;16:6022–31.
[23] Australian Bureau of Statistics. Agricultural commodities, Australia, ⟨http://www.abs.gov.au/ausstats/[email protected]/Lookup/7121.0mainþfeatures62012-20132014⟩; 2012–2013.
[24] Cook PM. Large-scale culture of Chlorella. In: Brunel J, Prescott GW, Tiffany LH,editors. The culturing of algae. Yellow Springs, OH: Charles F. KetteringFoundation; 1950. p. 53–75.
[25] Spoehr HA. The chemical composition of Chlorella; effect of environmentalconditions. Plant Physiol (Bethesda) 1949;24:120–49.
[26] Goldman JC. Outdoor algal mass cultures—I. Applications. Water Res1979;13:1–19.
[27] Tapie P, Bernard A. Microalgae production: technical and economic evalua-tions. Biotechnol Bioeng 1988;32:873–85.
[28] Benemann JR, Oswald WJ. Systems and economic analysis of microalgae pondsfor conversion of CO2 to biomass. Report to the Department of Energy:Department of Civil Engineering, University of California, Berkeley; 1996.
[29] Chisti Y. Biodiesel from microalgae. Biotechnol Adv 2007;25:294–306.[30] Davis R, Aden A, Pienkos PT. Techno-economic analysis of autotrophic
microalgae for fuel production. Appl Energy 2011;88:3524–31.[31] Brentner LB, Eckelman MJ, Zimmerman JB. Combinatorial life cycle assessment
to inform process design of industrial production of algal biodiesel. EnvironSci Technol 2011;45:7060–7.
[32] Stephenson AL, Kazamia E, Dennis JS, Howe CJ, Scott SA, Smith AG. Life-cycleassessment of potential algal biodiesel production in the United Kingdom: acomparison of raceways and air-lift tubular bioreactors. Energy Fuels2010;24:4062–77.
[33] Norsker N-H, Barbosa MJ, Vermuë MH, Wijffels RH. Microalgal production—aclose look at the economics. Biotechnol Adv 2011;29:24–7.
[34] Tredici MR. Mass production of microalgae: photobioreactors. In: Richmond A,editor. Handbook of microalgal culture, biotechnology and applied phycology.Wiley-Blackwell; 2003. p. 178–214.
[35] Campbell PK, Beer T, Batten D. Greenhouse gas sequestration by algae: energyand greenhouse gas life cycle studies: CSIRO Energy Transformed Flagship;2009.
[36] Nigam PS, Singh A. Production of liquid biofuels from renewable resources.Prog Energy Combust Sci 2011;37:52–68.
[37] Tekin K, Karagöz S, Bektaş S. A review of hydrothermal biomass processing.Renewable Sustainable Energy Rev 2014;40:673–87.
[38] Naik SN, Goud VV, Rout PK, Dalai AK. Production of first and secondgeneration biofuels: a comprehensive review. Renewable Sustainable EnergyRev 2010;14:578–97.
[39] Sanna A. Advanced biofuels from thermochemical processing of sustainablebiomass in Europe. Bioenergy Res 2014;7:36–47.
[40] Takase M, Zhao T, Zhang M, Chen Y, Liu H, Yang L, et al. An expatiate review ofneem, jatropha, rubber and karanja as multipurpose non-edible biodieselresources and comparison of their fuel, engine and emission properties.Renewable Sustainable Energy Rev 2015;43:495–520.
[41] Brennan L, Owende P. Biofuels from microalgae—a review of technologies forproduction, processing, and extractions of biofuels and co-products. Renew-able Sustainable Energy Rev 2010;14:557–77.
[42] Schönborn A, Ladommatos N, Williams J, Allan R, Rogerson J. The influence ofmolecular structure of fatty acid monoalkyl esters on diesel combustion.Combust Flame 2009;156:1396–412.
[43] Ranjith Kumar R, Hanumantha Rao P, Arumugam M. Lipid extraction methodsfrom microalgae: a comprehensive review. Front Energy Res 2015;2:61.
[44] Peel MC, Finlayson BL, McMahon TA. Updated world map of the Köppen–Geiger climate classification. Hydrol Earth Syst Sci Discuss 2007;4:439–73.
[45] O’Connell D, Batten D, O’Connor M, May B, Raison J, Keating B, et al. Biofuels inAustralia: an overview of issues and prospects: Rural Industries Research andDevelopment Corporation; 2007.
[46] Covey G, Rainey T, Shore D. A new opportunity to pulp bagasse in Australia?;2006.
[47] Consulting LEK. Advanced biofuels study, strategic directions for australia,summary report. Sydney, NSW: Australian Renewable Energy Agency; 2011. p.26.
[48] Allen J, Browne M, Hunter A, Boyd J, Palmer H. Logistics management andcosts of biomass fuel supply. Int J Phys Distrib Logist Manage 1998;28:463–77.
[49] Lakovou E, Karagiannidis A, Vlachos D, Toka A, Malamakis A. Waste biomass-to-energy supply chain management: a critical synthesis. Waste Manage2010;30:1860–70.
[50] Australian Bureau of Statistics. 4613.0—Australia’s environment: issues andtrends, Jan 2010. Special issue: climate change; 2010.
[51] Moghtaderi B, Sheng C, Wall TF. An overview of the Australian biomassresources and utilization technologies. BioResources 2007;1:93–115.
[52] Ximenes FA, Gardner WD, Kathuria A. Proportion of above-ground biomass incommercial logs and residues following the harvest of five commercial forestspecies in Australia. For Ecol Manage 2008;256:335–46.
[53] Bureau of Rural Sciences. Australian forest profiles plantation. In: Australia Go,editor.; 2008. p. 1–6.
[54] ABARES. Australia’s forest at a glance 2011. In: Sciences AboAarea, editor.Canberra; 2011. p. 1–104.
[55] National Forest Inventory and Bureau of Rural Sciences. Australia’s planta-tions: inventory updates 2010. In: Department of Agriculture FaF, editor.;2010. p. 1–8.
[56] Stucley C, Schuck S, Sims R, Larsen P, Turvey N, Marino B. Biomass energyproduction in Australia. Canberra: Revised Edition Rural Industries Researchand Development Corporation; 2004.
[57] Rodriguez LC, May B, Herr A, Farine D, O’Connell D. Biofuel excision and theviability of ethanol production in the Green Triangle, Australia. Energy Policy2011;39:1951–7.
[58] Hall P, Gigler JK, Sims RE. Delivery systems of forest arisings for energyproduction in New Zealand. Biomass and Bioenergy 2001;21:391–9.
[59] Slaven I, Haviarova E, Cassens D. Properties of wood waste stored for energyproduction. Purdue Extension: BioEnergy; 2011.
[60] Raison RJ. Opportunities and impediments to the expansion of forest bioe-nergy in Australia. Biomass Bioenergy 2006;30:1021–4.
[61] Rainey TJ, Covey G, Shore D. An analysis of Australian sugarcane regions forbagasse paper manufacture. Int Sugar J 2006;108:640–4.
[62] Hodgson J, Hocking B. Viability of sugar mill cogeneration projects. In:Proceedings of the 2006 conference of the Australian Society of Sugar CaneTechnologists held at Mackay, Queensland, Australia, 2–5 May 2006: Austra-lian Society of Sugar Cane Technologists; 2006. p. 1–11.
[63] Rainey TJ, Clark NB. An overview of bagasse as a resource for the Australianpaper industry. Int Sugar J 2004;106:608–11.
[64] Hobson P. Torrefaction and gasification for high efficiency second-generationbiofuel production. In: Proceedings of the 2009 conference of the AustralianSociety of Sugar Cane Technologists held at Ballina, New South Wales,Australia, 5–8 May 2009: Australian Society of Sugar Cane Technologists;2009. p. 389–99.
[65] Van der Stelt MJC, Gerhauser H, Kiel JHA, Ptasinski KJ. Biomass upgrading bytorrefaction for the production of biofuels: a review. Biomass Bioenergy2011;35:3748–62.
[66] Covey G, Rainey T, Shore D. The potential for bagasse pulping in Australia.Appita J 2006;59:17–22.
[67] Dunlop M. Assessing the availability of crop stubble as a potential biofuelresource. Population (pl/m2) 2008;100:120.
[68] Hess JR, Thompson DN, Hoskinson RL, Shaw PG, Grant DR. Physical separationof straw stem components to reduce silica. Biotechnol Fuels Chem: Springer2003:43–51.
[69] Herr A, Dunlop M. Agricultural feedstocks for bioenergy in Australia: animproved method for estimating the spatial availability; 2008.
[70] Herr A, O’Connell D, Dunlop M, Unkovich M, Poulton P, Poole M. Secondeharvest-Is there sufficient stubble for biofuel production in Australia? GCBBioenergy 2012;4:654–60.
[71] Kumar A, Purohit P, Rana S, Kandpal TC. An approach to the estimation of thevalue of agricultural residues used as biofuels. Biomass Bioenergy2002;22:195–203.
[72] Nilsson D, Hansson P-A. Influence of various machinery combinations, fuelproportions and storage capacities on costs for co-handling of straw and reedcanary grass to district heating plants. Biomass Bioenergy 2001;20:247–60.
[73] Sokhansanj S, Kumar A, Turhollow AF. Development and implementation ofintegrated biomass supply analysis and logistics model (IBSAL). BiomassBioenergy 2006;30:838–47.
[74] Herr A, Greiner R, Stoeckl N. Understanding adoption of on-farm conservationpractices in the Burdekin Dry Tropics, Queensland. Australas J Environ Manage2004;11:278–88.
[75] Farine DR, O’Connell DA, John Raison R, May BM, O’Connor MH, Crawford DF,et al. An assessment of biomass for bioelectricity and biofuel, and for
J. Kosinkova et al. / Renewable and Sustainable Energy Reviews 49 (2015) 1271–12851284

greenhouse gas emission reduction in Australia. GCB Bioenergy2012;4:148–75.
[76] Regan D, Gartside G. Liquid fuels from micro-algae in Australia. Melbourne;1983.
[77] Griffin GJ, Batten DF, Beer T, Campbell PK. The costs of producing biodieselfrom microalgae in the Asia-Pacific Region. In J Renewable Energy Dev (IJRED)2013;2:105–13.
[78] APAC Biofuel Consultants. Advanced and aviation biofuels in Australia.Australian biofuels 2013–2014, policy and growth ; 2013.
[79] Darzins A, Pienkos P, Edye L. Current status and potential for algal biofuelsproduction. A report to IEA bioenergy task; 2010. p39.
[80] Richardson JW, Johnson MD, Outlaw JL. Economic comparison of open pondraceways to photo bio-reactors for profitable production of algae for trans-portation fuels in the Southwest. Algal Res 2012;1:93–100.
[81] Batten D, Beer T, Freischmidt G, Grant T, Liffman K, Paterson D, et al. Usingwastewater and high-rate algal ponds for nutrient removal and the produc-tion of bioenergy and biofuels. Water Sci Technol 2013;67:915–24.
[82] Slade R, Bauen A. Micro-algae cultivation for biofuels: cost, energy balance,environmental impacts and future prospects. Biomass Bioenergy2013;53:29–38.
[83] Lundquist TJ, Woertz IC, Quinn NWT, Benemann JR. A realistic technology andengineering assessment of algae biofuel production. Berkeley, CA: EnergyBiosciences Institute; 2010.
[84] Yang J, Xu M, Zhang X, Hu Q, Sommerfeld M, Chen Y. Life-cycle analysis onbiodiesel production from microalgae: water footprint and nutrients balance.Bioresour Technol 2011;102:159–65.
[85] Sander K, Murthy GS. Life cycle analysis of algae biodiesel. Int J Life CycleAssess 2010;15:704–14.
[86] Kadam KL. Environmental implications of power generation via coal-microalgae cofiring. Energy 2002;27:905–22.
[87] Lardon L, He ́lias A, Sialve B, Steyer J-P, Bernard O. Life-cycle assessment ofbiodiesel production from microalgae. Environ Sci Technol 2009;43:6475–81.
[88] Jorquera O, Kiperstok A, Sales EA, Embiruçu M, Ghirardi ML. Comparativeenergy life-cycle analyses of microalgal biomass production in open pondsand photobioreactors. Bioresour Technol 2010;101:1406–13.
[89] Clean Energy Council. Australian bioenergy roadmap: setting the direction forbiomass in stationary energy to 2020 and beyond: Clean Energy Council;2008.
[90] ABARES. Australia’s forest at a glance 2012. In: Department of Agriculture FaF,editor. Canberra; 2012.
[91] Borowitzka MA, Boruff BJ, Moheimani NR, Pauli N, Cao Y, Smith H. Identifica-tion of the optimum sites for industrial-scale microalgae biofuel production inwa using a gis model. Final report. Murdoch, WA: Murdoch University andUniversity of Western Australia; 2012.
[92] Australian bureau of Meteorology. Global Solar Exposure (MJ/m2). NationalClimate Centre: Australian Government 2014.
[93] Demirbas F. Biofuels from algae for sustainable development. Applied Energy2011:3473–80.
[94] Klein-Marcuschamer D, Turner C, Allen M, Gray P, Dietzgen GR, Hankamer B.Technoeconomic analysis of renewable aviation fuel from microalgae, Ponga-mia pinnata, and sugarcane. Biofpr_ Modeling and Analysis 2013:1–13.
J. Kosinkova et al. / Renewable and Sustainable Energy Reviews 49 (2015) 1271–1285 1285