ARTICLE - rsc.org · ... the LSF and BSD sample was cut and removed from the FIB system for...
17
Journal Name ARTICLE This journal is © The Royal Society of Chemistry 20xx J. Name ., 2013, 00 , 1-3 | 1 Please do not adjust margins Please do not adjust margins Bushy Sphere Dendrite with Husk-shaped Branches Axially Spreading out from Its Core for Photo-catalytic Oxidation/ Remediation of Toxins Mohamed A. Shenashen, a Satoshi Kawada, a Mahmoud M. Selim, b Wafaa M. Morsy, a Hitoshi Yamaguchi, a Abdulaziz A. Alhamid, c,d Naoki Ohashi, e Izumi Ichinose, e and Sherif A. El-Safty a,f, * a. National Institute for Materials Science (NIMS), Research Center for Strategic Materials, 1-2-1 Sengen, Tsukuba-shi, Ibaraki-ken, 305-0047, Japan. b. Department of Mathematics, Al-Aflaj College of Science and Human Studies, Prince Sattam Bin Abdulaziz University, Al-Aflaj 710-11912, Saudi Arabia c. Prince Sattam Bin Abdulaziz University, P. O. Box 173, Al-Kharj 11942, Saudi Arabia. d. Civil engineering department, College of Engineering, King Saud University, P.O. Box 800, Riyadh 11421 , Saudi Arabia. e. Research Center for Functional Materials, National Institute for Materials Science, 1-1 Namiki, Tsukuba, Ibaraki, 305- 0044, Japan. f. Graduate School of Advanced Science and Engineering, Waseda University, 3-4-1 Okubo, Shinjuku-Ku, Tokyo, 169- 8555, Japan. TEL: +81-29-859-2135; FAX: +81-29-859-2501 E-mail: [email protected]; [email protected] http://www.nims.go.jp/waseda/en/labo.html LSF and BSD Characterization analyses The morphologies of the LSF and BSD samples were investigated via field emission scanning electron microscopy (FE- SEM, JEOL model 6500). The scanning electron microscope was operated at 15 keV in order to record better SEM micrographs. A focused ion beam (FIB) system (JEM-9320FIB) operated at accelerating voltages from 5–30 kV with variable steps of 5 kV and magnification ranging from 150× to 300000×. The orientation axis (X and Y) of the powder samples containing LSF and BSD catalysts can be changed within ±1.2 mm through a tilt angle of ± 60°. The samples were inserted inside the FIB machine using a bulk-sample holder (8 × 8 mm 2 ) after deposition by a carbon protection layer. Before FIB investigation, the powder samples of the LSF and BSD catalysts were mixed with small amounts of epoxy (Gatan, Inc.) onto a small silicon wafer using a fine eyelash probe to form very thin films on the silicon substrate. Each thin film was baked on a hot plate at 130 °C for 10 min and subsequently coated with a uniformly thin carbon layer of about 30 nm. The samples were inserted into the FIB microscope operated at 30 kV and then roughly milled on both sides until a final thickness of 2 μm using −1.5° and +1.5° tilts. Afterward, the LSF and BSD sample was cut and removed from the FIB system for subsequent HAADF–STEM microscopy. HAADF-STEM was employed to perform (i) TEM and (ii) STEM, (iii) EDS for elemental mapping, and (iv) electron diffraction (ED). The HAADF–STEM micrographs were recorded using a JEM-ARM200F-G instrument supplied with aberration correctors at the illumination and imaging lens systems to observe TEM/STEM images at high resolution. The HAADF–STEM microscope Electronic Supplementary Material (ESI) for Nanoscale. This journal is © The Royal Society of Chemistry 2017
Transcript of ARTICLE - rsc.org · ... the LSF and BSD sample was cut and removed from the FIB system for...

Journal Name
ARTICLE
This journal is © The Royal Society of Chemistry 20xx J. Name., 2013, 00, 1-3 | 1
Please do not adjust margins
Please do not adjust margins
Bushy Sphere Dendrite with Husk-shaped Branches Axially Spreading out from Its Core for Photo-catalytic Oxidation/ Remediation of Toxins
Mohamed A. Shenashen,a Satoshi Kawada,a Mahmoud M. Selim, b Wafaa M. Morsy, a Hitoshi Yamaguchi, a Abdulaziz A. Alhamid,c,d Naoki Ohashi, e Izumi Ichinose,e and Sherif A. El-Safty a,f,*
a. National Institute for Materials Science (NIMS), Research Center for Strategic Materials, 1-2-1 Sengen, Tsukuba-shi, Ibaraki-ken, 305-0047, Japan.b. Department of Mathematics, Al-Aflaj College of Science and Human Studies, Prince Sattam Bin Abdulaziz University, Al-Aflaj 710-11912, Saudi Arabiac. Prince Sattam Bin Abdulaziz University, P. O. Box 173, Al-Kharj 11942, Saudi Arabia.d. Civil engineering department, College of Engineering, King Saud University, P.O. Box 800, Riyadh 11421 , Saudi Arabia.e. Research Center for Functional Materials, National Institute for Materials Science, 1-1 Namiki, Tsukuba, Ibaraki, 305-0044, Japan.f. Graduate School of Advanced Science and Engineering, Waseda University, 3-4-1 Okubo, Shinjuku-Ku, Tokyo, 169-8555, Japan.TEL: +81-29-859-2135; FAX: +81-29-859-2501E-mail: [email protected]; [email protected]://www.nims.go.jp/waseda/en/labo.html
LSF and BSD Characterization analyses
The morphologies of the LSF and BSD samples were investigated via field emission scanning electron microscopy (FE-
SEM, JEOL model 6500). The scanning electron microscope was operated at 15 keV in order to record better SEM
micrographs.
A focused ion beam (FIB) system (JEM-9320FIB) operated at accelerating voltages from 5–30 kV with variable steps of 5 kV
and magnification ranging from 150× to 300000×. The orientation axis (X and Y) of the powder samples containing LSF and
BSD catalysts can be changed within ±1.2 mm through a tilt angle of ± 60°. The samples were inserted inside the FIB machine
using a bulk-sample holder (8 × 8 mm2) after deposition by a carbon protection layer. Before FIB investigation, the powder
samples of the LSF and BSD catalysts were mixed with small amounts of epoxy (Gatan, Inc.) onto a small silicon wafer using a
fine eyelash probe to form very thin films on the silicon substrate. Each thin film was baked on a hot plate at 130 °C for 10
min and subsequently coated with a uniformly thin carbon layer of about 30 nm. The samples were inserted into the FIB
microscope operated at 30 kV and then roughly milled on both sides until a final thickness of 2 μm using −1.5° and +1.5° tilts.
Afterward, the LSF and BSD sample was cut and removed from the FIB system for subsequent HAADF–STEM microscopy.
HAADF-STEM was employed to perform (i) TEM and (ii) STEM, (iii) EDS for elemental mapping, and (iv) electron diffraction
(ED). The HAADF–STEM micrographs were recorded using a JEM-ARM200F-G instrument supplied with aberration correctors
at the illumination and imaging lens systems to observe TEM/STEM images at high resolution. The HAADF–STEM microscope
Electronic Supplementary Material (ESI) for Nanoscale.This journal is © The Royal Society of Chemistry 2017

ARTICLE Journal Name
2 | J. Name., 2012, 00, 1-3 This journal is © The Royal Society of Chemistry 20xx
Please do not adjust margins
Please do not adjust margins
was also equipped with a monochromated electron gun and supported by electron energy-loss spectroscopy at a high-energy
resolution. Specifically, the cross-section specimens for HAADF–STEM was prepared by FIB system milling. The fine trapped
probes typically sharpened the sample in the parallel direction of the longitudinal c-axis. The well-prepared FIB samples were
attached to a silver grid by epoxy materials using a pick-up system. The LSF and BSD attached to the silver grid was inserted
again into the FIB system to produce a 100 nm-thick layer. The sample was thinned from both sides by using alternate beams
with variable intensity until the final thickness of 100 nm. The 100 nm sample was viewed under the HAADF–STEM
microscope to record the cross-sectional images.
Wide-angle powder X-ray diffraction (XRD) patterns were measured using an 18 kW diffractometer (Bruker D8
Advance) with monochromatic Cu Kα radiation. The sample measurement was repeated three times under rotation at
various angles (15 ͦ, 30 and 45 ͦ). The diffraction data were analyzed using the DIFRAC plus Evaluation Package (EVA) software
with the PDF-2 Release 2009 databases provided by Bruker AXS. The standard diffraction data were identified according to
the databases of the International Centre for Diffraction Data (ICDD). For poor quality diffraction data, the TOPAS package
program provided by Bruker AXS 2009 for profile and structure analysis was applied to integrate various types of X-ray
diffraction analyses by supporting all profile fit methods currently employed in powder diffractometry.
X-ray photoelectron spectroscopy (XPS) analysis was conducted on a PHI Quantera SXM (ULVAC-PHI) instrument
(Perkin–Elmer Co., USA) equipped with Al Kα as an X-ray source for excitation (1.5 mm × 0.1 mm, 15 kV, 50 W) under a
pressure of 4 × 10⁻⁸ Pa. A thin film of the sample was deposited on a Si slide before the start of analysis.
The textural surface properties of the LSF and BSD including the specific surface area and the pore structure were
determined by N2 adsorption–desorption isotherms which were measured using a BELSORP MIN-II analyzer (JP. BEL Co. Ltd)
at 77 K. Prior to the N2 adsorption/desorption process, the samples were pre-treated at 200 C for 8 h under vacuum until the
pressure was equilibrated to 10-3 Torr. Specific surface area (SBET) was calculated using multi-point adsorption data from
linear segment of the N2 adsorption isotherms using Brunauer–Emmett–Teller (BET) theory. The pore size distribution was
determined from the analysis of desorption branch of isotherm using the nonlocal density functional theory (NLDFT).
Thermogravimetric and differential thermal analyses (TG and DTA, respectively) were measured using a simultaneous DTA-
TG Apparatus TG-60 (Shimadzu, Japan).
Raman spectroscopy (HR Micro Raman spectrometer, Horiba, Jobin Yvon) was conducted using an Ar ion laser at 633 nm. A
CCD (charge coupled device) camera detection system and the LabSpec-3.01C software package were used for data
acquisition and analysis, respectively. To ensure the accuracy and precision of the Raman spectra, 10 scans of 5 s from 300
cm−1 to 1,600 cm−1 were recorded.
The photo-oxidation, and -induced recovery processes of LSF and BSD were performed by using UV light and visible light
sources (UV Lamp SLUV-6, T.HIROTA 100v, 50/60Hz, and of 254 and 365 nm) and (High pressure sodium (HPS) lamp,
Philips Master SDW-T 100W, with wavelength range of 420-700 nm), respectively.
Energy Dispersive X-ray microanalysis (EDX-130S) was used to determine the elemental compositions of the LSF and BSD
catalysts. The arsenite/arsenate anion concentrations were determined using a Perkin Elmer Elan-6000 ICP-MS.

Journal Name ARTICLE
This journal is © The Royal Society of Chemistry 20xx J. Name., 2013, 00, 1-3 | 3
Please do not adjust margins
Please do not adjust margins
Photo-electrochemical measurements were recorded by a Zennium/ZAHNER-Elektrik instrument controlled by Thales Z 2.0
software. The cell device was designated with a conventional three-electrode systems under front side illumination of UV
light (190 nm to 400 nm) containing, Ag/AgCl (3 M NaCl) as reference electrode, Pt (platinum) wire as counter electrode and
a working electrode, respectively. A constant potential of 0.5 V (vs. saturated Ag/ AgCl) was applied to measure transient
photocurrent spectrum by using a mixture of 0.24 M Na2S and 0.35 M Na2SO3 as an electrolyte. The cell device including the
LSF and BSD catalysts was connected to an Avantes system of Ava-light-DHS deuterium-halogen light sources, which exhibit
standard wide-range bands of deep UV deuterium (190 nm to 400 nm), deuterium lamp (215 nm to 400 nm), and halogen
lamp (360 nm to 1500 nm). An Ava-Spec Avantes Fiber Optic spectrometer system (Avantes CIMPS-Abs-UV Ava-spec-
2048x14) was used as a detector to determine the amplifying signal of the photocurrents.
DFT is a promising approach to effectively illustrate the electronic correlation effects. In this study, all calculations
investigated by DFT were performed in accordance with the DMol3 of BIOVIA Dassault systems.[1,2] The exchange-correlation
energy function was represented by the Perdew–Burke–Ernzerhof (PBE) formalism. [3] The Kohn–Sham equation was
expanded in a double numeric quality basis set (DNP) with polarization functions. To consider the relativistic effect, the DFT
Semi-core Pseudo-potentials [4] were used for the treatment of the core electrons of the doped clusters. The orbital cutoff
range and Fermi smearing were selected as 5.0 Å and 0.001 Ha, respectively. The self-consistent-field (SCF) procedures were
performed to obtain well-converged geometrical and electronic structures at a convergence criterion of 10−6 a.u. The energy,
maximum force, and maximum displacement convergence were set to 10−6 Ha, 0.002 Ha/Å, and 0.005 Å, respectively.
Meanwhile, the electrostatic site potential is a measure of the Coulomb interaction per unit charge experienced by an ion at
a given position in space. DFT was also used to calculate the electrostatic potential (ESP) distribution. Modeling was
performed to show a physical quantitative survey at each point on the isosurfaces using a feature of the surface-charging
map. Typically, the isosurfaces of the electron densities were colored on the basis of ESP intensities (ESPI) using a lattice
representation in which the charges are mapped on the cubic lattice in the so called contour where the ESP is calculated. The
slab model was constructed with nine atomic layers of each catalyst. To compare the active center within the structure,
oxygen atoms at the surface and subsurface layers were involved in the stoichiometric mode. EP was investigated over the
range of −0.06 eV to +0.6 eV as shown in the optimized model.
Hierarchal structure stability and crystal morphology
The thermal stability of hierarchal morphology and crystal structures of microscopic-sphere dendrite particles was evident
from thermogravimetry (TG)–differential thermal analysis (DTA) data and wide-angle powder X-ray diffraction (WA-XRD)
profiles (Figures S1A, S1B). The BSD showed thermos-structural stability up to 500 °C, as revealed by TG/DTA analysis (Figure
3A). The WA-XRD profiles of the LSF and BSD (Figure S1B) show the characteristic diffraction peaks of face-centered cubic NiO
crystals (JCPDS no. 01-089-5881) symmetry with the lattice constant a= 8.35 Ǻ. The high-temperature treatment leads to
form well-dispersed 100 nm-poly-CN droplet-seeded bumps along microscopic-sphere dendrite particles, as shown from the
formation of graphitic diffraction peak at 2θ/o of 24.61. in addition, it represented well-resolved and distinctive diffraction
peaks, respectively, with (111), (200), (220), (311) and (222) planes and dspacing= 2.41 2.09, 1.47, 1.26, and 1.20 Ǻ associated
with NiO (see WA-XRD profile, Figure S1B). [5]
Hierarchically microscopic-sphere BSD and LSF morphologies were developed with uniformly spaced inner pores of micro-
meso- and macro-scale sizes (1.88-258nm) (N2 isotherms; Figure S1C, S1D). The heat-treatment of LSF and BSD moieties leads

ARTICLE Journal Name
4 | J. Name., 2012, 00, 1-3 This journal is © The Royal Society of Chemistry 20xx
Please do not adjust margins
Please do not adjust margins
to generate pore voids inside the core and shell due to dehydroxylation of Ni(OH)2 and delocalization of poly-CN seeds. In
addition, the specific surface area of the LSF and BSD catalysts are 82.3 and 80.4 m2/g, respectively. The N2 adsorption
isotherms showed steepness with no hysteresis loop at relative pressure levels (P/P0) of 0.3 and 0.95, thereby indicating the
formation of uniform mesopores and macropores. [6,7] These surface features enable the manipulate a multi-diffused and -
accessible meso-, and macro-windows to enhance the molecular dynamic diffusion of AsO33− species into converge Ni2+
surface along {110} crystal facet and to bind rapidly with interior active superoxide NiOOH sites during the photo-catalytic
surface reaction.
Figure S1 (A) TG–DTA curves measured for the BSD revealing the thermal feature and stability of hierarchical structures. (B) WAXRD pattern of the as synthesized Ni(OH)2 and calcined samples (LSF and BSD). (C) The N2 adsorption/desorption isotherms and (D) Pore size distribution analyzed by using NLDFT theory from the N2- adsorption curves of LSF and BSD. (C &D insert) Textural features, including the specific surface area (SBET, m2·g−1), pore size (D, nm), and pore volume Vp, cm3·g−1). Surface features and components of hierarchical LSF and BSD structures To elucidate the surface features and components of hierarchical BSD compare to LSF, we perform XPS measurements.
Figure S2 shows wide range XPS spectra (i.e., survey) of LSF and BSD and components. In addition, high-resolution XPS
spectra of the Ni 2p, O 1s, C 1s and N 1s peaks were shown in Figure S2 respectively. Figure S6-A shows the Ni 2p spectra with
main peaks centered at 872.3 and 854.3 eV assigned to Ni 2p1 and Ni 2p3 of Ni (II) ions, respectively. [8] The peaks of Ni 2p
and O 1s in the BSD undergo visible shifts to lower binding energy compared with pristine LSF (Figure S2 (B,C). High
resolution XPS spectra of the C 1s and N 1s peaks are shown in Figure S2 (D and E) to reveal the carbon source in hierarchical
BSD. Figure S2-E shows the N1s spectra with four main peaks centered at 398.22, 399.14, 400.4 and 402.6eV assigned to
pyridinic nitrogen (C=N), pyrrolic nitrogen (C-N), graphitic nitrogen and N-oxide of pyridinic nitrogen, respectively. The C 1s
spectra show strong peaks at 285.01, 285.8, 288.2 and 289.4 eV assigned to C-C (sp2), C-C (sp3), C=O and O-C=O bands,
respectively, indicating the conversion of poly- adenine to N-doped carbon after carbonization. [9] The presence of pyridinic
nitrogen results from the defects caused by N-doping may enable analyte to penetrate more rapidly and boost the shuttling
of ions at the electrode-electrolyte interface.
Journal Name ARTICLE
This journal is © The Royal Society of Chemistry 20xx J. Name., 2013, 00, 1-3 | 5
Please do not adjust margins
Please do not adjust margins
Figure S2 (A) Complete survey of XPS spectrum of BSD, showing the existence of C1s and N 1s distinctive peaks. High resolution spectra of the Ni2p (B) and O1s peak (C) showing a binding energy shift because of LSF and C interaction. High resolution C1s scan (D) and N1s scan (E) deconvoluted into four influential peaks.
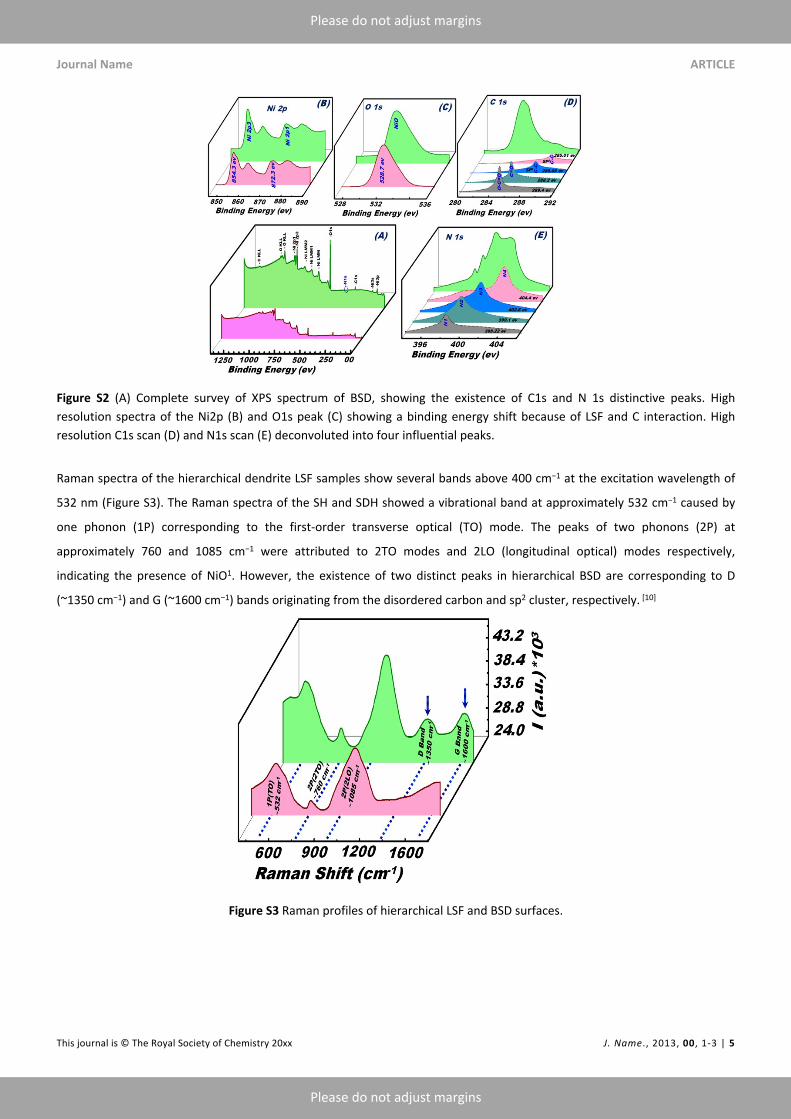
Raman spectra of the hierarchical dendrite LSF samples show several bands above 400 cm−1 at the excitation wavelength of
532 nm (Figure S3). The Raman spectra of the SH and SDH showed a vibrational band at approximately 532 cm−1 caused by
one phonon (1P) corresponding to the first-order transverse optical (TO) mode. The peaks of two phonons (2P) at
approximately 760 and 1085 cm−1 were attributed to 2TO modes and 2LO (longitudinal optical) modes respectively,
indicating the presence of NiO1. However, the existence of two distinct peaks in hierarchical BSD are corresponding to D
(~1350 cm−1) and G (~1600 cm−1) bands originating from the disordered carbon and sp2 cluster, respectively. [10]
Figure S3 Raman profiles of hierarchical LSF and BSD surfaces.

ARTICLE Journal Name
6 | J. Name., 2012, 00, 1-3 This journal is © The Royal Society of Chemistry 20xx
Please do not adjust margins
Please do not adjust margins
The Photo-trapping of AsO33− species as a function of pH
The photo-trapping of AsO33− (AsIII) anions as a function of pH was carried by using 200 mg of solid LSF and BSD catalysts and
at [2 mg/L] initial concentration of AsO33 – species, and 20oC (Figure S4). The photo-trapping results showed that the trapping
capacity efficiency of AsO33− anions onto the LSF and BSD catalysts has slightly difference in the pH range 2-7.5. However, the
maximum photo-trapping was obtained at pH 2. According the chemistry of arsenic species In aqueous solution, the arsenic
species may be exited in two anionic forms H2AsO4− and HAsO4
2– form dominates at pH 2~11 range.3eThe electrostatic
interactions of the BSD and LSF surface with the negatively H2AsO4–/HAsO4
2– species is strongly expected (scheme 2). Our
finding also indicates that the trapping capacity of AsO33− anions using BSD and LSF catalysts was drastically decreased at
higher pH values >> 8.4.
Figure S4 The pH-dependent photo-trapping of AsO33− anions as a function of pH at specific conditions of 200 mg of solid BSD
and LSF catalysts and at [2 mg/L] initial concentration of AsO33 – species, and 20oC
BSD structural stability under mechanical stirring
In this regard, the BSD structural stability under mechanical stirring as a function of pH solution changes was investigated
(Figure S5). The pH solution in the range of 1.0-11.5 was adjusted by HCl and NaOH solutions. The batch-stirring experiment
was carried out under simultaneously stirring of 0.5 g BSD dose, 100 ml volume at specific conditions of speed 400 rmp,
stirring time 3 days, and 20 oC. After a period of time, the solution was filtrated using a vacuum pressure of 0.02 MPa and the
released Ni2+ ions were verified by inductively coupled plasma mass spectrometry (ICP-MS). In general, Figure S5 shows
evidence of the negligible releasing of Ni2+ ion concentration from BSD surfaces even after vigorously mechanical stirring for
long period ≥ 3 days. The pH solution plays role in the control of the releasing amount of Ni2+ ions from BSD surface. At acidic
pH solution < 5, the released amount in part-per-billion range 0.44-8.5 was determined; however, this amount drastically
decreased to 0.1-0.3 in the pH range of 6.0- 12.0. Together, the ICP-MS analysis provided a clear evidence of retention of
chemical structures, elemental composition, and binding along the hierarchal BSD matrices under pH-dependent mechanical
stirring.

Journal Name ARTICLE
This journal is © The Royal Society of Chemistry 20xx J. Name., 2013, 00, 1-3 | 7
Please do not adjust margins
Please do not adjust margins
Figure S5. The releasing of Ni2+ ion concentration from BSD surface even after vigorously mechanical stirring for long period ≥ 3 days as a function of pH value, and at specific batch-stirring conditions of 0.5 g BSD, 100 ml volume at specific conditions of speed 400 rmp, and 20 oC. The released Ni2+ ions were verified by ICP-MS.
Effect of irradiation intensity of the photo-trapping tendency
The batch contact assay of the time-dependent trapping experiments of As(III)/As(V) species was carried out in aqueous
solution by exposing under UV and UV-vis radiation at λmax=365 nm and λmax ≥420 nm, respectively. The trapped As(V) species
was analysed by using ICP-MS analysis under experimental conditions of As (V) [2 mg/L], 25 oC, 40 mg dose of BSD, and in
200 mL volume of aqueous solution. The quantitative analysis showed that >99% and 40% of As(V) species were trapped into
BSD catalyst under UV and UV-vis radiation at λmax=365 nm and λmax ≥420 nm, respectively. The finding indicates the effective
trapping of As(V) under UV radiation region.
Photo-trapping (uptake) of AsO43− onto LSF and BSD surfaces
As shown in Figure S6 A, B, the uptake amount of (AsIII) (AsO43−) species was calculated based on the concentration changes
(Ci − Ct). Where the uptake% was calculated by using [100 × (Ci − Ct)/Ci], and the uptake capacity (qt or qe mg/g) was
estimated by using [V × (Ci − Ct)/m]. Where Ci and Ct are the concentration of the AsO43− species at initial and conducted time
“t”, respectively, qe or qt is the uptake capacity at equilibrium or at time t, respectively, V is the test solution volume in L, and
m is the catalyst mass in g. It can be shown that the BSD has higher capacity compared with LSF catalyst.
The results indicated that under the optimum conditions of the photocatalytic process the presence of poly-CN accelerated
the catalytic process and increasing the amount uptake (qt, mg/g) of the target species Figure (4). It means that the C-N over-
stoichiometry surfaces played a key role in the enhancement of the photo-catalytic process. To investigate the photo-
catalytic capability of BSD and LSF materials, the kinetic and thermodynamic properties were tasted Figure (S6 and S7). The
kinetic properties were investigated using Langmuir isotherm as a model to test the equilibrium adsorption of the target
species Figure (S6 and S7). [11, 12] The Langmuir isotherm of the AsO43− photo-trapping capacity using LSF and BSD was
calculated as follows: Ce/qe = 1/KLqm + Ce/qm, where qm and KL are the amounts trapped in relation to monolayer sorption
capacity (mg·g−1) and the Langmuir constant (L/mg), respectively (Figure S6C, D).

ARTICLE Journal Name
8 | J. Name., 2012, 00, 1-3 This journal is © The Royal Society of Chemistry 20xx
Please do not adjust margins
Please do not adjust margins
The linear form of Langmuir adsorption isotherm (Ce/qe vs. Ce) over the AsO33− concentration range of 0.02–250 mg/L was
investigated and shows the applicability of the Langmuir equation with high correlation coefficients (R2) 0.9995 to 0.9599
Figure (S6C). [13] The calculated qm values were in agreement with the experimental values of AsO33− species adsorption
capacity at equilibrium, that were found 56.78 mg/g and 53.47 mg/g for BSD and LSF, respectively. In addition the KL values
indicate the nature trapping of the AsO33− species into the BSD and LSF platforms. [14] The qm and KL values of the platform
catalysts for the AsO33− were calculated (Table S2).The Langmuir isothermal model was tested at different temperatures
ranging from 20 °C to 40 °C Figures (S6D, and S7B). The results presented high efficiency toward the target species compared
with other adsorbent (Table S4)
Figure S6 (A, B) time-response of photo-induced activity of LSF and BSD catalysts during the photo-oxidation of As(III) ions in terms of uptake% (trapping) (A) and amount of trapping (B) of AsO3
3− species from aqueous solution at specific conditions of 2 mg/L of [As(III)], catalyst dose 125 mg, solution volume (1L), and at 20oC, and under exposure of UV light irradiation at λ=365 nm. (C, D) The linear form of the Langmuir plots of photo-catalytic/trapping of AsO3
3− species as a function of catalysts type carried out at 20oC (C) and over the temperature range of 20–40oC (D), respectively, and under exposure of UV light irradiation at λ=365 nm.
Kinetic and thermodynamic studies of the trapping process during the oxidation reaction of AsO33− species
Moreover, the pseudo-first-order equation by Lagergren: [Ln (qe − qt) = Ln qe − ktt] was used to investigate the adsorption
kinetic rates of the target ions. Results (Table S1 and Figure S7A) show evidence that the pseudo-first order kinetics was
prescribed the photo-trapping process, as indicated from the values of the correlation coefficients (R2) in Table S1. The rate
constant (kt, min−1) and the equilibrium adsorption capacity (qe, mg/g) for AsO33− were estimated from the slopes and
intercepts of the pseudo-linear first-order kinetic equation (Figure S7A). Moreover, the effects of different temperatures on
the photo-trapping assay were determined (Figure S7B). The photo-trapping of As(V) species increases with increasing the
temperature (Figure S7B). The finding indicates that the increase in the temperature may enhance the ability of As(V)-to-BSD
interaction coverage.

Journal Name ARTICLE
This journal is © The Royal Society of Chemistry 20xx J. Name., 2013, 00, 1-3 | 9
Please do not adjust margins
Please do not adjust margins
Changes in thermodynamic parameters, including free energy (ΔG°), enthalpy (ΔH°), and standard entropy (ΔS°), of the
photo-oxidation/trapping process were estimated from the experiments performed at different temperatures by using the
following equations: ΔG° = −RT ln KL, and ln KL = ΔS°/R−ΔH°/RT, where is the universal gas constant (8.314 J/mol K), T is
temperature (K), and KL is the Langmuir constant. The Van’t Hoff model was used to calculate the thermodynamic
parameters for photocatalytic of the AsO33− species on BSD and LSF materials at 20 °C - 40 °C, where the values of ΔS° and
ΔH° were calculated from the slope and intercept, respectively, of the plot of ln KL versus 1/T yields (Figure S7D and Table S3).
The over-gaining of energy in the heterogeneous catalysts system might hinder the accessibility and molecular transport of
arsenite (AsO33−) from the bulk solution into the interior layers. [15] The positive values of ΔHo and ∆G° indicate the
endothermic nature and the extent of randomness along BSD solid/solution interfaces of AsO33− species, respectively, Table
S3. [13] Further, the negative values of ΔGo obtained in this study indicated the spontaneous nature of the photo-
oxidation/trapping process and the physical trapping is the predominant mechanism in the sorption process. [16]
The surface properties of the BSD platform after photo-trapping process of AsO33− species was investigated using N2
adsorption/desorption isotherms and elemental mapping, as shown in Figure S8. The N2 adsorption/desorption isotherms
show the steepness without hysteresis loop at relative pressure levels (P/P0) of 0.3 and 0.95, indicating the formation of
uniform meso- and macro-pores (Figure S8A). The results showed that the specific surface area and the pore size distribution
were decreased after photo-trapping process of arsenic species. This finding indicates the arsenic species trapped into the
interior pores of BSD catalyst platform. Moreover, the elemental mapping analysis of the BSD catalyst after photo-trapping
process of AsO33− species provides evidence of the presence of As ions trapped into the BSD catalyst (Figure S8B).
Figure S7. Determination of the integrated pseudo-first-order rate constant (A), temperature-dependent study (B), Langmuir adsorption isotherms (C) and the linear form of the van’t Hoff plot of photo-induced activity of LSF and BSD catalysts (D) during the photo-oxidation of As(III) ions in aqueous solution. The photo-catalytic oxidation reactions were carried out at 20oC (A,C) and over the temperature range of 20–40oC (B, D), respectively, [2 mg.L-1] of AsO3
3−, and catalyst amount of 125 mg.L-1, and under exposure of UV light irradiation at λ=365 nm.

ARTICLE Journal Name
10 | J. Name., 2012, 00, 1-3 This journal is © The Royal Society of Chemistry 20xx
Please do not adjust margins
Please do not adjust margins
Figure S8 (A) The N2 adsorption/desorption isotherms, (A insert) Textural features, including the specific surface area (SBET,
m2/g), pore size (D, nm), pore volume (Vp, cm3·g−1), and (D) Pore size distribution of BSD and BSD with As(III). (B) Elemental
mapping of BSD catalyst after capturing of As(III) species.
Table S1: The pseudo-first-order kinetics parameters of the photo-catalytic oxidation of AsO33− species in aqueous water
using LSF and BSD catalysts at specific conditions such as 2 mg.L-1 of [As(III)], catalyst dose 125 mg, solution volume (1L), and at different temperatures and under exposure of UV light irradiation at λ=365 nm.
CatalystsTemperature
oCR2
kt,
min-1
qe,
mg/g
BSD 20 0.9747 0.0605 19.60
LSF 20 0.9837 0.03216 17.58

Journal Name ARTICLE
This journal is © The Royal Society of Chemistry 20xx J. Name., 2013, 00, 1-3 | 11
Please do not adjust margins
Please do not adjust margins
Table S2: Langmuir isotherms of the trapping/capture of AsO33− species into interior and exterior surface matrices, entrance
meso-/micro-window sizes, and active {110} crystal site surfaces of LSF and BSD catalysts during the photo-catalytic oxidation
of AsO33− species in aqueous water at specific conditions such as catalyst dose 125 mg, solution volume (1L), and at different
temperatures and under exposure of UV light irradiation at λ=365 nm.
MaterialsTemperature
oC
qm
mg/g
KL
L/mg
40 53.47 1.545
30 48.9 1.65
25 45.12 1.02LSF
20 39.89 1.73
40 56.78 1.43
30 51.51 1.587
25 47.48 0.878BSD
20 41.41 1.86
Table S3: Thermodynamic parameters for AsO33− ions on LSF and BSD catalysts during the photo-catalytic oxidation of AsO3
3−
species in aqueous water at specific conditions such as catalyst dose 125 mg, solution volume (1L), and at different
temperatures and under exposure of UV light irradiation at λ=365 nm.
MaterialsTemperature
(K)
ΔHo
(kJ/mol)
ΔSo
(J/mol.K)
ΔGo
(kJ/mol)
293 -15.2446
298 -15.5057
303 -15.7668LSF
313
55.84 52.22
-16.289
BSD 293 46.71 49.48 -14.4509

ARTICLE Journal Name
12 | J. Name., 2012, 00, 1-3 This journal is © The Royal Society of Chemistry 20xx
Please do not adjust margins
Please do not adjust margins
298 -14.6983
303 -14.9457
313 -15.4405
Table S4. Comparison of the adsorption capacity of arsenic species (qm/mg·g−1) by LSF and BSD catalysts during the photo-oxidation of As(III) ions with some reported sorbent materials under specific experimental assays
adsorbent qm / (mg·g−1) Ref.
Hematite 10.0 17)
Iron(III)-loaded LDA 62.9 18)
Zr-LDA chelating resin 88.7 19)
Fe(III)-loaded cellulose 18 20)
Fe–Mn binary oxide 119 21)
Fe3O4–graphene oxide composite (M-GO) 42.9 22)
Fe3O4-reduced graphene oxide composite (M-rGO), 29.8 23)
Zr(IV)-loaded orange waste 130 24)
GN-α-FeOOH aerogel 13.42 25)
Fe3O4:MnO2 1.99-2.2 26)
Fe–Zr binary oxide 120.0 27)
Fe–Mn binary oxide 132.7 28)
Nano-Fe(III)–Ti(IV) mixed oxide 85.0 29)
Nano-Fe(III)–Zr(IV)mixed oxide 64.5–66.5 30)
Nano-TiO2 59.9 31)
Al2O3/Fe(OH)3 9.0 32)
NZVI/AC 18.19 33)
CuO nanoparticles 26.9 34)
TiO2 5.52 35)
Fe/TiO2 6.17- 8.61 36)
Magnetite nanoparticles (MNPs) 15.88-17 37)
iron oxidemultiwalled carbon nanotube (Fe-MWCNT) hybrid 1.723 38)
cotton-candy-like CuO 12.9 39)
CuO nanoparticles 1.4 40)

Journal Name ARTICLE
This journal is © The Royal Society of Chemistry 20xx J. Name., 2013, 00, 1-3 | 13
Please do not adjust margins
Please do not adjust margins
activated alumina 0.1803 41)
Fe3O4−RGO−MnO2 14.04 42)
LSF 53.47 Current Study
BSD 56.78 Current Study
Reproducibility and Structure stability of catalysts under irradiation during multiple reuse/cycles
The reproducibility and Structure stability of BSD catalysts under irradiation during multiple reuse/cycles was investigated
using the FE-SEM and EDX and elemental mapping of BSD catalyst after 20 times of continue irritation under the electron
beams at λ=365 nm during AsO33- trapping/de-trapping (reuse/cycles) process (Figure S9). The FE-SEM cross-section
micrograph results, the corresponding elemental mapping and EDX spectrum of {110}- BSD sphere catalyst represented clear
evidence about the stability. In addition, the analysed values of atomic abundance of O, Ni, N, and C species that composed
BSD catalyst attained their homogeneous distribution and composition after reuse cycles.
Figure S9: (A) Representative HFSEM cross-section micrograph, and the corresponding (B) elemental mapping and (C) EDX spectrum of {110}-BSD catalyst. Inserts (B) are the analysed values of atomic abundance of O, Ni, N, and C species that

ARTICLE Journal Name
14 | J. Name., 2012, 00, 1-3 This journal is © The Royal Society of Chemistry 20xx
Please do not adjust margins
Please do not adjust margins
composed BSD catalyst after 20 times of continue irritation during trapping/de-trapping (reuse/cycles) process under exposure of UV light at λ=365 nm. The stability of internal structure, intense vases and caves covered the surface grooves, accumulated set composition of actively surface sites, and neatly branched tree-like chains are evident, despite the distortion in the mat-like tangle surface patterns (A-C).
Mechanistic oxidation reaction of arsenic (AsIII–AsIV–AsV) species onto BSD catalysts
The arsenic species mainly existed in different active forms AsO33−, HAsO3
−, HAsO42−, H2AsO4
−, and AsO43− in aqueous solution.
The free –OH in the O-As-OH species (Figure 3) may enhance the electron surface movement and mobility, leading to the
strong As(III)-to-BSD binding and high surface coverage around the actively electronic clouds or {110}-Ni2+ -top-site surface
during the reaction process (trapping). Under UV-light irradiation of {110}-BSD catalysts, several key steps may control the
oxidation reaction sequences of (AsIII–AsIV–AsV) species (Scheme 2) as follows:
1. The formed VB h+ and hydroxyl HO. radical on VB-{110}-NiO crystal active sites have oxidation potential to oxidize the
mono- or bi-dentate-O- surface interaction of AsO33− (AsIII) reactant species to HAsO3
− (AsIV) anions and formation of
active Ni-oxyhydroxide (NiOOH) or Ni-hydroxide Ni(OH)2 forms along {110} surface site plane formed on the designed
catalyst surface.
2. The hydroxyl HO. radical of photo-induced product might oxidize the HAsO3− (AsIV) bi-dentate-O-to-Ni2+ surface and form
a single monolayer H2AsO4− (AsV) species on the exposed CB-{110}-Ni2+ site of super-O-O-hydroxide surfaces along both
top and inter-layer crystals of BSD catalysts.
3. The actively formed O2.−/HO2
. superoxide oxidants (active-CB e−) may lead to form a uniform assembly of H2AsO4− (AsV)
mono-dentate-O-to-Ni2+ site onto CB-{110}-Ni-OH surfaces through the oxidation of HAsO42− (AsV) bi-dentate-O-to-Ni2+-
O-OH surfaces.
Figures 3 and 4 indicate that the key values of the homogenous distribution of 100 nm poly-CN bumps as sphere husk along
the neat branches of BSD surface lead to the following:
1. Decrease in energy band gap of BSD (3.25 eV) and then prevention of the recombination of photo-generated h+/e− in the
valence and conductance bands (VB, and CB, respectively),
2. Facilitation of the effective charge separation and interfacial electron transfer into the coverage surfaces,
3. Boost of the facile and simultaneous photons to produce reactive VB h+/HO. radical and O2.−/HO2
. superoxide oxidants,
4. Influenced excited states energy levels by minimizing the high surface energy and binding/trapping energies of {110}-NiO
surface facet, and
5. Enhancement of the number of surface dangling bonds and facilitation of the interaction of arsenic reactant species.
Scheme 2 shows that the photo-detrapping process onto BSD leads to the creation of a system for toxic waste management
of extremely toxic arsenic (AsIII–AsIV–AsV) species through ecofriendly control process, reduced volume of solid-waste BSD
catalysts due to the reusability, and water-free toxicants even at low level of contraction.

Journal Name ARTICLE
This journal is © The Royal Society of Chemistry 20xx J. Name., 2013, 00, 1-3 | 15
Please do not adjust margins
Please do not adjust margins
Selective photo-removal of AsO33− species under visible light
Table 1 Selective photo-removal of AsO33− species under visible light from real water samples (tap, lake and underground
waters) using BSD catalyst/trapper. The samples were spiked with different AsO33− concentrations 20 and 200 μg/L with a
constant BSD dosage of 2 g/L, contact time 12 hr, and at 20 oC.
Ground waterAs(III) spikedμg/L
Found Uptake %
20
18.74±0.013 93.7
200
Mg+2 :5.975; Ca+2 : 19.005; Na+: 20.520; K+: 8.597; Li+: 0.035; Sr+2: 0.014; Cd2+: 0.007; Zn+2:0.001; Pb+2: 0.005; Fe+2: 0.120; Mn+2: 0.02; Ni+2: 0.0064; Ni+2: 0.045; Fe+3: 0.0321; Al+3: 0.023, Cl-: 15.120, Br- :2.984; SO4
-2 : 4.992; NO3
- : 2.764; SeO32−: 0.82; PO4
-3: 5.231; SO32− :
0.0750; CrO4-2 : 0.086; NO2
- : 0.120; F−: 0.0720; I-: 0.4329
190.4±0.04 95.2
Lake water
2019.08±0.02 95.4
200
Na+: 23.890; K+: 5.3; Mg+2: 4.9; Ca+2 : 19.005; Li+: 0.035; Cl-: 15.120, Br- :2.984; SO4
-2 : 4.992; NO3- :
2.764; SeO32−: 0.82; PO4
-3: 5.231; SO32− : 0.0750; CrO4
-2 : 0.086; NO2
- : 0.120; F−: 0.0720; I-: 0.4329Sr+2: 0.014; Zn+2:0.001; Pb+2: 0.005; Fe+2: 0.120; Mn+2: 0.02; Ni+2: 0.0064; Ni+2: 0.045; Fe+3: 0.0321; Al+3: 0.023, 192.2±0.014 96.1
Tap water
20Mg+2 :1.95; Ca+2 : 3.005; Na+: 15.520; K+: 0.597; Li+: 0.035; Sr+2: 0.001; Zn+2:0.001; Pb+2: 0.0001; Fe+2: 0.001; Mn+2: 0.002; Ni+2: 0.0064; Ni+2: 0.009; Fe+3: 0.0021; Al+3: 0.009, Cl-: 12.120, Br- :0.007; SO4
-2 : 0.992; NO3
- : 0.007; PO4-3: 1.231; SO3
2− : 0.0750; CrO4-2 : 0.006;
NO2- : 0.0020
18.96±0.005 94.8

ARTICLE Journal Name
16 | J. Name., 2012, 00, 1-3 This journal is © The Royal Society of Chemistry 20xx
Please do not adjust margins
Please do not adjust margins
200193.6±0.021 96.8
Three-types of competitive ions of minerals (mg/L), heavy metals (μg/L) and anions (μg/L). The underground and tap water
samples were provided from Al-Kharj, and Riyadh, KSA. The lake water sample was provided from Tuskuba, Japan.
Supporting Information References:
1) B. Delley, J. Chem. Phys. 1990, 92, 508.
2) B. Delley, J. Chem. Phys. 2000, 113, 7756.
3) J.P. Perdew, K. Burke, M. Ernzerhof, Physical Review Letters1996, 77, 3865.
4) B. Delley, Phys. Rev. B 2002, 66, 155125.
5) a) S.A. El-Safty, Y. Kiyozumi, T. Hanaoka, F. Muzukami, Appl. Catal. A: General. 2008, 337, 121-129; b) M. Khairy, S.A. El-
Safty, Curr. Catal., 2013, 2, 17-26. c) S.A. El-Safty, Y. Kiyozumi, T. Hanaoka, F. Muzukami, Appl. Catal. B: Envir. 2008, 82(3-
4):169-179.
6) a) S. A. El-Safty, M. A. Shenashen, M. Khairy, M. Ismeal, Adv. Funct. Mater. 2012, 22, 3013–3021. b) SA El-Safty, Y
Kiyozumi, T Hanaoka, F Mizukami, J. Phys. Chem. C, 2008, 112 (14), 5476-5489. c) S. A. El-Safty, F. Mizukami, T. Hanaoka,
J. Phys. Chem. B. 2005, 109 (19), 9255-9264.
7) a) M. Shenashen,, S. A. El-Safty, E. A. Elshehy, J. Hazard. Mater. ,2013, 260, 833– 843.b) S. A. EL-Safty, A. Abdelllatef, M.
Ismeal, A. Shahat, Adv. Healthcare Mater. ,2013, 2, 854- 862.c) M. Khairy, S.A. El_Safty, M. Ismael, H. Kawarada, Appl.
Catal. B: Envir., 2012, 123– 124, 162– 173. d) M. Khairy, S. A. El_Safty, M. Ismael, H. Kawarada, Appl. Catal. B: Envir.,
2012, 127, 1-10.
8) S.A. El-Safty, Y. Kiyozumi, T. Hanaoka, F. Muzukami, Appl. Catal. B: Envir. ,2008, 82(3-4):169-179.
9) S. Y. Kim, H. M. Jeong, J. H. Kwon, I. W. Ock, W. H. Suh, G. D. Stucky, J. K. Kang, Energy Environ. Sci., 2015, 8(1), 188-194.
10) W. Liu, Y. Feng, X. Yan, J. Chen, Q. Xue, Adv. Funct. Mater.,2013, 23(33), 4111-4122.
11) a) C. Chang, C. Chang, K. Hsu, W. Höll, P. Chiang, Environ. Eng. Manage. , 2007, 17(5), 311-318; b) J. A. Salam, A. Das,
Inter. J. of Pharm. and Pharmaceut. Sci. ,2013, 5(3), 814-816.c) J. M. Salman, J. Chem. 2013, 1-5. d) S. Dutta, S. N.
Chaudhuri, 2012, 3, 107-111.
12) a) J. A. Lewis, J. Am. Ceram. Soc. 2000, 83, 2341–2359. b) S. A. El-Safty, J. Colloids Interface Sci. ,2003, 260, 184-194.
13) a) A. Delle-Site, A review. J. Physical. Chem. 2001, 30, 187-438. b) V. Addorisio, D. Pirozzi, S. Esposito, F. Sannino, J.
Hazard. Mater. 2011, 196, 242–247.

Journal Name ARTICLE
This journal is © The Royal Society of Chemistry 20xx J. Name., 2013, 00, 1-3 | 17
Please do not adjust margins
Please do not adjust margins
14) S. A. El-Safty, M. A. Shenashen, M. Khairy, M. Ismeal, Adv. Funct. Mater.,2012, 22, 3013–3021
15) a) A. Derbalah, S. A. El-Safty, M. A. Shenashen, N. El-Manakhly, ChemPlusChem 2015,DOI: cplu.201500098R1. b) G. Yang,
Y. Zhao, X. Lu, X. Gao, Physicochem. Eng. Aspects ,2005, 264, 179-186.
16) Horsfall, M. Spiff, A.I. Abia, A.A. Bull. Korean Chem. Soc., 2004, 25, 969–976.
17) G. Javier, M. Maria, P. Joan de, R. Miquel, D. Lara, J. Hazard. Mater. 2007,141, 575–580
18) H. Matsunaga, T. Yokoyama, R.J. Eldridge, B.A. Bolto, React. Funct. Polym. 1996,29,167–174.,
19) T. Balaji, T. Yokoyama, H. Matsunaga, Chemosphere 2005,59, 1169–1174
20) J.A. Munoz, A. Gonzalo, M. Valiente, Environ. Sci. Technol. 2002,36, 3405–3411.
21) G. Zhang, J. Qu, H. Liu, R. Liu, R. Wu, Water research, 2007,41, 1 92 1 – 1 92 8
22) Y. Yoon, W. K. Park , Tae-M. Hwang, D. H. Yoon, W. S. Yang, J-W. Kang, Journal of Hazardous Materials 2016,304,196–
204,
23) Y. Yoon, W. K. Park , Tae-M. Hwang, D. H. Yoon, W. S. Yang, J-W. Kang, Journal of Hazardous Materials 2016, 304,196–
204,
24) B.K. Biswas, J.I. Inoue, K. Inoue, K.N. Ghimire, H. Harada, K. Ohto, H. Kawakita, J. Hazard. Mater. 2008,154, 1066–1074
25) I. Andjelkovic, D. N. H. Tran, S. Kabiri, S. Azari, M. Markovic, D. Losic, ACS Appl. Mater. Interfaces 2015, 7, 9758−9766
26) J. Zhu, S. A.Baig, T. Sheng, Z. Lou, Z. Wang, X. Xu, Journal of Hazardous Materials 2015, 286, 220–228
27) Z. Ren, G. Zhang, J. P. Chen, Journal of Colloid and Interface Science 2011,358, 230–237
28) G.S. Zhang, J.H. Qu, H.J. Liu, R.P. Liu, R.C. Wu, Water Res. 2007,41, 1921–1928.,
29) K. Gupta, U.C. Ghosh, J. Hazard. Mater. 2009,161, 884–892
30) K. Gupta, K. Biswas, U.C. Ghosh, Ind. Eng. Chem. Res. 2008,47, 9903–9912,
31) M.E. Pena, G.P. Korfiatis, M. Patel, L. Lippicott, X.G. Meng, Water Res. 2005,39, ()2327–2337,
32) J. Hlavay, K. Polyák, J. Colloid Interface Sci. 2005, 284,71–77,
33) H. Zhu, Y. Jia, X. Wu, He Wang, Journal of Hazardous Materials 2009,172, 1591–1596
34) Carol A. Martinson, K.J. Reddy, Journal of Colloid and Interface Science 2009,336, 406–411
35) I. Andjelkovic, D. Stankovic, J. Nesic, J. Krstic, P. Vulic, D. Manojlovic,∥ and G. Roglic, Ind. Eng. Chem. Res. 2014, 53,
10841−10848
36) I. Andjelkovic, D. Stankovic, J. Nesic, J. Krstic, P. Vulic, D. Manojlovic,∥ and G. Roglic, Ind. Eng. Chem. Res. 2014, 53,
10841−10848
37) C-H. Liu, Y-H. Chuang, T-Y. Chen, Y. Tian, H. Li, M-K. Wang, W. Zhang, Environ. Sci. Technol. 2015, 49, 7726−7734
38) S. A. Ntim, S. Mitra, J. Chem. Eng. Data 2011, 56, 2077–2083
39) X-Y. Yu, R-X. Xu, C. Gao, T. Luo, Y. Jia, J-H. Liu, X-J. Huang, ACS Appl. Mater. Interfaces 2012, 4, 1954−1962
40) A. M. Cao, J. D. Monnell, C. Matranga, J. M. Wu, L. L. Cao, D. J. Gao, Phys. Chem. C 2007, 111, 18624.
41) T. S. Singh, K.K. Pant, Separation and Purification Technology 2004,36, 139–147
42) X. Luo, C. Wang, S. Luo, R. Dong, X. Tu, G. Zeng, Chem. Eng. J. 2012, 187, 45−52.